Article

Relationship between Expression of Chalcone Synthase Genes and Chromones in Artificial Agarwood induced by Formic Acid Stimulation Combined with Fusarium sp. A2 Inoculation

1
State Key Laboratory of Applied Microbiology Southern China, Guangdong Provincial Key Laboratory of Microbial Culture Collection and Application, Guangdong Open Laboratory of Applied Microbiology, Guangdong Institute of Microbiology, Guangzhou 510070, China
2
School of Pharmacy, Guangdong Pharmaceutical University, Guangzhou 510006, China
3
Sirio Pharma Co., Ltd., Shantou 515041, China
*
Authors to whom correspondence should be addressed.
Molecules 2017, 22(5), 686; https://doi.org/10.3390/molecules22050686
Submission received: 12 March 2017 / Revised: 16 April 2017 / Accepted: 21 April 2017 / Published: 25 April 2017

Abstract

:
Agarwood (gaharu) is a fragrant resin produced in the heartwood of resinous Gyrinops and Aquilaria species. Artificial agarwood samples were obtained from Aquilaria sinensis (Lour.) Gilg using formic acid (FA) stimulation combined with Fusarium sp. A2 inoculation. The relationship between the expression of chalcone synthase genes (CHS) and dynamic changes in chromone content was explored in resin-deposited parts of the trunks of A. sinensis. CHS gene expression levels were detected by qRT-PCR analysis. The chemical composition of agarwood obtained from the heartwood of A. sinensis before and within 1 year after induction was determined by GC-MS. After induction with FA stimulation combined with F. sp. A2 inoculation, the CHS1 gene showed relatively high expression, whereas the CHS2 gene showed low expression. The relative gene expression level of CHS1 peaked at 12 months, with a 153.1-fold increase, and the dominant period of the CHS2 gene expression was 10 months with a 14.13-fold increase. Moreover, chromones were not detected until after 2 months, and a large proportion of chromone compounds were detected after 4 months. Chromone content increased with time and peaked at 12 months. CHS1 gene expression was significantly correlated with 6-hydroxy-2-(2-phenylethyl)chromone accumulation, and CHS2 gene expression was significantly correlated with 5-hydroxy-6-methoxy-2-(2-phenylethyl)chromone accumulation. CHS gene expression was extremely sensitive to FA stimulation combined with F. sp. A2 inoculation and responded to late-onset injury. CHS genes expression also preceded the chromone accumulation. This work laid the foundation for studies on the mechanism by which genes regulate chromone biosynthesis pathways during the formation of agarwood resin in A. sinensis.

1. Introduction

Agarwood (gaharu) is a fragrant resin collected from resinous wood of Gyrinops and Aquilaria species. Agarwood is widely used as an effective traditional Chinese medicine and used to produce high-grade perfumes. Chinese agarwood is formed in the aromatic resinous wood of Aquilaria sinensis (Lour.) Gilg, mainly distributed in Guangdong Province, Hainan Province, and Guangxi Province. Owing to its high commercial value, agarwood is extensively harvested from forests. However, populations of the genus Aquilaria are considered threatened and have been listed in the International Union for Conservation of Nature (IUCN) Red List of Threatened Plants. In addition, all Aquilaria spp. are included in the List of Wild Plants under State Protection to protect the wild Aquilaria resources and ensure their sustainable use; thus, a permit is required before harvesting and trading these resources [1]. In forests, agarwood forms randomly at low frequency, approximately 7–10% of trees produce agarwood as a result of natural infections by fungi or wounding caused by wind, lightning, and gnawing by ants or insects [2]. These natural processes develop very slowly over decades. Most agarwood samples are currently induced through artificial methods, such as burning, injury, insect infestation, fungal pathogen infection, or inoculation either by chemicals or biological methods.
The mechanism of agarwood formation in trees has not yet been elucidated. A pathological response is speculated to occur as a result of fungal infection during agarwood formation [3,4,5,6,7]. Agarwood can be produced in Aquilaria as a response to endophytic fungal invasion [5,6,7,8]. Cui et al. [9,10] obtained three active strains i.e., Microsphaeropsis sp., Xylaria sp., and Lasiodiplodia sp., from 28 endophytic fungal strains in A. sinensis, and these strains significantly contribute to agarwood formation in A. sinensis. Tabata et al. [11], Ma et al. [12], Subehan et al. [13], Tian et al. [14], and Gao et al. [15] also isolated fungi, such as Fusarium solani, Fusarium proliferatum, and Fusarium laseritum from the resinous material of wounded A. sinensis. These studies showed that fungal infection is an effective method to induce agarwood production in A. sinensis. Feng [16] found that combined inoculation of two endophytic fungi (Trichoderma reesei and Trichoderma koningii) or inoculation of a single fungus (Botryosphaeria rhodina) into A. sinensis could induce production of high-quality agarwood. Guo et al. [17] found that inoculation of F. sp. A-11 and Cephalosporium sp. A-17 could induce A. sinensis to produce yellowish-brown substance, the constituents of which were similar to those of agarwood. Ma et al. [18] isolated F. proliferatum from the heartwood of A. sinensis, and agarwood trees were induced by fungal fermentation broth through pinhole instillation. As a result, agarwood formed within as short as 1 year, and agarwood production was 4 to 5 times higher than that obtained through other artificial induction methods. In addition, agarwood could be induced by chemical injury. Wang et al. [19] instilled formic acid, acetic acid, or their combination into the xylem of A. sinensis, and they found that the treatments could induce a defensive response in A. sinensis, resulting in a high production of agarwood.
Agarwood mainly contains sesquiterpenes and chromone derivatives [20]. In addition, a large proportion of fatty acid, fatty ester, and flavone derivatives are found in the trunks of A. sinensis [21,22,23]. Chalcone synthase is a key enzyme in the biosynthetic pathway of flavone compounds [24]. The structures of both flavone and 2-(2-phenylethyl)-chromone contain benzopyran; therefore, chromone formation in agarwood of A. sinensis may be related to flavone [25]. Metabolic regulation of gene expression while Aquilaria trees produce agarwood under stress conditions has been recently reported [26,27,28]. Wang et al. [29] successfully cloned the full-length AsCHS1 gene from wounded A. sinensis and found that the chalcone synthase gene (CHS) contains a conserved domain, which is a typical characteristic of CHS; additionally, they speculated that AsCHS1 proteins can catalyze chromone synthesis in A. sinensis. Cao et al. [30] cloned the promoter of AsCHS1 by using the genome walker strategy, and its function was preliminarily identified through a transient expression system to further investigate the expression and regulation mechanism of the product of AsCHS1 and elucidate the flavonoid accumulation in A. sinensis after wounding. Wang et al. [31] found that the chalcone synthase gene may contribute to the biosynthesis of 2-(2-phenylethyl)chromones. Ye et al. [32] performed transcriptome analysis of different parts of artificial agarwood from A. sinensis treated by formic acid and found that the expression level of the chalcone synthase gene in the agarwood part was much higher than that in the white wood part. This study used an agarwood-inducing method involving formic acid (FA) stimulation combined with F. sp. A2 inoculation to induce agarwood production in a 6-year-old A. sinensis [14,15,19]. The heartwoods of A. sinensis with or without resin were extracted before induction and within 1 year after induction, including seven time points. The relationship between CHS gene expression level and chromone content was tested and evaluated, and the results lay the foundation for studies on the mechanism regulating the chromone biosynthetic pathway during formation of agarwood resin in A. sinensis.

2. Results

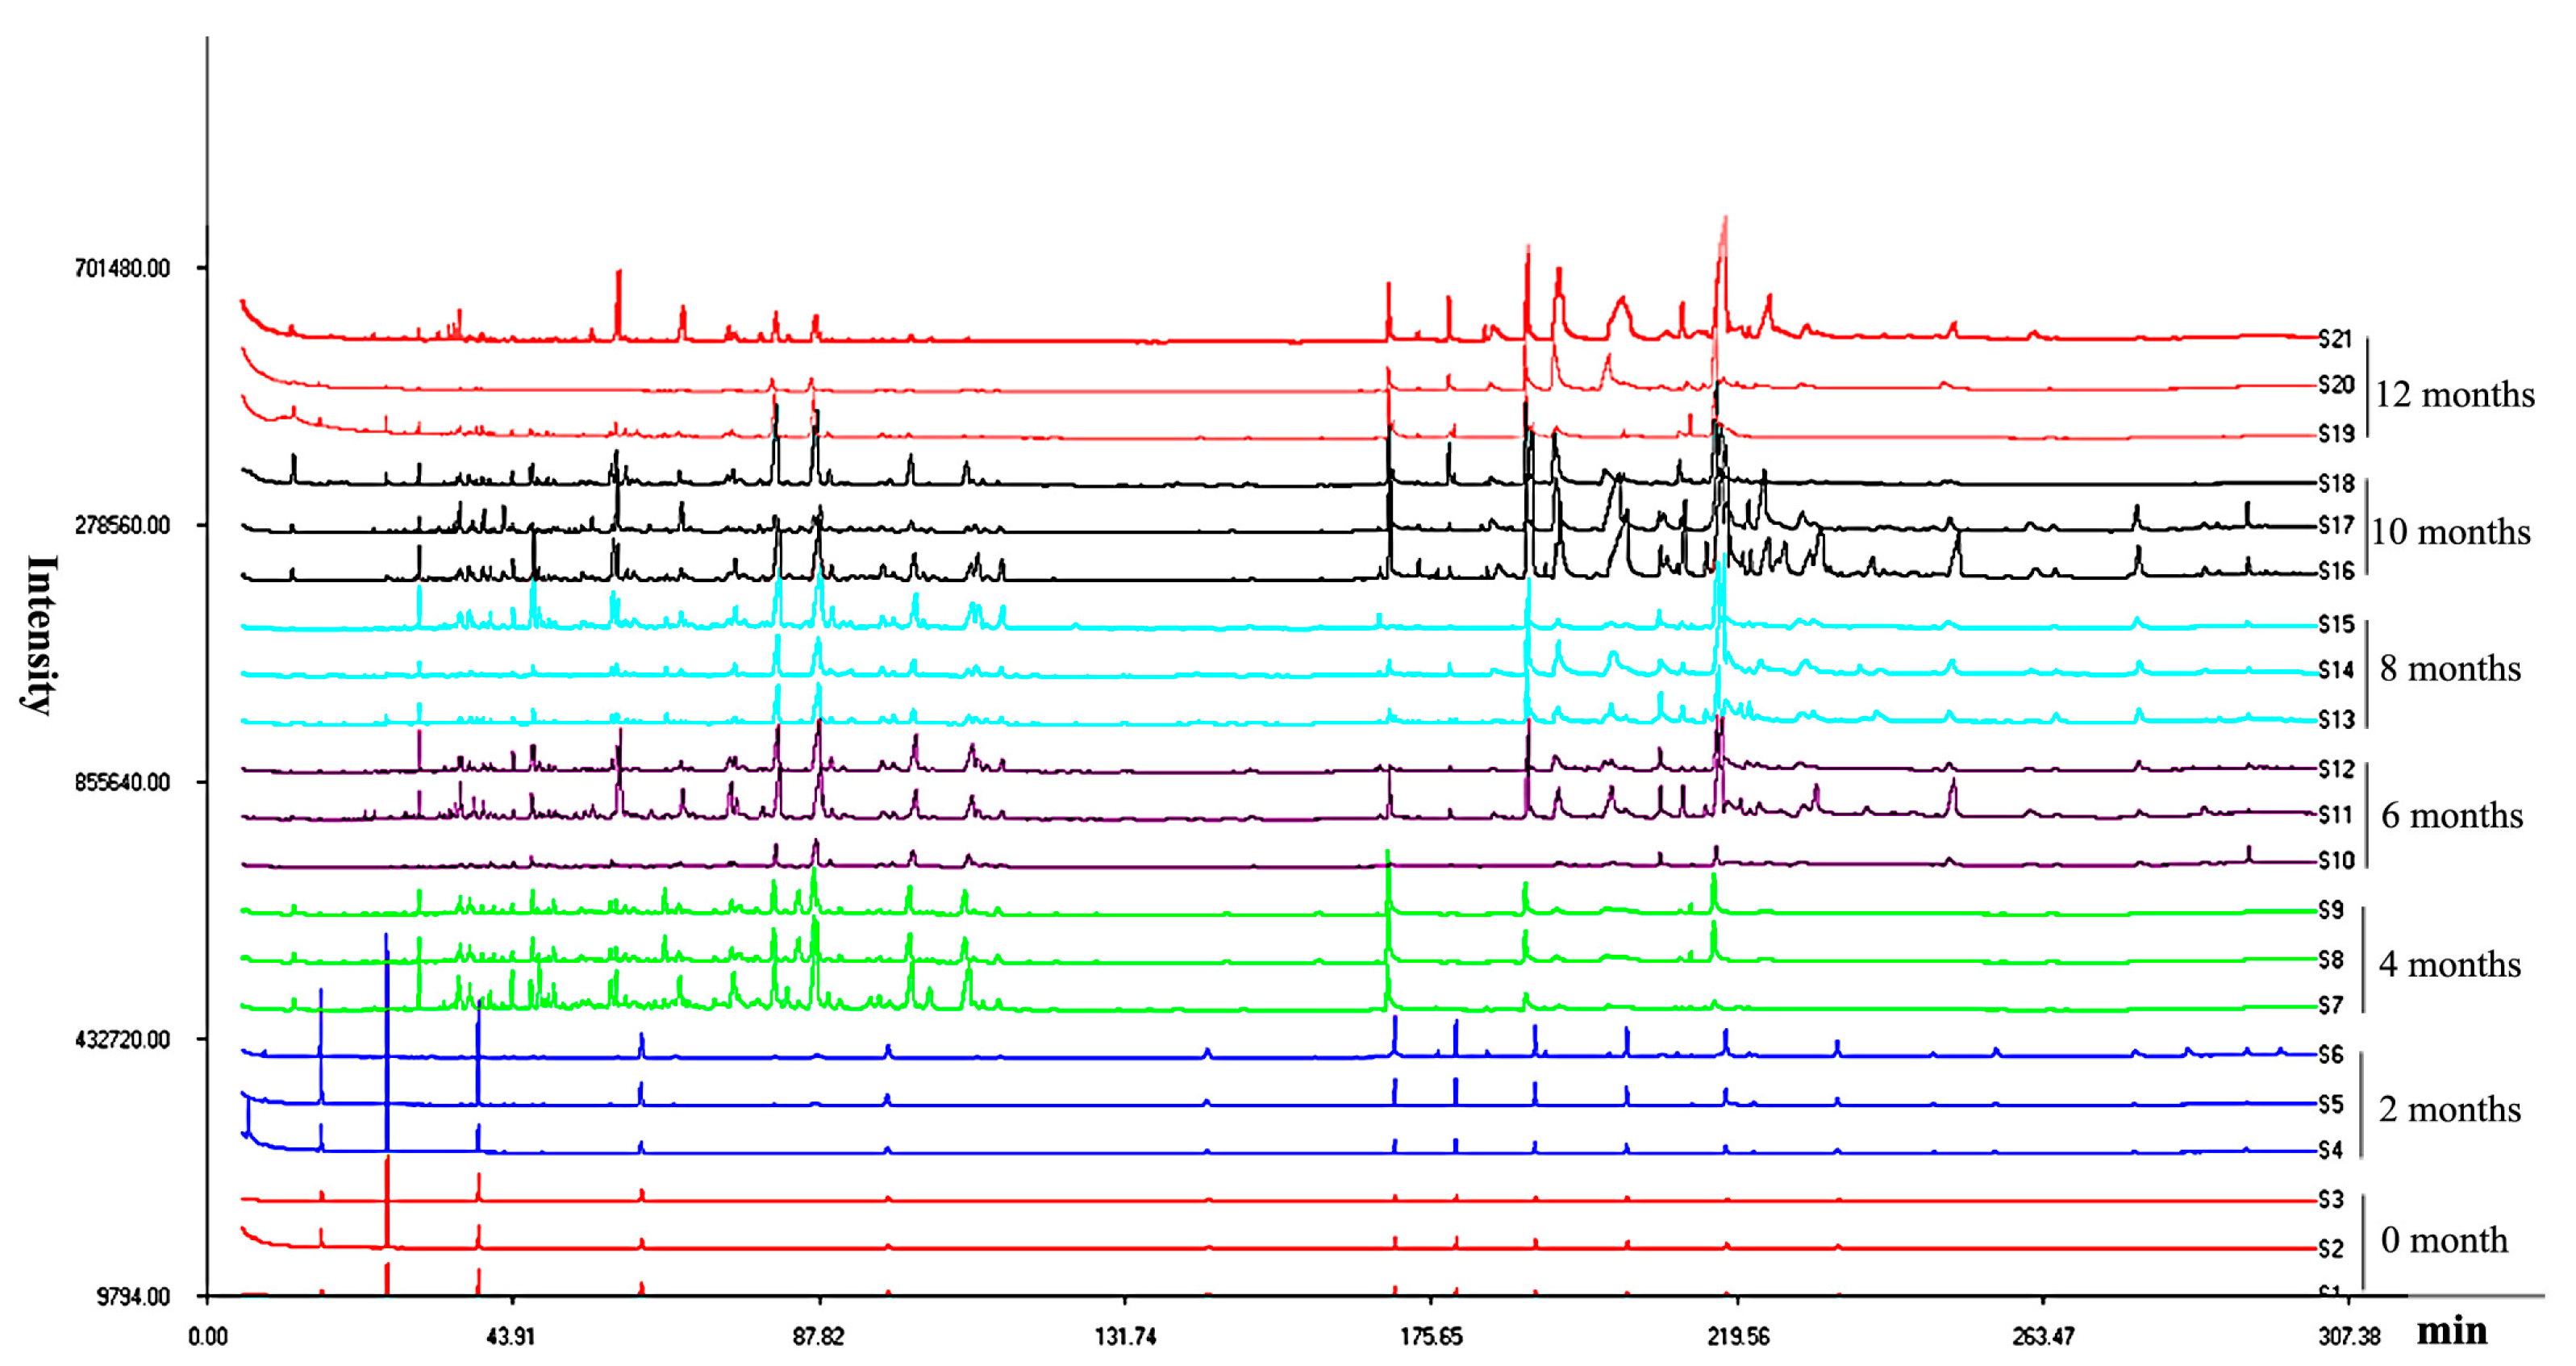
2.1. Analysis of the Accumulation of Secondary Metabolite Compounds

The three parallel samples collected at 0, 2, 4, 6, 8, 10, and 12 months after induction were analyzed by GC-MS, and the total ion chromatograms showed the changes in the composition and accumulation of compounds in artificial agarwood induced through FA stimulation combined with F. sp. A2 inoculation (Figure 1).
The components of 21 samples eluted within the total ion chromatogram were extracted in the Automatic Mass Spectral Deconvolution and Identification System (AMDIS), and sesquiterpenes and chromone compounds were identified by comparing the resolved mass spectra with those of the standards in the National Institute of Standards and Technology (NIST) Mass Spectral Library (05) (Table 1 and Table 2). The percentages of the total ion current were determined using the area normalization method. The main component was sesquiterpenes before 100 min and chromones after 169 min [33].
As shown in Table 1 and Table 2, 19 chromones and 16 sesquiterpenes were detected throughout the 12-month observation period. Chromones and sesquiterpenes were not identified in the artificial agarwood samples until 2 months after induction. A maximum of 23 secondary metabolite components with a relative percentage of 27.32% were identified in the samples after four months. The major chrome compounds (6.67%) included chromones 2-(2-phenylethyl) (2.20%), 6,7-dimethoxy-2-(2-phenylethyl) (1.95%), and 6-methoxy-2-(2-phenylethyl) (1.85%). A total of 29 secondary metabolite compounds were identified in the samples after six months and comprised 22.84% of chromones and 8.89% of sesquiterpenes. Up to 29 secondary metabolite components were identified in artificial agarwood samples induced by FA stimulation combined with F. sp. A2 after eight months, consisting of 42.29% chromones and 8.763% sesquiterpenes. A total of 13 chromones and 12 sesquiterpenes were identified in the artificial agarwood samples induced by FA stimulation combined with F. sp. A2 after 10 months. The accumulation of chromones reached the maximum in the agarwood samples artificially treated for 12 months, with a relative percentage of 44.87%.
Chromones were not detected in artificially induced trunks until after two months. After 4–12 months, a large proportion of chromone compounds, such as 2-(2-phenylethyl)chromone, 6-hydroxy-2-(2-phenylethyl)chromone, 6-methoxy-2-(2-phenylethyl)chromone, 5,8-dihydroxy-2-(2-phenylethyl)chromone, and 6-hydroxy-7-methoxy-2-(2-phenylethyl)chromone, were detected in these samples. Among these compounds, 6,7-dimethoxy-2-(2-phenylethyl)chromone showed high frequency with superior accumulation. Similar to chromones, sesquiterpenes were not detected in the trunks induced by artificial induction after two months. Most sesquiterpenes were detected at 4–12 months. Baimuxianal showed the highest frequency.

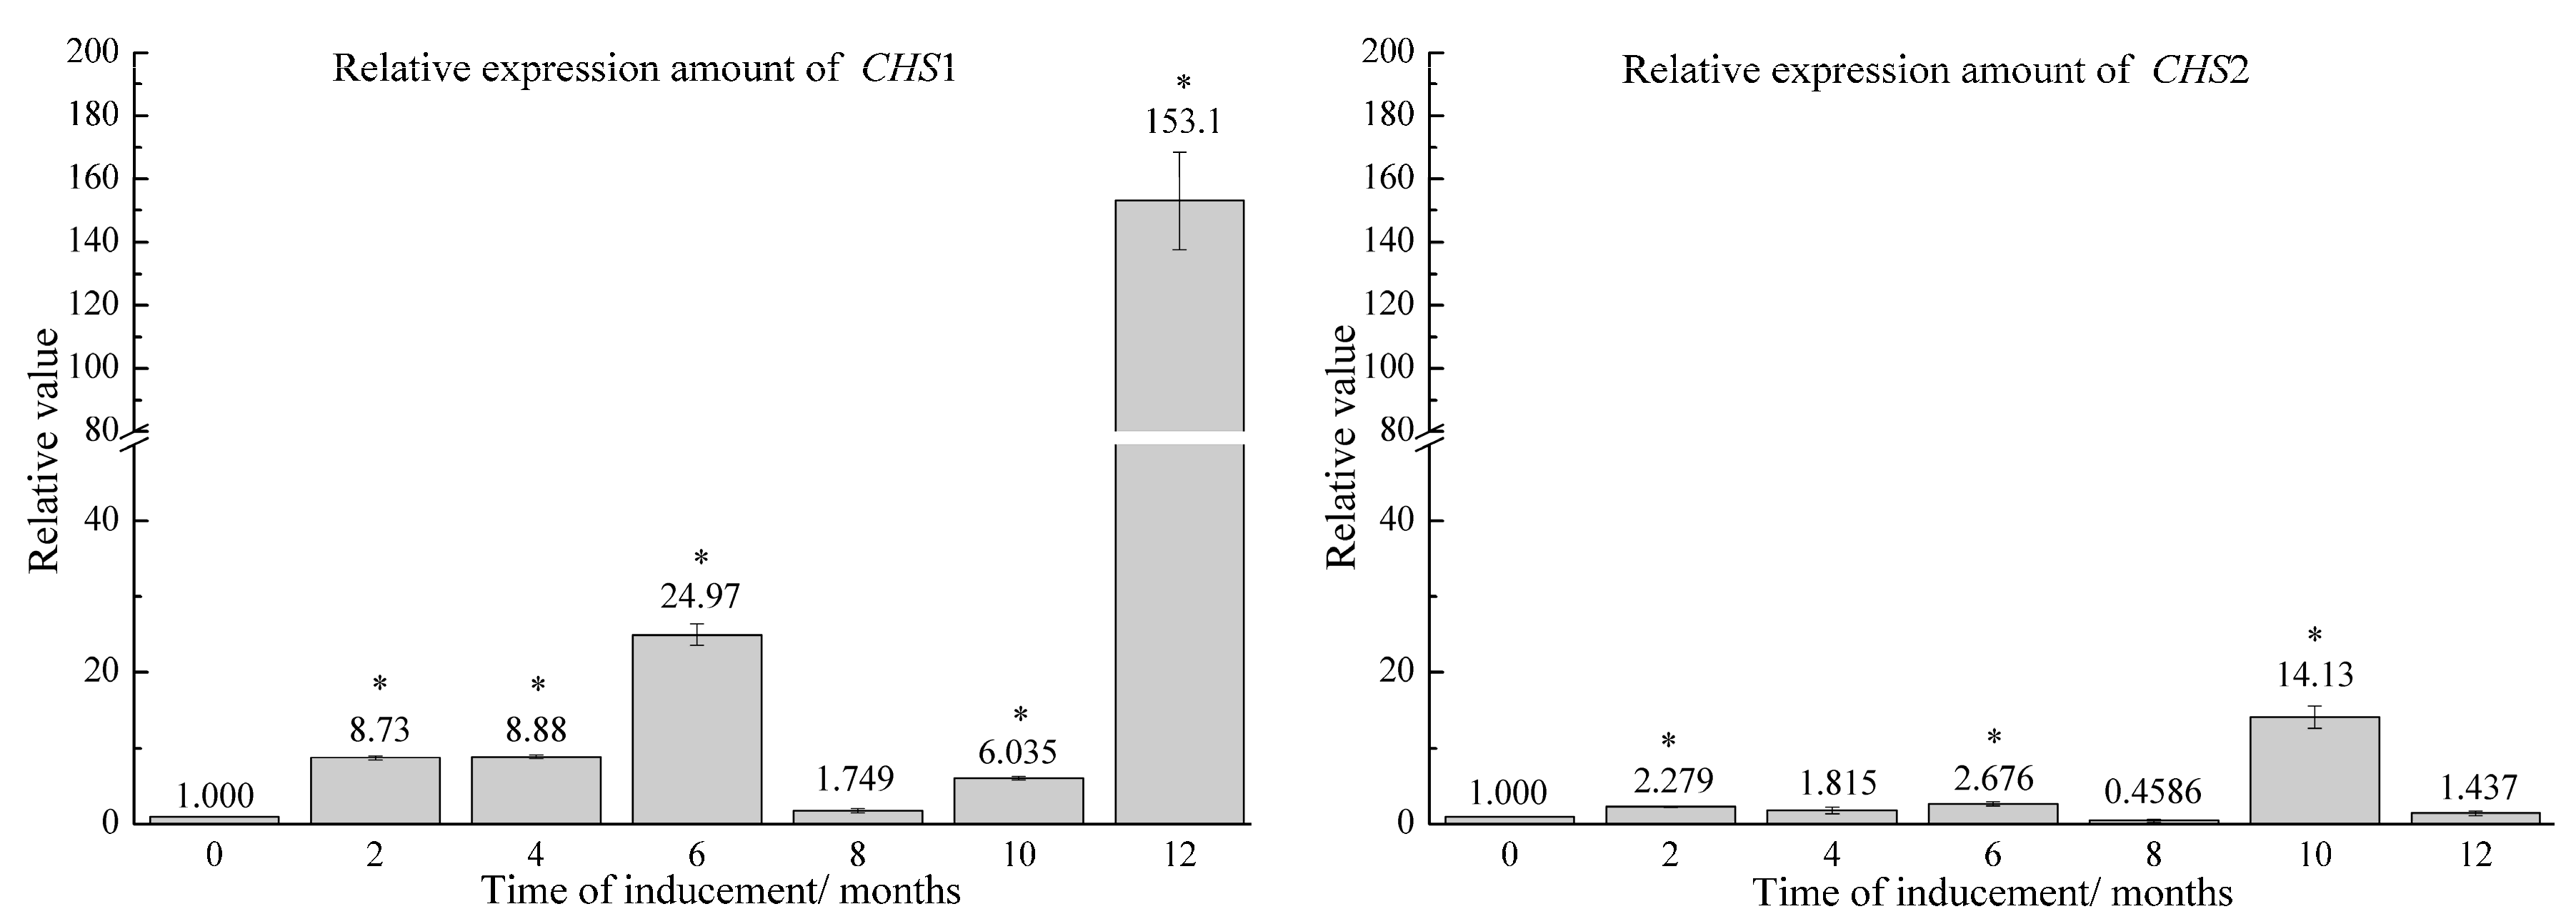
2.2. Relative Expression of Candidate Genes in Agarwood Samples Induced by FA Stimulation Combined with F. sp. A2 Inoculation

To investigate the expression patterns of the genes related to chromone metabolism, we analyzed the expression level of CHS1 and CHS2 genes as shown in Figure 2. In the first 10 months, the relative expression level of CHS1 gene in the treated groups was below 25-fold. At the 12-month time point, the relative expression level increased markedly to 153.1-fold. The relative expression levels of CHS2 gene were low in the artificial agarwood induced by FA stimulation combined with F. sp. A2 inoculation from 0 to 8 months, ranging from 0.4585-fold to 2.676-fold. The largest increase in the expression levels of CHS2 gene was observed at 10 months with a 14.13-fold value. However, the relative expression level decreased to 1.437 after 12 months.
After being induced through FA stimulation combined with F. sp. A2 inoculation, the CHS1 gene showed a relatively high expression level, whereas that of the CHS2 gene was low. On the basis of CHS gene expression level, we speculated that the CHS1 gene was specifically expressed in phenylalanine pathways after induction through FA stimulation combined with F. sp. A2 inoculation.

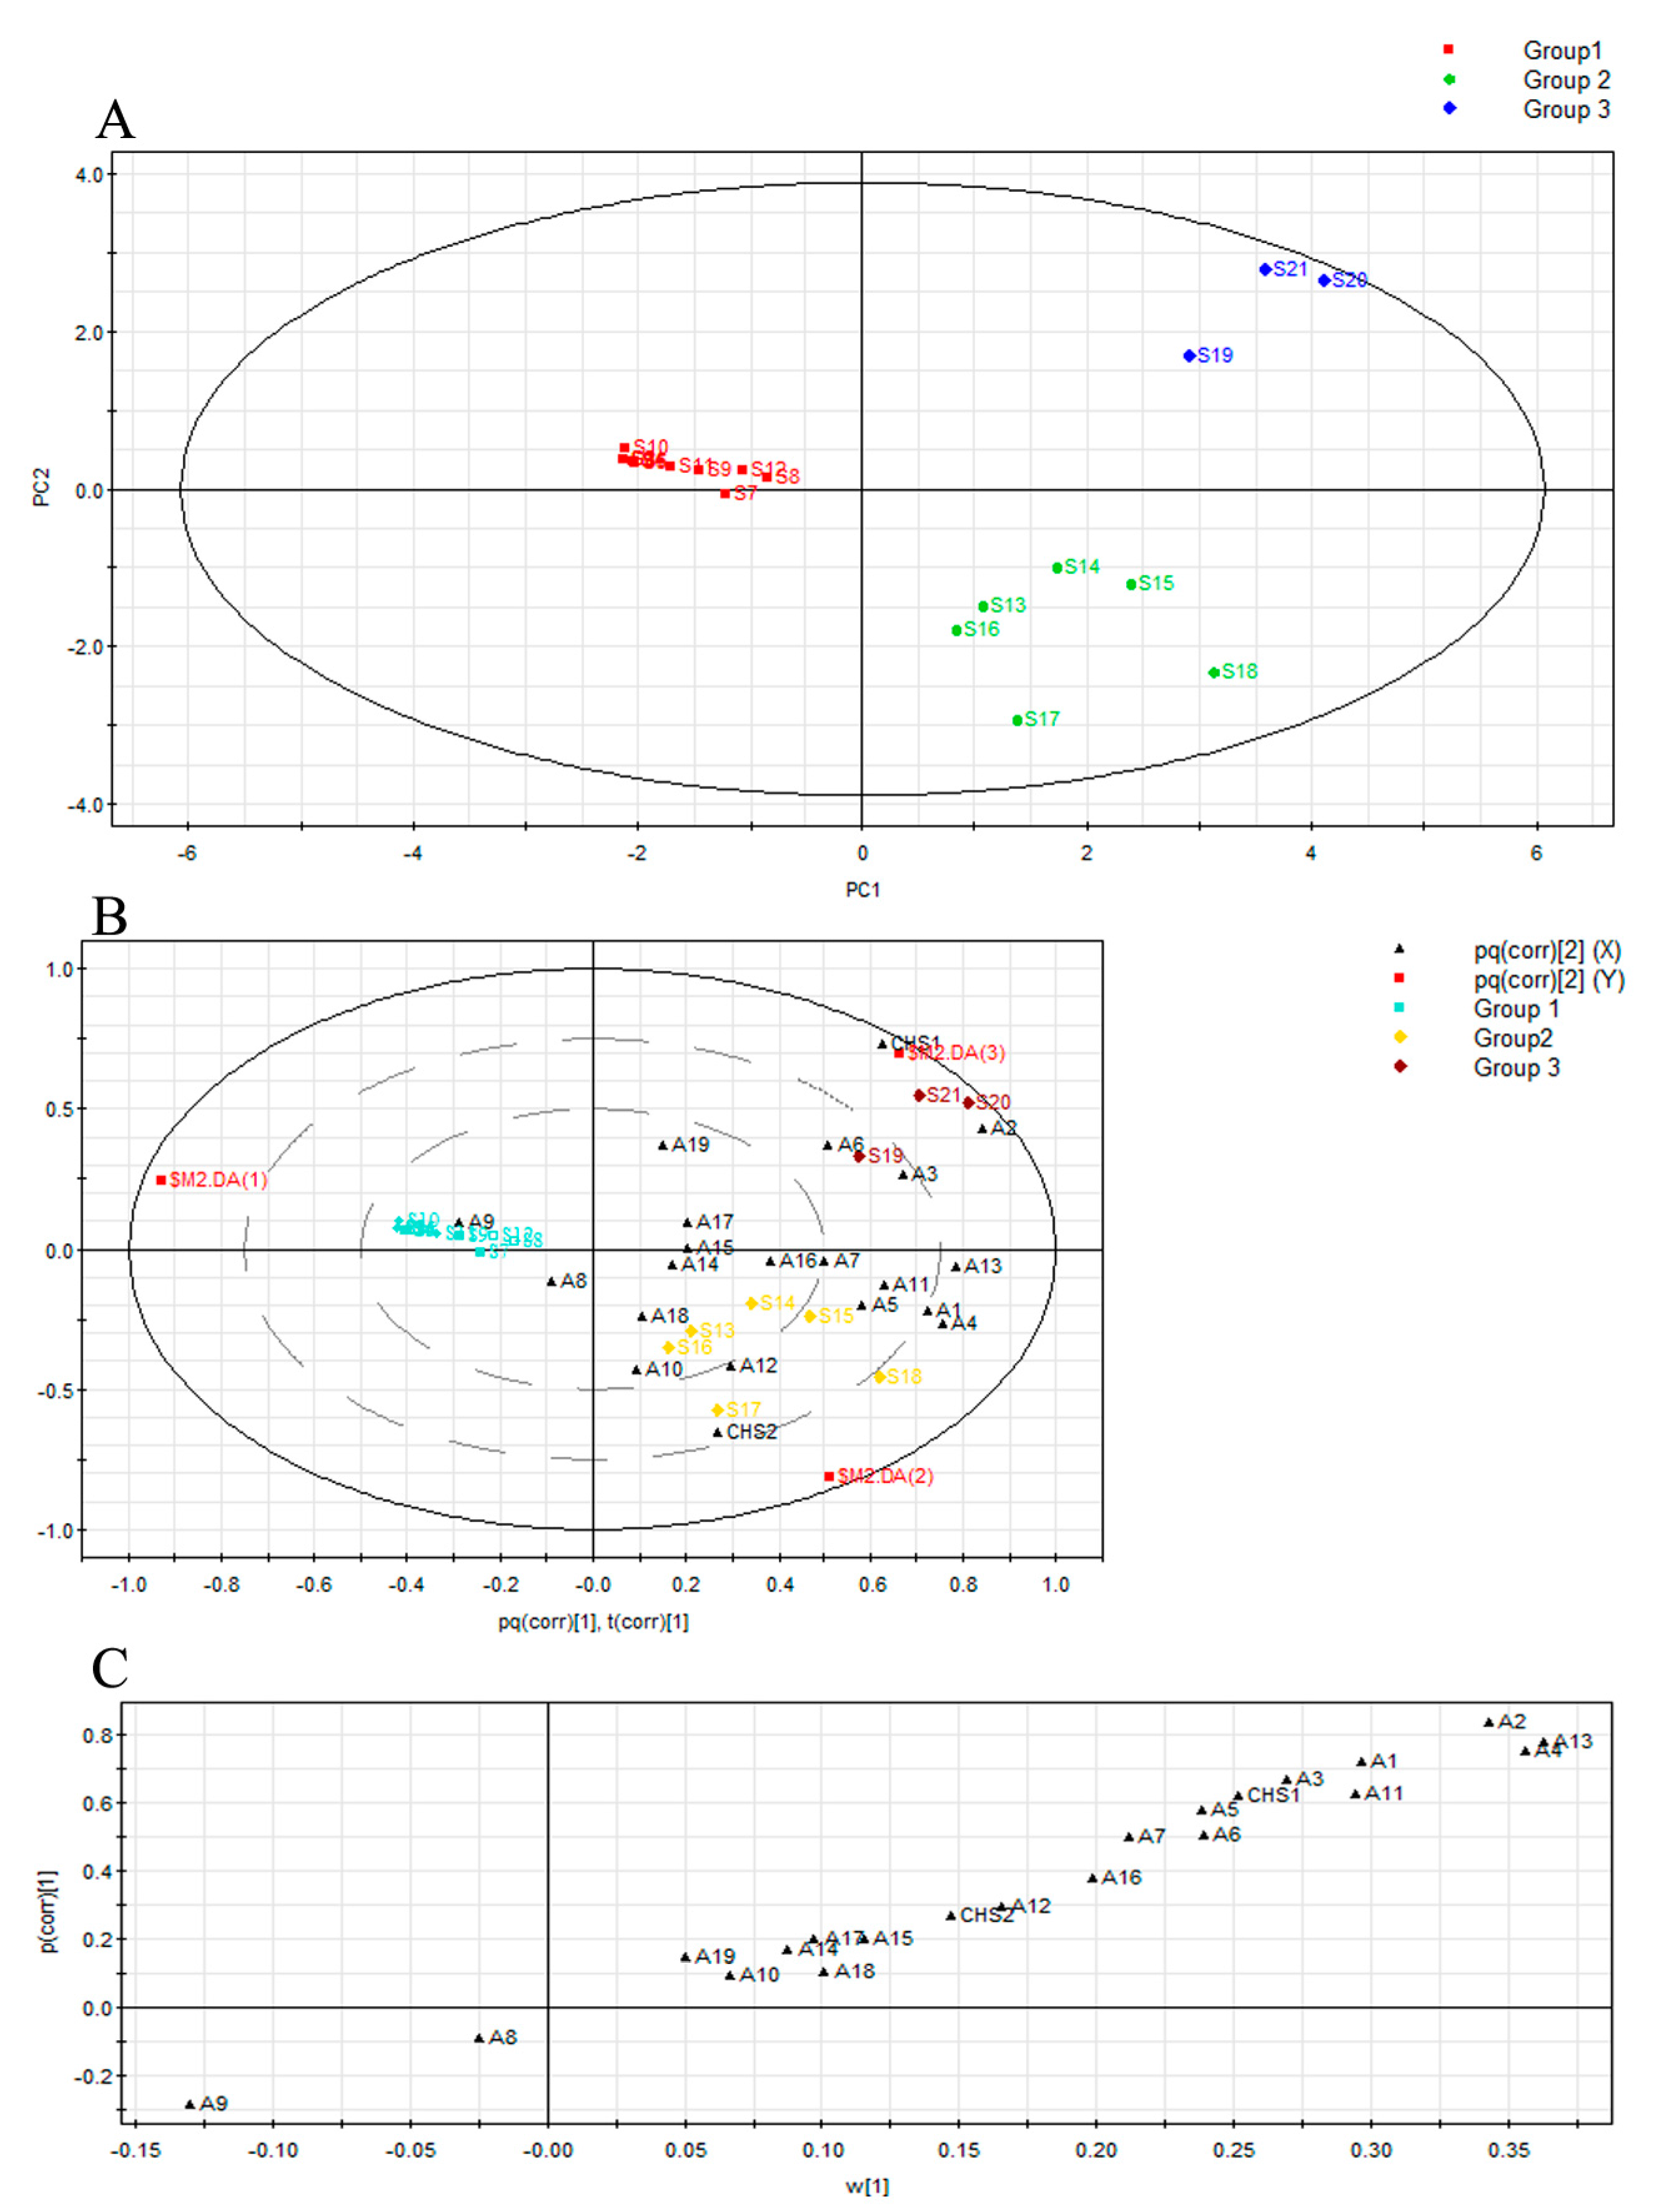
2.3. Multivariate Analysis of Agarwood by Their Mass Ions and Identification

To explore the influence of the expression level of candidate genes in sesquiterpene or chromone biosynthesis, we determined the correlation between the relative expression level and the chemical compounds (sesquiterpenes and chromones) from different time points after induction (Table 3 and Table 4). Data were correlated using the statistical product and service solutions (SPSS) software (version 20.0, SPSS, Chicago, IL, USA). CHS1 gene expression level was significantly correlated to the accumulation of 6-hydroxy-2-(2-phenylethyl)chromone (A2), with a Pearson correlation coefficient approaching 1 (p < 0.01), and to 6-hydroxy-2-(2-phenylethyl)chromone (A3) and 6-hydroxy-7-methoxy-2-(2-phenylethyl)chromone (A6) accumulation (p < 0.05). CHS1 gene expression was also significantly correlated with eudesma-5,11(13)-dien-8,12-olide (A33) accumulation (p < 0.05). CHS2 gene expression level was only significantly correlated to the expression of 5-hydroxy-6-methoxy-2-(2-phenylethyl)chromone (A10) accumulation (p < 0.01).
The orthogonal partial least squares discriminant analysis (OPLS-DA) (R2X = 0.652, R2Y = 0.922, Q2 (cum) = 0.622) score plot (Figure 3A) showed that artificial agarwood was evidently separated into three groups according to its induction period: samples obtained 0, 2, 4, and 6 months after induction, those obtained 8 and 10 months after induction, and those obtained 12 months after induction.
The peak area percentage of 19 chromone compounds and the relative CHS gene expression were examined by OPLS-DA using SIMCA-P 12.0 software, and a Loading Bi Plot was obtained (Figure 3B). The distribution of chromone compounds and CHS in the Loading Bi Plot reflects the corresponding contribution of the grouping. CHS1 gene expression was related to 6-hydroxy-2-(2-phenylethyl)chromone (A2), 6-hydroxy-2-(2-phenylethyl)chromone (A3), and 6-hydroxy-7-methoxy-2-(2-phenylethyl)chromone (A6). CHS2 gene expression was possibly related to 5-hydroxy-6-methoxy-2-(2-phenylethyl)chromone (A10) and 6-methoxy-2-[2-(3-methoxyphenyl) ethyl] chromone (A12). These results are essentially consistent with the result of the Pearson’s correlation analysis performed using SPSS software (Table 3).
S-plot was used to identify the compounds that significantly contributed in the grouping result (Figure 3C). The p(corr) is the correlation coefficient. 6,7-dimethoxy-2-(2-phenylethyl)chromone (A13, corr = 0.783161), 6-methoxy-2-(2-phenylethyl)chromone (A4, corr = 0.753625), and 6-hydroxy-2-(2-phenylethyl)chromone (A9, corr = −0.286252) substantially contributed to the grouping result. As shown above, the p(corr) values of chromones 6,7-dimethoxy-2-(2-phenylethyl) and 6-methoxy-2-(2-phenylethyl) were positive, whereas that of 6-hydroxy-2-(2-phenylethyl)chromone was false-positive.

3. Discussion

In this study, we used the FA stimulation combined with F. sp. A2 inoculation to produce artificial agarwood in the field. GC-MS combined with AMDIS and retention index (RI) correction index were used to study the variations in chemical components during agarwood formation. There is a clear trend in the approximate timing of chromone and sesquiterpene compounds increase, however, there seems to be a large difference in the GC-MS data. This may be due to individual variation caused by uncontrollable factors from field experiments. Chromone metabolites were not detected in the trunks in the first 2 months of induction; however, they were detected in the other four time points, and showed an increasing tendency. 6,7-dimethoxy-2-(2-phenylethyl)chromone showed the highest frequency. Lin et al. [34] detected 2-(2-phenylethyl)chromone compounds in agarwood after 1 year of artificial induction through fungal inoculation (Melanotus flavolivens) compared with that after a half-year induction. Qi et al. [24] found that chromone contents increased with time after artificial induction by M. flavolivens; the relative content of chromone in artificial agarwood also increased but not significantly.
The CHS gene is an inducible expression gene and can be induced after a plant is subjected to injury. CHS activation will be significantly enhanced and then CHS genes will be actively transcribed, transmitted, and amplified in vivo. CHS is regulated by a phenylalanine metabolism pathway to promote synthesis and release of chromone compounds [29]. Wang et al. [31] observed that chalcone synthase may regulate the biosynthesis of 2-(2-phenylethyl)chromones in response to salinity stress involved in A. sinensis calli. Ye et al. [32] performed the transcriptome analysis of different parts of artificial agarwood induced by formic acid. They found that the expression level of chalcone synthase in the agarwood part was much higher than that in the white wood part. After being induced by FA stimulation combined with F. sp. A2 inoculation, CHS gene expression level initially increased, then decreased, and finally increased. Our result showed that CHS1 gene was extremely sensitive to FA stimulation combined with F. sp. A2 inoculation, and CHS1 and CHS2 genes both responded to late-onset injury. Several studies showed that flavonoid accumulation paralleled the transcription level of change in the CHS gene [35,36,37]. Our study also showed the same trend in the agarwood samples induced by a chemical method plus fungal pathogen infection before 10 months. However, the CHS1 gene had the highest level of transcription at the last time point, while chromone accumulation reached a platform period. This suggests that the CHS1 gene may be turned into another biosynthesis pathway when the specific accumulation of chromone compounds reaches a steady state. Zhang et al. [38] demonstrated that the whole anthocyanin pathway was diverted to the synthesis of chlorogenic acid and its complexes when the expression of the CHS gene was severely repressed. Hoffman et al. [39] showed that the flavonoid pathway was shunted to the phenylpropanoid pathway when the CHS gene activity was reduced.

4. Materials and Methods

4.1. Source of Plant Materials

Materials were obtained from 6-year-old A. sinensis trees growing in a farm in Xinyi suburban district in Guangdong Province, China. These trees were identified as A. sinensis by Prof. Yan (College of Traditional Medicine, Guangdong Pharmaceutical University). Fusarium sp. A2 (EU781659) [40], provided and identified as F. sp. by Prof. Zhang (Guangdong Institute of Microbiology), was used to inoculate A. sinensis trees. Artificial agarwood from A. sinensis was induced through FA stimulation combined with F. sp. A2 inoculation through pinhole instillation according to the method of Gao et al. [33].
Induction was performed on the 24 June 2012, and wood chips containing embedded black resin were collected. The acquisition timeline was 0 month before induction and 2, 4, 6, 8, 10, and 12 months after induction. Three parallel samples were collected at each time point. Physical damage caused by manual removal of resin can induce agarwood production, so samples of different time points came from different A. sinensis trees individually. Samples from the same tree were divided into two portions. One portion was immediately wrapped in tinfoil and stored in liquid nitrogen for quantitative gene expression analysis, whereas the other portion was directly dried for GC-MS analysis.

4.2. Gas Chromatography Mass Spectrometry Analysis

All dried heartwood samples were cut into small pieces and filtered through 40-mesh sieves. The powder samples (0.5 g) were extracted in chloroform (10 mL, 24 h) at room temperature. The solvent was evaporated in a water bath (80 °C), then reconstituted to 2 mL chloroform and stored in a dark and air tight vial at 4 °C.
GC-MS analysis was performed using a GCMS QP-2010E (Shimadzu, Kyoto, Japan) equipped with a Rtx-5MS (Restek Corp., Bellefonte, PA, USA) capillary fused silica column (30 m × 0.25 mm I.D. × 0.25 μm film thickness), and operated in the electron ionization (EI) mode (70 eV). Helium was the carrier gas, with the flow rate of 1 mL/min. The operating parameters were the temperature program of 90 °C for 4 min, ramp of 2.5 °C/min up to 160 °C (5 min), then increased to 180 °C with a 0.3 °C/min heating vamp, kept for 5 min, and then ramp of 2.0 °C/min up to 200 °C. Subsequently it was increased to 230 °C with a 1 °C/min heating vamp, and kept at 230 °C for 120 min. A 1 μL sample solution was injected. The injections were performed in a 1:30 split ratio at 230 °C. The m/z values were recorded in the range of 50–500 amu. A 1 μL C10–C31 sample was injected separately and was run in the same program as the heartwood samples.

4.3. Quantitative Real-Time PCR (qRT-PCR)

To analyze gene expression levels, total ribonucleic acid (RNA) was isolated from heart wood samples as previously described [41]. Reverse transcription was performed using a ReverTra Ace qCR RT kit Master Mix with gDNA Remover (TOYOBO, Osaka, Japan) with specific primers (Supplementary Table S1). The specificity of the oligonucleotide sequences, in relation to its annealing efficiencies, was evaluated using the Primer 5.0 program in advance. A fragment of the glyceraldehyde-3-phosphate dehydrogenase (GADPH) gene was also amplified as a blank control [42]. The qPCR analysis was performed using an ABI 7500 Real-Time PCR System (Applied Biosystems, Foster City, CA, USA), using a THUNDERBIRD SYBR qPCR Mix (Toyobo, Osaka, Japan). The Ct (threshold cycle) was used to measure the starting copy numbers of each target gene, and was detected by the ABI 7500 Real-Time PCR System. Relative quantitation of each target gene expression level was performed using the comparative 2−ΔΔCt method [43]. All experiments were conducted in triplicate.

4.4. Data Processing and Statistics Analysis

The components were identified based on the comparison of their retention indices and mass spectra as previously described [33,42]; moreover, we used NIST MS search 2.0 with the database of NIST 05 after elution within the total ion chromatogram (TIC) extracted in the AMDIS. Retention indices were calculated using a series of n-alkanes (C10–C31). Correlations between chemical components and expression of the CHS gene were analyzed by the Pearson’s correlation analysis of SPSS (20.0 for Windows). Peak-area percentage of chromone compounds and relative expression of CHS were examined by OPLS-DA using SIMCA-P 12.0 software.

5. Conclusions

2-(2-Phenylethyl)chromone compounds, which are the main characteristic components of agarwood, are closely related to the plant self-defense response. Defensive substances, such as sesquiterpenes and chromones with bacteriostatic activity, will be produced when a plant is subjected to injury or fungal infection. These defensive substances can protect A. sinensis from further injury. Recent investigations have revealed that in the early stage of injury, a plant mainly releases a large proportion of volatile compounds derived from lipoxygenase and then releases chromone compounds later. Chromone content increases with continuous injury [44]. In this study, we used an agarwood inducing method involving FA stimulation combined with F. sp. A2 inoculation to induce agarwood production in individual A. sinensis trees. The relationship between the expression of chalcone synthase gene (CHS) and dynamic changes in chromone content was explored by using qRT-PCR and GC-MS analysis. The present study showed that CHS gene expression preceded the chromone accumulation after induction through FA stimulation combined with F. sp. A2 inoculation. Chromone compounds were not detected in the artificially induced trunk until after 2 months, even when CHS gene expression had already begun. Chromone compounds were detected 4 months after induction. The release of chromone compounds was closely related to CHS expression in agarwood formation. Therefore, we can regulate CHS expression to produce chromone compounds in the future, which would lay the foundation for highly efficient artificial agarwood production and elucidation of the mechanism of agarwood formation in A. sinensis.

Supplementary Materials

The supplementary materials are available online.

Acknowledgments

We gratefully acknowledge financial support from the National Basic Research Program of China (973 Program, 2014CB460613), the National Natural Science Foundation of China (81102418), Natural Science Foundation of Guangdong Province (2014A030313584), State Key Laboratory of Applied Microbiology Southern China (SKLAM003-2015), Observation Station Foundation of Guangdong Academy of Science (Sytz201504, Sytz201511), and Research Subjects of Traditional Chinese Medicine Bureau of Guangdong Province (20161151).

Author Contributions

Xiaoxia Gao and Weimin Zhang conceived and designed the experiments; Meirou Feng, Zhaojian Zhong, Xin Zhou, Xiaoyin Chen, and Wei Ye performed the experiments; Xiaodong Chen and Xiaoling Zhu analyzed the data; Weimin Zhang contributed reagents/materials/analysis tools; Xiaodong Chen wrote the paper. Xiaodong Chen and Xiaoling Zhu contributed equally to this work.

Conflicts of Interest

The authors declare no conflict of interest. The founding sponsors had no role in the design of the study; in the collection, analyses, or interpretation of data; in the writing of the manuscript, and in the decision to publish the results.

References

  1. Yu, Y.F. The list of major national protected wild plant species in China. Plants 1999, 5, 3–11. [Google Scholar]
  2. Ng, L.T.; Chang, Y.S.; Azizol, A.K. A review on agar (gaharu) producing Aquilaria species. J. Trop. For. Prod. 1997, 2, 272–285. [Google Scholar]
  3. Bhattacharyya, B.; Datta, A.; Baruah, H.K. On the formation and development of agaru in Aquilaria agallocha. Sci. Cult. 1952, 18, 240–243. [Google Scholar]
  4. Jain, T.C.; Maheshwari, M.L.; Bhattacharyya, S.C. Terpenoids XXX The composition of the oil from uninfected agarwood (Aquilaria agallocha Roxb.). Perf. Essent. Oil Rec. 1962, 53, 294–298. [Google Scholar]
  5. Tamuli, P.; Bhuyan, D.; Boruah, P.; Nath, S.C. Seed-borne fungi of agarwood. Indian Phyto. 1999, 52, 312–315. [Google Scholar]
  6. Tamuli, P.; Boruah, P.; Saikia, R. Mycofloral study of the phyllosphere and soil of agarwood tree plantation. Plant Arch. 2006, 6, 695–697. [Google Scholar]
  7. Mohamed, R.; Jong, P.L.; Zali, M.S. Fungal diversity in wounded stems of Aquilaria malaccensis. Fungal Divers. 2010, 43, 67–74. [Google Scholar] [CrossRef]
  8. Qi, S.Y. Aquilaria species: In vitro culture and the production eaglewood (agarwood). In Medicinal and Aromatic Plants VIII; Springer: Berlin, Germany, 1995; Volume 33, pp. 36–46. [Google Scholar]
  9. Cui, J.L.; Xiao, P.G.; Guo, S.X.; Wang, M.L. Fungus inducing the formation of agilawood from Aquilaria sinensis. J. Chin. Pharm. Sci. 2012, 47, 335–338. [Google Scholar]
  10. Cui, J.L.; Xiao, P.G.; Guo, S.X. Field test and analysis for fungus inducing the formation of agilawood from Aquilaria sinensis. J. Chin. Pharm. Sci. 2012, 47, 1614–1617. [Google Scholar]
  11. Tabata, Y.; Widjaja, E.; Mulyaningsih, T.; Parman, I.; Wiriadinata, H.; Mandang, Y.I.; Itoh, T. Structural survey and artificial induction of aloeswood. Wood Res. 2003, 90, 11–12. [Google Scholar]
  12. Ma, H.M.; Liang, K.N.; Zhou, Z.Z.; Lin, M.P.; Yang, W. Isolation, identification and analysis of fungi of agarwood formation. J. Cent. South Univ. For. Technol. 2012, 7, 72–75. [Google Scholar]
  13. Subehan, U.J.; Ueda, J.Y.; Fujino, H.; Attamimi, F.; Kadota, S. A field survey of agarwood in Indonesia. J. Tradit. Med. 2005, 22, 244–251. [Google Scholar]
  14. Tian, J.J.; Gao, X.X.; Zhang, W.M.; Qu, L.H. Molecular identification of endophytic fungi from Aquilaria sinensis and artificial agarwood induced by pinholes-infusion technique. Afr. J. Biotechnol. 2013, 12, 3115–3131. [Google Scholar]
  15. Gao, X.X.; Zhou, W.P.; Zhong, Z.J.; Liu, X.J.; Zhang, W.M.; Wu, G.Q. The correlation analysis between benzyl-acetone and the alcohol soluble extract content from agarwood. J. Chin. Med. Mater. 2012, 35, 919–924. [Google Scholar]
  16. Feng, N.X. The Study of Endophytic Fungi in Agarwood; Nanchang University: Nanchang, China, 2008. [Google Scholar]
  17. Guo, S.X.; Gong, L.J.; Chen, X.M.; Wang, C.L.; Meng, Z.X. Method for Fungus Inducing the Formation of Agilawood from Aquilaria sinensis. Chinese Patent 101781623A, 21 July 2010. [Google Scholar]
  18. Ma, H.M.; Liang, K.N.; Zhou, Z.Z.; Huang, G.H.; Lin, M.P. Method for Rapid Formation of Agilawood of Using Fungi Fermentation. Chinese Patent 102550311A, 11 July 2010. [Google Scholar]
  19. Wang, L.; Zhang, W.M.; Gao, X.X.; Wu, G.Q.; Li, H.H.; Chen, Q. An Artificial Induced Method of Aquilaria sinensis. Chinese Patent 102302041A, 1 July 2011. [Google Scholar]
  20. Naef, R. The volatile and semi-volatile constituents of agarwood, the infected heartwood of Aquilaria species: A review. Flavour Fragr. J. 2011, 26, 73–89. [Google Scholar] [CrossRef]
  21. Li, W.; Mei, W.L.; Wang, H.; Zuo, W.J.; Yang, D.L.; Dai, H.F. Chemical constituents from stems of Aquilaria sinensis. Chin. J. Chin. Mater. Med. 2013, 38, 2826–2831. [Google Scholar]
  22. Chen, D.; Bi, D.; Song, Y.L.; Tu, P.F. Flavanoids from the stems of Aquilaria sinensis. Chin. J. Nat. Med. 2012, 10, 287–291. [Google Scholar] [CrossRef]
  23. Peng, K.; Mei, W.L.; Wu, J.; Dai, H.F. Flavones from the stem of Aquilaria sinensis. J. Trop. Subtrop. Bot. 2010, 18, 97–100. [Google Scholar]
  24. Qi, S.Y.; Lin, L.D.; Hu, H.C. The formation of chromone in Aquilaria sinensis. Chin. Tradit. Herb. Drugs 2000, 31, 658–659. [Google Scholar]
  25. Chen, X.F. The Chalcone Synthase (CHS) Gene Cloning and Bioinformatics Analysis of Three Species of Ferns; Shanghai Normal University: Shanghai, China, 2013. [Google Scholar]
  26. Kenmotsu., Y.; Ogita, S.; Katoh, Y.; Yamamura, Y.; Takao, Y.; Tatsuo, Y.; Fujino, H.; Kadota, S.; Kurosaki, F. Methyl jasmonate-induced enhancement of expression activity of Am-FaPS-1, a putative farnesyl diphosphate synthase gene from Aquilaria microcarpa. J. Nat. Med. 2011, 65, 194–197. [Google Scholar] [CrossRef] [PubMed]
  27. Kenmotsu, Y.; Yamamura, Y.; Ogita, S.; Katoh, Y.; Kurosaki, F. Transcriptional activation of putative calmodulin genes Am-cam-1 and Am-cam-2 from Aquilaria microcarpa, in response to external stimuli. Biol. Pharm. Bull. 2010, 33, 1911–1914. [Google Scholar] [CrossRef] [PubMed]
  28. Xu, Y.H.; Zhang, Z.; Wang, M.X.; Wei, J.H.; Chen, H.; Gao, Z.H.; Sui, C.; Luo, H.; Zhang, X.; Yang, Y.; et al. Identification of genes related to agarwood formation: Transcriptome analysis of healthy and wounded tissues of Aquilaria sinensis. BMC Genom. 2013, 14, 227. [Google Scholar] [CrossRef] [PubMed]
  29. Wang, M.X.; Li, W.L.; Zhang, Z.; Wei, J.H.; Yang, Y.; Xu, Y.H. Cloning and bioinformatics analysis of chalcone synthase (AsCHS1) gene in Aquilaria sinensis. Chin. J. Chin. Mater. Med. 2013, 38, 149–152. [Google Scholar]
  30. Cao, T.J.; Dai, H.F.; Li, H.L.; Guo, D.; Mei, W.L.; Peng, S.Q. Cloning and function analysis of the chalcone synthase gene (AsCHS1) promoter in Aquilaria sinensis. Chin. J. Trop. Crop. 2014, 35, 1950–1956. [Google Scholar]
  31. Wang, X.H.; Gao, B.W.; Liu, X.; Dong, X.J.; Zhang, Z.X.; Fan, H.Y.; Zhang, L.; Wang, H.; Shi, S.P.; Tu, P.F. Salinity stress induces the production of 2-(2-phenylethyl)chromones and regulates novel classes of responsive genes involved in signal transduction in Aquilaria sinensis calli. BMC Plant Biol. 2016, 16, 119–139. [Google Scholar] [CrossRef] [PubMed]
  32. Ye, W.; Wu, H.Q.; He, X.; Wang, L.; Zhang, W.M.; Li, H.H.; Fan, Y.F.; Tan, G.H.; Liu, T.M.; Gao, X.X. Transcriptome sequencing of chemically induced Aquilaria sinensis to identify genes related to agarwood formation. PLoS ONE 2016, 11, e0155505. [Google Scholar] [CrossRef] [PubMed]
  33. Gao, X.X.; Xie, M.R.; Liu, S.F.; Guo, X.L.; Chen, X.Y.; Zhong, Z.J.; Wang, L.; Zhang, W.M. Chromatographic fingerprint analysis of metabolites in natural and artificial agarwood using gas chromatography-mass spectrometry combined with chemometric methods. J. Chromatogr. B 2014, 967, 264–273. [Google Scholar] [CrossRef] [PubMed]
  34. Lin, F.; Dai, H.F.; Wang, H.; Mei, W.L. Analysis of chemical constituents of essential oil between two batches of agarwood produced by inoculation method using gas chromatography-mass spectrometry. Lishizhen Med. Mater. Med. Res. 2010, 21, 1901–1902. [Google Scholar]
  35. Xu, F.; Cheng, S.Y.; Cheng, S.H.; Wang, Y.; Du, H.W. Time course of expression of chalcone synthase gene in Ginko biloba. J. Plant Physiol. Mol. Biol. 2007, 33, 309–317. [Google Scholar]
  36. Liu, T.; Mu, L.; Liang, Y.L.; Wang, J.J.; Yang, S.C. Relationship between expression of chalcone synthase (CHS) and scutellarin content in Erigeron breviscapus. Chin. J. Chin. Mater. Med. 2013, 33, 2241–2244. [Google Scholar]
  37. Tian, L.; Li, B.; Zhang, J.Y.; Fan, S.X.; Yan, S.R.; Sun, J.M. Correlation analysis between gene expression of isoflavone synthesis relative enzymes and isoflavone accumulation during the seed development in soybean. J. Plant Genet. Resour. 2014, 15, 1295–1304. [Google Scholar]
  38. Zhang, L.; Zhu, L.X.; Xu, C.; Cui, C.M.; Sheng, H.Y.; Li, R.; Wang, H.Q. The effect of silencing chalcone synthase on anthocyanin metabolism in peach. Acta Hortic. Sin. 2015, 42, 31–37. [Google Scholar]
  39. Hoffmann, T.; Kalinowski, G.; Schwab, W. RNAi-induced silencing of gene expression in strawberry fruit (Fragaria × ananassa) by agroinfiltration: A rapid assay for gene function analysis. Plant J. 2006, 48, 818–826. [Google Scholar] [CrossRef] [PubMed]
  40. Wang, L.; Zhang, W.M.; Pan, Q.L.; Li, H.H.; Tao, M.H.; Gao, X.X. Isolation and molecular identification of endophytic fungi from Aquilaria sinensis. J. Fungal Res. 2009, 7, 37–42. [Google Scholar]
  41. Chen, X.D.; Zhou, W.P.; Liu, S.F.; Chen, X.Y.; Zhong, Z.J.; Zhang, W.M.; Gao, X.X. A research of different method for isolating total RNA from artificial agarwood induced by Fusarium sp. A2. Lishizhen Med. Mater. Med. Res. 2015, 26, 993–995. [Google Scholar]
  42. Chen, X.D.; Xie, M.R.; Liu, S.F.; Zhou, W.P.; Zhang, W.M.; Gao, X.X. Relationship between expression of sesquiterpene synthase gene and sesquiterpene content in artificial agarwood induced by Fusarium sp. A2. J. Chin. Pharm. 2014, 39, 197–203. [Google Scholar]
  43. Livak, K.J.; Schmittgen, T.D. Analysis of relative gene expression data using real-time quantitative PCR and the 2−ΔΔCT method. Methods 2001, 25, 402–408. [Google Scholar] [CrossRef] [PubMed]
  44. Zhang, Y.; Yan, F.S. Herbivore-induced volatiles and their roles in plant defence. Acta Entomol. Sin. 1998, 41, 204–214. [Google Scholar]
Sample Availability: Samples of the agarwood are available from the authors.
Figure 1. Overlapping GC-MS chromatogram for A. sinensis at pre- and post-induction by formic acid (FA) stimulation combined with F. sp. A2 inoculation at different time points. S1–S3: Before induction; S4–S6: 2 months after induction; S7–S9: 4 months after induction; S10–S12: 6 months after induction; S13–S15: 8 months after induction; S16–S18: 10 months after induction; S19–S21: 12 months after induction.
Molecules 22 00686 g001
Figure 2. Relative expression amount of chalcone synthase genes (CHS) from artificial agarwood induced by FA stimulation combined with F. sp. A2 inoculation at different time points. * Means statistical significance of the difference between induced A. sinensis and healthy A. sinensis (p < 0.05).
Molecules 22 00686 g002
Figure 3. Orthogonal partial least squares discriminant analysis (OPLS-DA) results of mass ions of 21 batches of agarwood samples. (A), Loading Bi plot (B), and S-plot from OPLS-DA (C).
Molecules 22 00686 g003
Table 1. Dynamic change of chromone compounds from A. sinensis pre- and post-treatment by FA stimulation combined with F. sp. A2 inoculation a.
No.RT bRI cChemical NameFormulaRelative Percentage Content/% (Sample Number of Each Compound Can Be Retrieved)
0 Month2 Months4 Months6 Months8 Months10 Months12 Months
A1169.69322972-(2-phenylethyl)chromoneC17H14O2--2.2000 1.0533 2.6300 4.1600 3.6667
A2178.1912423.66-hydroxy-2-(2-phenylethyl)chromoneC17H14O3--0.0433 0.3300 0.3533 0.4733 1.3867
A3184.572513.56-hydroxy-2-(2-phenylethyl)chromoneC17H14O3---0.3167 0.2700 0.6267 1.3100
A4189.1772578.46-methoxy-2-(2-phenylethyl)chromoneC17H14O3--1.8467 1.6767 6.9333 6.4700 5.8067
A5193.682641.86-methoxy-2-(2-phenylethyl)chromoneC17H14O3--0.3267 2.2867 2.6067 3.8633 3.1433
A6193.9082641.66-hydroxy-7-methoxy-2-(2-phenylethyl)chromoneC18H16O3--0.1200 -1.9733 0.2900 4.5767
A7200.4242736.96-hydroxy-2-(2-phenylethyl)chromoneC17H14O3---1.3733 5.0600 3.2133 4.8733
A8201.5062752.16-hydroxy-2-[2-(4'-methoxyphenyl)ethyl]chromoneC18H16O4---2.0500 1.3167 --
A9203.3942778.76-hydroxy-2-(2-phenylethyl)chromoneC17H14O3---0.6533 ---
A10203.4242779.15-hydroxy-6-methoxy-2-(2-phenylethyl)chromoneC17H14O3---0.2433 -0.6500 -
A11211.3552890.86-methoxy-2-[2-(3-methoxyphenyl)ethyl]chromoneC19H18O4--0.2500 0.6200 1.2767 0.8100 1.1600
A12214.7932939.26-methoxy-2-[2-(3-methoxyphenyl)ethyl]chromoneC19H18O4----0.6500 0.1833 -
A13216.2122959.26,7-dimethoxy-2-(2-phenylethyl)chromoneC19H18O4--1.9500 6.0767 12.6967 11.6833 13.2467
A14218.3732989.75,8-dihydroxy-2-[2-(4′-met hoxyphenethyl)]chromoneC18H16O5---2.9933 1.7667 1.0500 1.4100
A15220.0643013.56,8-dihydroxy-2-[2-(3′-methoxy-4′-hydroxyl phenylethyl)]chromoneC18H16O5---0.4733 0.9467 -0.4833
A16222.573048.86-hydroxy-7-methoxy-2-(2-phenylethyl)chromoneC18H16O3---1.5267 1.8400 2.3667 2.7067
A17228.3513130.26-hydroxy-2-[2-(4′-methoxyphenyl)ethyl]chromoneC18H16O4---0.7833 0.9000 -0.6900
A18233.7463206.26,8-dihydroxy-2-[2-(3′-methoxy-4'-hydroxyl phenylethyl)]chromoneC18H16O5--0.03-1.0700 --
A19262.1323606.16,8-dihydroxy-2-[2-(3′-methoxy-4′-hydroxyl phenylethyl)]chromoneC18H16O5---0.3867 --0.4100
Relative percentage content of total chromonetration (n = 3) --6.767 ± 2.3022.84 ± 6.6042.29 ± 3.5235.84 ± 10.2744.87 ± 19.44
a Identification was made according to comparison of resolved mass spectra with those of standards in the Mass Library Database. b Retention time. c Retention index. - Not detected in the sample.
Table 2. Dynamic change of sesquiterpene compounds from A. sinensis pre- and post-treatment by FA stimulation combined with F. sp. A2 inoculation a.
No.RT bRI cChemical NameFormulaRelative Percentage Content/ % (Sample Number of Each Compound Can Be Retrieved)
0 Month2 Months4 Months6 Months8 Months10 Months12 Months
A2030.4111575.4Isoaromadendrene epoxideC15H24O--0.8900 0.5267 0.2433 0.2733 0.2233
A2133.981620.6Aromadendrene oxide-(1)C15H24O--0.5067 0.1200 -0.0300 0.0467
A2234.7361628.4AgarospirolC15H26O--1.0733 0.0633 -0.0333 0.3200
A2336.2341644GuaiolC15H26O--2.9500 0.6400 0.0933 0.2100 0.2567
A2441.0981694.6SantalolC15H24O--0.1533 0.0767 -0.1500 0.0667
A2542.3731705.4Aromadendrene oxide-(2)C15H24O--0.1167 0.0967 0.0767 --
A2643.7361715.32-(4a,8-Dimethyl-1,2,3,4,4a,5,6,7-octahydro-naphthalen-2-yl)-prop-2-en-1-olC15H24O--0.2500 0.4567 0.0433 0.2200 0.1233
A2746.3841734.4LongipinocarvoneC15H22O--0.3733 0.4733 0.0733 0.0200 -
A2846.7191737GermacroneC15H22O--0.2767 0.4067 0.2267 0.1533 0.1000
A2947.541742.8ViridiflorolC15H26O--0.9233 0.4233 0.0800 0.1933 -
A3049.7431758.7γ-Gurjunenepoxide-(2)C15H24O--0.7100 0.2233 0.0467 --
A3158.1581817.5BaimuxinalC15H24O2--4.5400 2.5200 0.3733 1.7333 1.5033
A3267.8061865.4LongifolenaldehydeC15H24O--0.8233 0.3467 0.1133 1.1700 0.2367
A3381.6321927.4Eudesma-5,11(13)-dien-8,12-olideC15H20O2--1.6833 -1.0867 1.5867 4.0500
A3481.9391928.6VelleralC15H20O2----5.9500 -3.8500
A3589.4781957VellerdiolC15H24O2--3.4367 -0.3567 0.1700 0.3100
A36100.9032000.16-(1-Hydroxymethylvinyl)-4,8a-dimethyl-3,5,6,7,8,8a-hexahydro-1H-naphthalen-2-oneC15H22O2--2.8433 2.5167 ---
Relative percentage content of total sesquiterpenetration (n = 3)--21.55 ± 3.638.890 ± 2.468.763 ± 1.565.943 ± 1.7311.09 ± 9.45
a Identification was made according to comparison of resolved mass spectra with those of standards in the Mass Library Database. b Retention time. c Retention index. - Not detected in the sample.
Table 3. Correlative analysis between expression of CHS genes and accumulation of chromone compounds a.
A1A2A3A4A5A6A7A8A9A10A11A12A13A14A15A16A17A18A19
CHS1Pearson correlation0.3720.922 **0.873 *0.2610.3380.870 *0.467−0.229−0.074−0.2610.426−0.3380.4360.1650.2010.5360.358−0.2750.749
Bilateral significance0.4670.0090.0230.6170.5120.0240.350.6630.8890.6180.40.5120.3870.7550.7030.2730.4850.5980.087
CHS2Pearson correlation0.498−0.0020.1680.3230.518−0.3120.055−0.291−0.1080.953 **0.013−0.0420.246−0.06−0.4880.342−0.492−0.327−0.266
Bilateral significance0.3150.9970.7510.5330.2920.5480.9180.5760.8390.0030.980.9380.6390.910.3260.5070.3220.5270.61
a Statistic significance was determined by the Pearson correlation analysis with the SPSS software (20.0). A1–A19 from Table 1. ** Means significantly correlated at 0.01 level (double side). * Means significantly correlated at 0.05 level (double side).
Table 4. Correlative analysis between expression of CHS genes and accumulation of sesquiterpene compounds a.
A20A21A22A23A24A25A26A27A28A29A30A31A32A33A34A35A36
CHS1Pearson correlation−0.174−0.1560.079−0.174−0.038−0.39−0.065−0.266−0.243−0.331−0.257−0.036−0.2380.821 *0.347−0.165−0.229
Bilateral significance0.7420.7670.8820.7420.9430.4450.9030.6110.6420.5210.6240.9460.650.0450.50.7550.662
CHS2Pearson correlation−0.111−0.188−0.242−0.1840.576−0.4280.195−0.243−0.114−0.063−0.2520.030.786−0.004−0.433−0.203−0.238
Bilateral significance0.8350.7220.6440.7270.2310.3970.7110.6430.830.9050.630.9550.0640.9940.3910.6990.649
a Statistic significance was determined by the Pearson correlation analysis with the SPSS software (20.0). A20–A42 from Table 2.* Means significantly correlated at 0.05 level (double side).

