Mechanism Exploration of Arylpiperazine Derivatives Targeting the 5-HT2A Receptor by In Silico Methods
by
Feng Lin
1,2, 
Feng Li
3,
Chao Wang
2,
Jinghui Wang
2,
Yinfeng Yang
2,
Ling Yang
4 and
Yan Li
1,2,* 1
Key Laboratory of Xinjiang Endemic Phytomedicine Resources, Pharmacy School, Shihezi University, Shihezi 832002, Xinjiang, China
2
Key Laboratory of Industrial Ecology and Environmental Engineering (MOE), Faculty of Chemical, Environmental and Biological Science and Technology, Dalian University of Technology, Dalian 116024, Liaoning, China
3
Department of Civil Engineering, Henan Institute of Engineering, Zhengzhou 451191, Henan, China
4
Institute of Interdisciplinary Integrative Medicine Research, Shanghai University of Traditional Chinese Medicine, Shanghai 201203, China
*
Author to whom correspondence should be addressed.
Molecules 2017, 22(7), 1064; https://doi.org/10.3390/molecules22071064
Submission received: 21 April 2017
/
Revised: 23 June 2017
/
Accepted: 23 June 2017
/
Published: 26 June 2017
(This article belongs to the Special Issue Biomolecular Simulations)
Abstract
:As a G-protein coupled receptor, the 5-hydroxytryptamine 2A (5-HT2A) receptor is known for its critical role in the cognitive, behavioural and physiological functions, and thus is a primary molecular target to treat psychiatric diseases, including especially depression. With purpose to explore the structural traits affecting the inhibitory activity, currently a dataset of 109 arylpiperazine derivatives as promising 5-HT2A antagonists was built, based on which the ligand-based three-dimensional quantitative structure-activity relationship (3D-QSAR) study by using both comparative molecular field analysis (CoMFA) and comparative molecular similarity indices analysis (CoMSIA) approaches was carried out. The resultant optimal CoMSIA model displays proper validity and predictability with cross-validated correlation coefficient Q2 = 0.587, non-cross-validated correlation coefficient R2ncv = 0.900 and predicted correlation coefficient for the test set of compounds R2pre = 0.897, respectively. Besides, molecular docking was also conducted to investigate the binding mode between these ligands and the active site of the 5-HT2A receptor. Meanwhile, as a docking supplementary tool to study the antagonists’ conformation in the binding cavity, molecular dynamics (MD) simulation was also performed, providing further elucidation about the changes in the ligand-receptor complex. Lastly, some new molecules were also newly-designed based on the above results that are potential arylpiperazine antagonists of 5-HT2A receptor. We hope that the present models and derived information may be of help for facilitating the optimization and design of novel potent antagonists as antidepressant drugs as well as exploring the interaction mechanism of 5-HT2A antagonists.
1. Introduction
Cognitive inflexibility, the inability spontaneously to sustain, withhold, or modify adaptive behavior in response to varying situational demands, is correlated with diverse psychiatric disorders, including especially depression, schizophrenia and obsessive-compulsive disorders [1]. As a matter of fact, cognitive dysfunction seems to be an independent and core domain of depression which may lead to low functioning level and reduced life quality of depression patients [2]. The disease it leads to, i.e., depression (notably major depression), threats the health of approximately 121 million people and thus is among the top five primary causes of disease and disability burden all over the world [3,4]. In fact, across the lifespan, the onset and process of depression are usually influenced by stressful life events that include loss, threat, defeat, or humiliation [4]. Some 2–5% of the US population suffer from severe forms of depression, and milder forms of the disease affect up to 20% of the population [5]. Besides, cognitive dysfunction is also recurrent, life threatening (because of the risk for suicide), and a leading cause of morbidity throughout the world [5]. Therefore, pharmacologic drugs are becoming widely desirable for treating psychiatric disorders.
Over the past few decades, the synaptic actions of monoamine neurotransmitters including serotonin (SER, 5-HT) and norepinephrine (NE) were recognized as crucial evidences to psychiatric disease [3]. 5-HT, binding to a G-protein coupled receptor (GPCR), takes part in various aspects of physiology, behavior and cognition [6]. More importantly, it is also involved in the pathogenesis of diverse diseases ranging from psychiatric disorders like depression to neurological disorders such as Alzheimer’s disease (AD) [6]. Actually, 5-HT receptors are widely considered as primary targets for cognitive enhancement in psychiatric disease [7]. Indeed, the outstanding efficacy of present atypical antipsychotics on aspects of attention including vigilance and to a degree executive functioning in psychiatric disease patients may be partly due to their indirect or direct effects on 5-HT2A receptors [7]. Factually, in the treatment of negative symptoms, the blockade of 5-HT2A receptors or the preferential blockade of particular subtypes of dopamine receptors was always assumed to be a relative mechanism for the efficiency of atypical antipsychotics [8]. And, it is also suggested that the antagonism of 5-HT2A receptor is important for the clinical result and profile of the prototype of atypical antipsychotic agent [9]. Besides, evidence also supports the hypothesis that 5-HT2A signaling is a significant factor in cognitive function [10]. Consequently, the 5-HT2A receptor has already become the focus of extensive studies as a target to treat psychotic disorders [11].
Recently, the development of the serotonin antagonist/reuptake inhibitors (SARIs) has become a direction in treating depressive disorders due to the effective modulation of SARIs on the 5-HT level. Clinically, several SARI drugs for the 5-HT2A have been applied, such as ritanserin, YM992, M100907, LY367265 and nefazodone. Among them, ritanserin, as the first 5-HT2A receptor antagonist, has been found to have high antipsychotic activity [8,12]. Actually, it not only improves the negative symptoms when added to neuroleptics in hospitalized patients with primarily negative symptoms, but also reduces the extrapyramidal side effects when added to routine antipsychotics [8]. Moreover, some studies also found that ritanserin also disrupts potential inhibition via preexposure [8]. As to YM992, it is a novel selective 5-HT reuptake antagonist that possesses 5-HT2A-inhibitory properties and enhances 5-HT neurotransmission after long-term administration, which may contribute to outstanding antipanic and antidepressant activities by directly blocking the 5-HT reuptake and 5-HT2A receptors [13]. With regard to M100907, it is a highly selective 5-HT2A receptor antagonist with superior affinity for 5-HT2A receptor, eliciting a positive response in a lot of preclinical paradigms designed to test antipsychotic activity [11]. As to LY367265, it shows higher affinity for 5-HT2A receptor and 5-HT transporter than the clinically potent antidepressant, nefazodone [14]. Furthermore, the advantages of nefazodone include not only reducing the possibility of sexual dysfunction or sleep disturbance, but also treating those patients who didn’t respond to other antidepressants [15].
Despite of the usefulness on antipsychotics, these agents however still have certain side effects, including the constipation, anxiety, nausea, hopelessness and even liver failure [3,14]. And some problems about long onset time and poisoning symptom are also waiting for solution. Therefore, the exploration of more potent and safer drugs is still a necessity. Presently, a series of SARIs synthesized through molecular structure modification based on above drugs exhibited a selective and effective activity against 5-HT2A, with an IC50 value as low as 5.17 nM for the most potent compound [3]. In light of these compounds, it appears of interest to apply the ligand-based drug design techniques to explore the structural factors of these 5-HT2A antagonists, which may be of help for discovery of novel efficacious anti-5-HT2A drugs.
With the rapid development of computer technology, chemical biology, and molecular biology, computer simulation technology plays an prominent role in the growth of new agents [16,17]. As known to all, computer-aided drug design (CADD) can greatly raise the efficiency of developing and designing novel drugs, and thus has been used more and more diffusely in present pharmaceutical industry [18,19]. In fact, CADD approaches, like especially the 3D-QSAR, molecular docking, molecular dynamics (MD), homology modeling and pharmacophore mapping techniques, have been vastly conducted in the optimization and development of inhibitors [20,21], in which 3D-QSAR modeling has proven its efficiency in exploring the pharmacological properties of the studied molecules in modern drug discovery [22,23]. Especially, 3D-QSAR methods including comparative molecular field analyses (CoMFA) [24] and comparative molecular similarity indices analyses (CoMSIA) [25] have been successfully utilized to obtain insights into the structural requirements that affect their biological activity for many series of molecules, such as heteroarylnitrile, 1,7-diazacarbazole and peptidomimetic derivatives as falcipain-2, checkpoint kinase 1 and 3C-like protease inhibitors, respectively [16,17,26]. In this study, we employed a sets of CADD approaches, including CoMFA and CoMSIA analyses, molecular docking and MD simulation with purpose to (1) probe the crucial structural factors of arylpiperazine scaffold-based potent 5-HT2A antagonists [3]; (2) understand the probable binding modes at the amino acid residue level; (3) further elucidate the changes in the ligand-receptor complex embedded into the lipid bilayer; (4) design several new potential arylpiperazine antagonists of 5-HT2A receptor based on the above results. The obtained findings can not only guide rational structural modification and design of novel and more potent 5-HT2A antagonists, but also offer some reference for experiment study.
2. Materials and Methods
2.1. Data Set and Biological Activities
After eliminating those compounds with unspecified antagonistic activity, a total of 109 arylpiperazine derivatives targeting 5-HT2A receptor were used as a dataset with their biological activities (IC50 values) taken from the same source [3]. For improving the normal distribution of the experimental data points, the activities of all the molecules were converted into consistent pIC50 (−logIC50) values (ranging from 5.995 to 8.287), which were used as the dependent variables in the QSAR regression analysis. In an approximate ratio of 3:1, the compounds were separated into a training (82 compounds) set to construct 3D-QSAR models and a test (27 compounds) set to validate the models. To ensure that the predictive power of the models be effectively evaluated, the selection of the test set molecules follows the rule that their pIC50 values are randomly but uniformly distributed in the range of the values of the entire set. All information of the 109 molecules used in this work is provided in supporting information Table S1, where sixteen representative molecules with structures and IC50 values are shown in Table 1.
2.2. Molecular Modeling and Alignment
All 3D-QSAR and molecular studies were conducted by Sybyl 6.9 package (Tripos Associates, St. Louis, MO, USA). Partial atomic charges were calculated by using the Gasteiger-Hückel method [27], and then the conformer of each compound was energy-minimized using the Tripos molecular mechanics force field [28] and the Powell conjugate gradient minimization algorithm with the convergence criterion set to 0.05 kcal·mol−1·Å−1 to ensure the stability of the conformation.
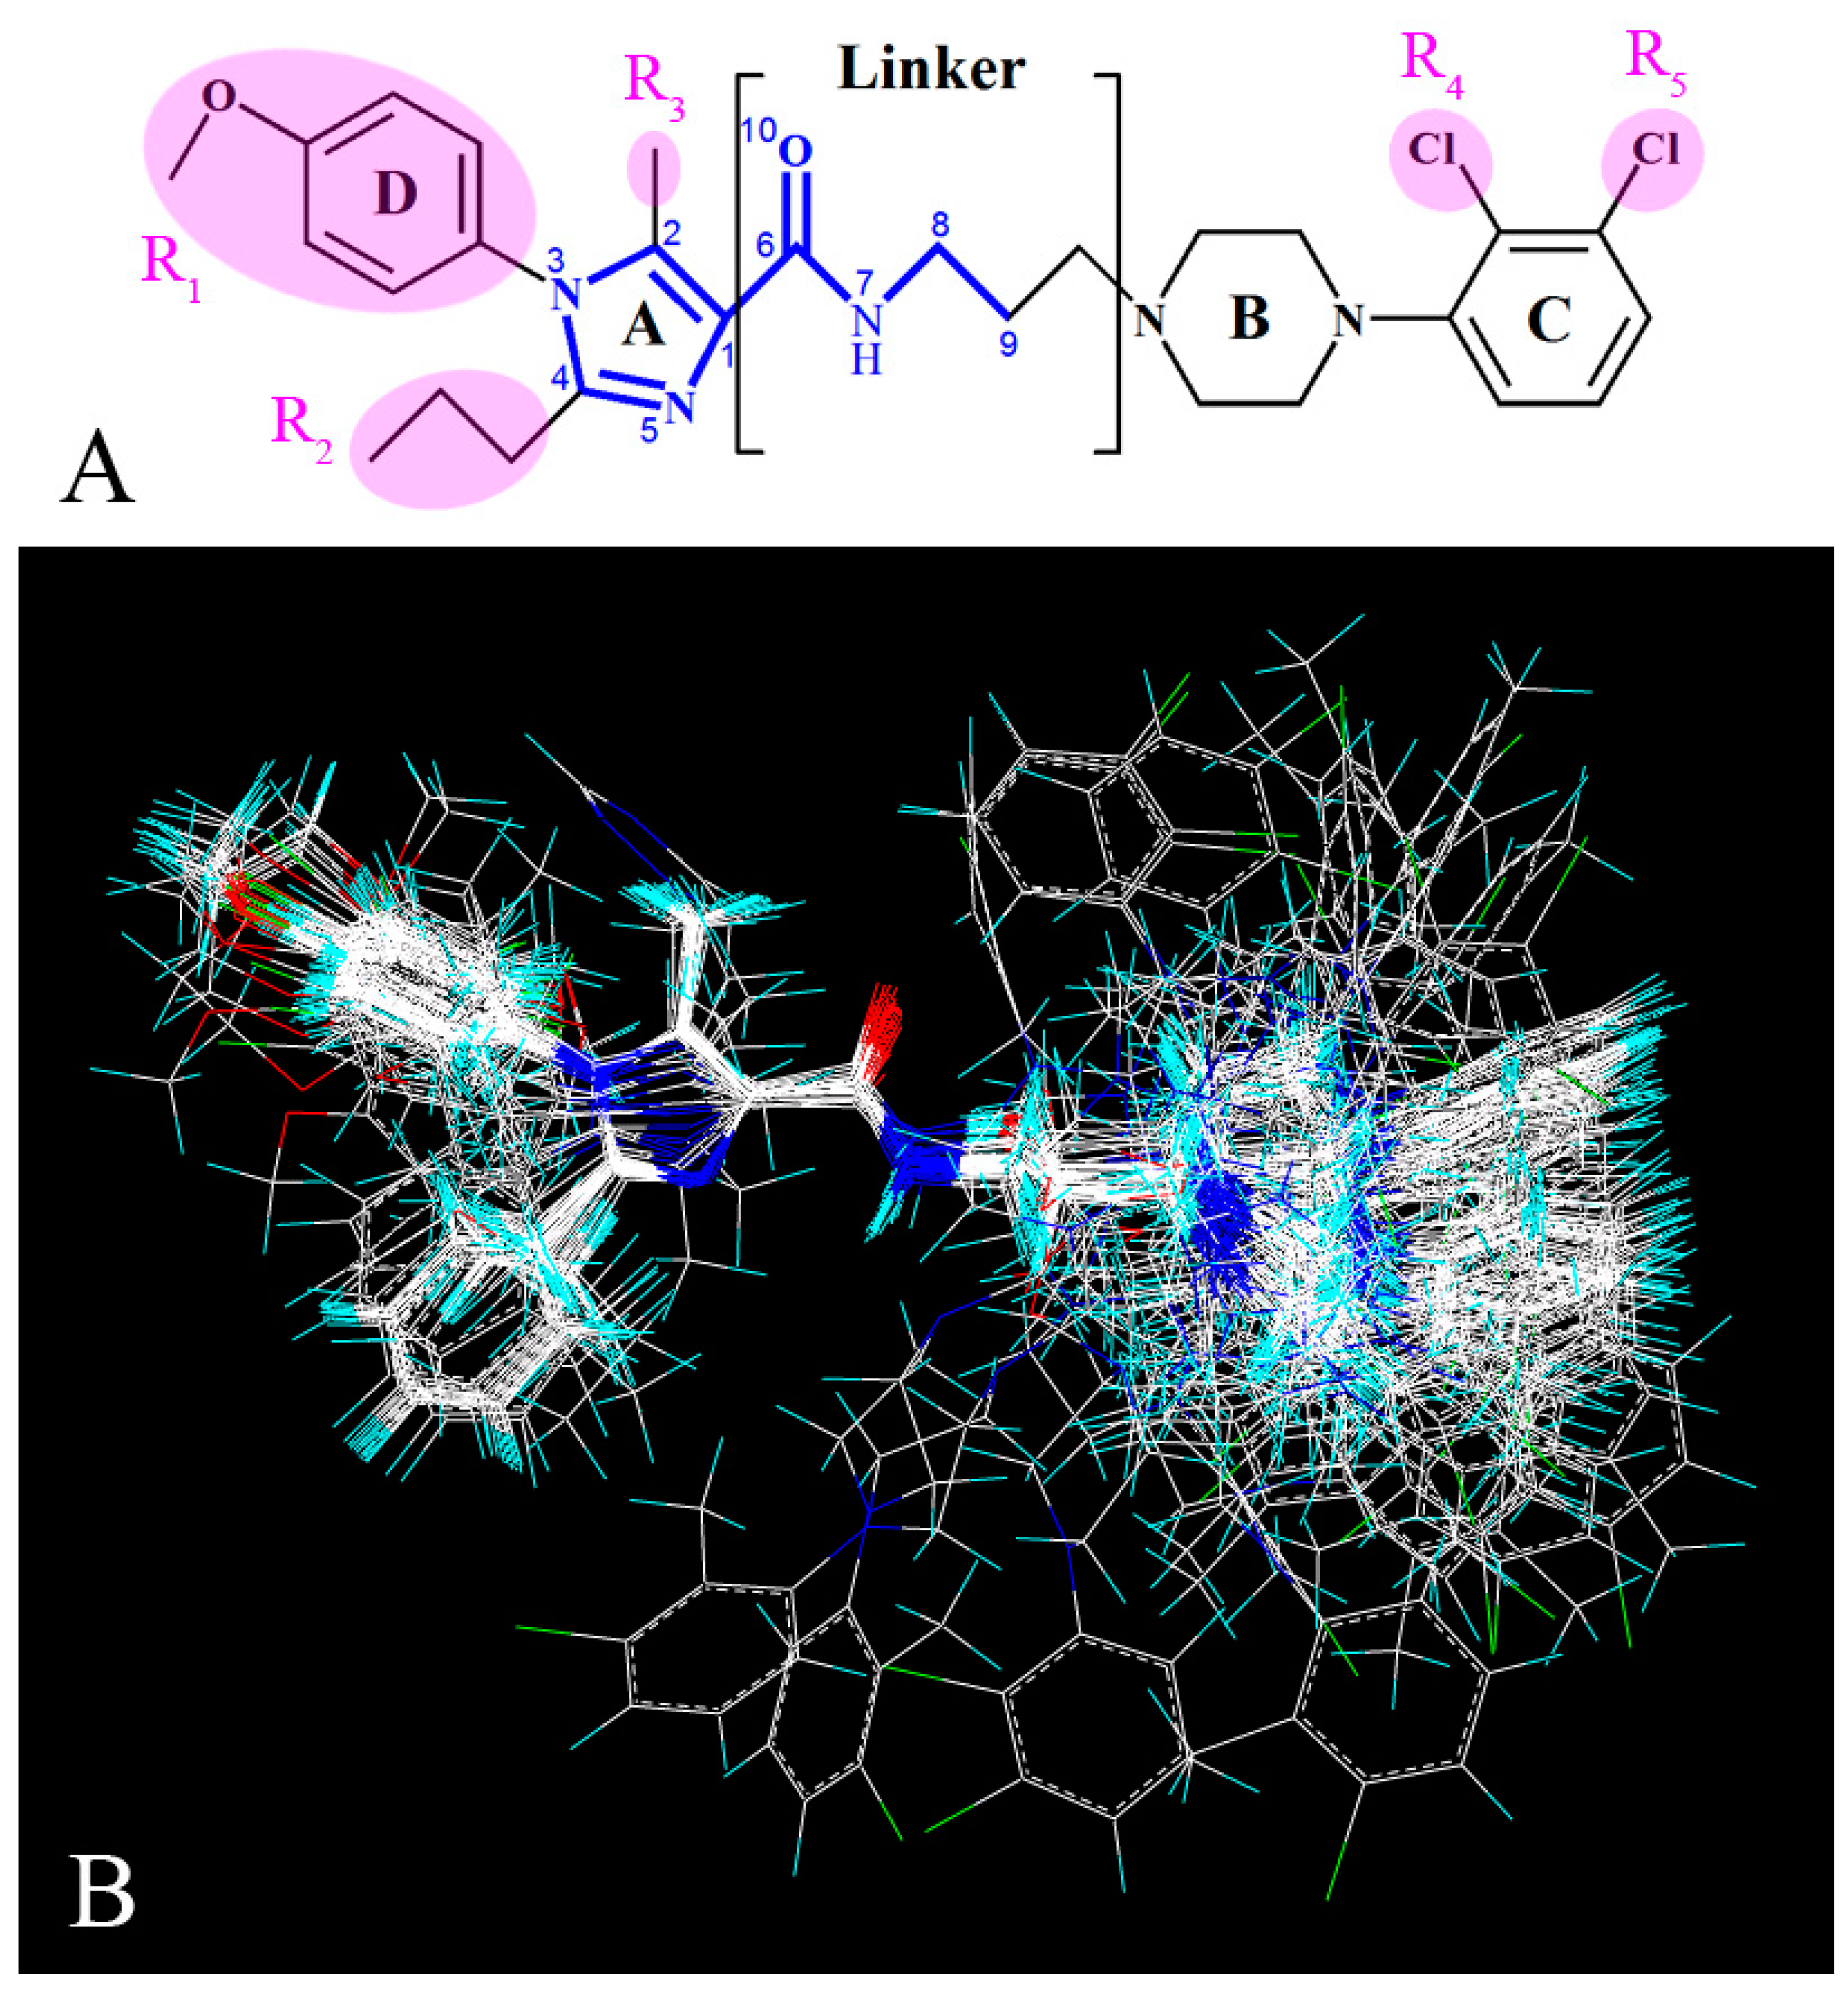
Since in 3D-QSAR studies, the most critical step is the molecular alignment [29], presently all 3D-QSAR statistical models were constructed based on the alignment of all the molecules, and compound 13 was chosen as the template due to its most potent activity in the data set. All the molecules were fitted into the template using the “Align Database” command in Sybyl. The common skeleton in the molecular superimposition is displayed in bold in Figure 1A,B depicts the resultant model.
2.3. CoMFA and CoMSIA Studies
To analyze the quantitative relationship between 3D structural features and the biological activity for a set of molecules, CoMFA and CoMSIA analyses were utilized for these antagonists after conformational alignment. All superimposed molecules were placed in a 3D lattice with spacing of 2.0 Å. CoMFA fields including the steric and electrostatic fields were generated by using sp3 C-atom probe with a formal charge of +1.0 at each lattice point and a van der Waals (vdW) radius of 1.52 Å [30]. And both the steric and electrostatic fields were calculated by CoMFA standard method with energy cut-off values of 30.0 kcal·mol−1 [31]. CoMSIA is, though, an extension of CoMFA, it also includes extra hydrophobic, hydrogen bond (H-bond) donor and H-bond acceptor descriptors besides the steric and electrostatic descriptors. CoMSIA similarity index descriptors were derived by the same lattice boxes as those used in CoMFA calculations. And five different similarity descriptors were calculated by using a probe atom of charge +1.0, radius 1.0 Å. A Gaussian function was used to evaluate the mutual distance between each molecule atom and the probe atom, with no cut-off limits in CoMSIA study.
In order to obtain statistically significant 3D-QSAR models and to analyze the relationship between their biological activities and the variations in CoMFA-CoMSIA interaction energies, partial least-squares (PLS) regression analyses were conducted [32,33]. PLS can reduce an originally large number of descriptors to some principal components which are linear combinations of the initial descriptors [34]. In the present study, the CoMFA-CoMSIA descriptors were used as independent variables, while dependent variables were the pIC50 values. In PLS analysis, the leave one out (LOO) method that one molecule is removed from the data set and its activity is predicted by a model derived from the remainder of the data set, was used to evaluate the reliability of model by calculating the conventional correlation coefficient (Q2), the standard predicted errors (SEP) and the optimum number of components (ONC). The ONC was applied in the final non-cross-validation analysis, and the Pearson coefficient (R2ncv), standard error of estimate (SEE) and F value were calculated [34]. Q2 and R2ncv as statistical index of the model’s predictive power provide useful internal metrics based on the training set. To evaluate the COMSIA models’ predictive power, an independent test set was used. In the above study process, CoMSIA similarity indices, Q2 and the predicted R2 (R2pre) values were calculated according to formulas presented in our previous works [21,35,36]. Finally, all 3D-QSAR results were graphically shown by field contour maps with the field type “Stdev*Coeff”.
2.4. Molecular Docking
Molecular docking is the method used to explore the interaction between the receptor and its ligands. It may efficiently predict the potential ligand binding sites of the protein [37]. Presently, molecular docking analysis was performed with Gold (Genetic Optimization for Ligand Docking) 5.1 [38]. Due to that an accurate 3D structure of the receptor is essential for docking analysis, and until now an X-ray structure of 5-HT2A receptor is, yet, still unavailable, the homology modeling becomes a necessity in the present work. In addition, since, to our best knowledge, almost all (which is actually, 7 out of 9 as shown in Table 2) current crystal structures of 5-HT2A receptor built by homology modeling for further docking analysis were based on the structure of β2-adrenergic receptor as a template [39,40,41,42,43,44,45,46], for purpose of a well comparison with previously-reported docking studies of known 5-HT2A antagonists, the structure of 5-HT2A receptor we used presently still adopted the structure of β2-adrenergic receptor as the homology modeling’s template. Actually, this structure was built by Ísberg et al., where the 5-HT2A receptor model was constructed using the β2-adrenergic receptor (PDB entry 2RH1) as the main template, and then further modified to incorporate template features from the active G-protein-bound opsin crystal structure (PDB entry 3DQB) [47]. Using the protein structure as the template, hydrogen was added and the exogenous ligand was removed from the system. The probable binding conformation was then determined using the Gold suit. In fact, after a predocking process, the validated binding cavity was created by an automatic mode with specified atom coordinates. Thereafter, all compounds were docked into the binding cavity and 10 possible active docking conformations for each compound were obtained with different scores.
2.5. Molecular Dynamics
In order to obtain accurate model and to verify the docking result, MD simulation was carried out applying the GROMACS software package [48]. Since 5-HT2A receptor is a member of GPCR possessing seven transmembrane helices, the ligand-receptor complex was embedded into an explicit dioleoylphosphatidylcholine (DOPC) lipid bilayer to relax the system [49,50]. The lipid bilayer system was generated by the Membrane Builder tool in CHARMM-GUI [23,51]. Similar to experimental conditions, the system was solvated applying TIP3P water model and NaCl ions were added to reach zero charge [52]. The simulated system was firstly subjected to energy minimization without constraints using the steepest-descent algorithm and then the system was equilibrated at 300 K via 500 ps MD simulations. Finally, a 50,000 ps simulation was carried out to maintain the stability of the whole system with a time step of 2 fs. In this process, electrostatic interactions were calculated by the particle mesh Ewald (PME) method [53], and covalent bonds involving H-atoms were constrained by the linear constraint solver (LINCS) algorithm [54]. The cut-off distances for calculating vdW and Coulomb interactions were 1.4 and 1.0 nm, respectively. Both energy minimization and MD simulation were performed under periodic boundary conditions with temperature ensemble at 300 K and normal pressure. The temperature was kept constant using the Berendsen thermostat, and the isothermal compressibility value was set to 4.5 × 10⁻⁵ bar−1 while the pressure was maintained at 1.0 bar by the Parrinello-Rahman scheme [55].
3. Results
3.1. 3D-QSAR Statistical Analysis
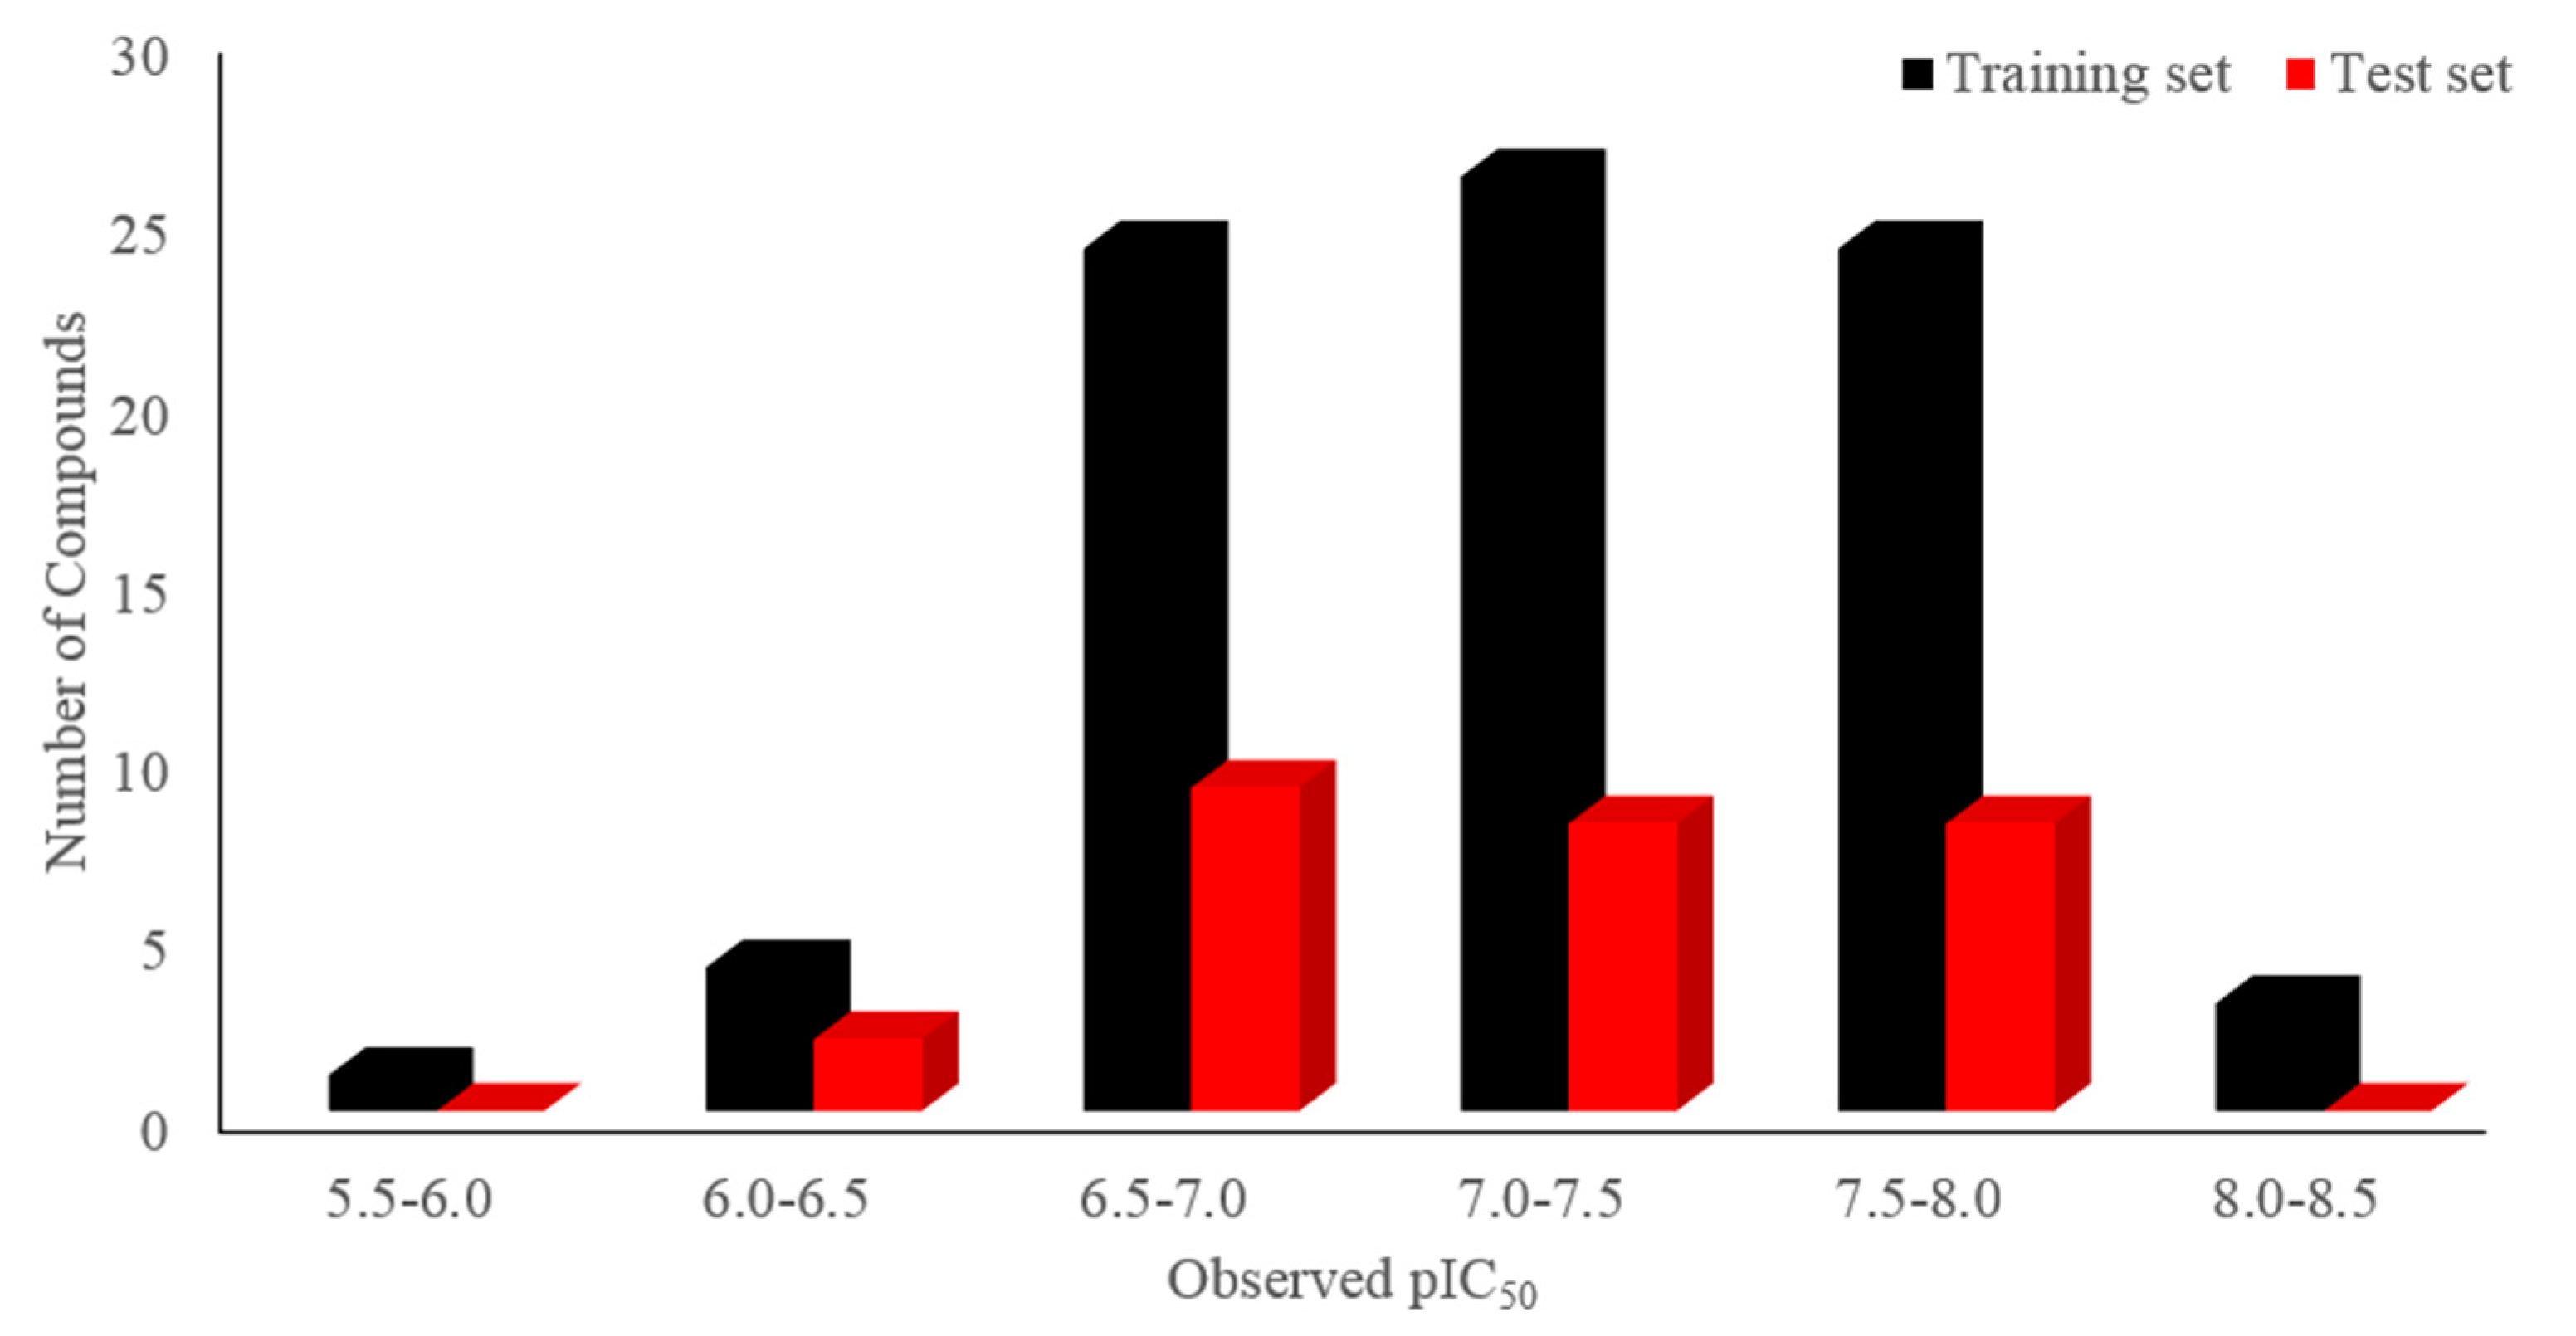
Molecular alignment is considered to be a prominent factor impacting the quality of the 3D-QSAR model [17], and the three-dimensional shape of the ligand influences greatly on its interaction with the acceptor, so the ligand-based alignment was applied here to superimpose all of the 109 compounds. The entire dataset was randomly separated into a training (82 compounds) set and a test (27 compounds) set. Figure 2 displays the distribution of the number of compounds versus their activities (pIC50) of the dataset, in which the training and the test sets are respectively colored as black and red. Then, the overlapped compounds in the same training set were employed for both CoMFA and CoMSIA analyses. For purpose of measuring the predictive ability of a model, PLS analysis and LOO cross-validation method were used. During the modeling process, all statistical parameters were analyzed to evaluate the reliability of the models, including the LOO cross-validated Q2, non-cross-validated R2ncv, R2pre for the test set of compounds, F-statistics, SEE, SEP and ONC. The obtained results of both CoMFA and CoMSIA models were listed in Table 3.
Generally, a Q2 value above 0.5 is regarded as a sign of admissible internal predictive ability. Besides, the high R2ncv and F but low SEE values are also expected for a reliable QSAR model [19]. In the present work, by means of PLS statistical analysis, the resultant CoMFA model obtained by using both the steric and electrostatic field descriptors is unsatisfied with Q2 value of 0.496, revealing a relatively poor internal predictability. On the other hand, five field descriptors of CoMSIA (steric, electrostatic, hydrophobic, H-bond donor and H-bond acceptor) and their every possible composition were applied to build models, respectively. Among the derived 31 models, the CoMSIA model built by the combination descriptors of the steric, electrostatic, H-bond donor and H-bond acceptor field descriptors is considered as the optimal one, which has a Q2 value of 0.587, a high R2ncv value of 0.900, a high F value of 94.879 and a low SEE value of 0.161 with 7 optimum components, implying a good internal predictability. And the relative contributions of the steric, electrostatic, H-bond donor and H-bond acceptor fields are 24.5%, 45.4%, 14.9% and 15.2% in turn. The higher contribution of the electrostatic field indicates that electrostatic feature plays more roles in the antergic activity for the series.
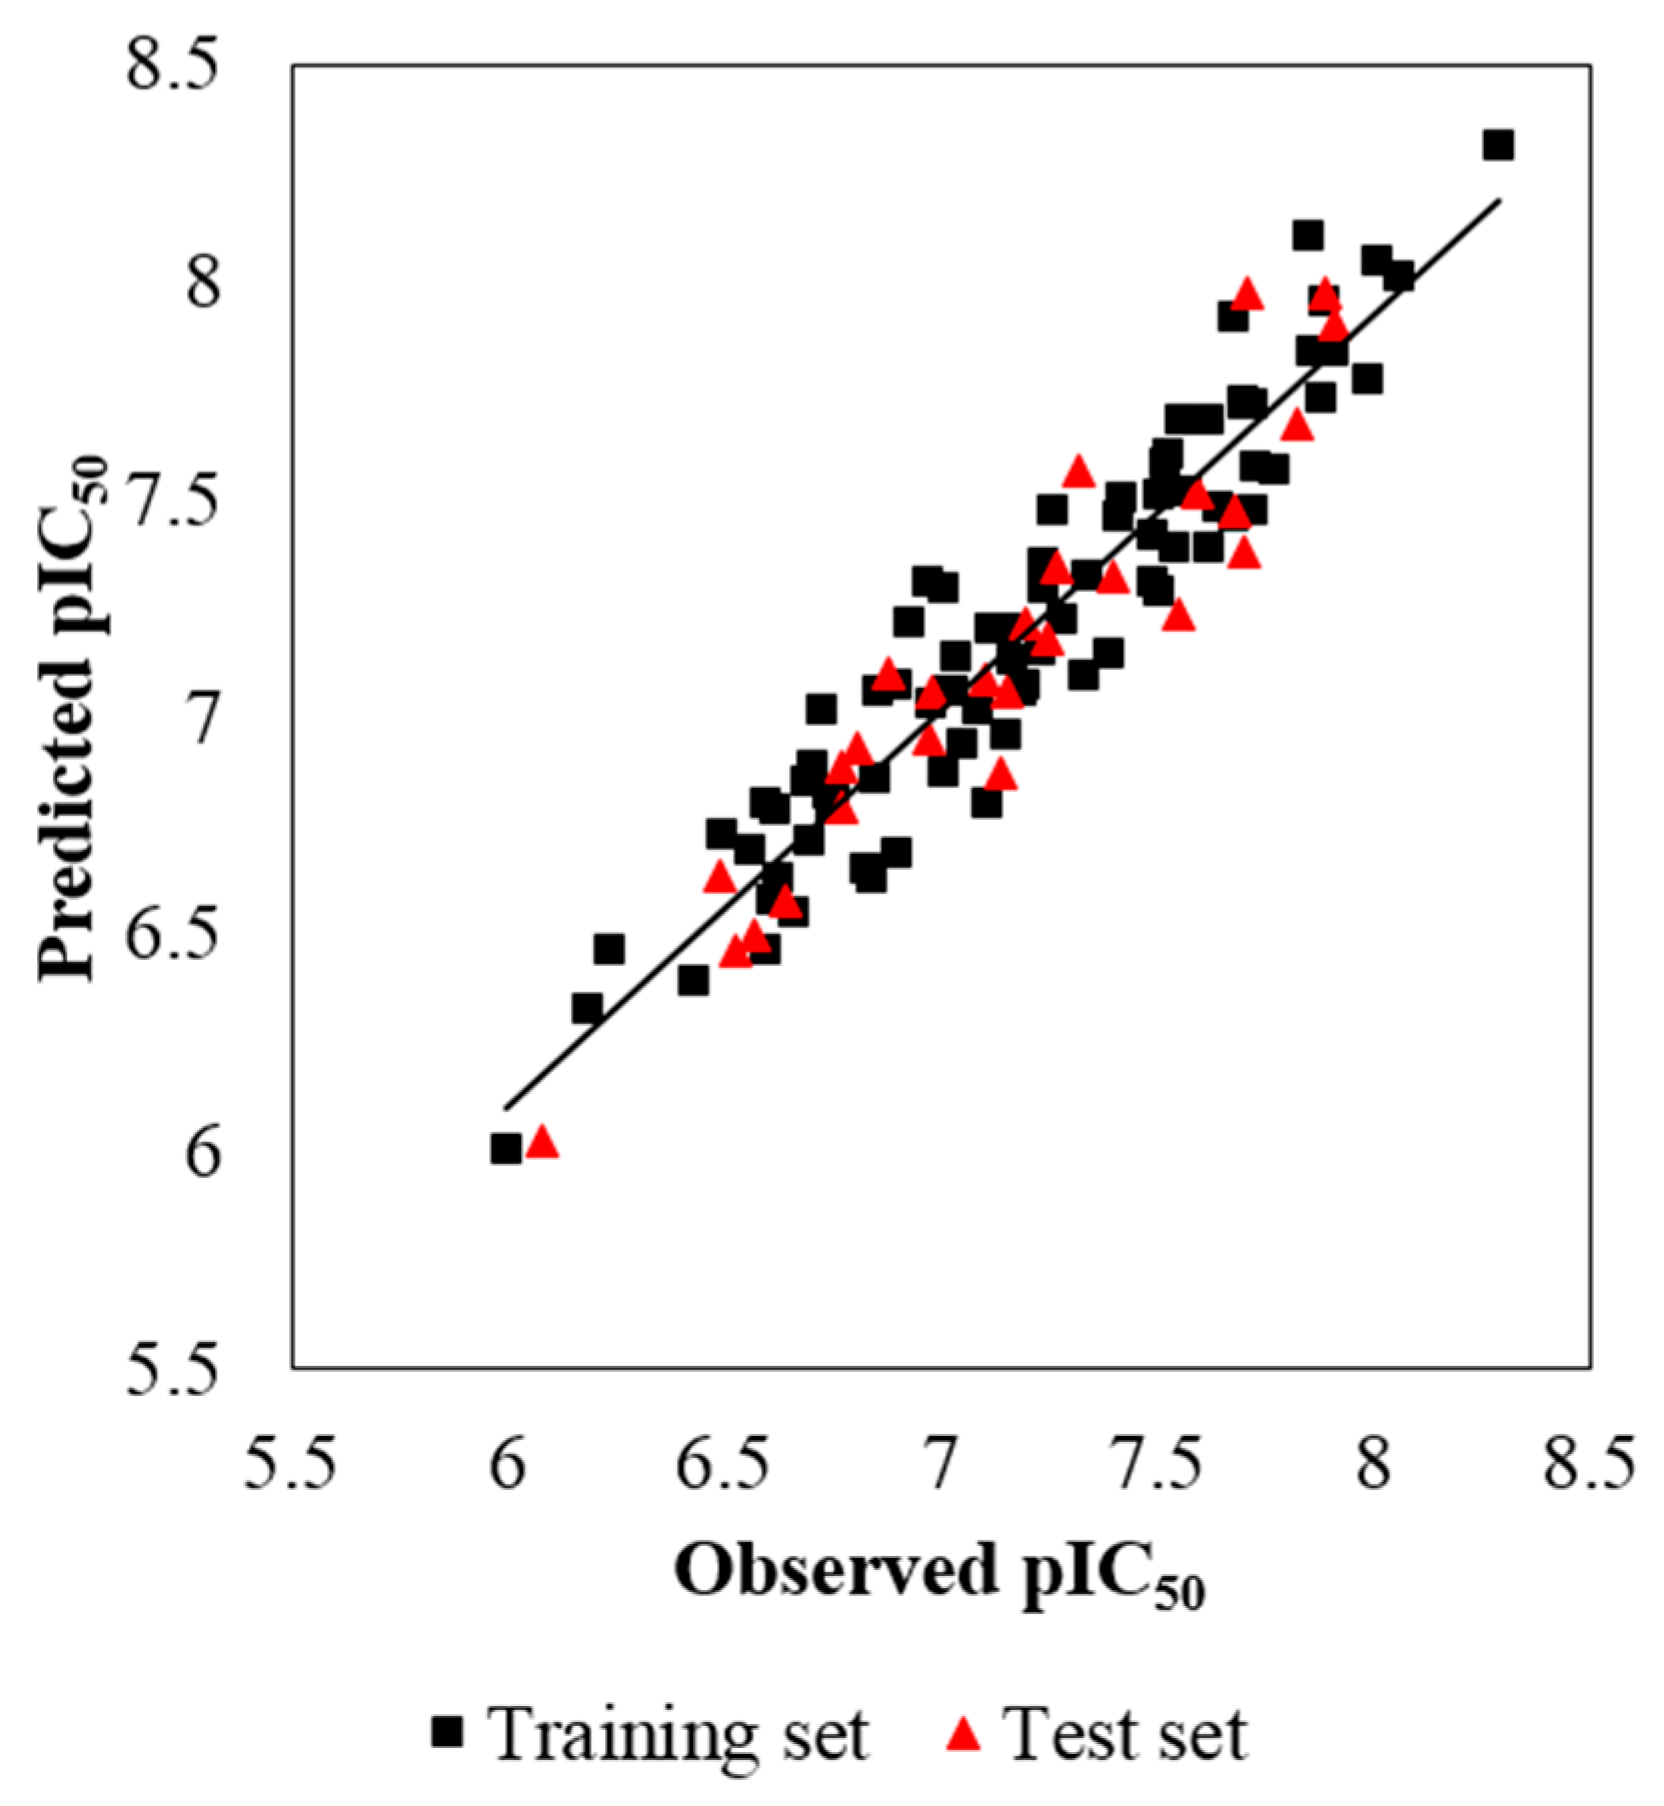
Some models are found to have admissible internal predictability but unfavorable external predictability [21]. Thus, the R2pre should also be considered for a reliable model. In this study, a test set of 27 compounds, representing 32.9% of the training set, was employed to validate the robustness of the models. In general, the R2pre above 0.6 is an acceptable standard [56]. The developed CoMSIA model gives a high R2pre value of 0.897, much higher than this criterion. Therefore, the CoMSIA model is selected as the optimal one, and its correlation for the whole dataset is described in both scatter plot (Figure 3) and radar plots (Figure 4). As we can see, all the data points distribute uniformly around the regression line in Figure 3, and the data lines overlap within the low deviation in both Figure 4A,B, which illustrate the good correlation of the predicted bioactivity data versus the experimental data, as well as the wonderful predictability and reliability of the obtained CoMSIA model.
3.2. CoMSIA Graphical Interpretation
The optimal CoMSIA model developed by steric, electrostatic, H-bond donor and H-bond acceptor field descriptors is further discussed here. And in order to facilitate the analysis, the most active compound 13 of the whole data set is depicted superimposed with the four fields respectively.
Figure 5A is the steric contour plot, in which the green and yellow isopleths representing 80% and 20% contribution levels each, implying the increased and decreased activity of molecules with the bulky groups, respectively. On one hand, the long green contour around R1 substituent position on imidazole ring (ring A) suggests that bulk group is preferred in this position for increasing the antagonistic activity. For example, compounds 21 (pIC50 = 8.064), 1 (7.509) and 9 (7.260) have similar structures except that their R1 groups are substituted separately by 2,3-dihydrobenzo[b][1,4]dioxine, benzene and cyclopentane, displaying the antagonistic activity reducing with the dimensional decrease in R1 group. In addition, there is another large green contour around the benzene ring (ring C) showing a steric favored region. Thus, the result occurs for compounds 25 and 24, in which 25 with methyl substituent at R5 position is more potent (pIC50 = 7.125) than compound 24 (6.812) with Cl-atom at the same location in activity. On the other hand, a medium sized yellow contour map appears at R2 position, revealing the disfavor of bulky group for the antagonistic activity. For instance, compound 48 (pIC50 = 7.420) is relatively more active than 50 (7.268) because the substituents of them are methyl and propyl groups, respectively. So is the pair of compounds 40 (pIC50 = 7.203) and 42 (7.150). Furthermore, another medium sized yellow contour shows below the piperazine ring (ring B), signifying that the introduction of bulky group to this position would lead to a decrease of the activity.
The electrostatic contour map is displayed in Figure 5B, where blue contours (80% contribution) account for electropositive favorable regions, but red contours (20% contribution) represent electronegative favorable ones. Two blue contours with medium size are observed near R3 position and ring B, which display the key role of these sites in electron-donating groups. Take compounds 51 and 52 for example, in which 51 with methyl group at R3 has higher activity (pIC50 = 7.509) than compound 52 (6.851) with H-atom at the same region. Moreover, there are four medium sized red electronegative regions stumbled on the R1, R2 positions and ring C, suggesting the favor for electron-withdrawing groups at this location. For example, compound 53 (pIC50 = 7.914) with R1 substituent of p-F-phenyl is more active than compound 32 (7.857) with substituent of phenyl, while compound 43 (7.678) with substituent of p-methoxyl-phenyl shows lower activity than 32 and 53. This could be explained that the F-atom has electron-withdrawing feature, while the methoxyl group has electron-donating character.
The H-bond donor contours overlapped on compound 13 are depicted in Figure 5C, where the cyan isopleths (80% contribution) indicate H-bond donors-preferred region, whereas the purple contours (20% contribution) imply H-bond donors-disfavored one. A large cyan contour near the linker chain reveals that H-bond donor substituents will promote the potency. It is observed that the linker position has the NH of amide group, indicating the important roles of the NH playing in donating H to form H-bond interaction with receptors. Actually, this big cyan contour is located around 5-position (N-atom) of ring A and 10-position (O-atom), which signifies the biological activity benefit from decreasing the polarizability of these N-atom and O-atom. Besides, purple contour is hardly found in Figure 5C, implies that the unfavorable H-bond donor interaction may be omitted. This is corresponds well with the experimental results that compounds 68 (pIC50 = 7.140) and 90 (7.106) with OH group on the linker chain are more active than unsubstituted molecules 23 (7.041) and 49 (6.928), respectively.
As shown in Figure 5D, the H-bond acceptor contour maps of the CoMSIA model represented by purple (80% contribution) and red (20% contribution) contours depict the H-bond acceptor substituents favored and disfavored regions, respectively. On one hand, three different sized purple contours are observed at ring A, which are consistent with the N-atoms at the 3,5-positions acting as H-bond acceptor. In addition, two other purple contours are observed above the 10-position (O-atom) and ring B, revealing that the introduction of H-bond acceptor groups to the positive influence would lead to a promotion of the inhibitory activity. On the other hand, a red contour appears at the 7-position of linker chain, implying that H-bond donors or no H-bond are preferred at this region. This can be illustrated by the N-atom at the 7-position of linker chain acting as H-bond donor, which is associated with Figure 5C.
3.3. Docking Results
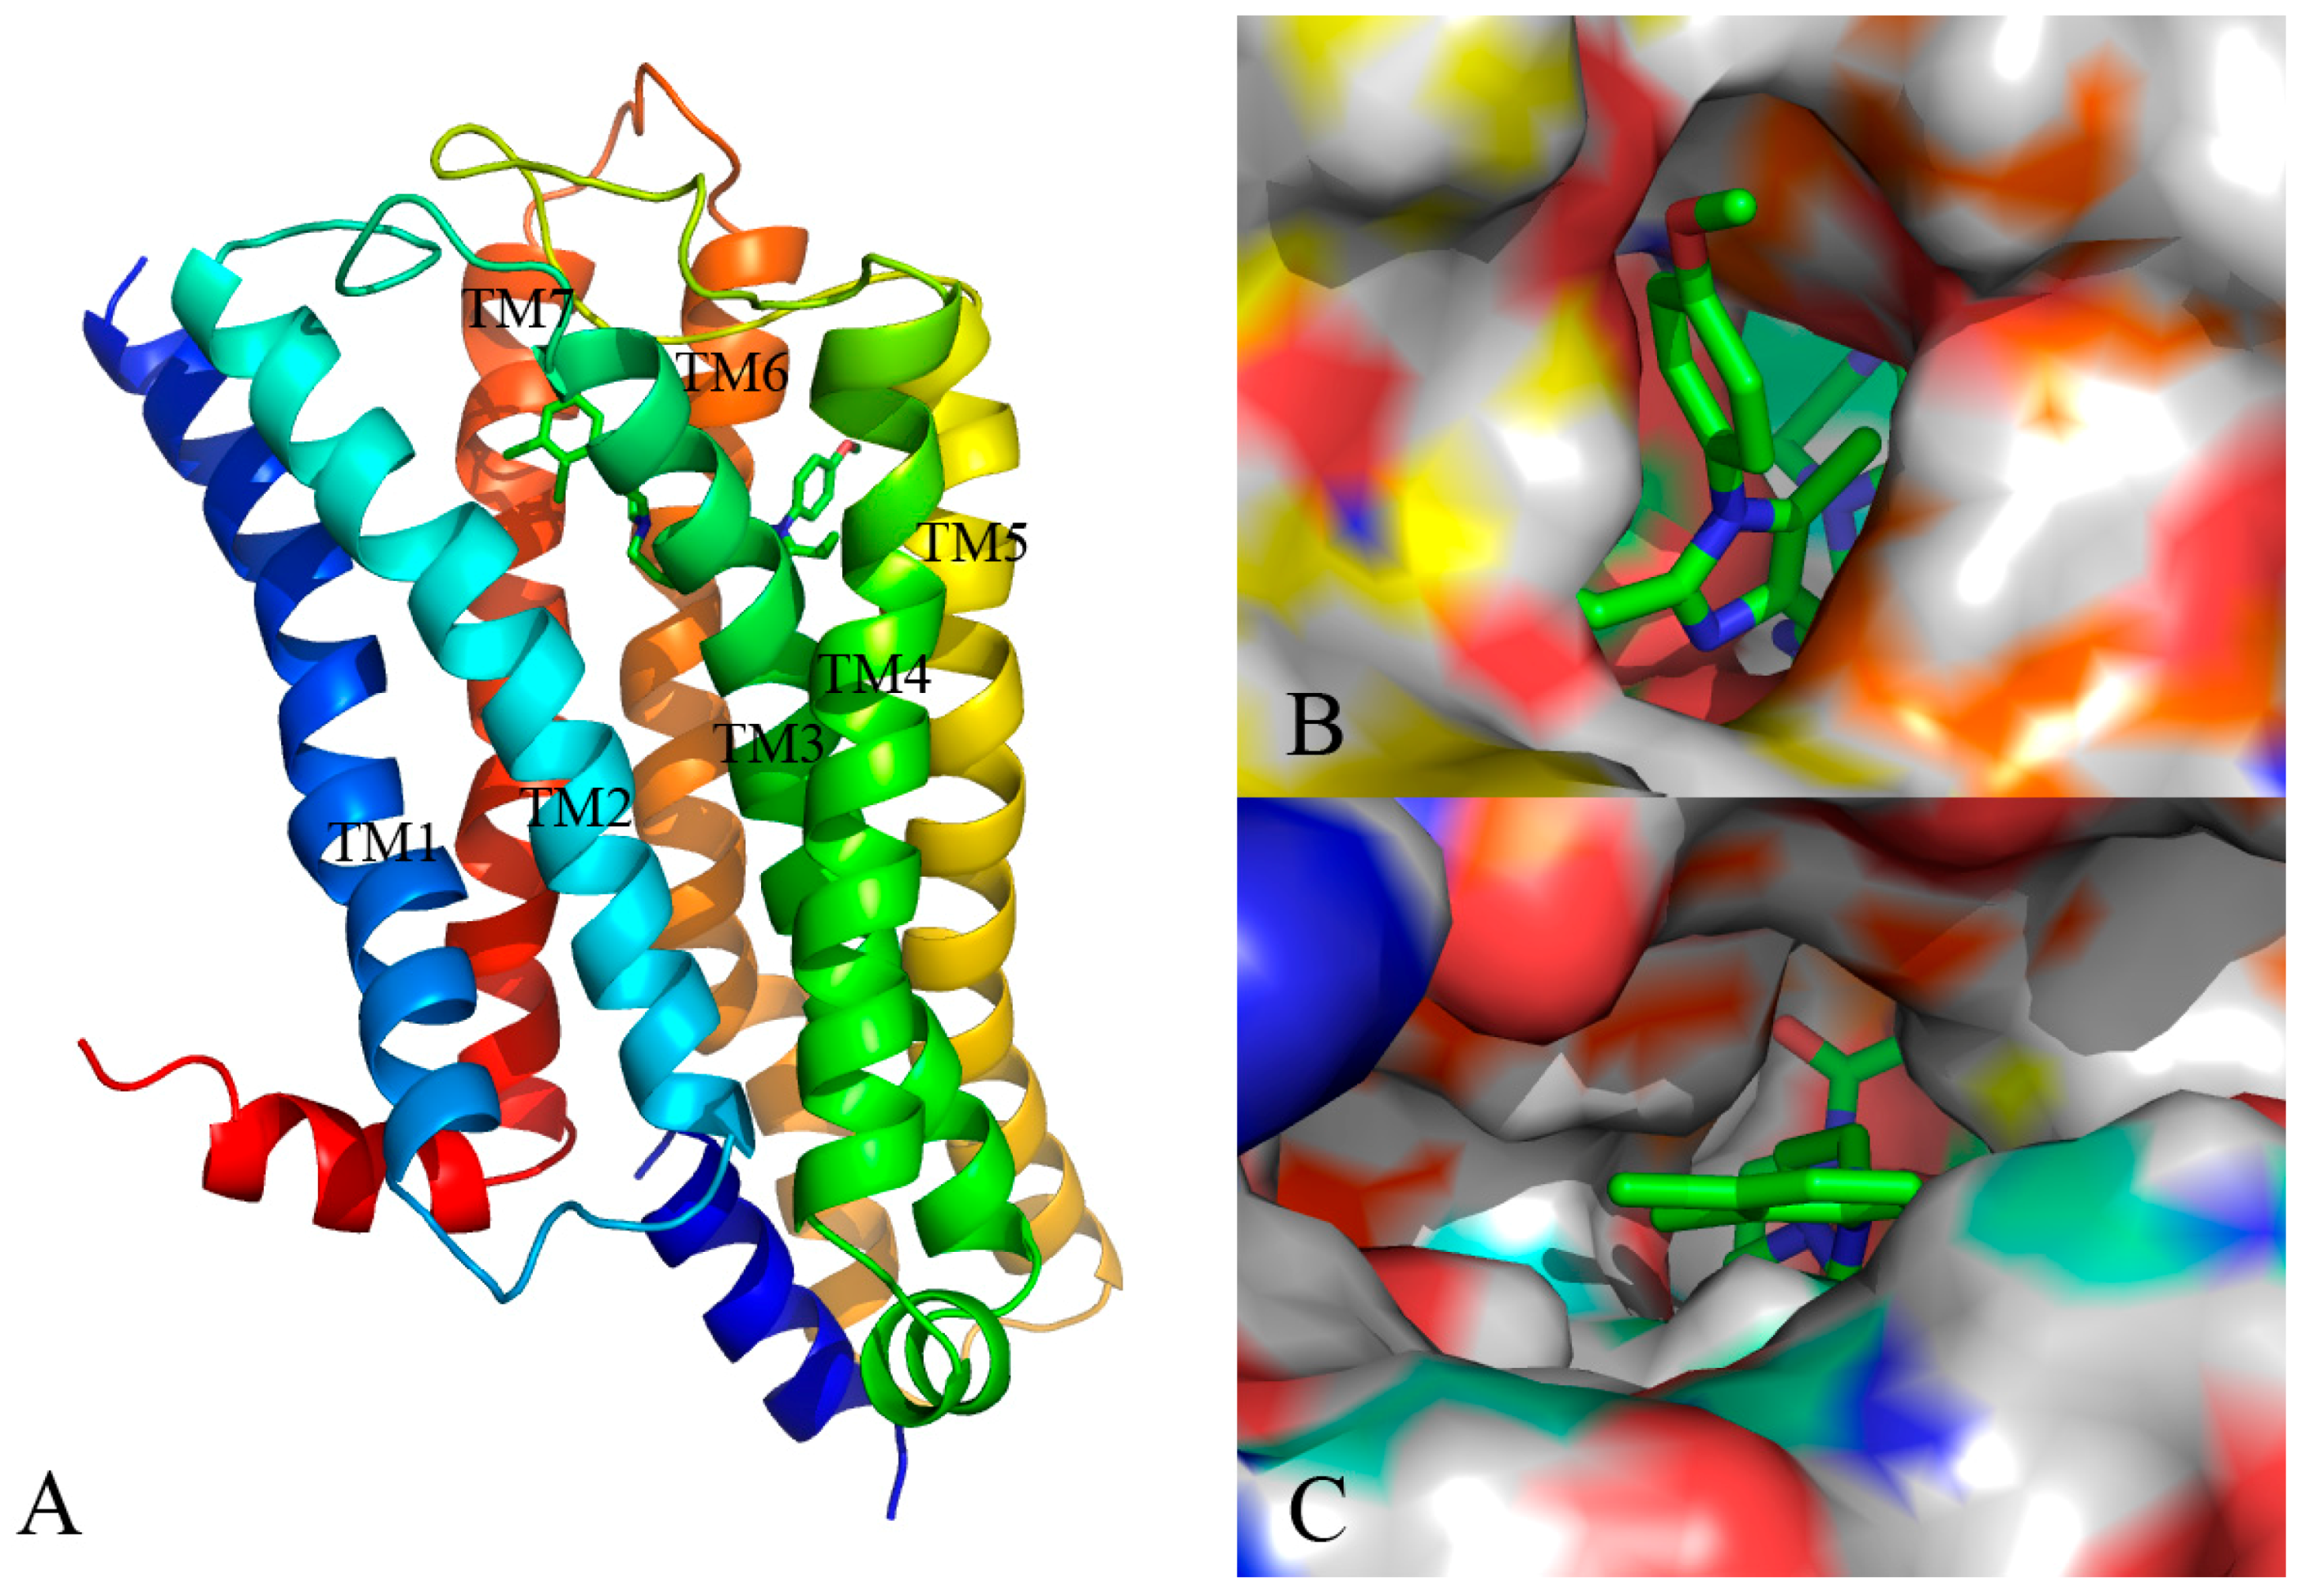
Docking simulation is often used in drug design to predict the optimal orientation of a ligand as well as to elucidate the interactive patterns between the ligand and its target protein [26]. In current work, a computational docking study was conducted and the most optimal conformation was determined by the GoldScore value. As seen from Figure 6, the binding pattern of the most efficacious compound 13 into the active site of the protein is shown.
As displayed in Figure 6A, the 5-HT2A receptor sequence is roughly composed of seven transmembrane helices (TM1–TM7), in which the binding site of the ligand-receptor complex is observed to be located among five transmembrane helices (TM2–TM3, TM5–TM7) and embedded within the upper half of the helical domain. As shown in Figure 6B,C, the ring A of compound 13 is located at the lateral entrance of this binding cavity, and the linker chain, rings B and C are tightly confined in the narrow top of the pocket taken shape by the receptor interface. Indeed, the scaffold of compound 13 is bent at the linker position, and strong interaction is formed between surrounding residues and the distorted ring B, implying the resistance encountered by ring B. Furthermore, ring C takes up sufficient room with near residues. Actually, in our previous contour distribution map (Figure 5A), the presence of a middle-sized yellow contour below ring B and a large green contour around ring C is in accordance with this docking result. Moreover, at the inlet location the p-methoxyl-phenyl is flexible to extend deeper into the pocket while the n-propyl taking up most of the narrow space around seems relatively steady, revealing that introduction of a bulky substituent around R1 and near R2 favors and disfavors the biological activity, respectively, which is also in agreement with the green and yellow contours along ring A as shown in Figure 5A.
A detailed inspection of the docked complex of 5-HT2A receptor reveals the ligand’s binding conformation and corresponding interaction mechanism as demonstrated in Figure 7, which depicts the constitution of the binding pocket, including all those significant residues as Trp151, Asp155, Ser159 and Phe340. Clearly, four factors, namely hydrophobic, H-bond, electronic and π-π stacking interactions, are observed contributing to the intimate interaction of the antagonist with the target receptor. As a matter of fact, among the 20 amino acid residues (within 4.5 Å distance from the ligand) of the interface, hydrophobic residues account for about two-thirds proportion, which help induce the active conformation of antagonists. For example, ring C occupies a hydrophobic pocket consisting of Val127, Trp151, Cys227, Leu228, Leu362 and Val366, so the hydrophobic interaction plays an important role there. Meanwhile, the three hydrophobic phenylalanine residues (Phe234, Phe243 and Phe340) near R1 group of ring A imply bulky groups favorable of this region, which is in accordance with the results of Figure 5A. Furthermore, at the corner of the pocket, both hydrophobic and hydrophilic resides (Leu123, Asp155, Val156, Ser159 and Phe339) locate around the linker chain. In this area, the O-atom of the amide forms one H-bond with the side chain of Ser159 (–O···HO–, 3.58 Å), and the NH forms another H-bond with the side chain of Asp155 (–NH···O–, 2.43 Å). This is well consistent with the presence of the large cyan and the small purple contours above the linker chain in Figure 5C,D. At the same time, the electropositive N-atom of ring B interacts with the electronegative O-atom of Asp155 (–N···O–, 2.60 Å), which corresponds well with the medium-sized blue contour near the ring B as shown in Figure 5B. Besides, the residues Trp151 and Phe340 respectively form edge-to-face π-π stacking and face-to-face π-π stacking interactions with ring C and ring A, which are also helpful in anchoring antagonists in the cleft.
To look at Figure 7 as a whole, compound 13 inserts into the protein chain like an expansive “V”, which is composed of two (right and left) branches and one vertex corner. The right branch of the “V” firstly extends to a hydrophobic cage and is further anchored by a π-π stacking with Trp151. Then, the corner of “V” made of linker chain is fixed by H-bonds with Asp155 and Ser159, and is bent to fit for the electronic interaction with residue Asp155. Finally, ring A, together with its three substitutional groups constitutes the left branch, which stretches to the cavity and is grabbed by the π-π stacking with residue Phe340. All in all, the π-π stacking, H-bond, electronic and hydrophobic interactions mentioned above altogether form the active conformation of compound 13. Furthermore, the results generated by both docking and 3D contour maps are complementary and validated each other, revealing that the QSAR model is rational and could provide a lot of useful information for designing novel long chain arylpiperazine derivatives as 5-HT2A antagonists.
3.4. Molecular Dynamics Studies
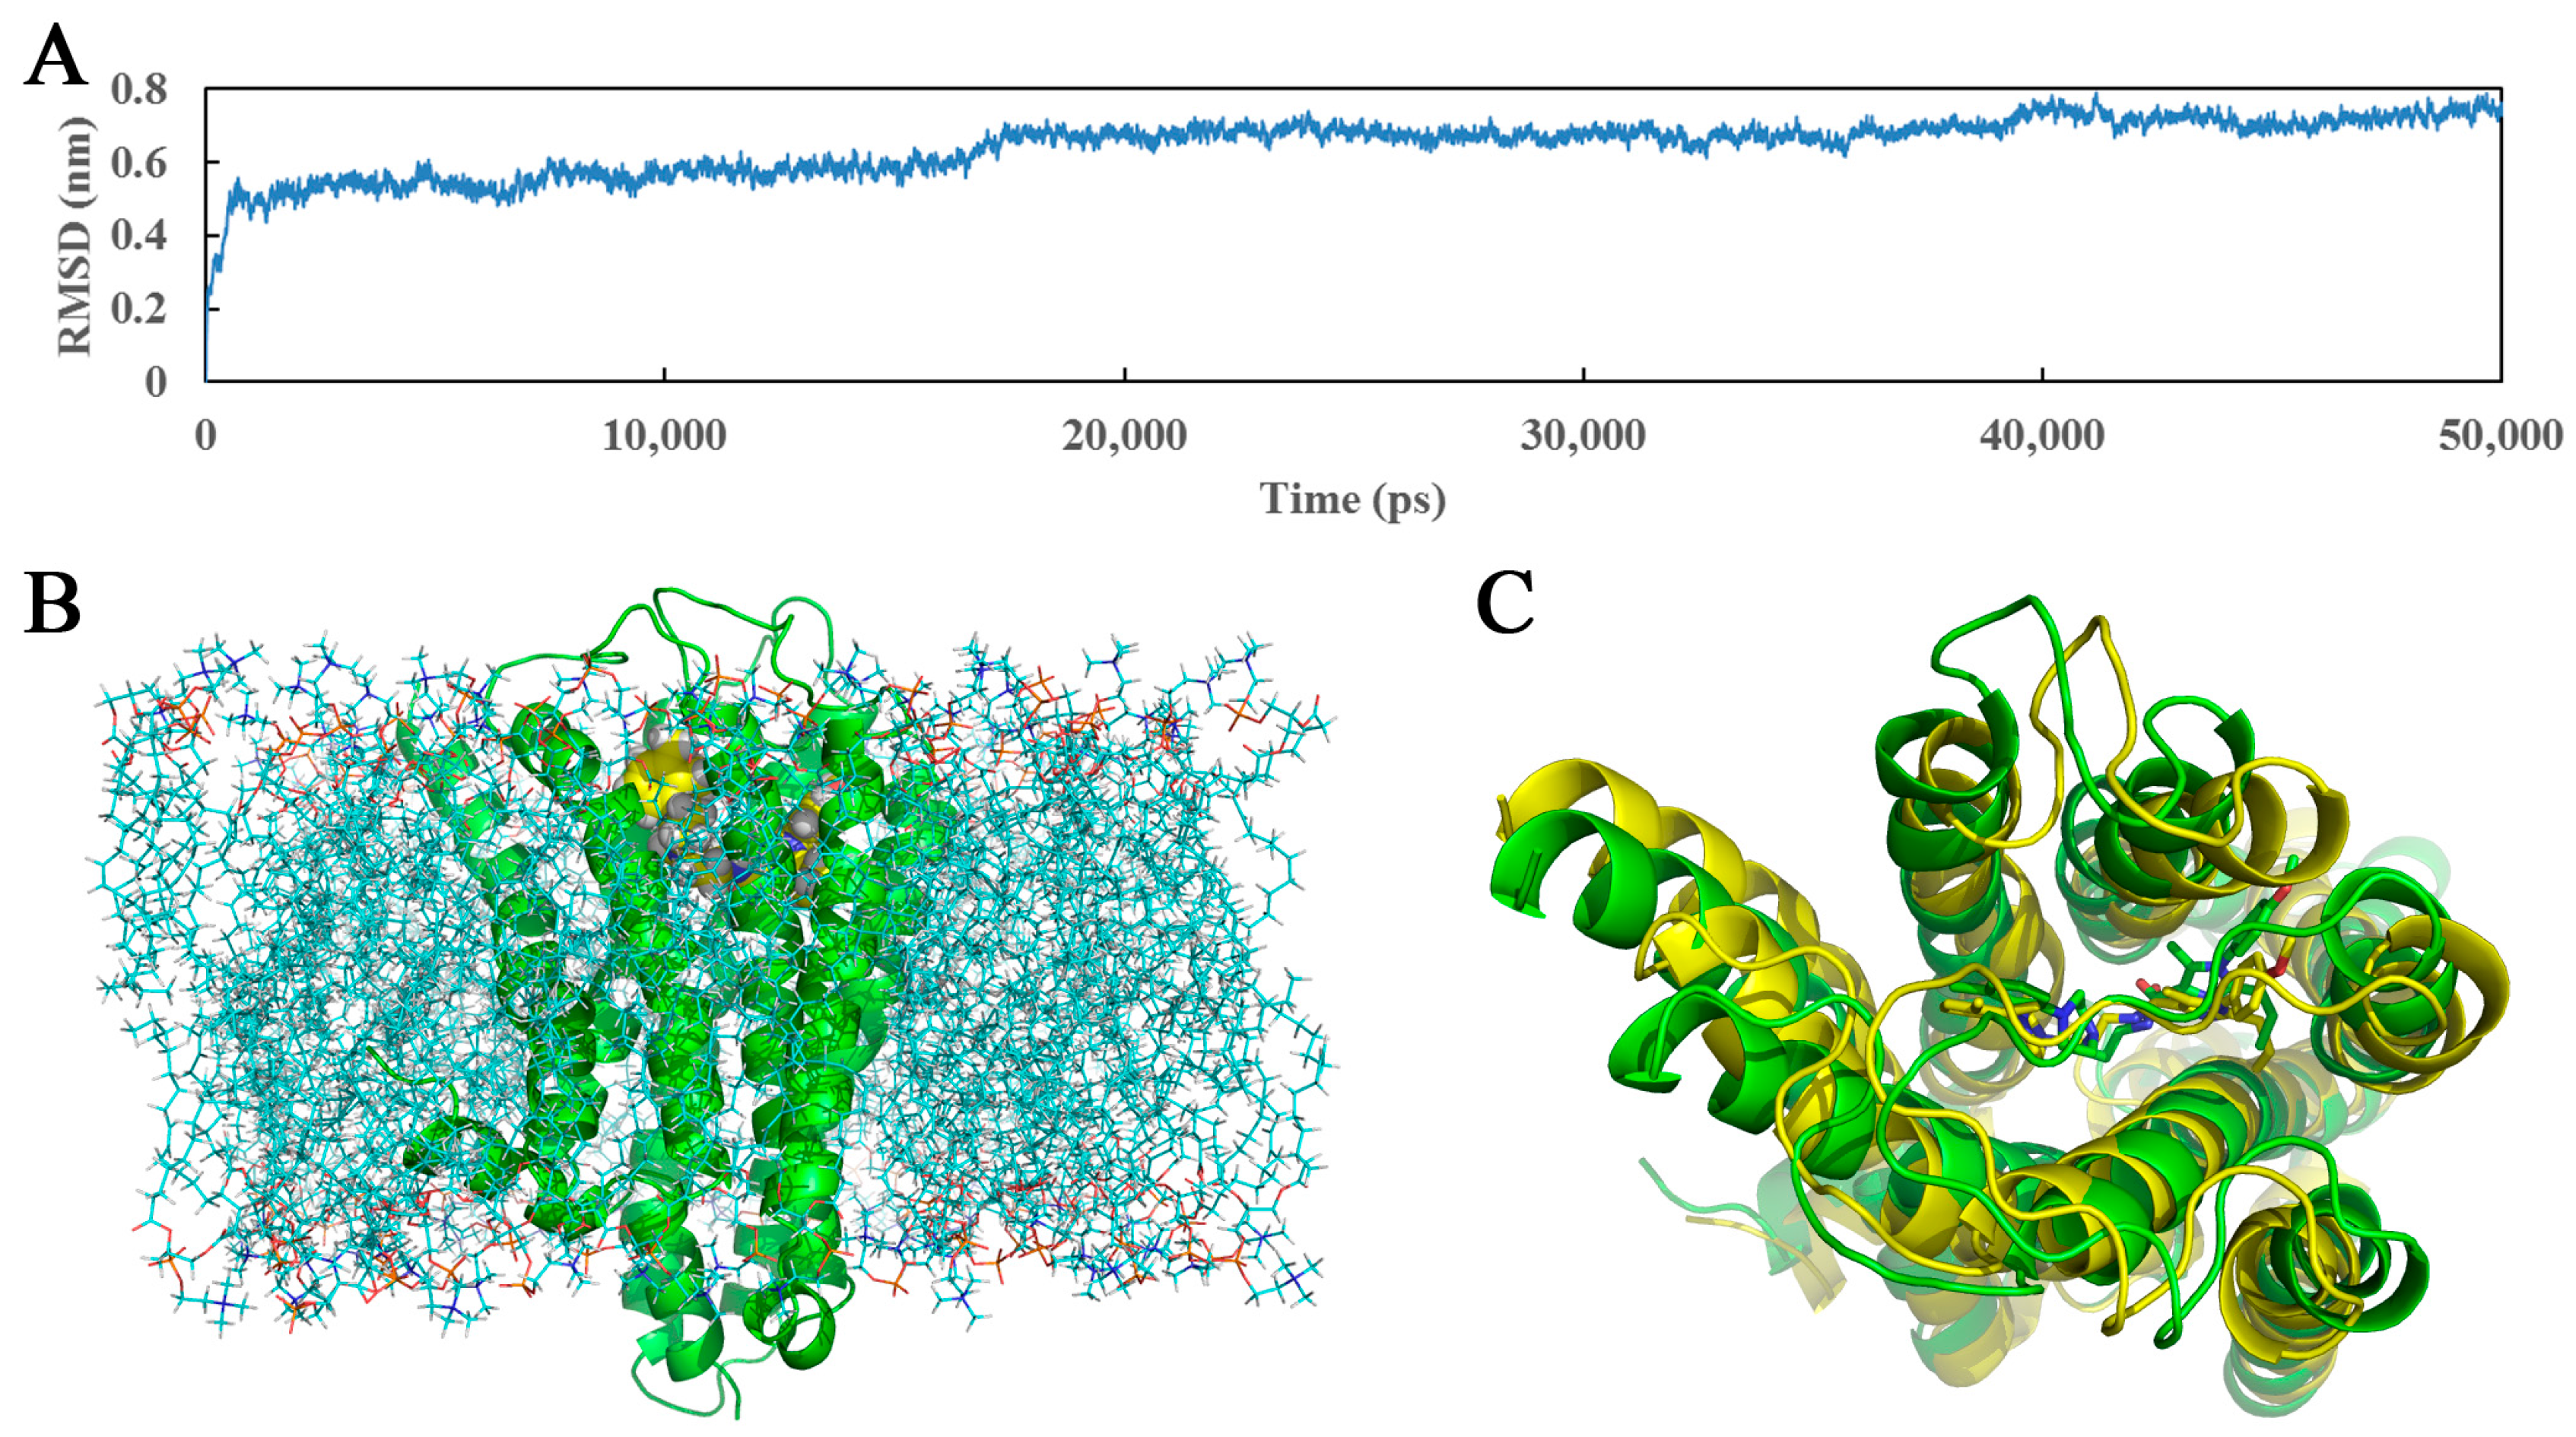
Unlike molecular docking, which regards proteins as relatively rigid structures and neglects their conformational flexibility, MD simulations computationally probe the dynamics and structure of biological macromolecules and seem more reliable with a view to the protein flexibility, providing the atomic-level changes of the docked complex structure [57,58]. In this work, the docked complex of 5-HT2A receptor as starting molecular structure was further used to undertake a 50,000 ps MD simulation in a DOPC lipid bilayer to explore the dynamical image of the conformational diversity of the ligand binding to the receptor. The snapshot of the system after 50,000 ps MD simulations is shown (Figure 8B). For ensuring the rationality of the sampling method and exploring the dynamic stability of the ligand-protein system, root-mean-square deviation (RMSD) was calculated as a geometric measure of the conformational alterations from the initial structure, ranging from 1.1 to 8.0 Å in Figure 8A. It is clearly observed that the RMSD of the system retains around 7.2 Å after the initial 17,000 ps of free equilibration and reaches this converged stage throughout the following simulation, indicating the equilibrated conformation of the docked complex structure. Generally, compared with the use of a single crystal structure, the adoption of the MD average structure is considered more helpful and reliable [59]. Thus, presently Figure 8C is drawn to display the average structure (yellow) of the last 10,000 ps in the MD simulation superposed by the initial docked structure (green), and the initial and the final average structures of compound 13 are depicted in green and yellow sticks, respectively.
As noticed in Figure 8C, the average structure derived from MD simulation is in well agreement with the docked model of the complex, which validates the rationality of the docking model. Whereas, a slight conformational deviation that the ring A of MD average structure extends a little more expansively than that of the docking ligand, is also observed. In view of the possible interaction variation between compound 13 and 5-HT2A receptor derived from the variety and mobility of the complex system when compared with the docking results, the binding mode extracted from the MD simulation was also investigated in terms of π-π stacking, H-bond and hydrophobic interactions as shown in Figure 9.
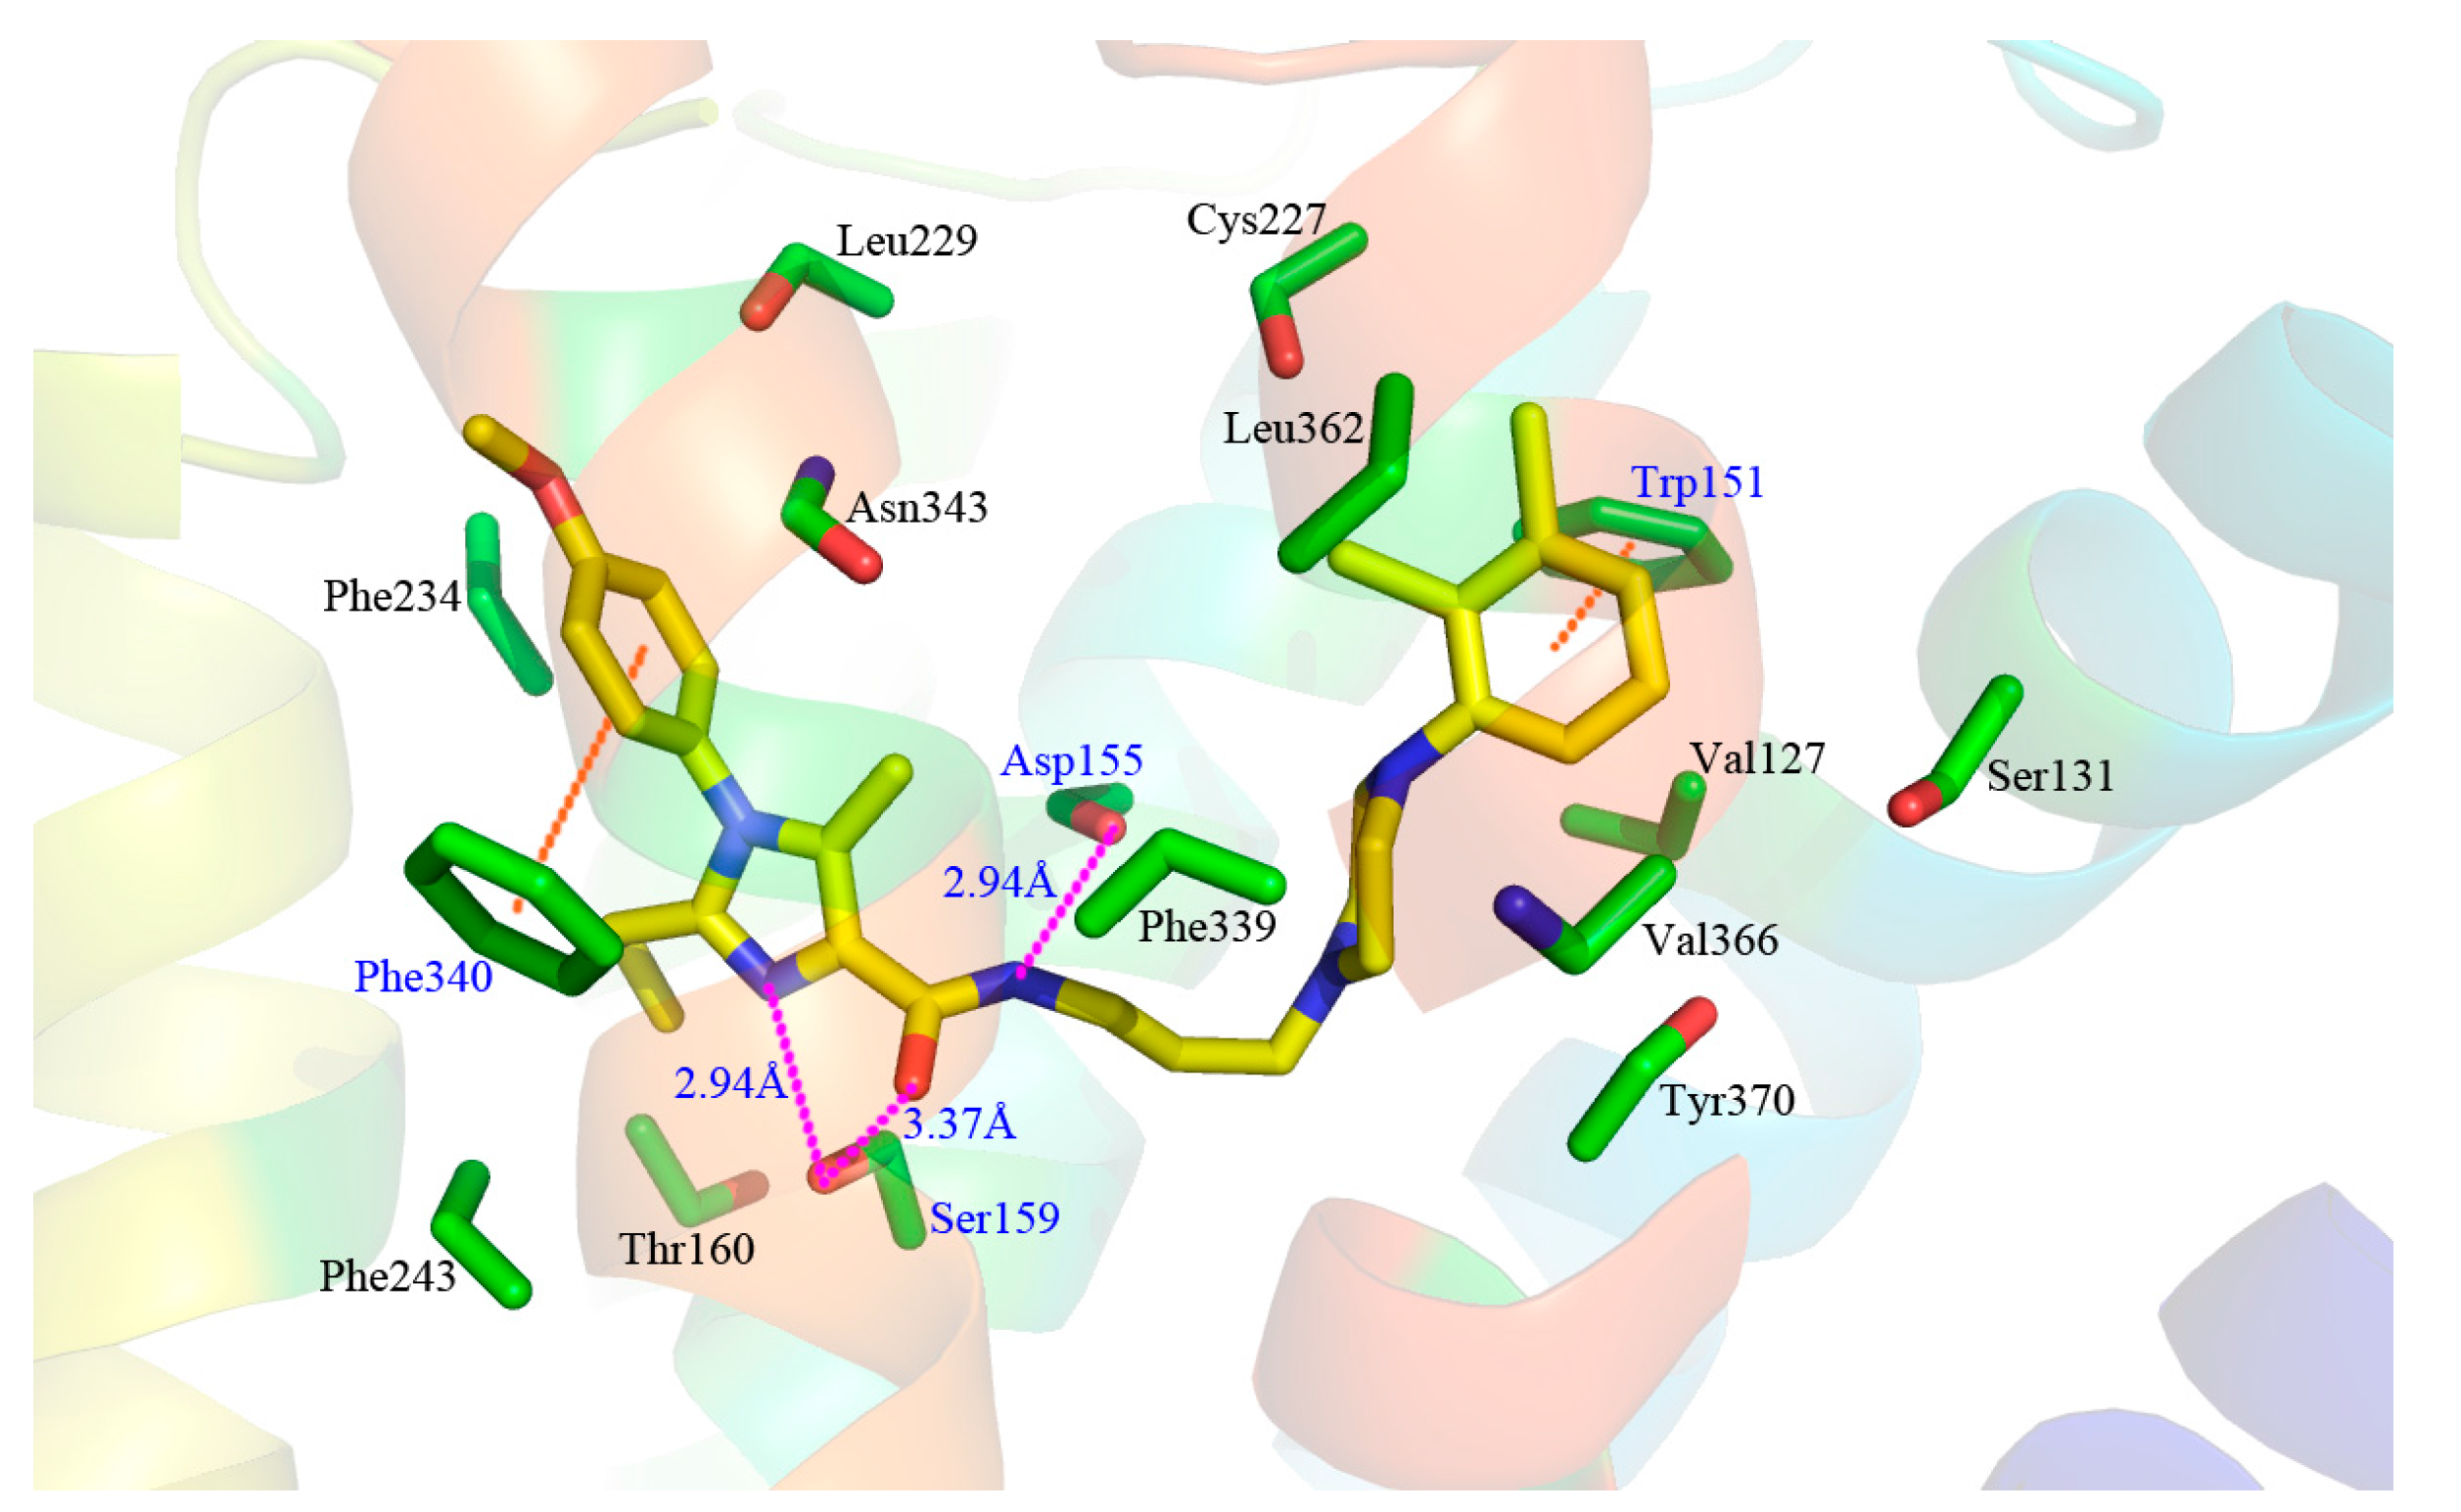
Obviously, the majority of crucial amino acid residues from the average complex structure obtained in MD simulation are greatly similar to those of the docking analysis. In accordance with the above docking results, the right branch of compound 13 is also anchored in a hydrophobic cleft constituted by a multitude of hydrophobic residues, such as Val127, Trp151, Leu362, Val366 and Tyr370. Moreover, the essential edge-to-face π-π stacking between Trp151 and ring C is predictably retained in MD results. In addition, one H-bond between the NH of the amide of compound 13 and Asp155 (–NH···O–, 2.94 Å) and another H-bond between the O-atom and Ser159 (–O···HO–, 3.37 Å) on vertex corner of the “V” are also formed in the system which tend to play necessary roles in the stabilization of the antagonists within the active site of the target protein. Although the above reproductions of binding interactions as revealed in the MD analysis further support the docking discovery, it is worth mentioning that slight discrepancy arises in the putative cavity. Due to the approximately more expansive conformation of compound 13 during MD simulation, the difference in electronic and face-to-face π-π stacking formations is observed. The electronic interaction between the electropositive N-atom of ring B and the electronegative O-atom of Asp155 in previous docking results is broken, so is the face-to-face π-π stacking between Phe340 and ring A. Meanwhile, two new interactions, including the H-bond between the N-atom at 5-position of ring A and Ser159 (–N···HO–, 2.94 Å), and the edge-to-face π-π stacking between Phe340 and the phenyl of R1, anchor the left branch of the “V” in the cleft. As a matter of fact, the variation of these two stretching formations leads to a much wider-open conformation of compound 13 in MD results. In a word, despite the subtle changes, the ligand is relatively stable at the active site of the receptor, and the MD analysis agrees well with the docking model, implying the rationality of the docking analysis in terms of reliability and helpfulness for optimization and design of potent 5-HT2A antagonists.
3.5. Docking Comparison
By a combinatorial study using both the docking and MD analyses, as well as a detailed comparison between these results, it is demonstrated that the present docking model is reliable in reflecting the particular binding mechanism in the 5-HT2A receptor active site. To further explore the interaction features of general 5-HT2A antagonists and the binding model of arylpiperazine derivatives with the target protein, a comparison of previously-reported docking studies of known 5-HT2A antagonists with the ones assessed in our current work was conducted [39,40,41,42,43,44,45,46]. Above Table 2 summarizes the important information obtained from these studies, for purpose to compare their similarities and differences, with their representative structures of the ligands summarized in Figure 10.
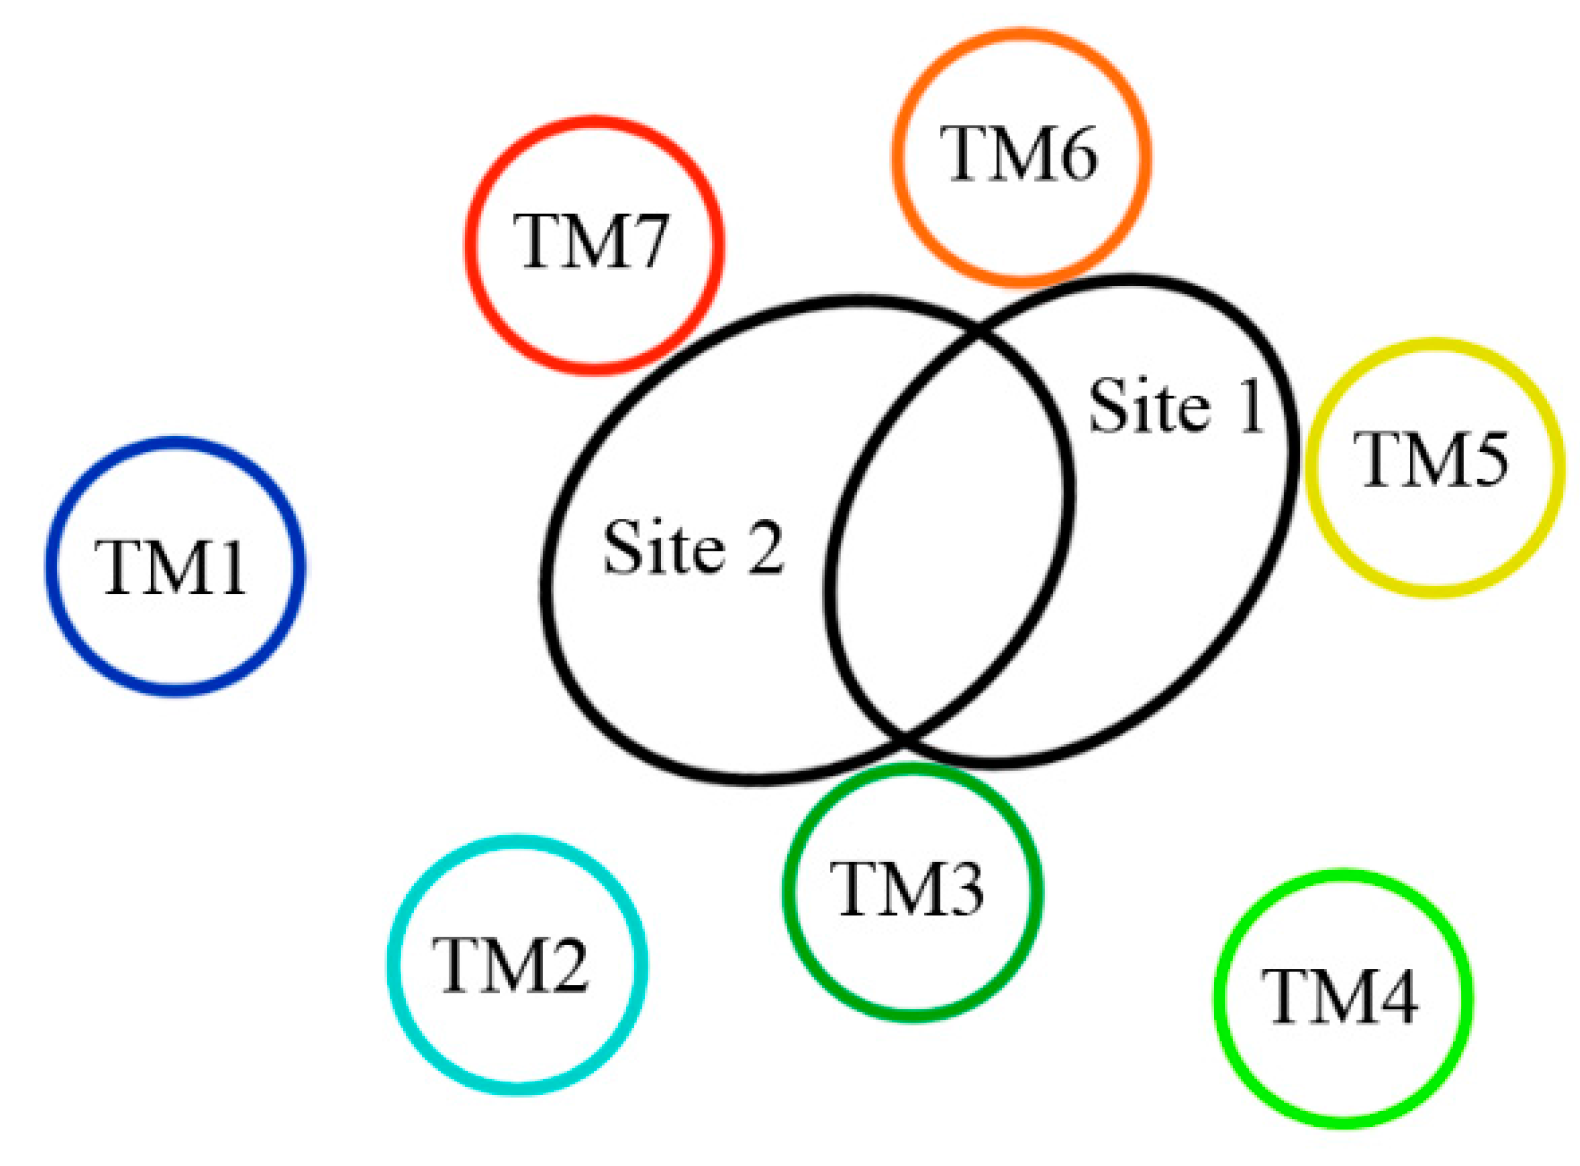
Up to now, two 5-HT2A receptor binding pockets (listed as Site 1 and Site 2, respectively) have been proposed [40,60,61]. As noted in these literatures, Site 1 (TM3 flanked by TM4, TM5, and TM6) has been identified as an agonist binding site, and Site 2 (TM3 flanked by TM2, TM6, and TM7) has been identified as an antagonist binding site [40,60,61]. As illustrated in Figure 11, there is some overlap between Site 1 and Site 2, and the common region between these sites involves residues that are both parts of helices TM3 (Asp155 and Ser159) and TM6 (Trp336 and Phe339). [40]. In terms of difference of these sites, it mainly lies in those residues which participate in the interactions of the ligand-receptor, such as H-bond, π-π stacking and hydrophobic interaction, etc. Analysis of Table 2 leads us to consider a conventional antagonist binding cavity (Site 2), where these binding modes share same characteristics with those H-bond interactions and simultaneously most of the ligands occupy approximately similar areas constituted by hydrophobic residues.
Observably, in the case of the amino acid profile settled around compound 13, the pocket that the small ligand is docked into conforms well to Site 2. Besides, with regard to all docking structures of these antagonists that bind to Site 2, their docking modes can be divided into two types, namely plane or long-chained configurations.
In light of those compounds adopting the fist docking mode, i.e., the plane configuration, they mainly include dibenzocycloheptatriene, dihydroanthracene and aporphine derivatives, represented by cyproheptadine, AMDA and antagonist 7b, respectively. For instance, AMDA is an organic compound as a selective antagonist for 5-HT2A receptor, and the binding mode of AMDA has been disclosed by Runyon et al. (No. 2) in Figure 12A, where the homology model was built based on the crystal structure of bovine rhodopsin (PDB entry 1U19:A) used as a template [40]. As shown in Figure 12A, the proposed binding mode of AMDA encompasses H-bonding and hydrophobic interactions. The ammonium substituent of AMDA interacts with not only Asp155 but also the backbone carbonyl O-atom of Cys227. Furthermore, the docked ligand solution also forms close hydrophobic contacts with Val366 [40]. In terms of other plane-type 5-HT2A antagonists, cyproheptadine from the work of Westkaemper et al. (No. 1) and antagonist 7b from the work of Ponnala et al. (No. 6) are both located at Site 2 which contains hydrophobic residues Phe339 and Phe340, and a strong H-bond is also formed between the prominent residue Asp155 and ligand.
As to those molecules adopting the second binding mode, the long-chained configuration, they mostly contain piperidine and piperazine derivatives, such as haloperidol, ketanserin, antagonist 12, antagonist 5g and spiperone. For example, Sencanski et al. (No. 5) utilized a docking process with a homology model of 5-HT2A receptor constructed with the crystal structure of β2-adrenergic receptor (PDB entry 3D4S) [43]. Antagonist 12, a long-chained arylpiperazine-like ligand, was investigated on its binding mode in their work, as depicted in Figure 12B. Their docking results show that antagonist 12 forms various interactions with 5-HT2A receptor: H-bond with Asn343, salt bridge between ligand and Asp155, and another H-bond with Ser159 and multiple π-π interactions with the binding pocket formed by Trp336, Phe339 and Tyr370 (Figure 12B), which has some similarities with our docking result. Moreover, hydrophobic residues surrounding the other parts of antagonist 12’s structure include Leu123, Ala230, Val233 and Phe234. Therefore, due to the fact that antagonist 12 and compound 13 belong to the same class of arylpiperazines, their binding constitutions in 5-HT2A receptor are similar. In addition, by docking summary of other long-chained ligands, a few similar effects like H-bond, π-π stacking, salt bridge, cation-π and hydrophobic interaction are also observed in No. 3, 4, 7, 8, 9 as listed in Table 2. All these interactions tend to be necessary for the high-affinity binding of piperidin and piperazine derivatives.
In summary, currently (1) all 5-HT2A antagonists are observed binding to Site 2 instead of Site 1 of the receptor regardless of their various structural scaffolds, and (2) they adopt one of the two binding modes, i.e., plane or long-chained configurations when interacting with the target; meanwhile (3) the arylpiperazine derivatives studied presently also bind to Site 2 as 5-HT2A antagonists, in an approximately “V” conformation stabilized by the complex interactions including H-bond, π-π stacking, hydrophobic, and even electronic interplays which also belongs to the long-chained one in configuration. All these findings could provide insights for the future exploitation of novel 5-HT2A antagonists with high inhibitory activities.
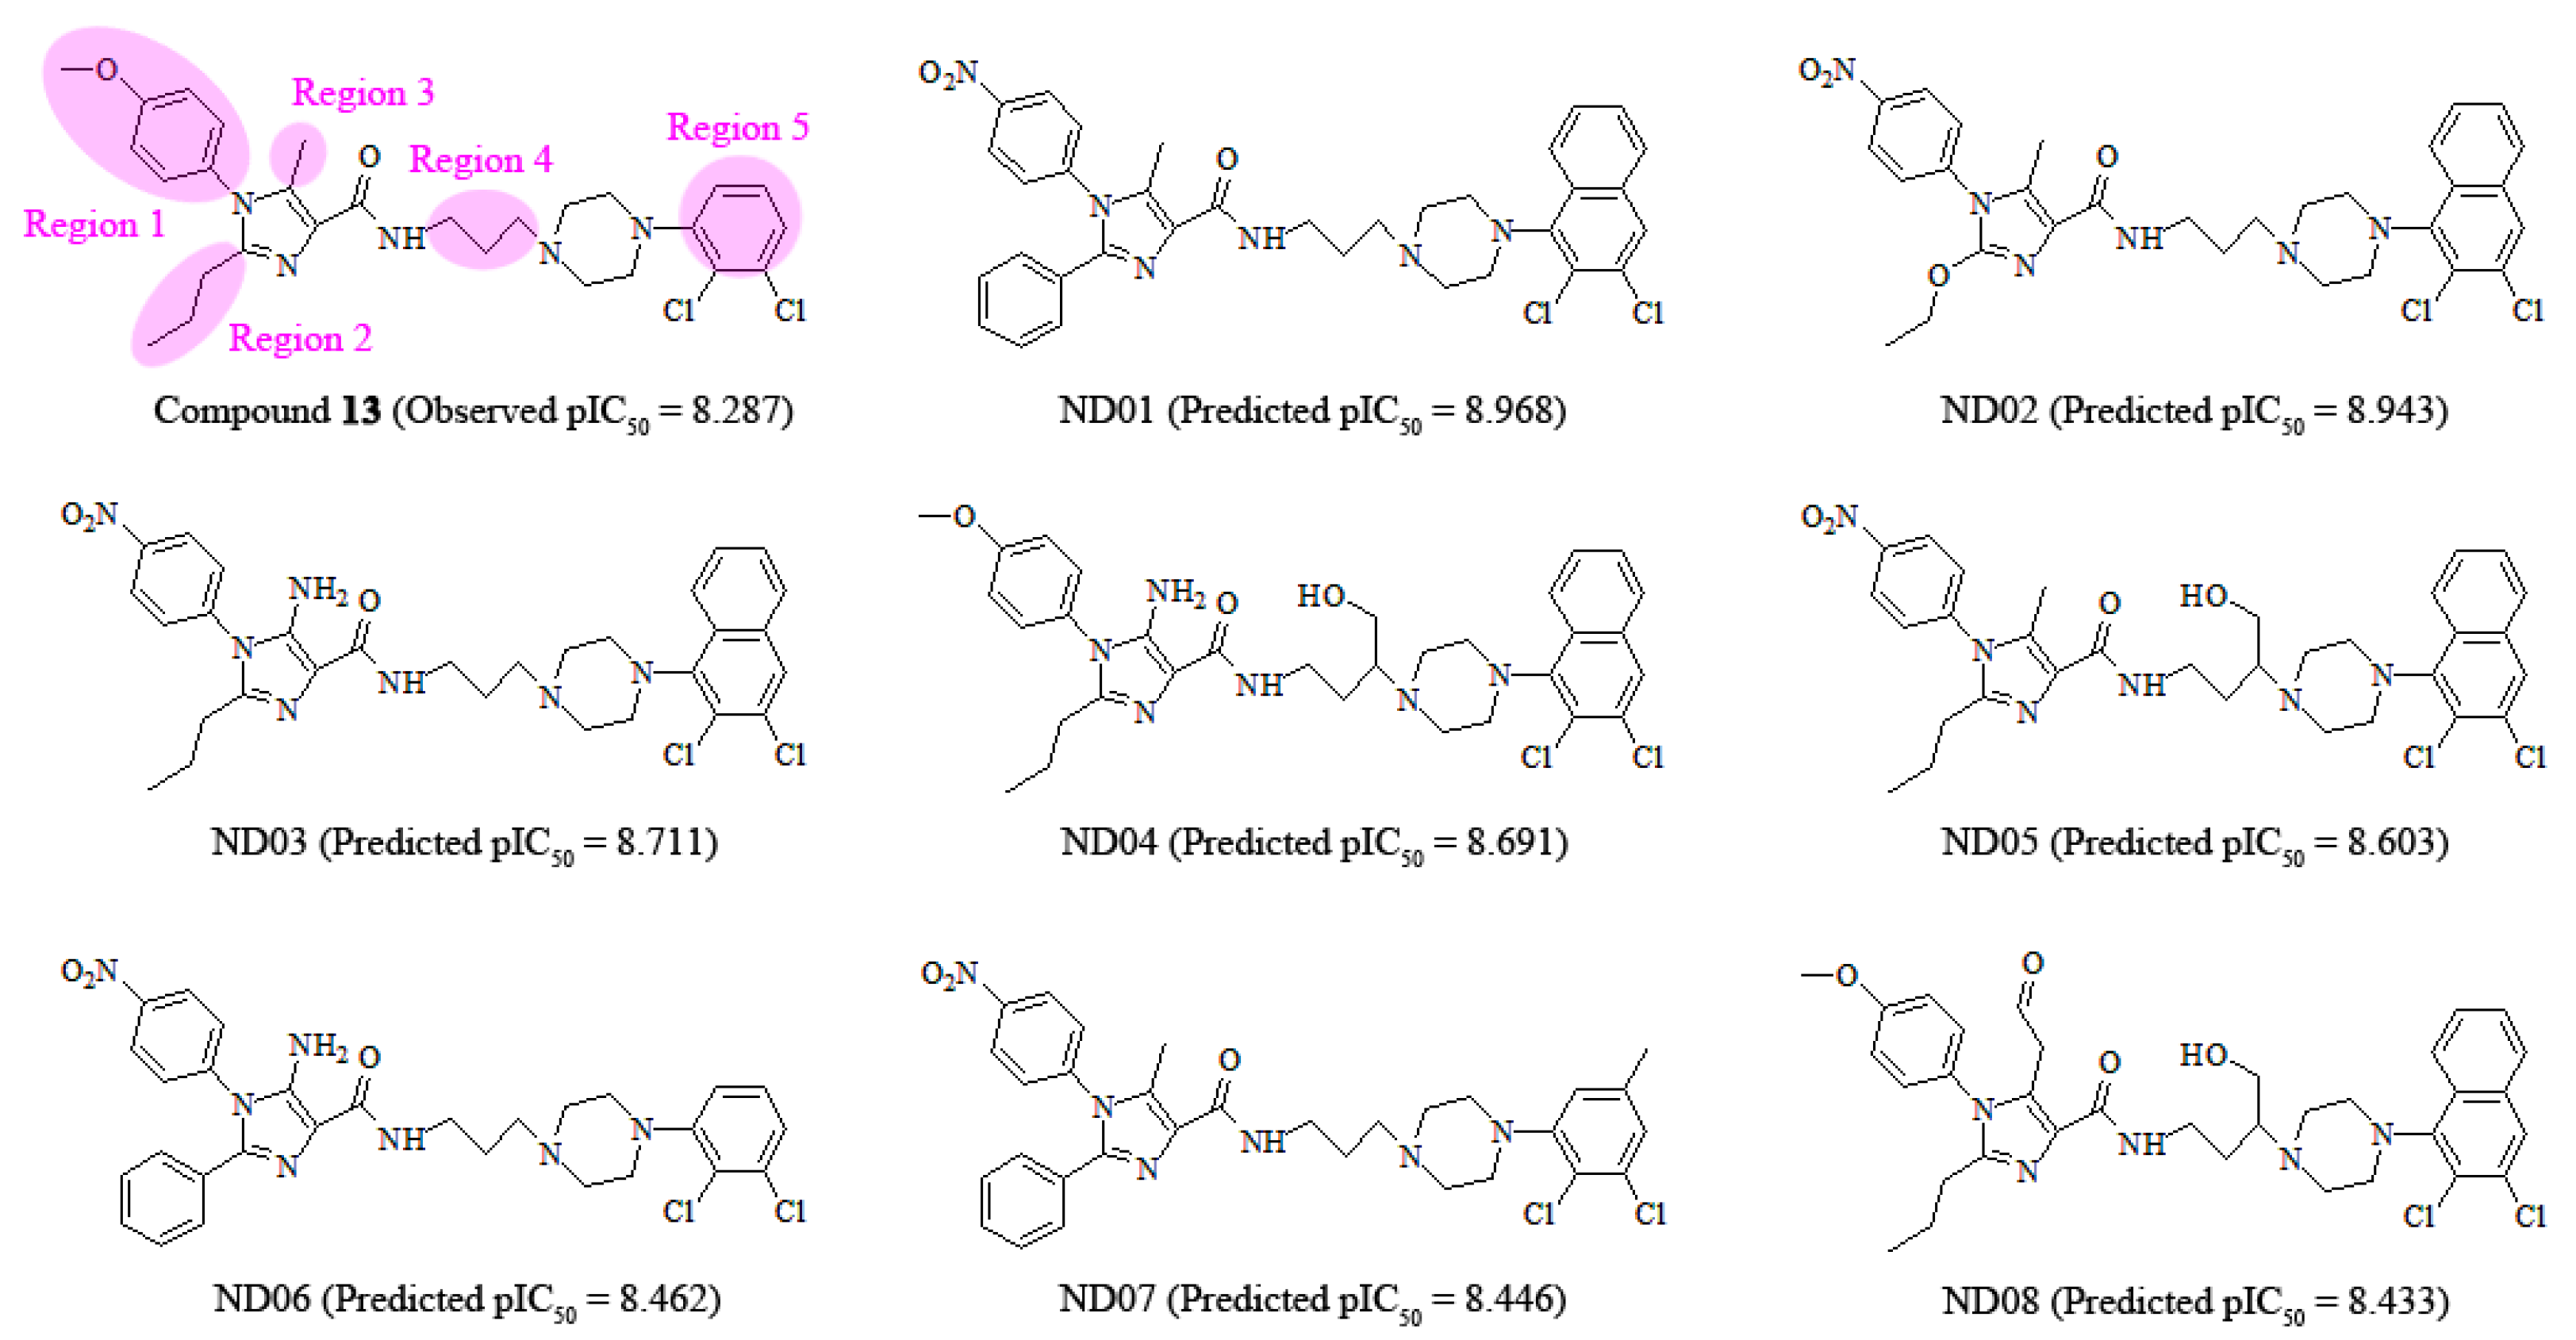
3.6. Design of New 5-HT2A Antagonists
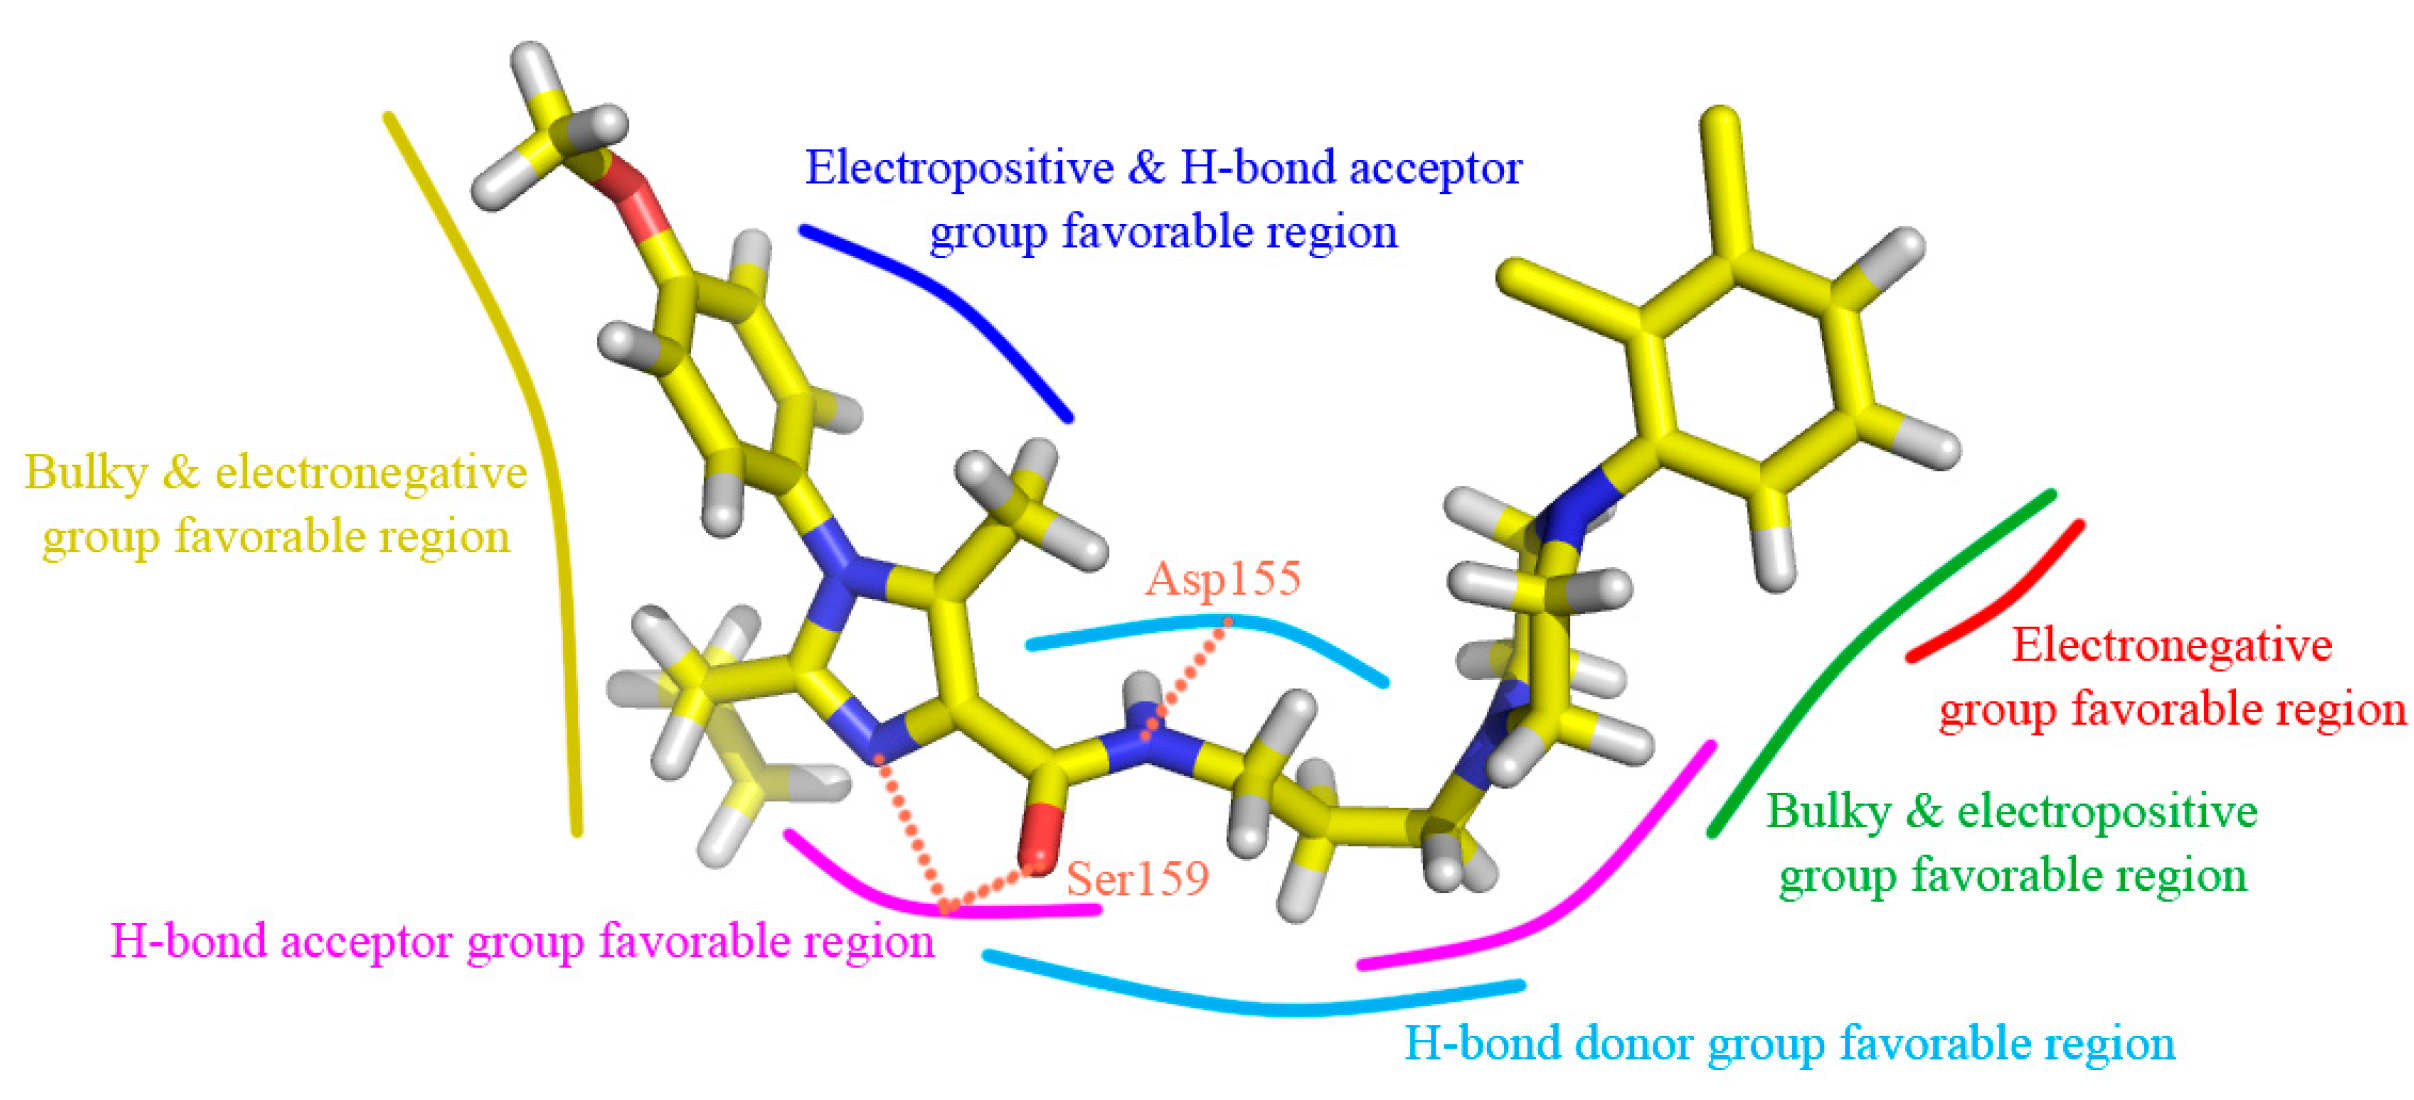
According to 3D-QSAR, docking and MD results, the arylpiperazine derivatives’ crucial structural actors influencing the antagonism potency are intuitively summarized in Figure 13. Based on this information, we further designed a set of new molecules and estimated their potential activities using our optimal CoMSIA model. At present, these modifications are concentrated on regions 1–5 in the most potent compound 13 as the template. As revealed in Figure 14, eight molecules (ND01-08) possess potent antergic activities against 5-HT2A receptor and larger pIC50 than that of the template compound 13.
Since our present work mainly focuses on the in silico study of the SAR of arylpiperazine derivatives as 5-HT2A antagonists and the exploration of their binding mechanism by modeling results, the experimental evaluation for verifying these novel-designed molecules’ activities is our further work.
4. Conclusions
In the current work, to investigate the specific binding modes of 109 arylpiperazine scaffold-based 5-HT2A antagonists with the target protein, a comprehensive in silico study was carried out by an integrated use of a series of computational techniques including 3D-QSAR analysis, molecular docking and MD simulation. Our findings are summarized as follows:
- (1)
- The optimal CoMSIA model exhibits a statistically predictable ability with Q2 = 0.587, R2ncv = 0.900 and R2pre = 0.897, proving its wonderful reliability and predictability.
- (2)
- Bulky groups at R1 position and ring C, electropositive substituents at R3 and ring B, electronegative groups at R1, R2 positions and ring C, H-bond donor substituents at linker chain, H-bond acceptor groups at 10-position, ring A and ring B are favorable to increase the inhibitory activity.
- (3)
- The scaffold of antagonists fits into the conventional Site 2 of 5-HT2A receptor with an approximately “V” conformation and follows the second binding mode, which is fixed by three H-bonds with Asp155 and Ser159, two π-π stacking interactions with Try151 and Phe340, and hydrophobic interaction.
- (4)
- Several new potential arylpiperazine antagonists of 5-HT2A receptor were also newly-designed based on these results.
All in all, the above CoMSIA model, docking and MD obtained results associate well with each other, and all these in silico models may facilitate the modification and design of novel 5-HT2A antagonists as promising antidepressant drugs.
Supplementary Materials
The following are available online. Table S1: Molecular structures and pIC50 values of arylpiperazine derivatives.
Acknowledgments
We are grateful for the Key Program of National Natural Science Foundation of China (Grant No. 81530100 and KZ0102) and the Oasis Scholar Fund of Shihezi University.
Author Contributions
Feng Lin contributed to the analysis of the study and manuscript writing; Yan Li contributed to the conception and instruction of the study; Feng Li performed the data analysis; Chao Wang helped perform the docking simulation; Jinghui Wang helped perform the MD simulation; Yinfeng Yang and Ling Yang helped perform the analysis.
Conflicts of Interest
The authors declare no conflict of interest.
References
- Boulougouris, V.; Glennon, J.C.; Robbins, T.W. Dissociable effects of selective 5-HT2A and 5-HT2C receptor antagonists on serial spatial reversal learning in rats. Neuropsychopharmacology 2008, 33, 2007–2019. [Google Scholar] [CrossRef] [PubMed]
- Poyurovsky, M.; Koren, D.; Gonopolsky, I.; Schneidman, M.; Fuchs, C.; Weizman, A.; Weizman, R. Effect of the 5-HT2 antagonist mianserin on cognitive dysfunction in chronic schizophrenia patients: An add-on, double-blind placebo-controlled study. Eur. Neuropsychopharm. 2003, 13, 123–128. [Google Scholar] [CrossRef]
- Seo, H.J.; Park, E.; Kim, M.J.; Kang, S.Y.; Lee, S.H.; Kim, H.J.; Lee, K.N.; Jung, M.E.; Lee, M.; Kim, M.; et al. Design and Synthesis of Novel Arylpiperazine Derivatives Containing the Imidazole Core Targeting 5-HT2A Receptor and 5-HT Transporter. J. Med. Chem. 2011, 54, 6305–6318. [Google Scholar] [CrossRef] [PubMed]
- Caspi, A.; Sugden, K.; Moffitt, T.E.; Taylor, A.; Craig, I.W.; Harrington, H.; McClay, J.; Mill, J.; Martin, J.; Braithwaite, A.; et al. Influence of life stress on depression: Moderation by a polymorphism in the 5-HTT gene. Science 2003, 301, 386–389. [Google Scholar] [CrossRef] [PubMed]
- Nestler, E.J.; Barrot, M.; DiLeone, R.J.; Eisch, A.J.; Gold, S.J.; Monteggia, L.M. Neurobiology of Depression. Neuron 2002, 34, 13–25. [Google Scholar] [CrossRef]
- Shajib, M.S.; Khan, W.I. The role of serotonin and its receptors in activation of immune responses and inflammation. Acta Physiol. 2015, 213, 561–574. [Google Scholar] [CrossRef] [PubMed]
- Carli, M.; Baviera, M.; Invernizzi, R.W.; Balducci, C. Dissociable contribution of 5-HT1A and 5-HT2A receptors in the medial prefrontal cortex to different aspects of executive control such as impulsivity and compulsive perseveration in rats. Neuropsychopharmacology 2006, 31, 757–767. [Google Scholar] [CrossRef] [PubMed]
- Akhondzadeh, S.; Malek-Hosseini, M.; Ghoreishi, A.; Raznahan, M.; Rezazadeh, S. Effect of ritanserin, a 5HT2A/2C antagonist, on negative symptoms of schizophrenia: A double-blind randomized placebo-controlled study. Prog. Neuro-Psychopharmacol. Biol. Psychiatry 2008, 32, 1879–1883. [Google Scholar] [CrossRef] [PubMed]
- Talvik-Lotfi, M.; Nyberg, S.; Nordstrom, A.L.; Ito, H.; Halldin, C.; Brunner, F.; Farde, L. High 5HT2A receptor occupancy in M100907-treated schizophrenic patients. Psychopharmacology (Berl.) 2000, 148, 400–403. [Google Scholar] [CrossRef] [PubMed]
- Umbricht, D.; Vollenweider, F.X.; Schmid, L.; Grubel, C.; Skrabo, A.; Huber, T.; Koller, R. Effects of the 5-HT2A agonist psilocybin on mismatch negativity generation and AX-continuous performance task: Implications for the neuropharmacology of cognitive deficits in schizophrenia. Neuropsychopharmacology 2003, 28, 170–181. [Google Scholar] [CrossRef] [PubMed]
- Barr, A.M.; Lehmann-Masten, V.; Paulus, M.; Gainetdinov, R.R.; Caron, M.G.; Geyer, M.A. The selective serotonin-2A receptor antagonist M100907 reverses behavioral deficits in dopamine transporter knockout mice. Neuropsychopharmacology 2004, 29, 221–228. [Google Scholar] [CrossRef] [PubMed]
- Vanover, K.E.; Davis, R.E. Role of 5-HT2A receptor antagonists in the treatment of insomnia. Nat. Sci. Sleep 2010, 2, 139–150. [Google Scholar] [CrossRef] [PubMed]
- Szabo, S.T.; Blier, P. Effects of serotonin (5-hydroxytryptamine, 5-HT) reuptake inhibition plus 5-HT2A receptor antagonism on the firing activity of norepinephrine neurons. J. Pharmacol. Exp. Ther. 2002, 302, 983–991. [Google Scholar] [CrossRef] [PubMed]
- Pullar, I.A.; Carney, S.L.; Colvin, E.M.; Lucaites, V.L.; Nelson, D.L.; Wedley, S. LY367265, an inhibitor of the 5-hydroxytryptamine transporter and 5-hydroxytryptamine(2A) receptor antagonist: A comparison with the antidepressant, nefazodone. Eur. J. Pharmacol. 2000, 407, 39–46. [Google Scholar] [CrossRef]
- Kim, J.Y.; Kim, D.; Kang, S.Y.; Park, W.; Kim, H.J.; Jung, M.E.; Son, E.; Pae, A.N.; Kim, J.; Lee, J. Arylpiperazine-containing pyrimidine 4-carboxamide derivatives targeting serotonin 5-HT2A, 5-HT2C, and the serotonin transporter as a potential antidepressant. Bioorg. Med. Chem. Lett. 2010, 20, 6439–6442. [Google Scholar] [CrossRef] [PubMed]
- Gao, X.; Han, L.; Ren, Y. In Silico Exploration of 1,7-Diazacarbazole Analogs as Checkpoint Kinase 1 Inhibitors by Using 3D QSAR, Molecular Docking Study, and Molecular Dynamics Simulations. Molecules 2016, 21, 591. [Google Scholar] [CrossRef] [PubMed]
- Lin, F.; Fu, X.; Wang, C.; Jiang, S.; Wang, J.; Zhang, S.; Yang, L.; Li, Y. QSAR, Molecular Docking and Molecular Dynamics of 3C-like Protease Inhibitors. Acta Phys. Chim. Sin. 2016, 32, 2693–2708. [Google Scholar]
- Li, Y.; Wang, J.; Xiao, Y.; Wang, Y.; Chen, S.; Yang, Y.; Lu, A.; Zhang, S. A systems pharmacology approach to investigate the mechanisms of action of Semen Strychni and Tripterygium wilfordii Hook F for treatment of rheumatoid arthritis. J. Ethnopharmacol. 2015, 175, 301–314. [Google Scholar] [CrossRef] [PubMed]
- Wang, J.; Yang, Y.; Li, Y.; Wang, Y. Computational Study Exploring the Interaction Mechanism of Benzimidazole Derivatives as Potent Cattle Bovine Viral Diarrhea Virus Inhibitors. J. Agric. Food Chem. 2016, 64, 5941–5950. [Google Scholar] [CrossRef] [PubMed]
- Wang, J.; Li, Y.; Yang, Y.; Zhang, J.; Du, J.; Zhang, S.; Yang, L. Profiling the interaction mechanism of indole-based derivatives targeting the HIV-1 gp120 receptor. RSC Adv. 2015, 5, 78278–78298. [Google Scholar] [CrossRef]
- Yang, Y.; Li, Y.; Pan, Y.; Wang, J.; Lin, F.; Wang, C.; Zhang, S.; Yang, L. Computational Analysis of Structure-Based Interactions for Novel H1-Antihistamines. Int. J. Mol. Sci. 2016, 17, 129. [Google Scholar] [CrossRef] [PubMed]
- Yang, Y.; Wang, J.; Li, Y.; Xiao, W.; Wang, Z.; Zhang, J.; Gao, W.; Zhang, S.; Yang, L. Structure determinants of indolin-2-on-3-spirothiazolidinones as MptpB inhibitors: An in silico study. Soft Matter 2013, 9, 11054. [Google Scholar] [CrossRef]
- Wu, M.; Li, Y.; Fu, X.; Wang, J.; Zhang, S.; Yang, L. Profiling the Interaction Mechanism of Quinoline/Quinazoline Derivatives as MCHR1 Antagonists: An in Silico Method. Int. J. Mol. Sci. 2014, 15, 15475–15502. [Google Scholar] [CrossRef] [PubMed]
- Cramer, R.D.; Patterson, D.E.; Bunce, J.D. Comparative molecular field analysis (CoMFA). 1. Effect of shape on binding of steroids to carrier proteins. J. Am. Chem. Soc. 1988, 110, 5959–5967. [Google Scholar] [CrossRef] [PubMed]
- Klebe, G.; Abraham, U.; Mietzner, T. Molecular similarity indices in a comparative analysis (CoMSIA) of drug molecules to correlate and predict their biological activity. J. Med. Chem. 1994, 37, 4130–4146. [Google Scholar] [CrossRef] [PubMed]
- Wang, J.; Li, Y.; Yang, Y.; Zhang, S.; Yang, L. Profiling the Structural Determinants of Heteroarylnitrile Scaffold-Based Derivatives as Falcipain-2 Inhibitors by In Silico Methods. Curr. Med. Chem. 2013, 20, 2032–2042. [Google Scholar] [CrossRef] [PubMed]
- Gasteiger, J.; Marsili, M. Iterative partial equalization of orbital electronegativity—A rapid access to atomic charges. Tetrahedron 1980, 36, 3219–3228. [Google Scholar] [CrossRef]
- Clark, M.; Cramer, R.D.; van Opdenbosch, N. Validation of the general purpose Tripos 5.2 force field. J. Comput. Chem. 1989, 10, 982–1012. [Google Scholar] [CrossRef]
- Wang, Q.; Mach, R.H.; Reichert, D.E. Docking and 3D-QSAR Studies on Isatin Sulfonamide Analogues as Caspase-3 Inhibitors. J. Chem. Inf. Model. 2009, 49, 1963–1973. [Google Scholar] [CrossRef] [PubMed]
- Zhu, Y.; Lei, M.; Lu, A.; Zhao, X.; Yin, X.; Gao, Q. 3D-QSAR studies of boron-containing dipeptides as proteasome inhibitors with CoMFA and CoMSIA methods. Eur. J. Med. Chem. 2009, 44, 1486–1499. [Google Scholar] [CrossRef] [PubMed]
- Deshpande, S.; Jaiswal, S.; Katti, S.B.; Prabhakar, Y.S. CoMFA and CoMSIA analysis of tetrahydroquinolines as potential antimalarial agents. SAR QSAR Environ. Res. 2011, 22, 473–488. [Google Scholar] [CrossRef] [PubMed]
- Wold, S.; Sjöström, M.; Eriksson, L. Partial Least Squares Projections to Latent Structures (PLS) in Chemistry; John Wiley & Sons, Ltd.: Chichester, UK, 2002. [Google Scholar]
- Sprous, D.G.; Palmer, R.K.; Swanson, J.T.; Lawless, M. QSAR in the Pharmaceutical Research Setting: QSAR Models for Broad, Large Problems. Curr. Top. Med. Chem. 2010, 10, 619–637. [Google Scholar] [CrossRef] [PubMed]
- Kovalishyn, V.V.; Kholodovych, V.; Tetko, I.V.; Welsh, W.J. Volume learning algorithm significantly improved PLS model for predicting the estrogenic activity of xenoestrogens. J. Mol. Graph. Model. 2007, 26, 591–594. [Google Scholar] [CrossRef] [PubMed]
- Li, Y.; Wang, Y.; Yang, L.; Zhang, S.; Liu, C.; Yang, S. Comparison of steroid substrates and inhibitors of P-glycoprotein by 3D-QSAR analysis. J. Mol. Struct. 2005, 733, 111–118. [Google Scholar] [CrossRef]
- Thaimattam, R.; Daga, P.; Rajjak, S.A.; Banerjee, R.; Iqbal, J. 3D-QSAR CoMFA, CoMSIA studies on substituted ureas as Raf-1 kinase inhibitors and its confirmation with structure-based studies. Bioorgan. Med. Chem. 2004, 12, 6415–6425. [Google Scholar] [CrossRef] [PubMed]
- Shahlaei, M.; Madadkar-Sobhani, A.; Mahnam, K.; Fassihi, A.; Saghaie, L.; Mansourian, M. Homology modeling of human CCR5 and analysis of its binding properties through molecular docking and molecular dynamics simulation. Biochim. Biophys. Acta (BBA) Biomembr. 2011, 1808, 802–817. [Google Scholar] [CrossRef] [PubMed]
- Verdonk, M.L.; Cole, J.C.; Hartshorn, M.J.; Murray, C.W.; Taylor, R.D. Improved protein-ligand docking using GOLD. Proteins Struct. Funct. Bioinform. 2003, 52, 609–623. [Google Scholar] [CrossRef] [PubMed]
- Westkaemper, R.B.; Runyon, S.P.; Savage, J.E.; Roth, B.L.; Glennon, R.A. Exploring the relationship between binding modes of 9-(aminomethyl)-9,10-dihydroanthracene and cyproheptadine analogues at the 5-HT2A serotonin receptor. Bioorg. Med. Chem. Lett. 2001, 11, 563–566. [Google Scholar] [CrossRef]
- Runyon, S.P.; Mosier, P.D.; Roth, B.L.; Glennon, R.A.; Westkaemper, R.B. Potential Modes of Interaction of 9-Aminomethyl-9,10-dihydroanthracene (AMDA) Derivatives with the 5-HT2A Receptor: A Ligand Structure-Affinity Relationship, Receptor Mutagenesis and Receptor Modeling Investigation. J. Med. Chem. 2008, 51, 6808–6828. [Google Scholar] [CrossRef] [PubMed]
- Kanagarajadurai, K.; Malini, M.; Bhattacharya, A.; Panicker, M.M.; Sowdhamini, R. Molecular modeling and docking studies of human 5-hydroxytryptamine 2A (5-HT2A) receptor for the identification of hotspots for ligand binding. Mol. Biosyst. 2009, 5, 1877–1888. [Google Scholar] [CrossRef] [PubMed]
- Yap, B.K.; Buckle, M.J.C.; Doughty, S.W. Homology modeling of the human 5-HT1A, 5-HT2A, D1, and D2 receptors: Model refinement with molecular dynamics simulations and docking evaluation. J. Mol. Model. 2012, 18, 3639–3655. [Google Scholar] [CrossRef] [PubMed]
- Sencanski, M.; Sukalovic, V.; Shakib, K.; Soskic, V.; Dosen-Micovic, L.; Kostic-Rajacic, S. Molecular Modeling of 5HT(2A) Receptor—Arylpiperazine Ligands Interactions. Chem. Biol. Drug Des. 2014, 83, 462–471. [Google Scholar] [CrossRef] [PubMed]
- Ponnala, S.; Kapadia, N.; Navarro, H.A.; Harding, W.W. Aporphinoid Antagonists of 5-HT2A Receptors: Further Evaluation of Ring A Substituents and the Size of Ring C. Chem. Biol. Drug Des. 2014, 84, 558–566. [Google Scholar] [CrossRef] [PubMed]
- Deng, X.; Guo, L.; Xu, L.; Zhen, X.; Yu, K.; Zhao, W.; Fu, W. Discovery of novel potent and selective ligands for 5-HT2A receptor with quinazoline scaffold. Bioorg. Med. Chem. Lett. 2015, 25, 3970–3974. [Google Scholar] [CrossRef] [PubMed]
- Gandhimathi, A.; Sowdhamini, R. Molecular modelling of human 5-hydroxytryptamine receptor (5-HT2A) and virtual screening studies towards the identification of agonist and antagonist molecules. J. Biomol. Struct. Dyn. 2016, 34, 952–970. [Google Scholar] [CrossRef] [PubMed]
- Ísberg, V.; Balle, T.; Sander, T.; Jørgensen, F.S.; Gloriam, D.E. G Protein- and Agonist-Bound Serotonin 5-HT2A Receptor Model Activated by Steered Molecular Dynamics Simulations. J. Chem. Inf. Model. 2011, 51, 315–325. [Google Scholar] [CrossRef] [PubMed]
- Berendsen, H.J.C.; van der Spoel, D.; van Drunen, R. GROMACS: A message-passing parallel molecular dynamics implementation. Comput. Phys. Commun. 1995, 91, 43–56. [Google Scholar] [CrossRef]
- McRobb, F.M.; Capuano, B.; Crosby, I.T.; Chalmers, D.K.; Yuriev, E. Homology Modeling and Docking Evaluation of Aminergic G Protein-Coupled Receptors. J. Chem. Inf. Model. 2010, 50, 626–637. [Google Scholar] [CrossRef] [PubMed]
- Cordova-Sintjago, T.; Sakhuja, R.; Kondabolu, K.; Canal, C.E.; Booth, R.G. Molecular Determinants for Ligand Binding at Serotonin 5-HT2A and 5-HT2C GPCRs: Experimental Affinity Results Analyzed by Molecular Modeling and Ligand Docking Studies. Int. J. Quantum Chem. 2012, 112, 3807–3814. [Google Scholar] [CrossRef] [PubMed]
- Jo, S.; Kim, T.; Im, W. Automated Builder and Database of Protein/Membrane Complexes for Molecular Dynamics Simulations. PLoS ONE 2007, 2. [Google Scholar] [CrossRef] [PubMed]
- Galeazzi, R.; Massaccesi, L.; Piva, F.; Principato, G.; Laudadio, E. Insights into the influence of 5-HT2c aminoacidic variants with the inhibitory action of serotonin inverse agonists and antagonists. J. Mol. Model. 2014, 20, 2120. [Google Scholar] [CrossRef] [PubMed]
- Lin, J.; Perryman, A.L.; Schames, J.R.; McCammon, J.A. Computational Drug Design Accommodating Receptor Flexibility: The Relaxed Complex Scheme. J. Am. Chem. Soc. 2002, 124, 5632–5633. [Google Scholar] [CrossRef] [PubMed]
- Hess, B.; Bekker, H.; Berendsen, H.; Fraaije, J. LINCS: A linear constraint solver for molecular simulations. J. Comput. Chem. 1997, 18, 1463–1472. [Google Scholar] [CrossRef]
- Parrinello, M.; Rahman, A. Polymorphic transitions in single crystals: A new molecular dynamics method. J. Appl. Phys. 1981, 52, 7182–7190. [Google Scholar] [CrossRef]
- Wu, Q.; Li, X.; Gao, Q.; Wang, J.; Li, Y.; Yang, L. Interaction mechanism exploration of HEA derivatives as BACE1 inhibitors by in silico analysis. Mol. Biosyst. 2016, 12, 1151–1165. [Google Scholar] [CrossRef] [PubMed]
- Li, Y.; Han, C.; Wang, J.; Yang, Y.; Zhang, J.; Zhang, S.; Yang, L. Insight into the Structural Features of Pyrazolopyrimidine- and Pyrazolopyridine-based B-RafV600E Kinase Inhibitors by Computational Explorations. Chem. Biol. Drug Des. 2014, 83, 643–655. [Google Scholar] [CrossRef] [PubMed]
- Wang, J.; Li, Y.; Yang, Y.; Du, J.; Zhang, S.; Yang, L. In silico research to assist the investigation of carboxamide derivatives as potent TRPV1 antagonists. Mol. Biosyst. 2015, 11, 2885–2899. [Google Scholar] [CrossRef] [PubMed]
- Van Vlijmen, H.W.T.; Schaefer, M.; Karplus, M. Improving the accuracy of protein pKa calculations: Conformational averaging versus the average structure. Proteins Struct. Funct. Bioinform. 1998, 33, 145–158. [Google Scholar] [CrossRef]
- Westkaemper, R.B.; Glennon, R.A. Application of ligand SAR, receptor modeling and receptor mutagenesis to the discovery and development of a new class of 5-HT(2A) ligands. Curr. Top. Med. Chem. 2002, 2, 575–598. [Google Scholar] [CrossRef] [PubMed]
- Surgand, J.; Rodrigo, J.; Kellenberger, E.; Rognan, D. A chemogenomic analysis of the transmembrane binding cavity of human G-protein-coupled receptors. Proteins Struct. Funct. Bioinform. 2006, 62, 509–538. [Google Scholar] [CrossRef] [PubMed]
Sample Availability: Not available. |
Figure 1.
Molecular alignments of all compounds in the data set. (A) The common structure of molecules based on template compound 13 is displayed in bold; (B) The resultant alignment model.
Figure 1.
Molecular alignments of all compounds in the data set. (A) The common structure of molecules based on template compound 13 is displayed in bold; (B) The resultant alignment model.

Figure 2.
Distribution of the number of compounds versus their activities (pIC50) of the training (colored as black) and the test (red) sets.
Figure 2.
Distribution of the number of compounds versus their activities (pIC50) of the training (colored as black) and the test (red) sets.

Figure 3.
The scatter plot of the predicted versus the experimental pIC50 values using the training (filled black squares) and the test (filled red triangles) compounds from the final optimal CoMSIA model. The solid line is the regression line for the predicted and experimental activities of training and test sets.

Figure 4.
The radar plots of the predicted versus the experimental pIC50 values using the training (A) and the test (B) compounds from the final optimal CoMSIA model.
Figure 4.
The radar plots of the predicted versus the experimental pIC50 values using the training (A) and the test (B) compounds from the final optimal CoMSIA model.
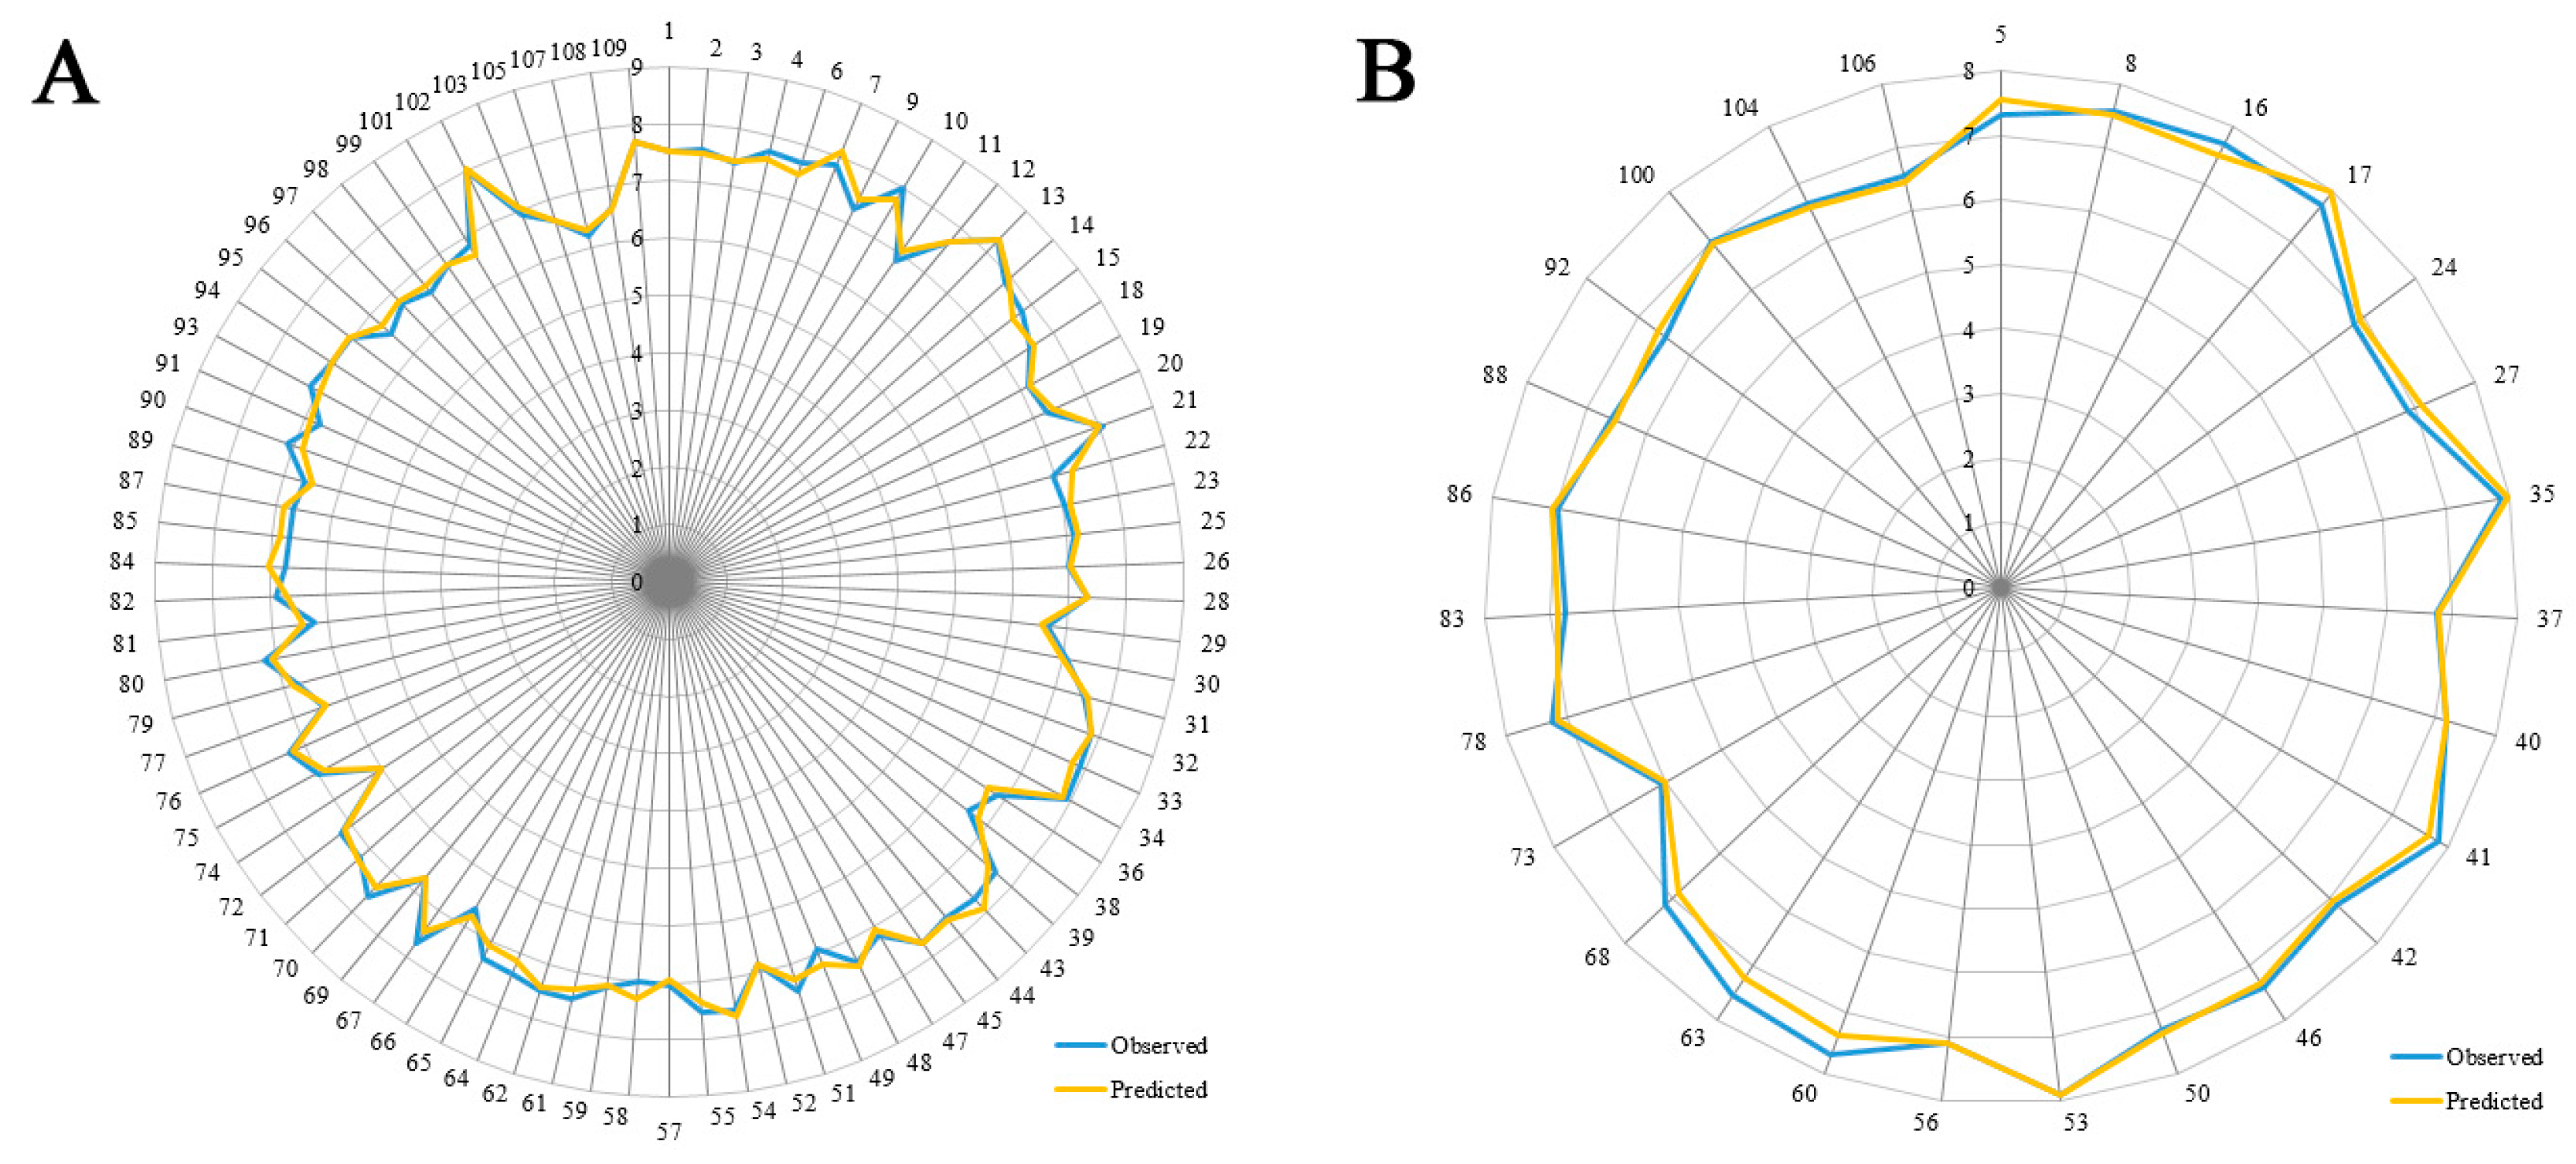
Figure 5.
CoMSIA “StDev*Coeff” contour maps. (A) Steric (green/yellow) map. Green contours imply regions where bulky groups are beneficial for the activity, and yellow contours imply regions where bulky groups are detrimental for the activity; (B) Electrostatic (blue/red) map. Blue contours represent where positive charges promote the affinity, and red contours represent where negative charges promote the affinity; (C) H-bond donor (cyan/purple) map. Cyan contours reveal where H-bond donors increase the activity, and purple contours reveal where H-bond donors decrease the activity; (D) H-bond accepter (purple/red) map. Purple contours represent regions where H-bond acceptors are beneficial for the activity, while red contours represent regions where H-bond acceptors are detrimental for the activity.
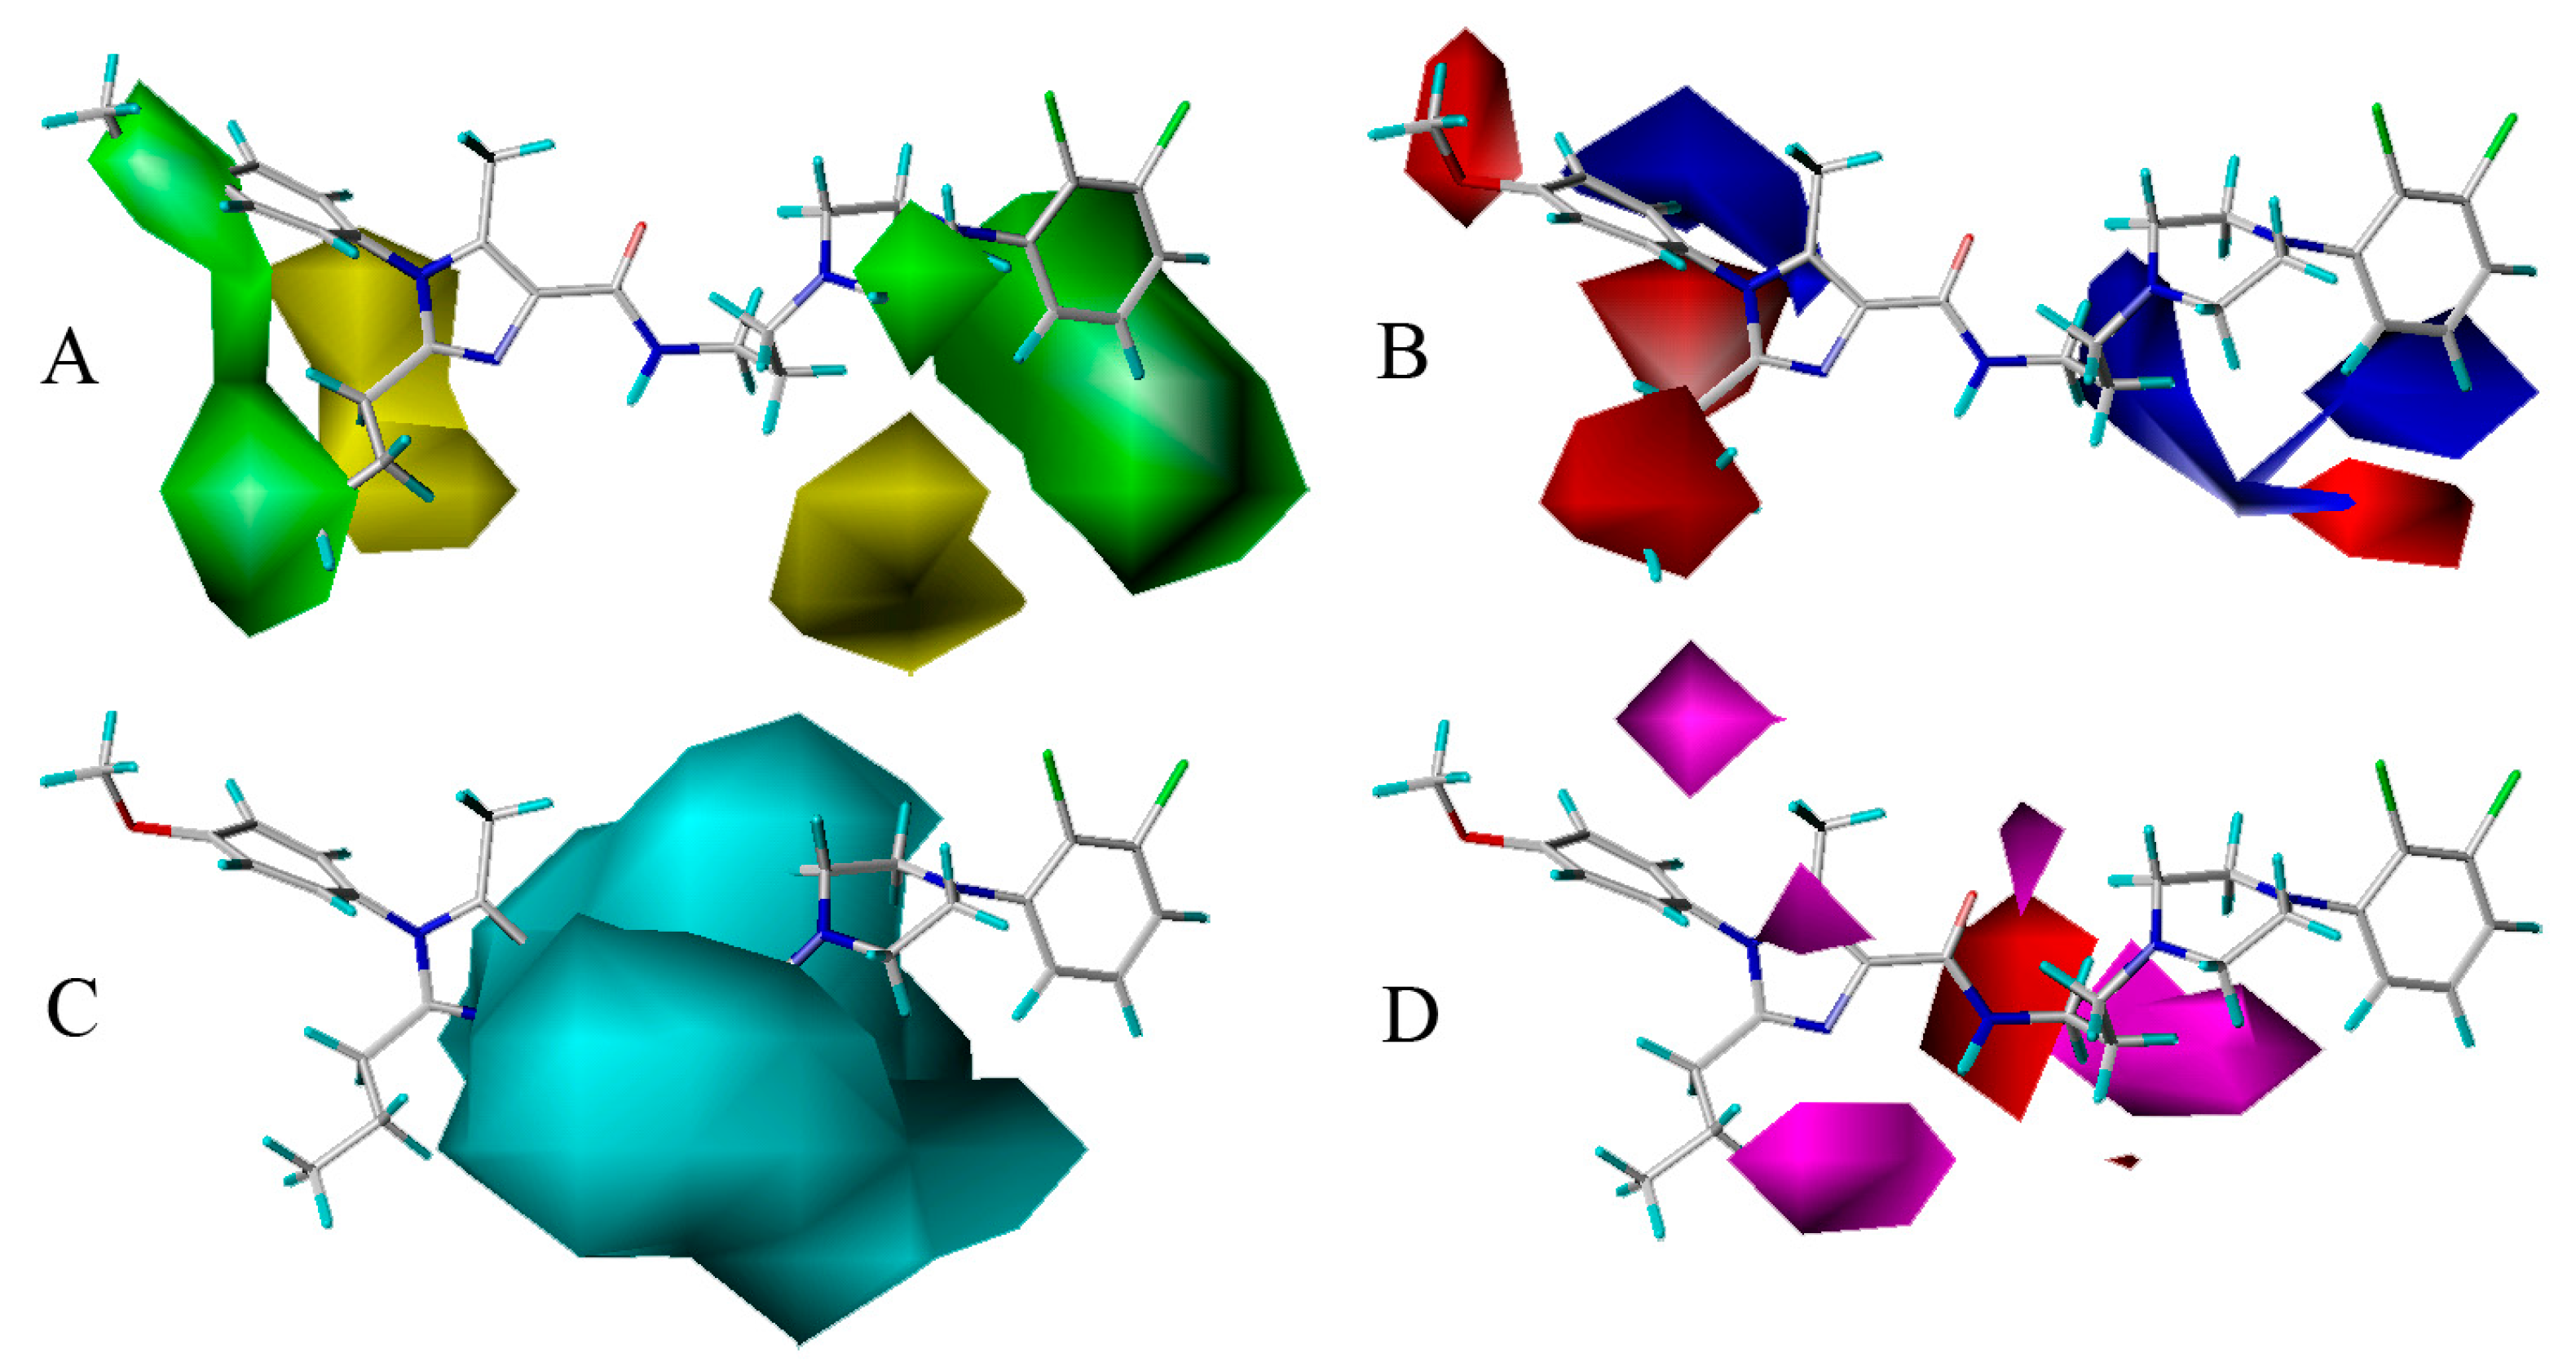
Figure 6.
(A) The binding pattern of compound 13 and protein; (B,C) Surface structure depicted with pocket depth potential of the active site within the ligand.
Figure 6.
(A) The binding pattern of compound 13 and protein; (B,C) Surface structure depicted with pocket depth potential of the active site within the ligand.

Figure 7.
Compound 13 and the interaction groups of the key amino acids are shown in sticks and highlighted with green and yellow carbons, respectively. N-atoms, O-atoms and S-atoms are colored blue, red and yellow, respectively. H-bond, π-π stacking and electronic interactions are shown as purple, orange and azure dashed lines, respectively.

Figure 8.
(A) The time evolutions of RMSD of the backbone atoms from the initial docked structure during the 50,000 ps MD simulations; (B) The ligand-receptor complex embedded into the lipid bilayer after 50,000 ps of MD simulation. Ligand, receptor and lipid molecules are shown as yellow spheres, green cartoon and blue lines, respectively; (C) The projection of the superimposed backbone atoms of the average structure of the last 10,000 ps of the MD simulation (yellow) and the initial structure (green). Compound 13 is respectively represented as carbon-chain in green for the initial complex and yellow for the average structure.

Figure 9.
Compound 13 and the interaction groups of the key amino acids are depicted in sticks and highlighted with yellow and green carbons, respectively. N-atoms, O-atoms and S-atoms are colored blue, red and yellow, respectively. H-bond and π-π stacking interactions are represented as purple and orange dashed lines, respectively.

Figure 10.
Eight known 5-HT2A antagonists binding in the 5-HT2A receptor docking model.
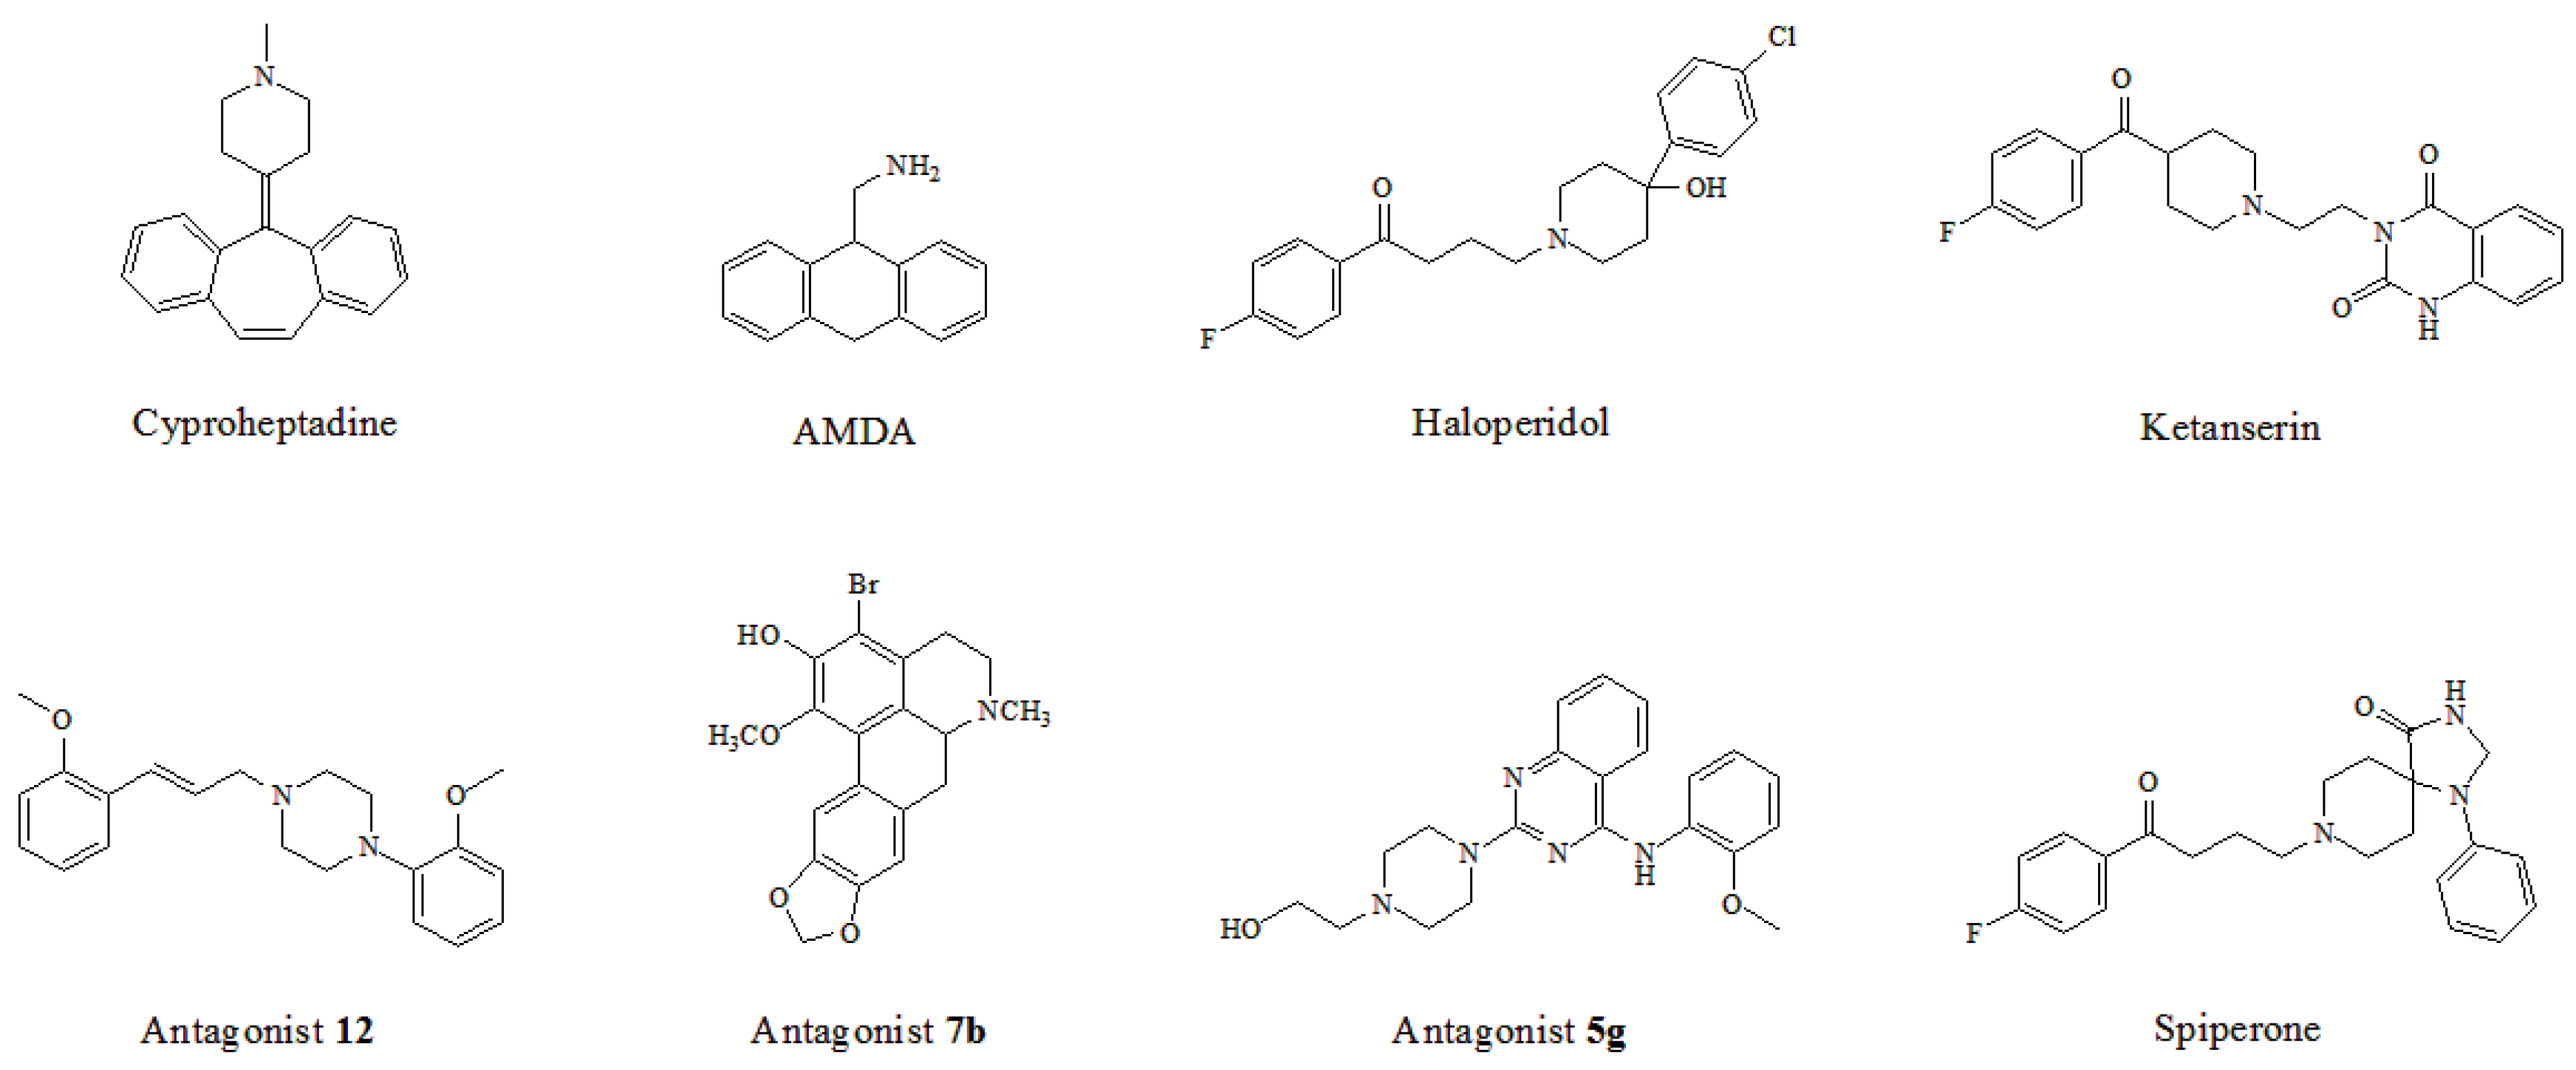
Figure 11.
The sterically accessible binding pockets within the 5-HT2A receptor regarded as Site 1 (agonist site) and Site 2 (antagonist site) [40,60].

Figure 12.
Two docking modes in the 5-HT2A receptor. (A) AMDA [40]; (B) Antagonist 12 [43]. H-bond, π-π stacking and salt bridge interactions are observed as red, orange and blue dashed lines, respectively. Hydrophobic and hydrophilic residues are respectively displayed as green and purple words.
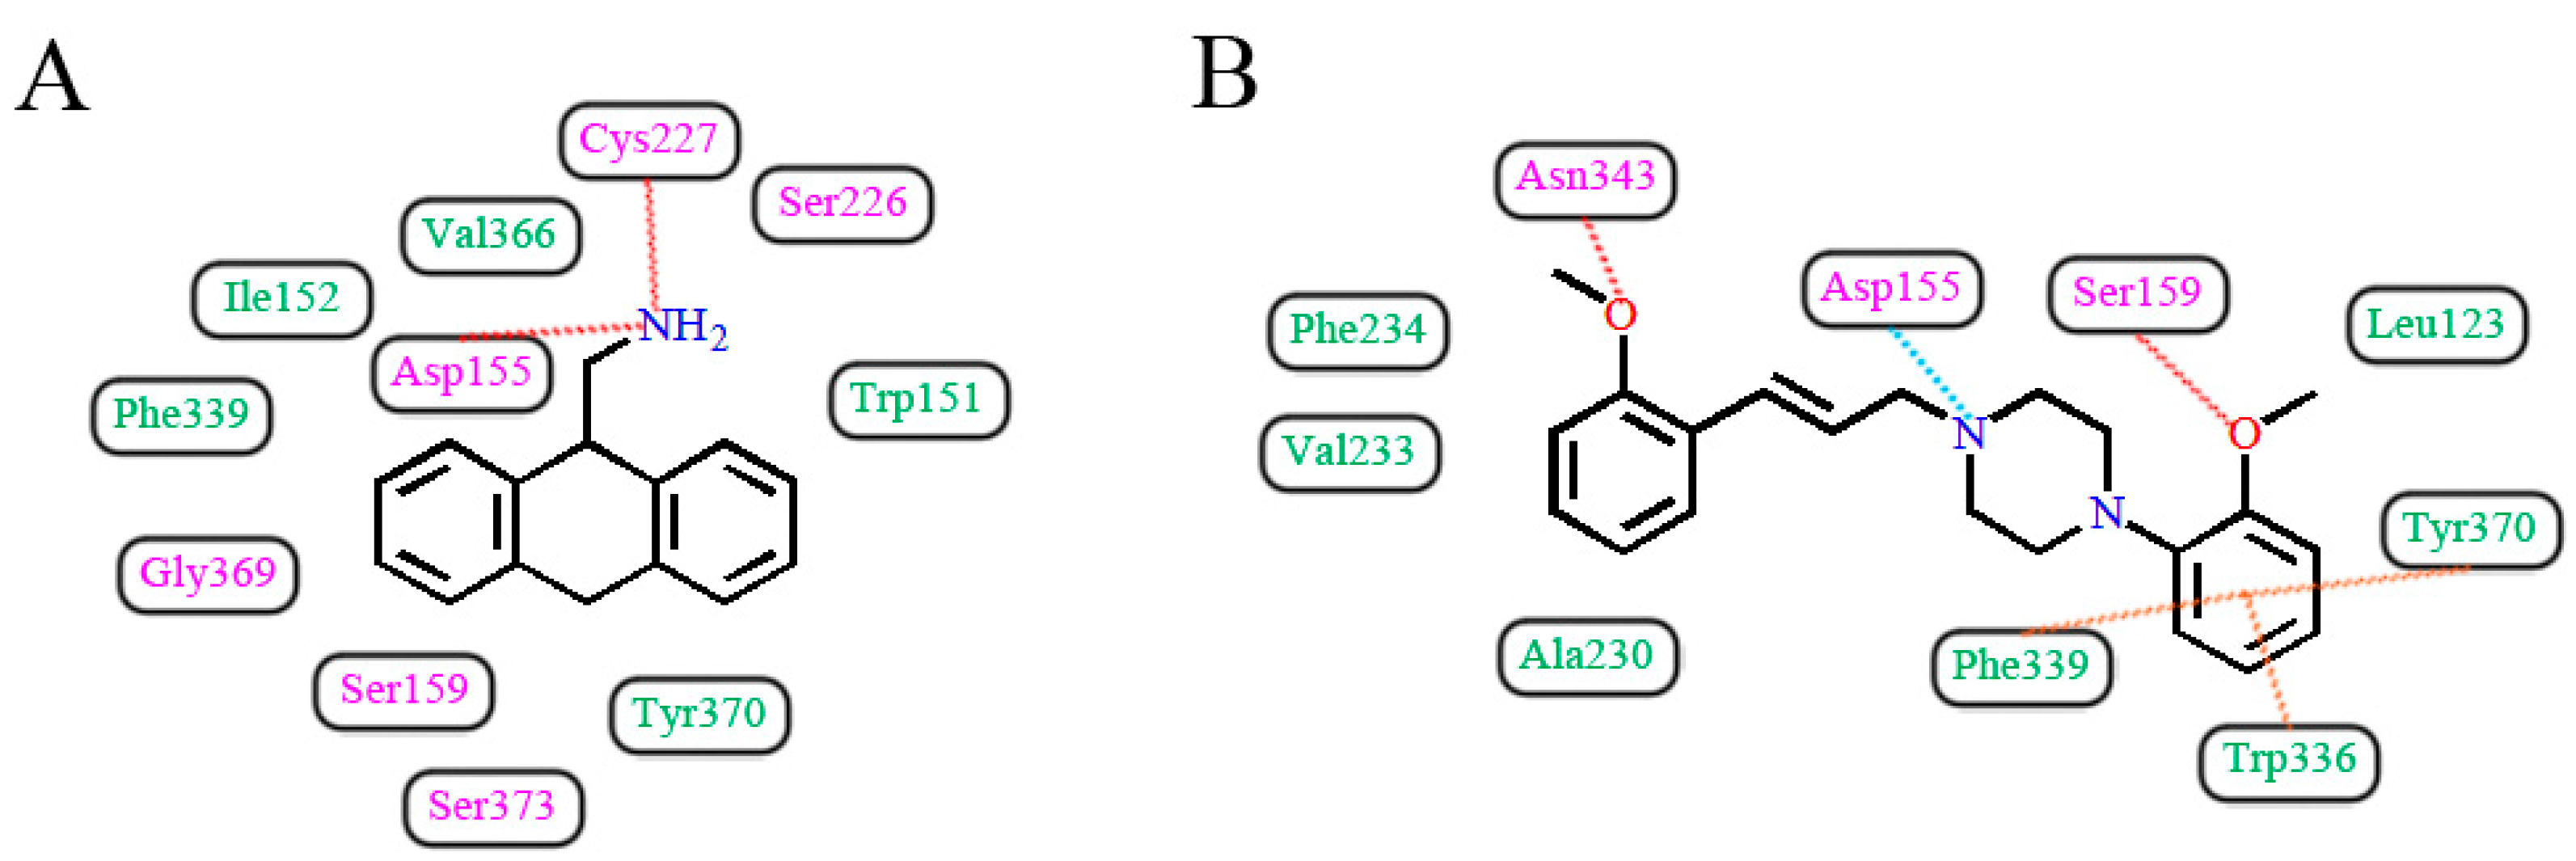
Figure 13.
Crucial interaction features of template compound 13 with 5-HT2A receptor.

Figure 14.
Structures and predicted activities of newly designed 5-HT2A antagonists.

Table 1.
Representative molecular structures and IC50 values of arylpiperazine derivatives.
| No. | Structure | IC50 (nM) | No. | Structure | IC50 (nM) |
|---|---|---|---|---|---|
| 2 |  | 27 | 5 t |  | 48 |
| 13 |  | 5.17 | 18 |  | 30 |
| 32 |  | 13.9 | 46 t |  | 40 |
| 47 |  | 64.8 | 49 |  | 117.9 |
| 60 t |  | 20 | 74 |  | 1011 |
| 84 |  | 185 | 90 |  | 78.3 |
| 95 |  | 95 | 101 |  | 147 |
| 105 |  | 237 | 106 t |  | 294 |
t Compounds belonging to the test set.
Table 2.
The summary of various ligand-5-HT2A receptor docking studies.
| No. | Researchers | Template | Representative Structure | Site Type | Binding Interactions | Crucial Residues |
|---|---|---|---|---|---|---|
| 1 | Westkaemper et al. [39] | GF-62 cells | Cyproheptadine | Site 2 | H-bond | Asp155 |
| 2 | Runyon et al. [40] | Bovine rhodopsin (PDB entry 1U19:A) | AMDA | Site 2 | H-bond, hydrophobic interaction | Asp155, Cys227, Val366 |
| 3 | Kanagarajadurai et al. [41] | β2-adrenergic receptor (PDB entry 2RH1) | Haloperidol | Site 2 | H-bond, hydrophobic interaction | Asp155, Phe339, Phe340, Tyr370 |
| 4 | Yap et al. [42] | β2-adrenergic receptor (PDB entry 2RH1) | Ketanserin | Site 2 | H-bond | Thr134, Asp155, Phe234, Val235, Ser239 |
| 5 | Sencanski et al. [43] | β2-adrenergic receptor (PDB entry 3D4S) | Antagonist 12 | Site 2 | H-bond, π-π stacking, salt bridge | Asp155, Ser159, Trp336, Phe339, Asn343, Tyr370 |
| 6 | Ponnala et al. [44] | β2-adrenergic receptor (PDB entry 2RH1) | Antagonist 7b | Site 2 | H-bond, hydrophobic interaction | Asp155, Phe339, Phe340 |
| 7 | Deng et al. [45] | β2-adrenergic receptor | Antagonist 5g | Site 2 | H-bond, cation-π | Trp151, Asp155, Ser159, Tyr370 |
| 8 | Gandhimathi et al. [46] | β2-adrenergic receptor (PDB entry 2RH1) | Spiperone | Site 2 | H-bond, salt bridge | Asp155, Asn363 |
| 9 | Gandhimathi et al. [46] | β2-adrenergic receptor (PDB entry 3SN6) | Spiperone | Site 2 | H-bond, π-π stacking | Trp151, Asp155, Asn343 |
Table 3.
Summary of 3D-QSAR results.
| PLS Statistics | CoMFA | CoMSIA |
| Q2 | 0.496 | 0.587 |
| R2ncv | 0.914 | 0.900 |
| R2pre | 0.831 | 0.897 |
| F | 132.803 | 94.879 |
| SEE | 0.148 | 0.161 |
| SEP | 0.402 | 0.339 |
| ONC | 6 | 7 |
| Field Contribution/% | ||
| Steric | 55.6 | 24.5 |
| Electrostatic | 44.4 | 45.4 |
| H-bond donor | - | 14.9 |
| H-bond acceptor | - | 15.2 |
Q2: cross-validated correlation coefficient; R2ncv: non-cross-validated correlation coefficient; R2pre: predicted correlation coefficient; F: ratio of R2ncv explained to unexplained, F = R2ncv/(1 − R2ncv); SEE: standard error of estimate; SEP: standard error of prediction; ONC: optimal number of components.
© 2017 by the authors. Licensee MDPI, Basel, Switzerland. This article is an open access article distributed under the terms and conditions of the Creative Commons Attribution (CC BY) license (http://creativecommons.org/licenses/by/4.0/).
Share and Cite
MDPI and ACS Style
Lin, F.; Li, F.; Wang, C.; Wang, J.; Yang, Y.; Yang, L.; Li, Y. Mechanism Exploration of Arylpiperazine Derivatives Targeting the 5-HT2A Receptor by In Silico Methods. Molecules 2017, 22, 1064. https://doi.org/10.3390/molecules22071064
AMA Style
Lin F, Li F, Wang C, Wang J, Yang Y, Yang L, Li Y. Mechanism Exploration of Arylpiperazine Derivatives Targeting the 5-HT2A Receptor by In Silico Methods. Molecules. 2017; 22(7):1064. https://doi.org/10.3390/molecules22071064
Chicago/Turabian StyleLin, Feng, Feng Li, Chao Wang, Jinghui Wang, Yinfeng Yang, Ling Yang, and Yan Li. 2017. "Mechanism Exploration of Arylpiperazine Derivatives Targeting the 5-HT2A Receptor by In Silico Methods" Molecules 22, no. 7: 1064. https://doi.org/10.3390/molecules22071064