3.1. Chemistry
Proton (
1H) and carbon (
13C) NMR spectra were recorded on a Brüker 400 Ultra-shield™ spectrometer (Brüker, Rheinstetten, Germany) using DMSO-
d6 or CDCl
3 as solvent. IR spectra were recorded on a Thermo Nicolet FT-IR Nexus spectrophotometer (Thermo Nicolet, Madison, WI, USA) using KBr pellets for solid samples or NaCl plates for oil compounds. Elemental analysis was performed on a LECO CHN-900 Elemental Analyzer (LECO, Saint Joseph, MI, USA). The purity of all final compounds was 99% or higher. Chemicals were purchased from E. Merck (Darmstadt, Germany), Panreac Química S.A. (Barcelona, Spain), Sigma-Aldrich Quimica, S.A. (Madrid, Spain) and Acros Organics (Janssen Pharmaceuticalaan, Geel, Belgium). The synthesis of 34 out of the 40 compounds analysed in this work has been previously described [
28,
29].
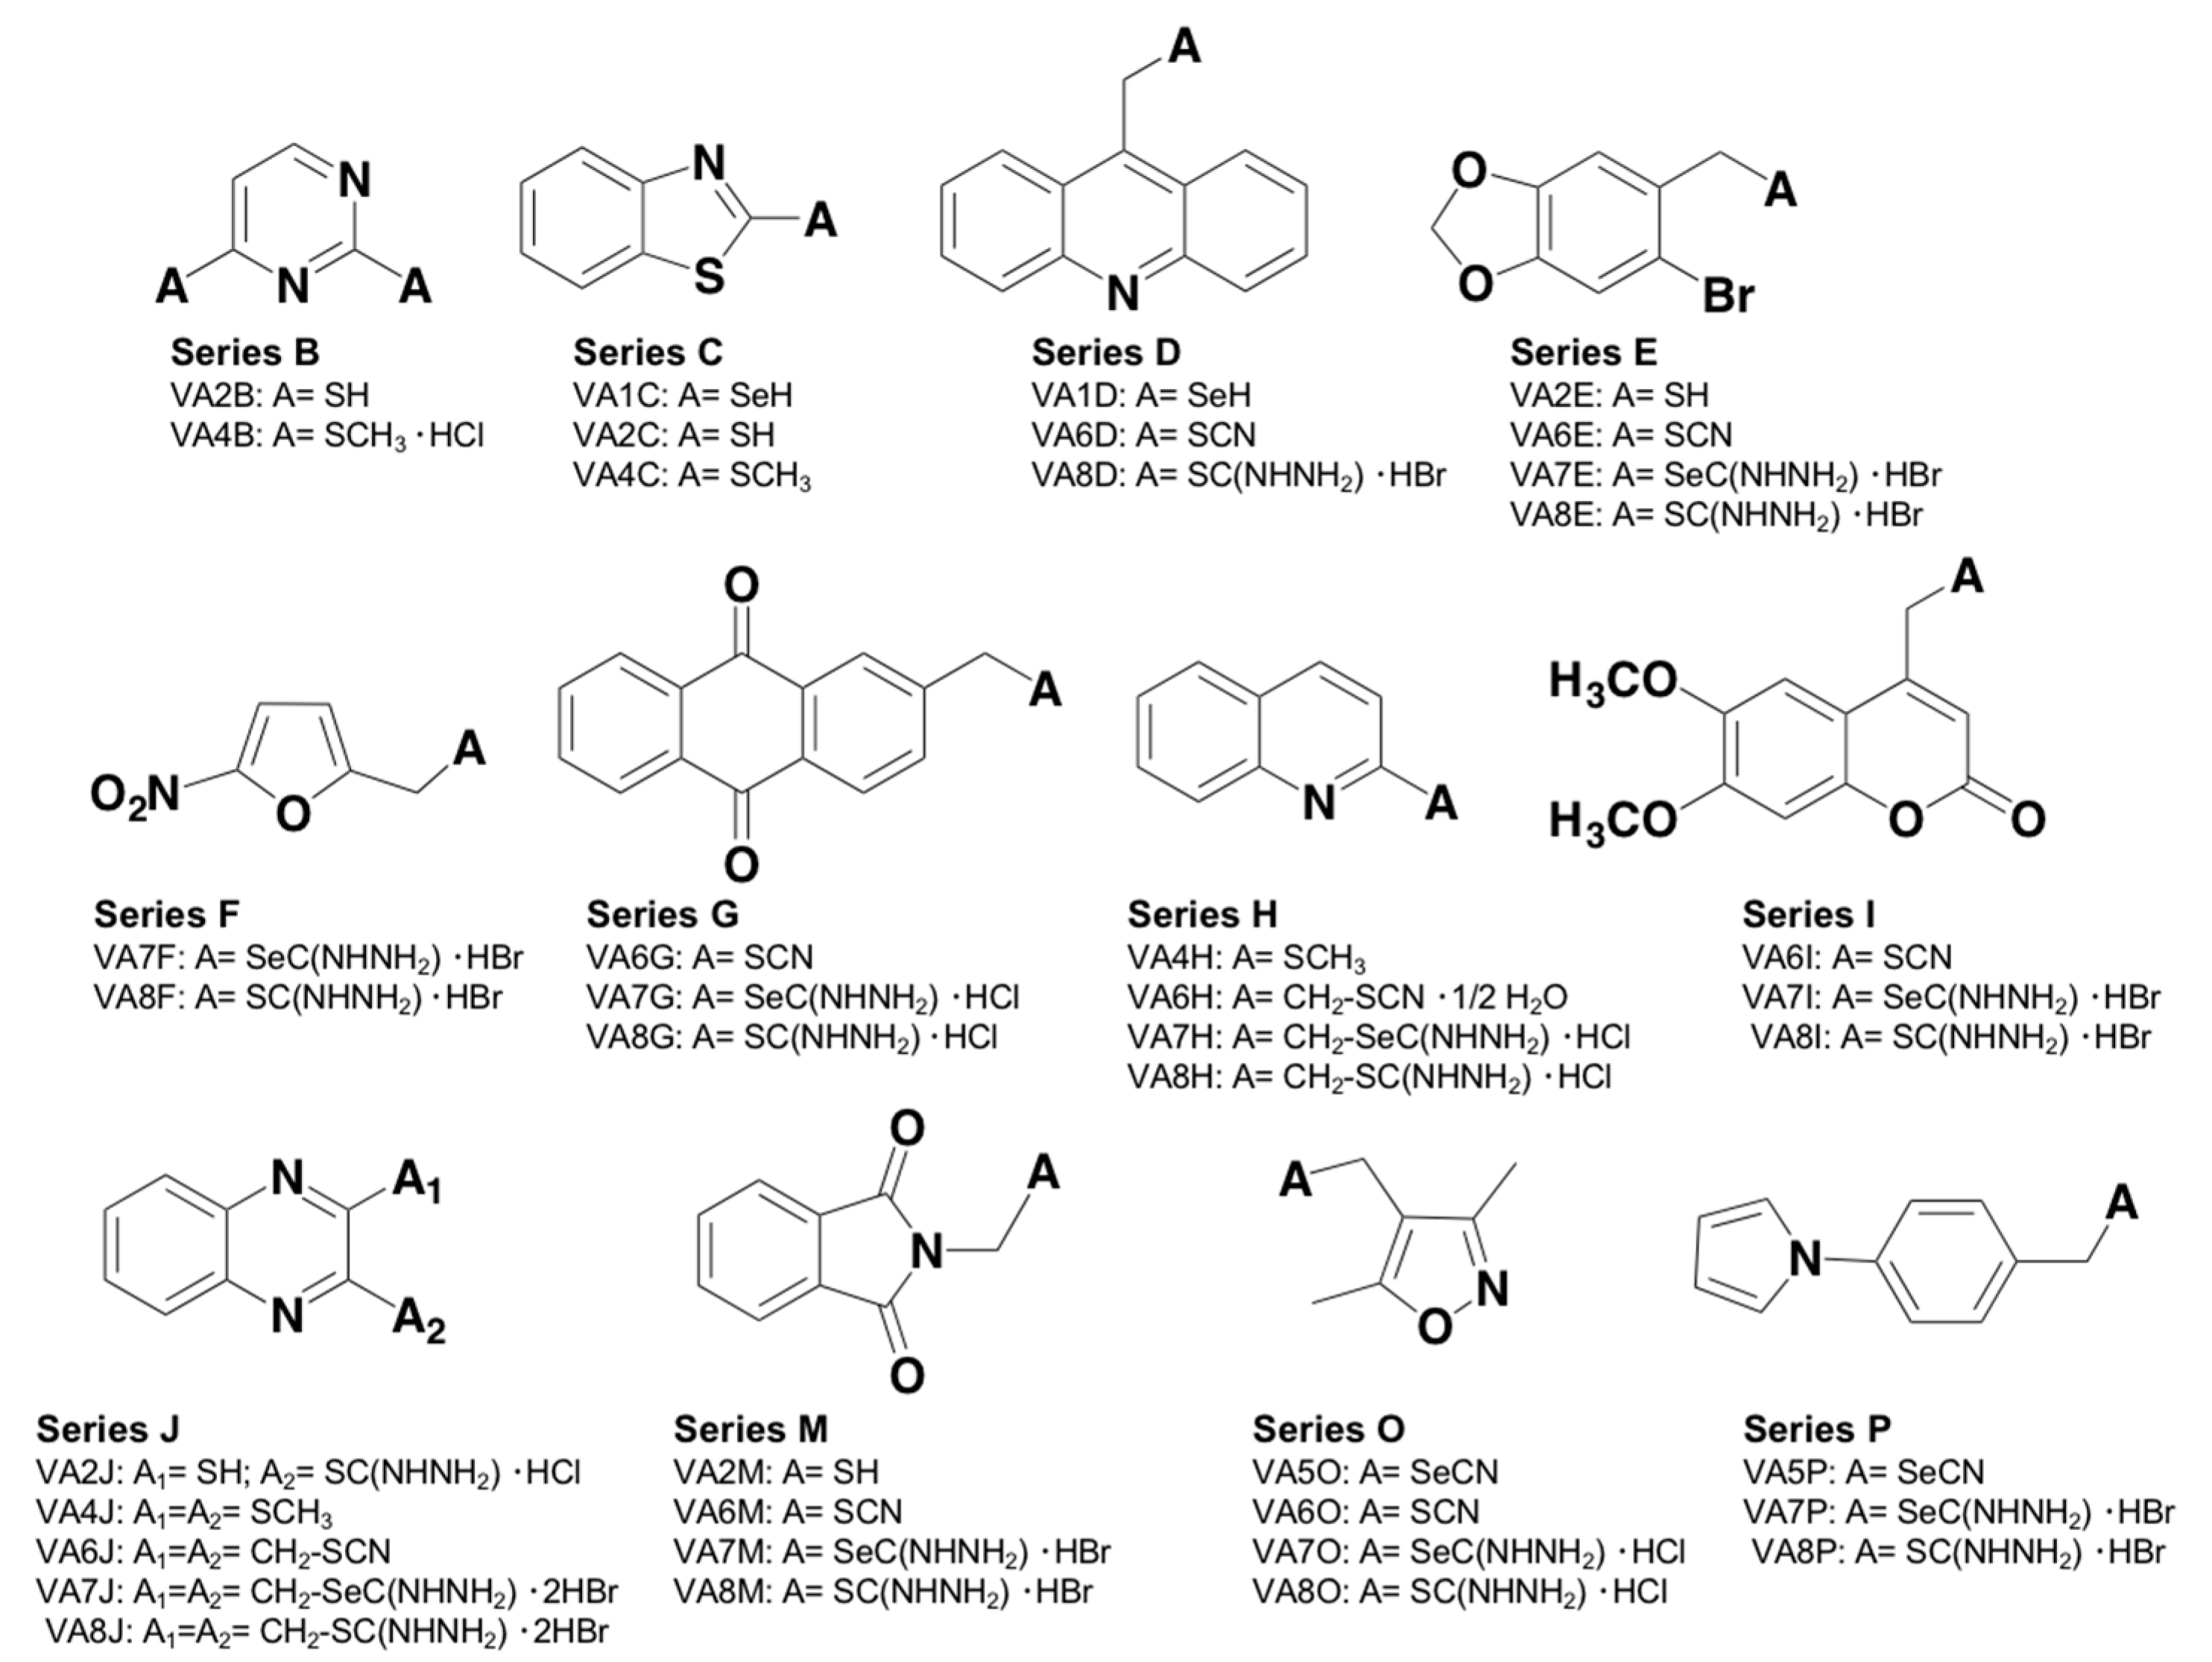
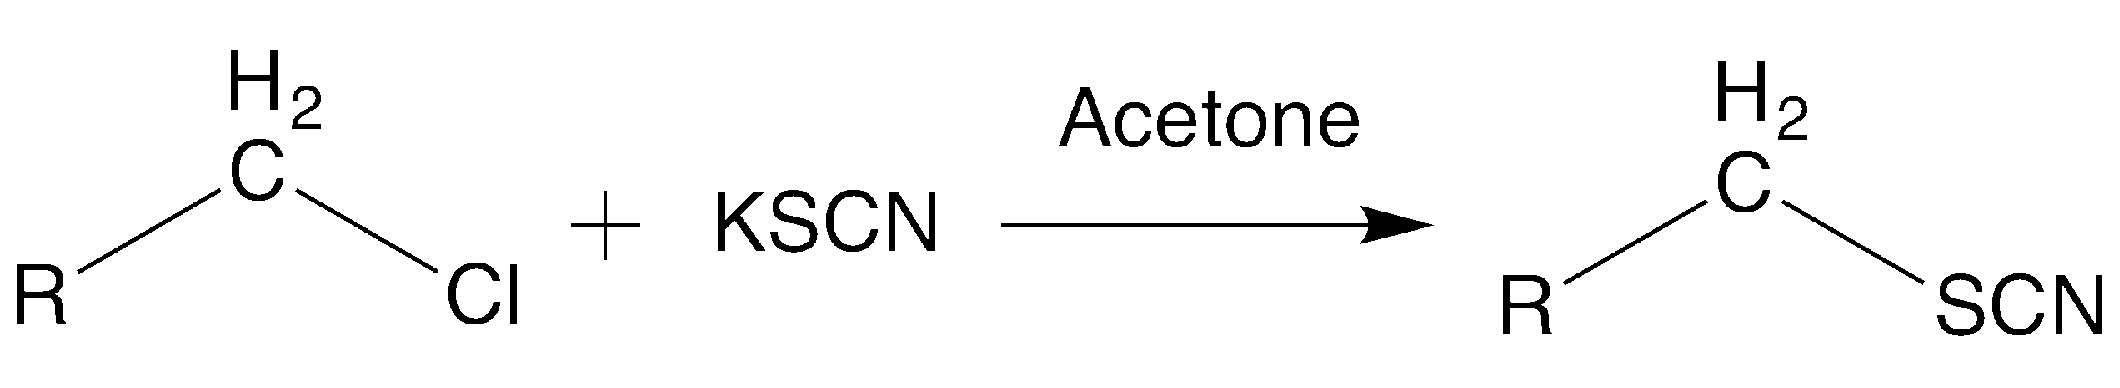
3.1.1. General Procedure for the Synthesis of Compounds VA6G, VA6H, VA6I and VA6J
The synthesis (
Scheme 1) was carried out from the corresponding alkyl-halide reagent and potassium-thiocyanate in acetone at reflux, as previously described. The corresponding halide reagent (1 mmol) was added to a mixture of 1.2 mmol of potassium thiocyanate in dry acetone (20 mL). The mixture was stirred at reflux for 3.5–4 h and the product was isolated by filtration after the addition of 50 mL of water and purified by washing or recrystallization.
3.1.2. 3-Mercaptoquinoxalin-2-yl Carbamimidothioate Hydrochloride (VA2J)
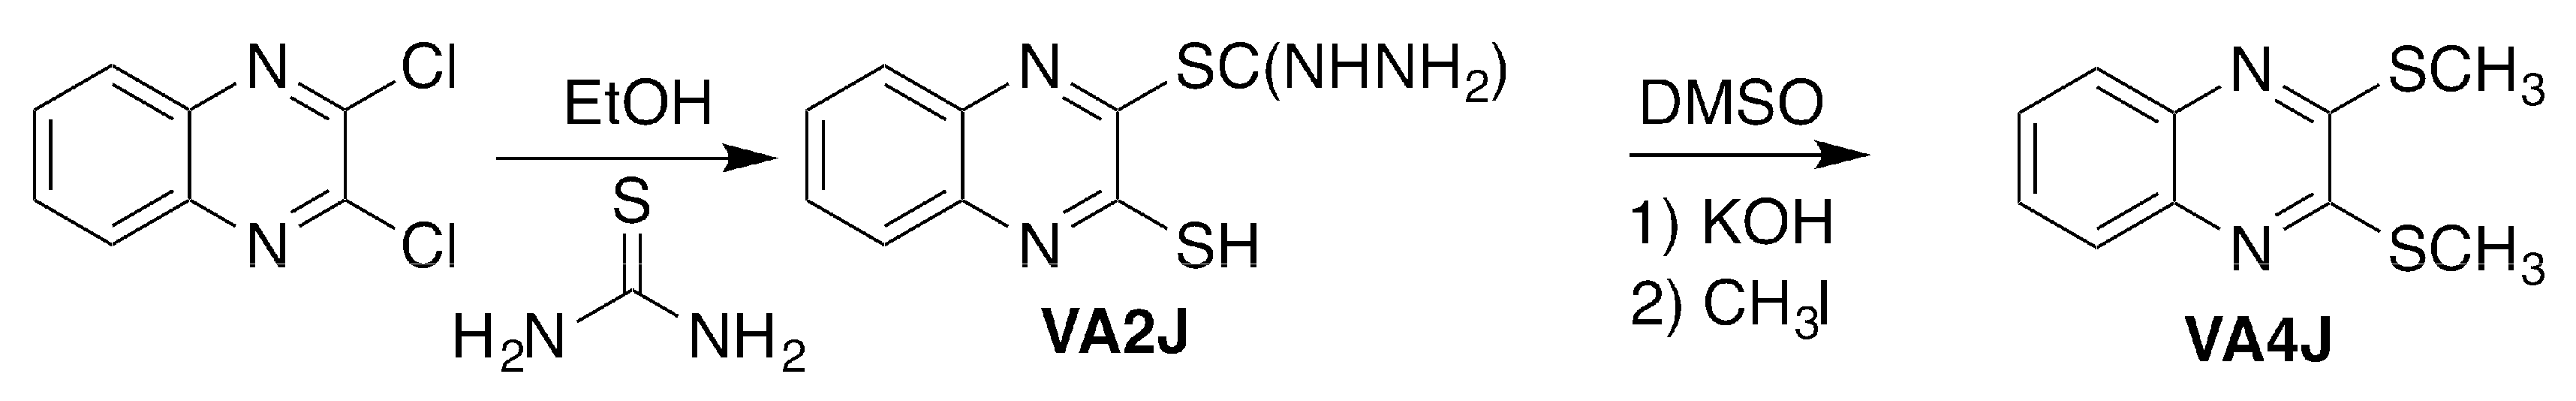
To obtain compound VA2J, 2,3-dichloroquinoxaline was treated with thiourea in a 1:2.2 (reagent/thiourea) molar ratio (
Scheme 2) at reflux for 4 h using absolute ethanol as solvent (20 mL). The product was purified by recrystallization from methanol. An orange powder was obtained. Yield: 42%; melting point (m.p.): 197–198 °C (direct combustion).
1H-NMR (400 MHz, DMSO-
d6): δ 7.54 (t, 1H,
J = 7.3 Hz, H6), 7.66–7.72 (m, 2H, H5 + H7), 7.90 (d, 1H,
J = 8.1 Hz, H8), 9.76 + 9.95 (bs + bs, 4H, NH + NH
2 + HCl), 15.13 ppm (bs, 1H, SH).
13C-NMR (100 MHz, DMSO-
d6): δ 117.4 (C6), 127.4 (C7), 128.7 (C5), 131.9 (C8), 132.0 (C4a), 135.6 (C8a), 160.7 (C3), 165.4 (C2), 171.4 ppm (S–C–(NH)(NH
2)). IR (KBr):
3380–3200 (s; N–H, N–H
2), 1625 cm
−1 (s; C=N). MS [
m/
z (% abundance)]: 194 (100), 161 (16), 150 (43), 134 (25). Elemental analysis calculated (%) for C
9H
8N
4S
2·HCl: C: 39.63, H: 3.33, N: 20.54; found: C: 39.92, H: 3.61, N: 20.19.
3.1.3. 2,3-Bis(methylsulfanyl)quinoxaline (VA4J)
VA4J was synthesized by adding 1 mmol of VA2J to a suspension of 3.6 mmol of potassium hydroxide in DMSO (5 mL) and stirring for 1 h at room temperature (r.t.). Then, 4 mmol of methyl iodide were added and stirred for additional 4 h at r.t. (
Scheme 2). The reaction medium was then poured into ice and the resultant precipitate was filtered and solved in dichloromethane (40 mL). The insoluble fraction was discarded and the solvent was removed under vacuum by rotatory evaporation. A yellow powder was obtained. Yield: 53%; mp: 118–119 °C.
1H-NMR (400 MHz, CDCl
3): δ 2.75 (s, 6H, (CH
3) × 2), 7.58–7.61 (m, 2H, H6 + H7), 7.91–7.96 ppm (m, 2H, H5 + H8).
13C-NMR (100 MHz, DMSO-
d6): δ 13.7 ((CH
3) × 2), 128.1 (C5 + C8), 129.4 (C6 + C7), 139.9 (C4a + C8a), 155.3 ppm (C2 + C3). IR (KBr):
2919 (m; C–H
aliph), 1615 cm
−1 (s; C=N). MS [
m/
z (% abundance)]: 222 (52; M
+•), 207 (100), 192 (31), 175 (8), 160 (20), 102 (17). Elemental analysis calculated (%) for C
10H
10N
2S
2·1/2H
2O: C: 51.87, H: 4.76, N: 12.10; found: C: 51.63, H: 4.56, N: 12.46.
3.1.4. (9,10-Dioxo-9,10-dihydroanthracen-2-yl)methyl Thiocyanate (VA6G)
From 2-(chloromethyl)-9,10-dioxo-9,10-dihydroanthracen. Conditions: 3.5 h at reflux; recrystallized from ethanol. A yellow powder was obtained. Yield: 46%; m.p.: 174–175 °C. 1H-NMR (400 MHz, DMSO-d6): δ 4.58 (s, 2H, –CH2–), 7.93–7.96 (m, 3H, H1 + H3 + H4), 8.20–8.29 ppm (m, 4H, H5 + H6 + H7+ H8). 13C-NMR (100 MHz, DMSO-d6): δ 37.1 (–CH2–), 113.7 (–SCN), 127.6 (C5 + C8), 128.0 (C1), 128.3 (C4), 133.4 (C3), 133.8 (C4a), 134.1 (C6 + C7), 135.4 (C8a + C10a), 135.7 (C9a), 144.1 (C2), 183.0 ppm (C9 + C10). IR (KBr): 2149 (m, C≡N), 1671 cm−1 (s, C=O). MS [m/z (% abundance)]: 279 (5; M+•), 221 (100), 193 (51), 165 (27). Elemental analysis calculated (%) for C16H9NO2S: C: 68.80, H: 3.25, N: 5.01; found: C: 68.59, H: 3.31, N: 4.82.
3.1.5. Quinolin-2-ylmethyl Thiocyanate (VA6H)
The commercially available 2-(chloromethyl)quinoline hydrochloride was treated with basic water (50 mL) in order to obtain the free base, which was used for the synthesis of VA6H. Conditions: 4 h at reflux. The precipitate was washed with ethyl ether (20 mL). A brown powder was obtained. Yield: 41%; m.p.: 80–81 °C. 1H-NMR (400 MHz, DMSO-d6): δ 4.74 (s, 2H, –CH2–), 7.63–7.66 (m, 2H, H3 + H6), 7.80 (t, 1H, J = 7.8 Hz, H7), 8.01 (d, 2H, J = 8.6 Hz, H5 + H8), 8.44 ppm (d, 1H, J = 8.5 Hz, H4). 13C NMR (100 MHz, DMSO-d6): δ 40.0 (–CH2–), 113.9 (–SCN), 121.8 (C3), 127.8 (C6), 127.9 (C4a), 128.8 (C5), 129.3 (C8), 131.0 (C7), 138.2 (C4), 147.8 (C8a), 156.4 ppm (C2). IR (KBr): 3058 (m; C–Harom), 2946 (m; C–Haliph), 2147 (s; C≡N), 1655 cm−1 (m; C=N). MS [m/z (% abundance)]: 200 (100; M+•), 174 (6), 142 (100), 128 (9), 115 (47). Elemental analysis calculated (%) for C11H8N2S·1/2H2O: C: 63.08, H: 4.30, N: 13.99; found: C: 62.96, H: 4.42, N: 13.15.
3.1.6. (6,7-Dimethoxy-2-oxo-2H-chromen-4-yl)methyl Thiocyanate (VA6I)
From 4-(bromomethyl)-6,7-dimethoxy-2-oxo-2H-chromene. Conditions: 4 h at reflux. The product was washed with ethyl ether and dichloromethane (20 mL of each). A white powder was obtained. Yield: 70%; m.p.: 204–205 °C. 1H-NMR (400 MHz, DMSO-d6): δ 3.83 + 3.88 (s, 6H, (–OCH3) × 2), 4.56 (s, 2H, –CH2–), 6.41 (s, 1H, H3), 7.13 (s, 1H, H5), 7.38 ppm (s, 1H, H8). 13C-NMR (100 MHz, DMSO-d6): δ 33.6 (–CH2–), 57.1 + 57.3 ((–OCH3) × 2), 101.5 (C8), 107.2 (C5), 110.0 (–SCN), 113.3 (C3), 114.0 (C4a), 146.9 (C6), 150.4 (C8a), 150.7 (C7), 153.8 (C4), 160.8 ppm (C2). IR (KBr): 3065 (w; C–Harom), 2999–2849 (m; C–Haliph), 2154 (s; C≡N), 1711 cm−1 (C=O). MS [m/z (% abundance)]: 277 (100; M+•), 234 (6), 219 (27), 191 (69), 147 (18). Elemental analysis calculated (%) for C13H11NO4S: C: 56.31, H: 4.00, N: 5.05; found: C: 56.40, H: 3.98, N: 4.88.
3.1.7. Quinoxalin-2,3-diyldimethanediyl Bisthiocyanate (VA6J)
From 2,3-bis(bromomethyl)quinoxaline. Conditions: 4 h. at reflux. The product was washed with ethyl ether (20 mL). A brown powder was obtained. Yield: 88%; m.p.: 158–159 °C (direct combustion). 1H-NMR (400 MHz, DMSO-d6): δ 4.98 (s, 4H, (–CH2–) × 2), 7.91–7.93 (m, 2H, H6 + H7), 8.11–8.14 ppm (m, 2H, H5 + H8). 13C-NMR (100 MHz, DMSO-d6): δ 37.7 ((–CH2–) × 2), 112.0 ((–SCN) × 2), 128.4 (C5 + C8), 128.4 (C6 + C7), 143.7 (C4a + C8a), 160.3 ppm (C2 + C3). IR (KBr): 2926 (m; C–Haliph), 2155 (s; C≡N), 1563–1485 cm−1 (m; C–Carom). MS [m/z (% abundance)]: 272 (36; M+•), 245 (14), 214 (100), 187 (15), 170 (13), 155 (30), 129(13). Elemental analysis calculated (%) for C12H8N4S2: C: 52.92, H: 2.96, N: 20.57; found: C: 52.7, H: 3.07, N: 20.77.
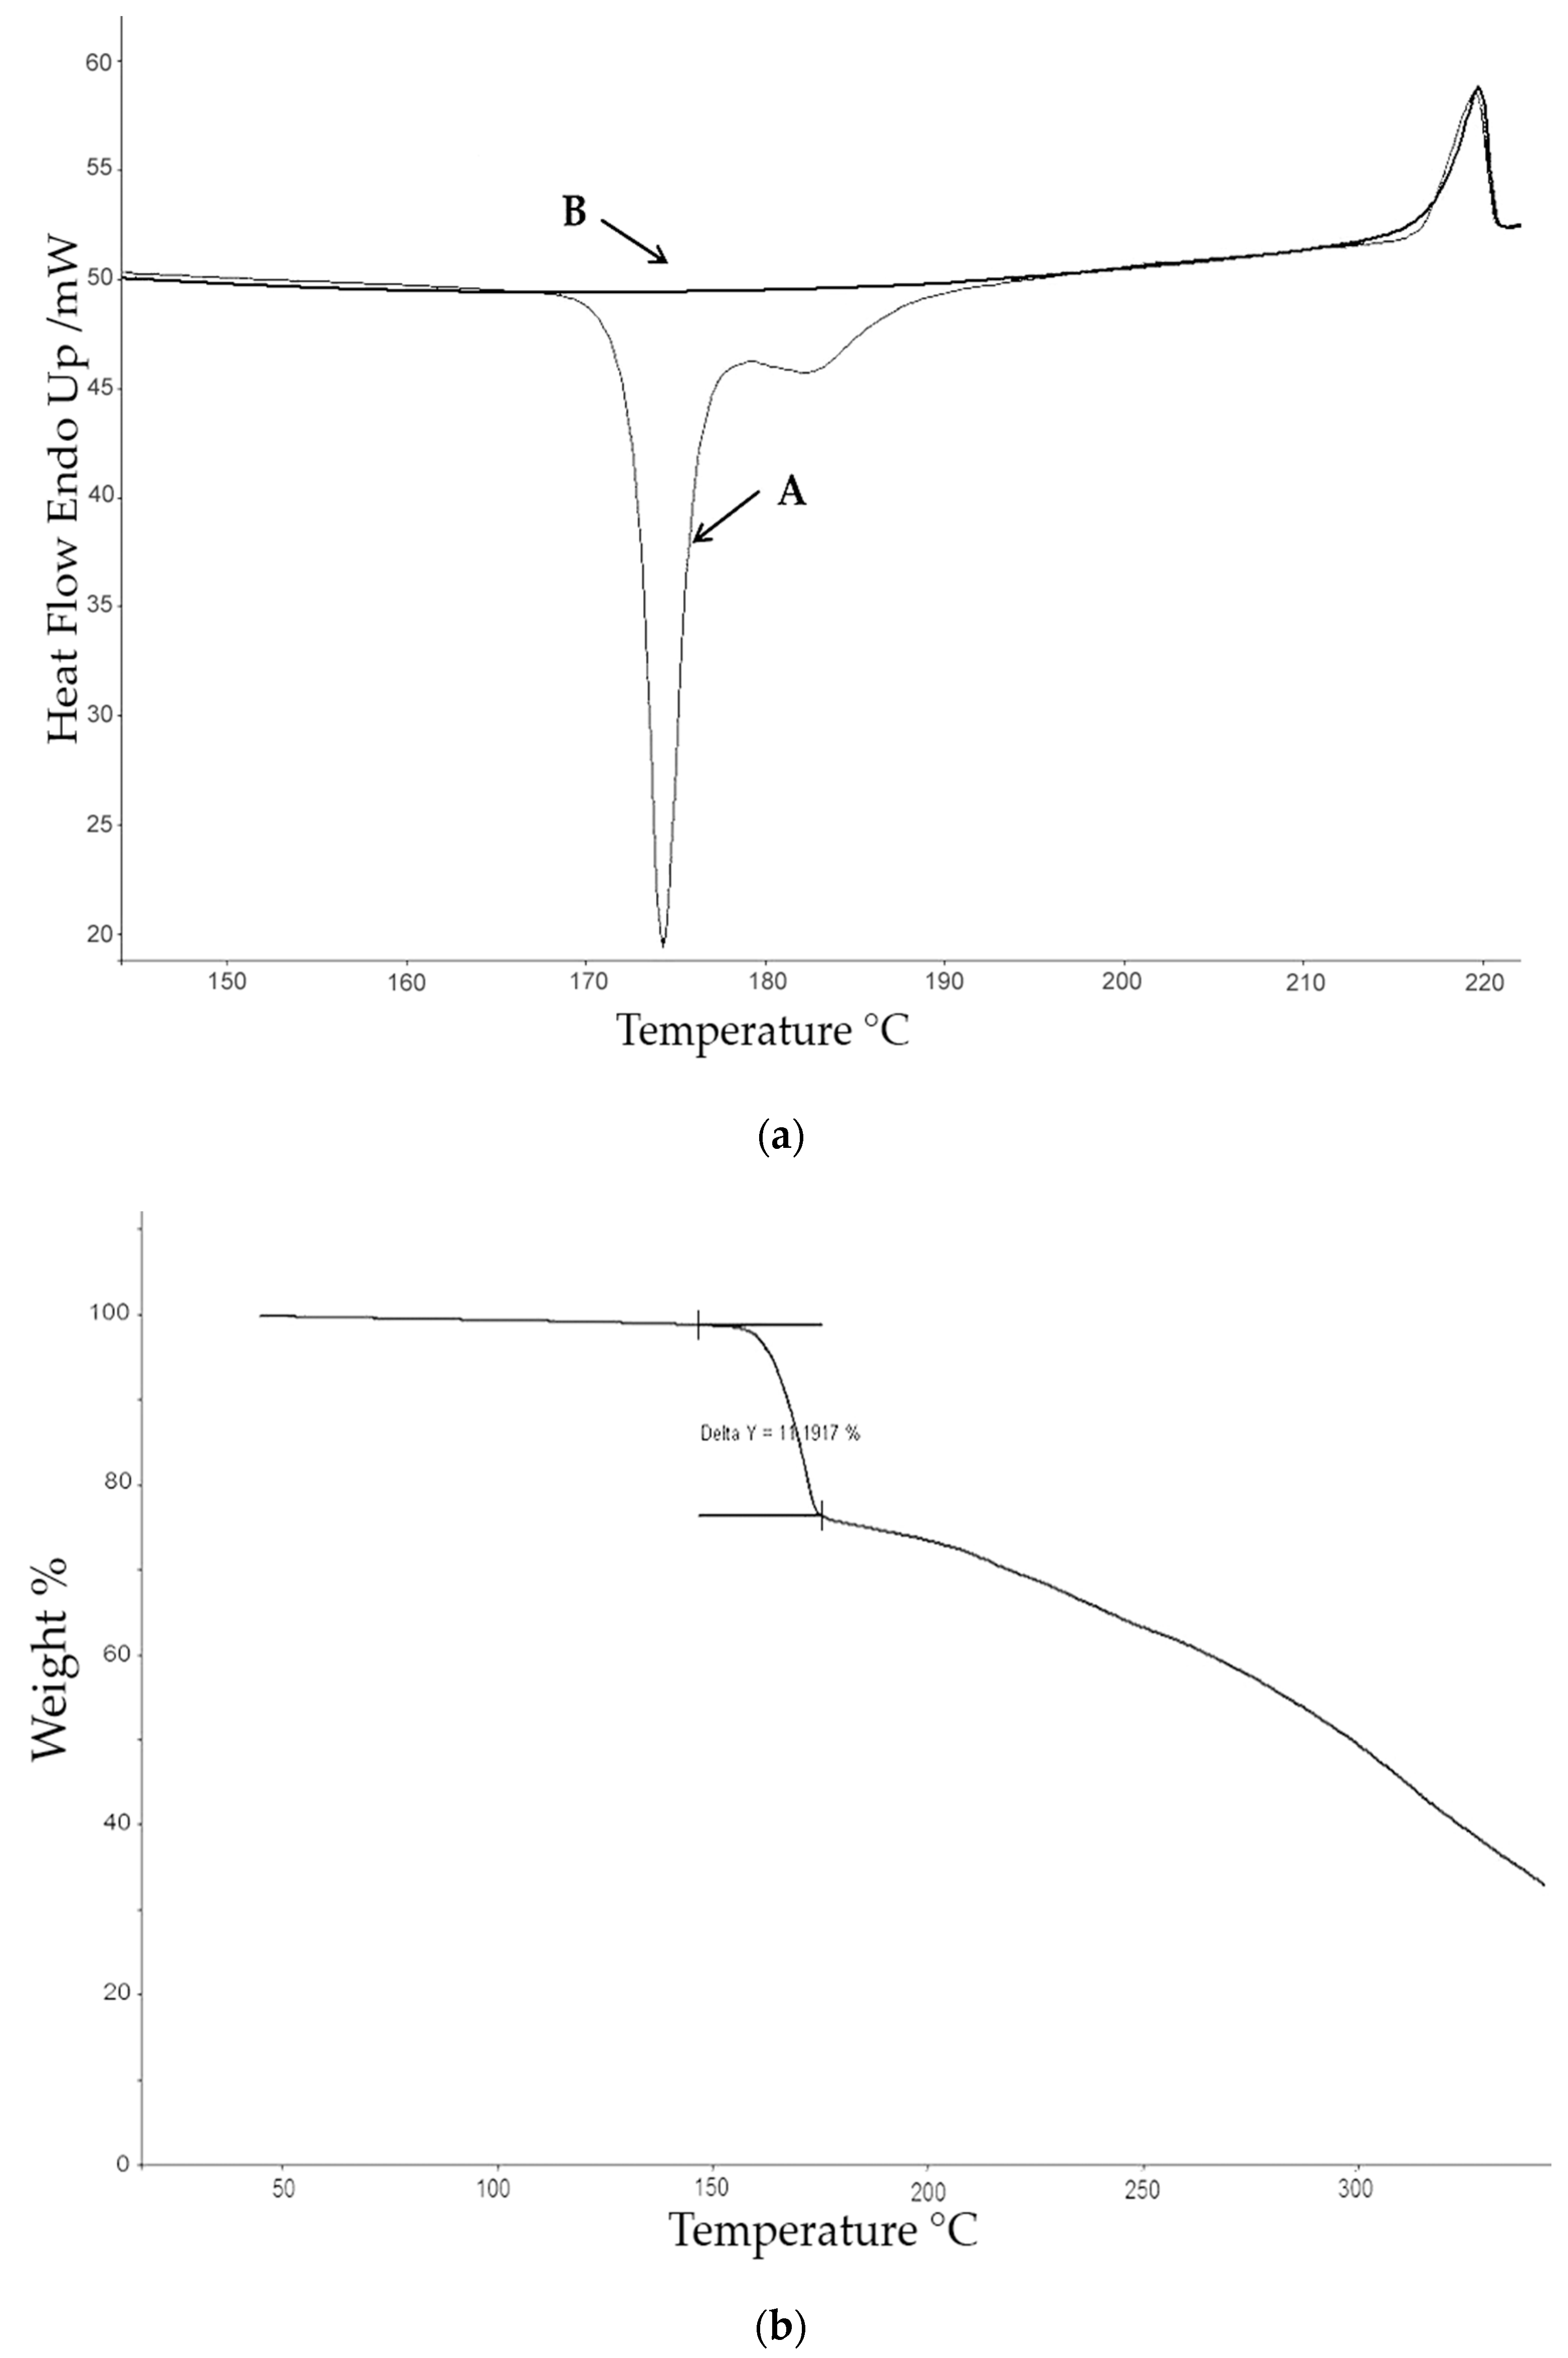
3.3. Thermal Analysis
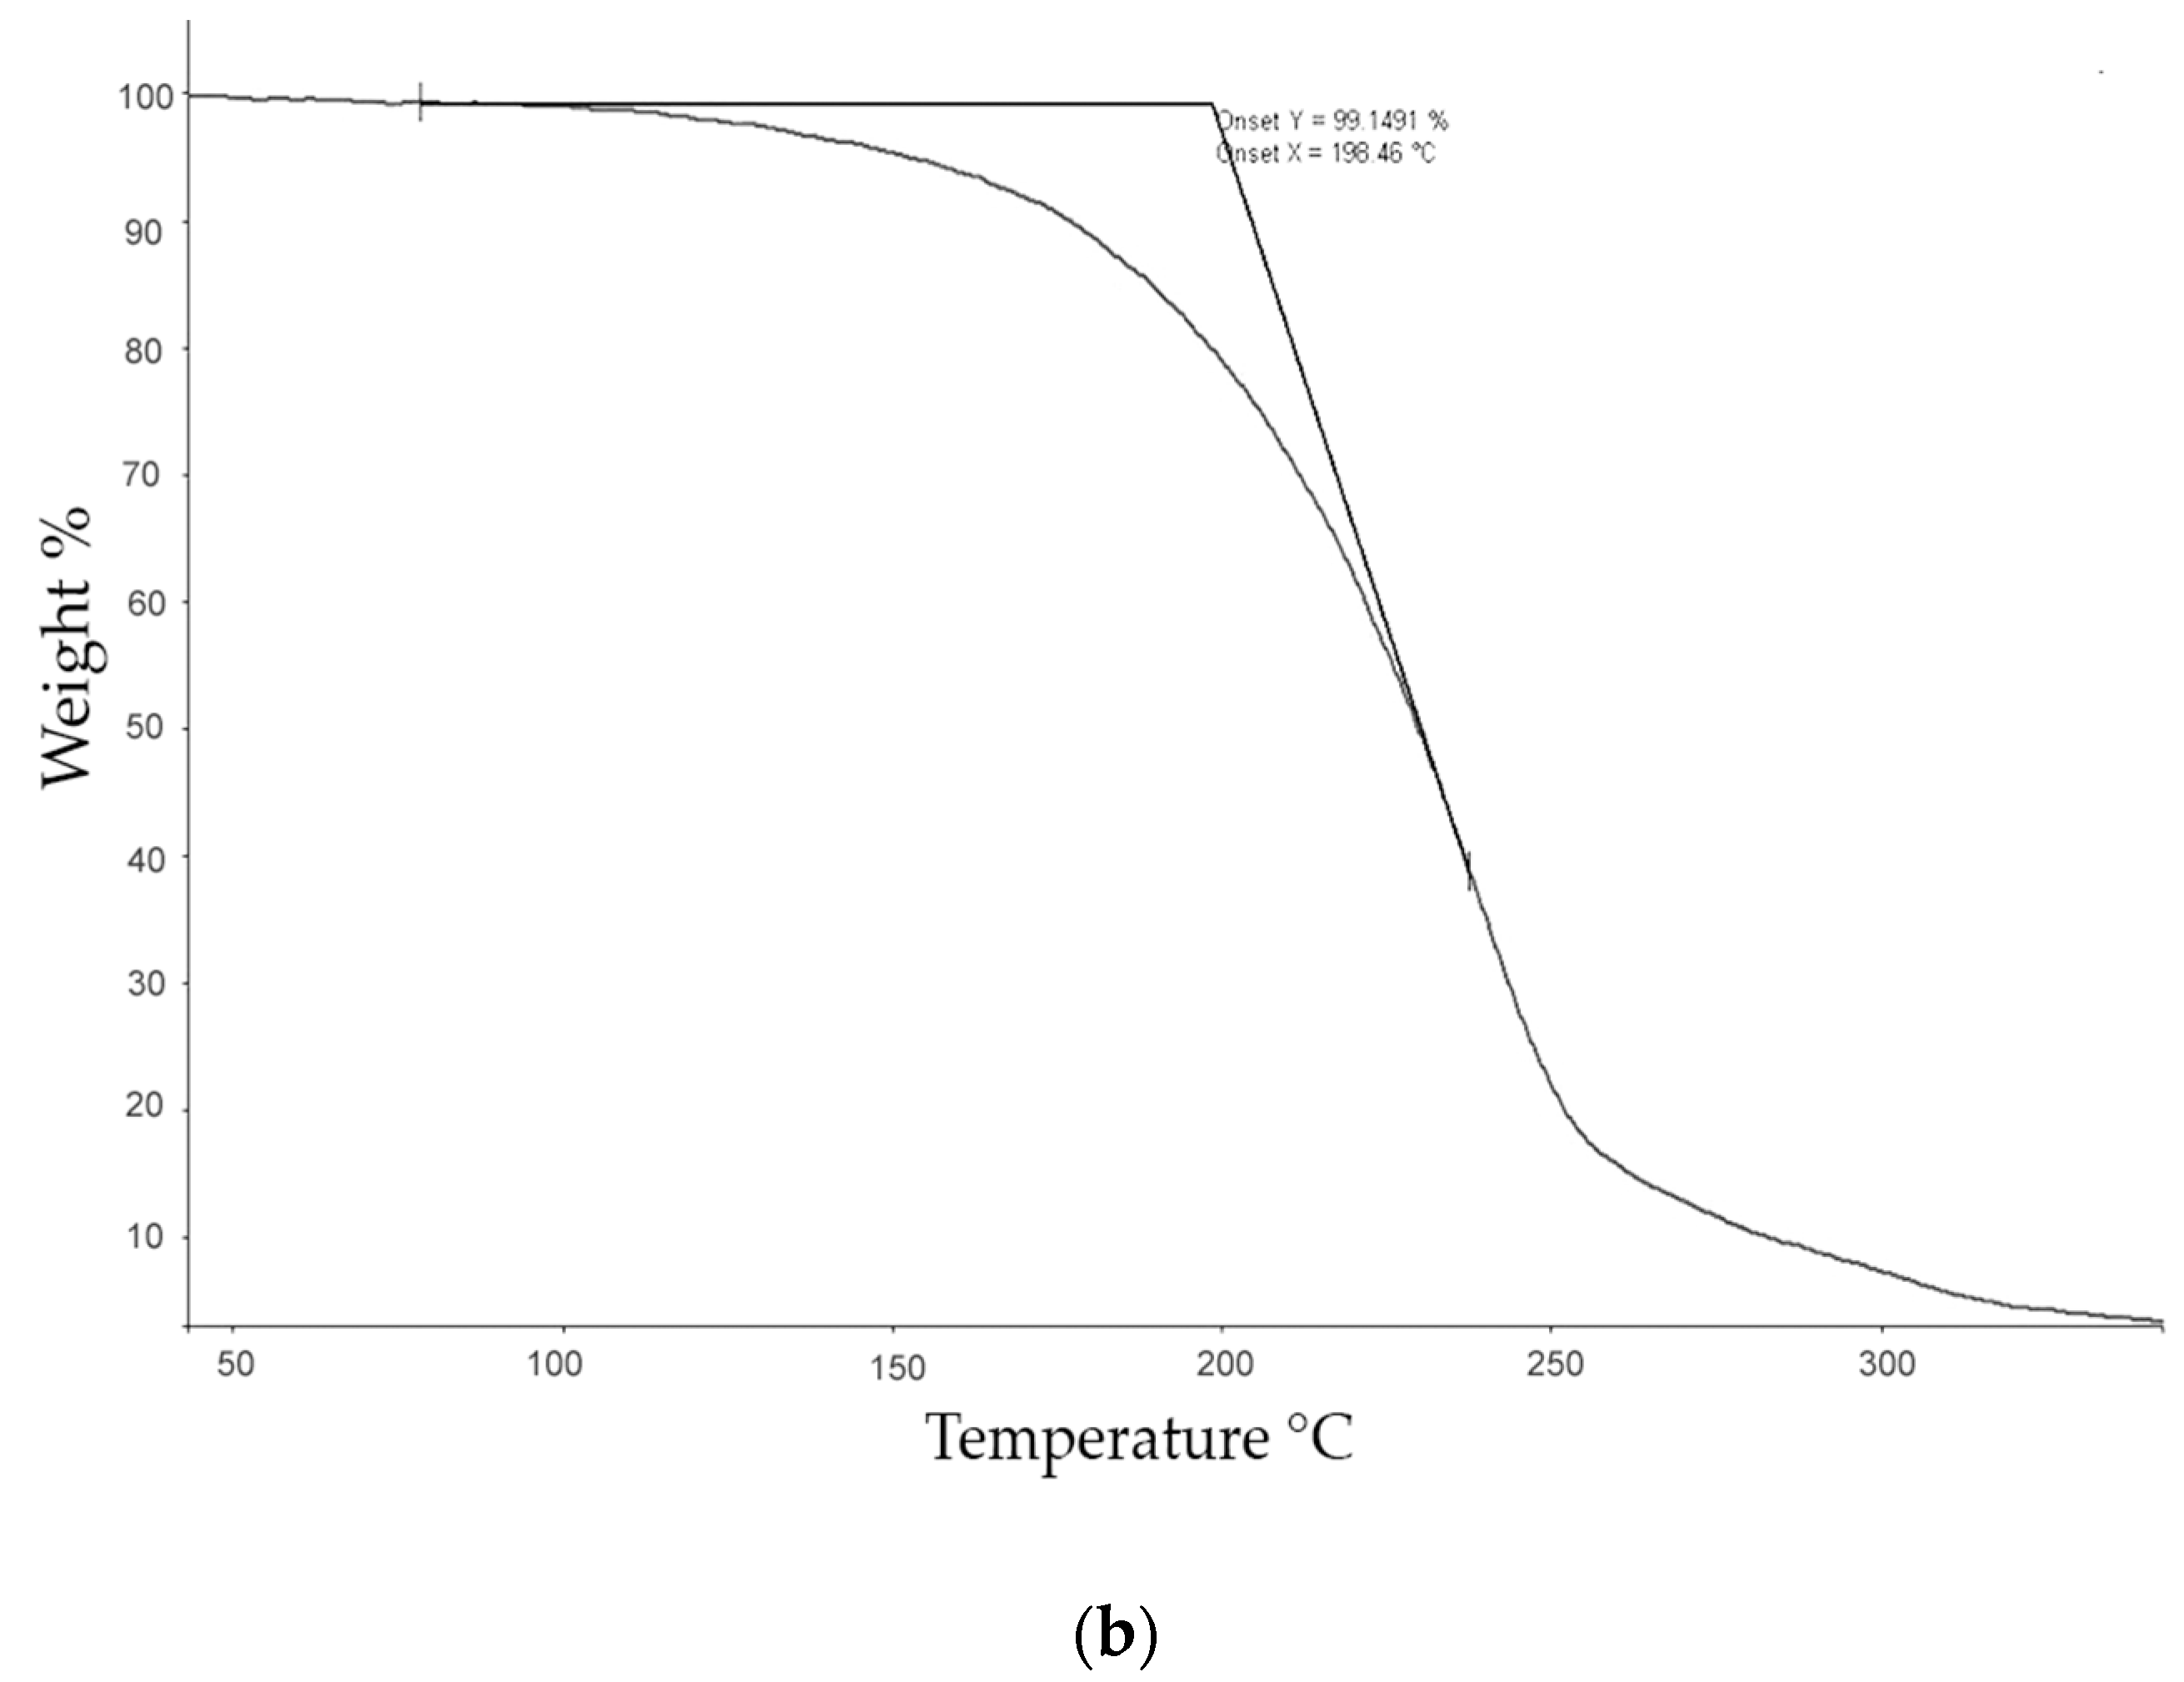
The thermogravimetric (TG) studies were carried out with a Perkin–Elmer TGA-7 (Perkin Elmer, Inc. Watham, MA, USA) which was calibrated with alumel and nickel at 10 °C·min−1. The calibration of the oven temperatures was carried out automatically and mass calibrated with a certified sample of 10 mg (ASTM E617, provided by Perkin Elmer, Inc. Watham, MA, USA). TG analyses were performed under a nitrogen atmosphere with a gas flow of 40 mL·min−1, from 50 to 350 °C, at a heating rate of 10 °C·min−1, using a sample of approximately 3 mg, in order to obtain the values of the Tonset and Tmax of the degradation process as well as any associated mass loss.
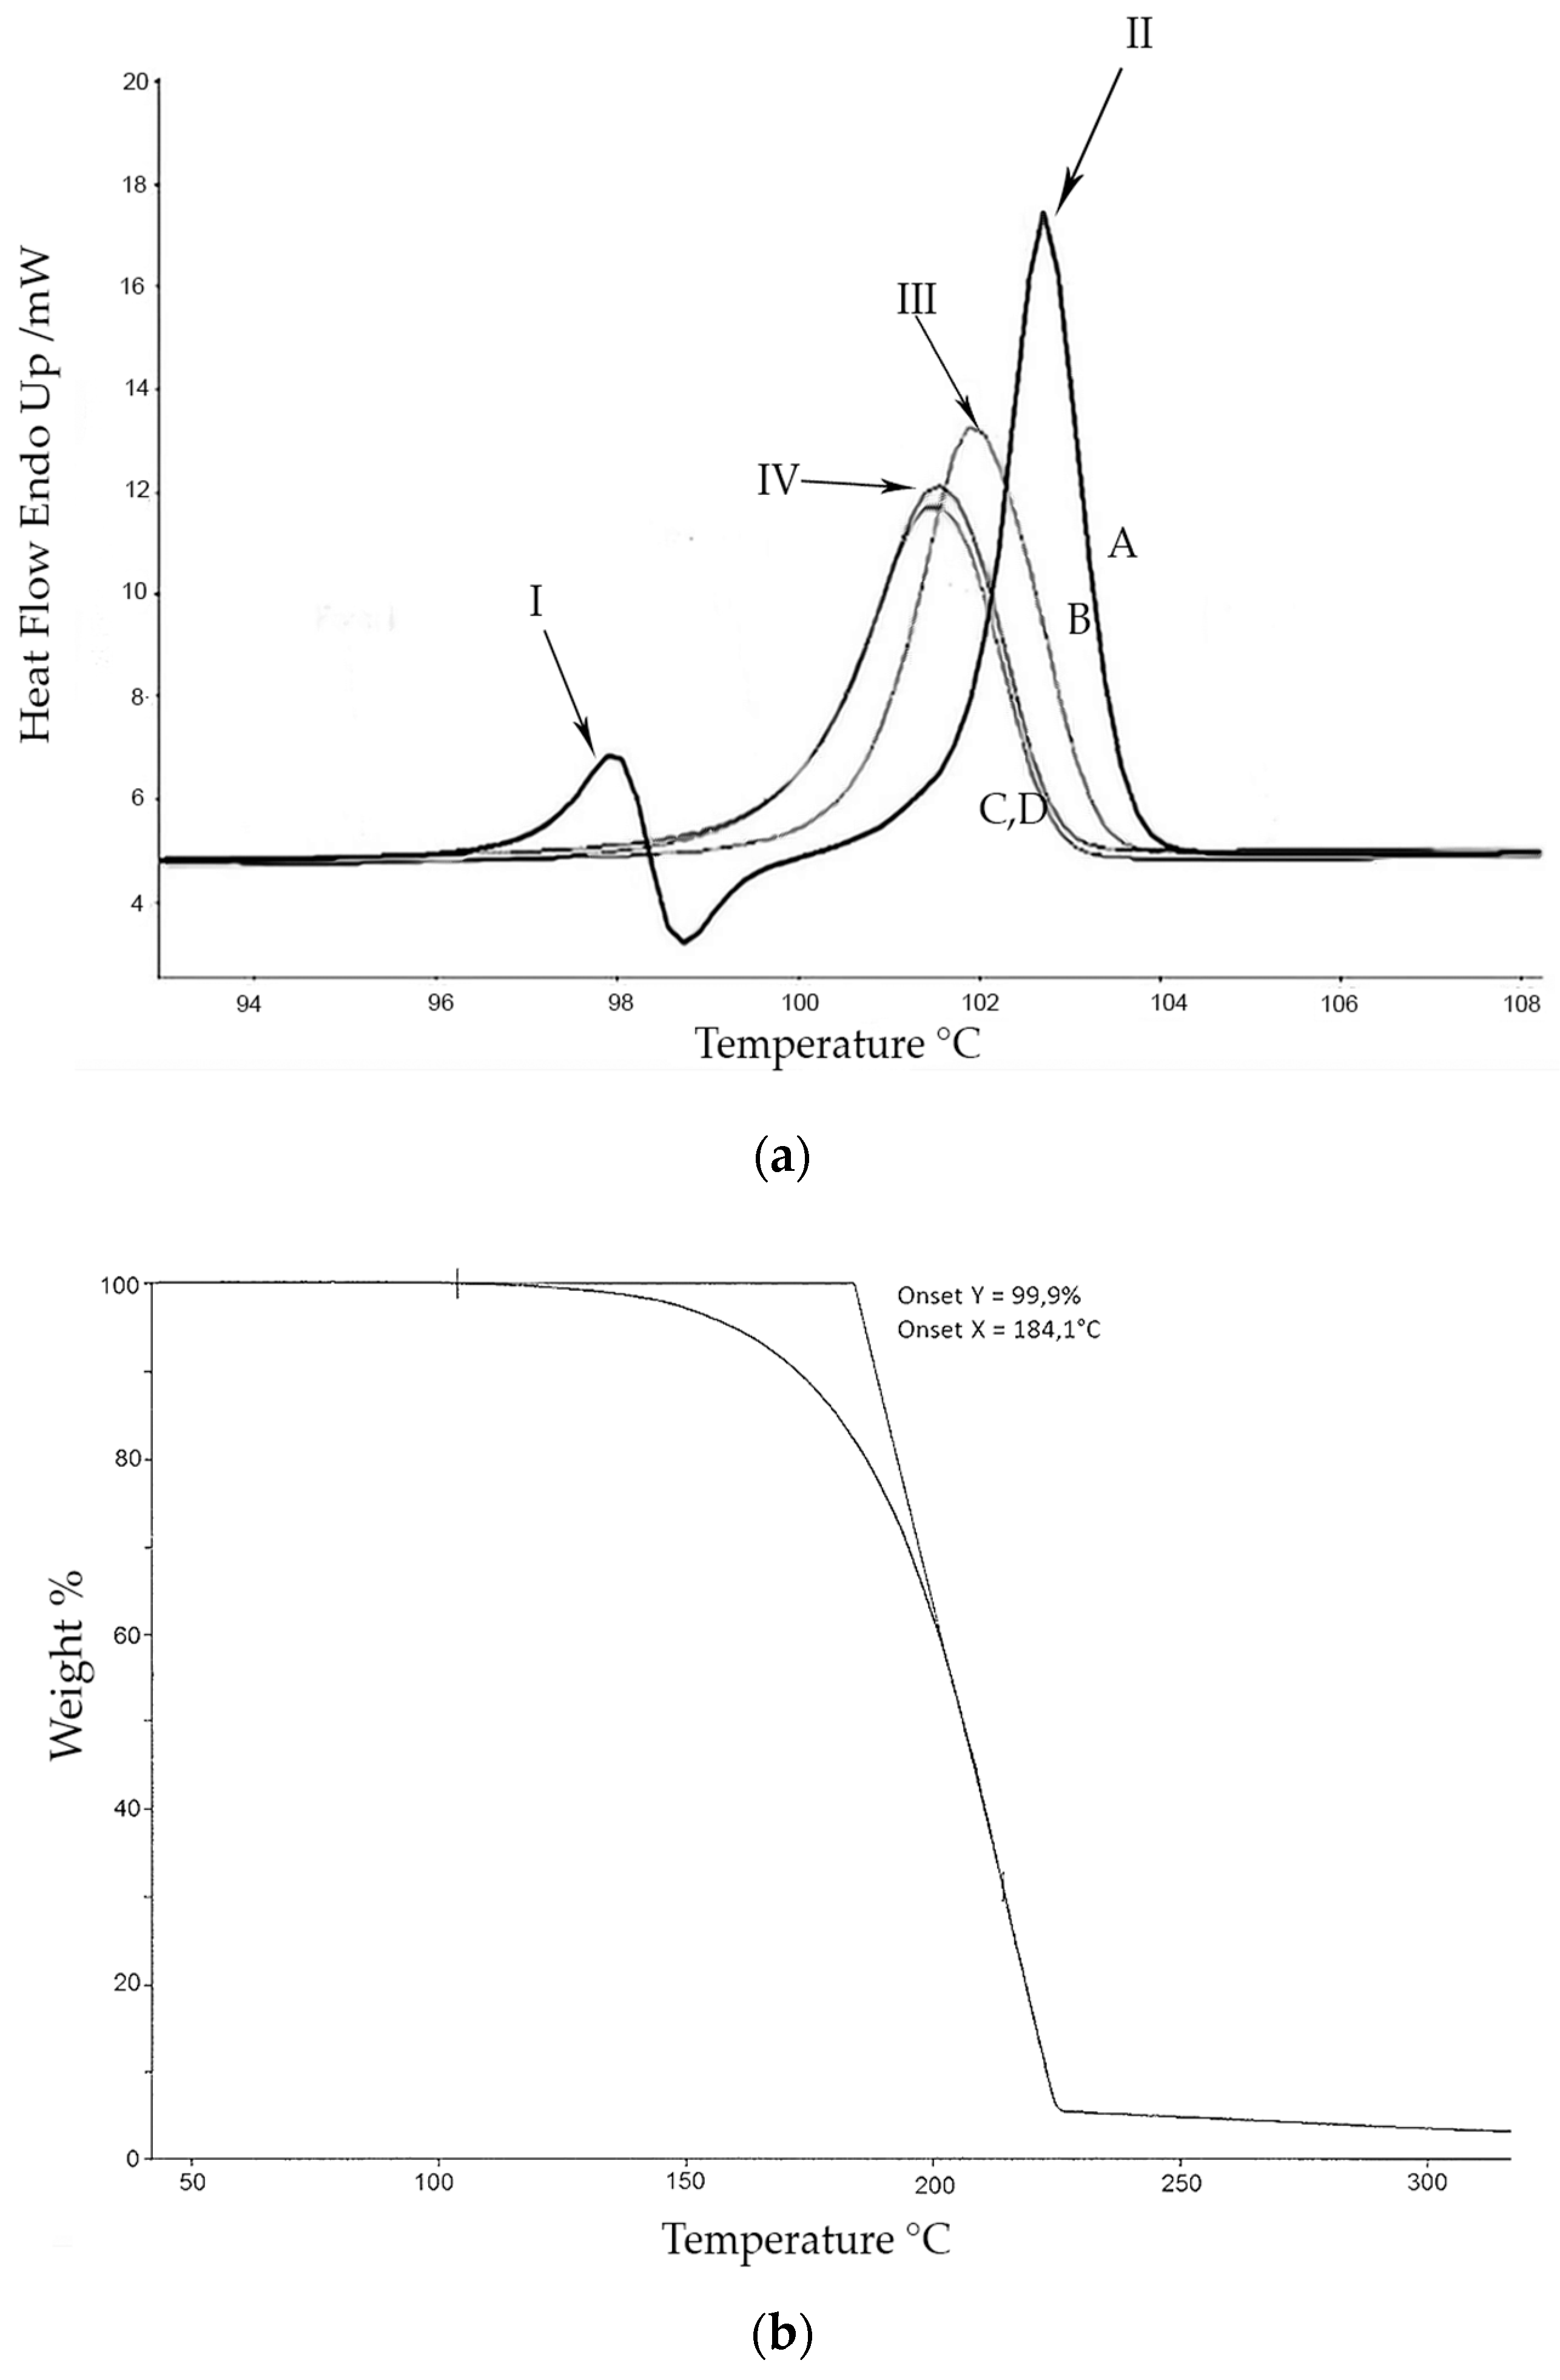
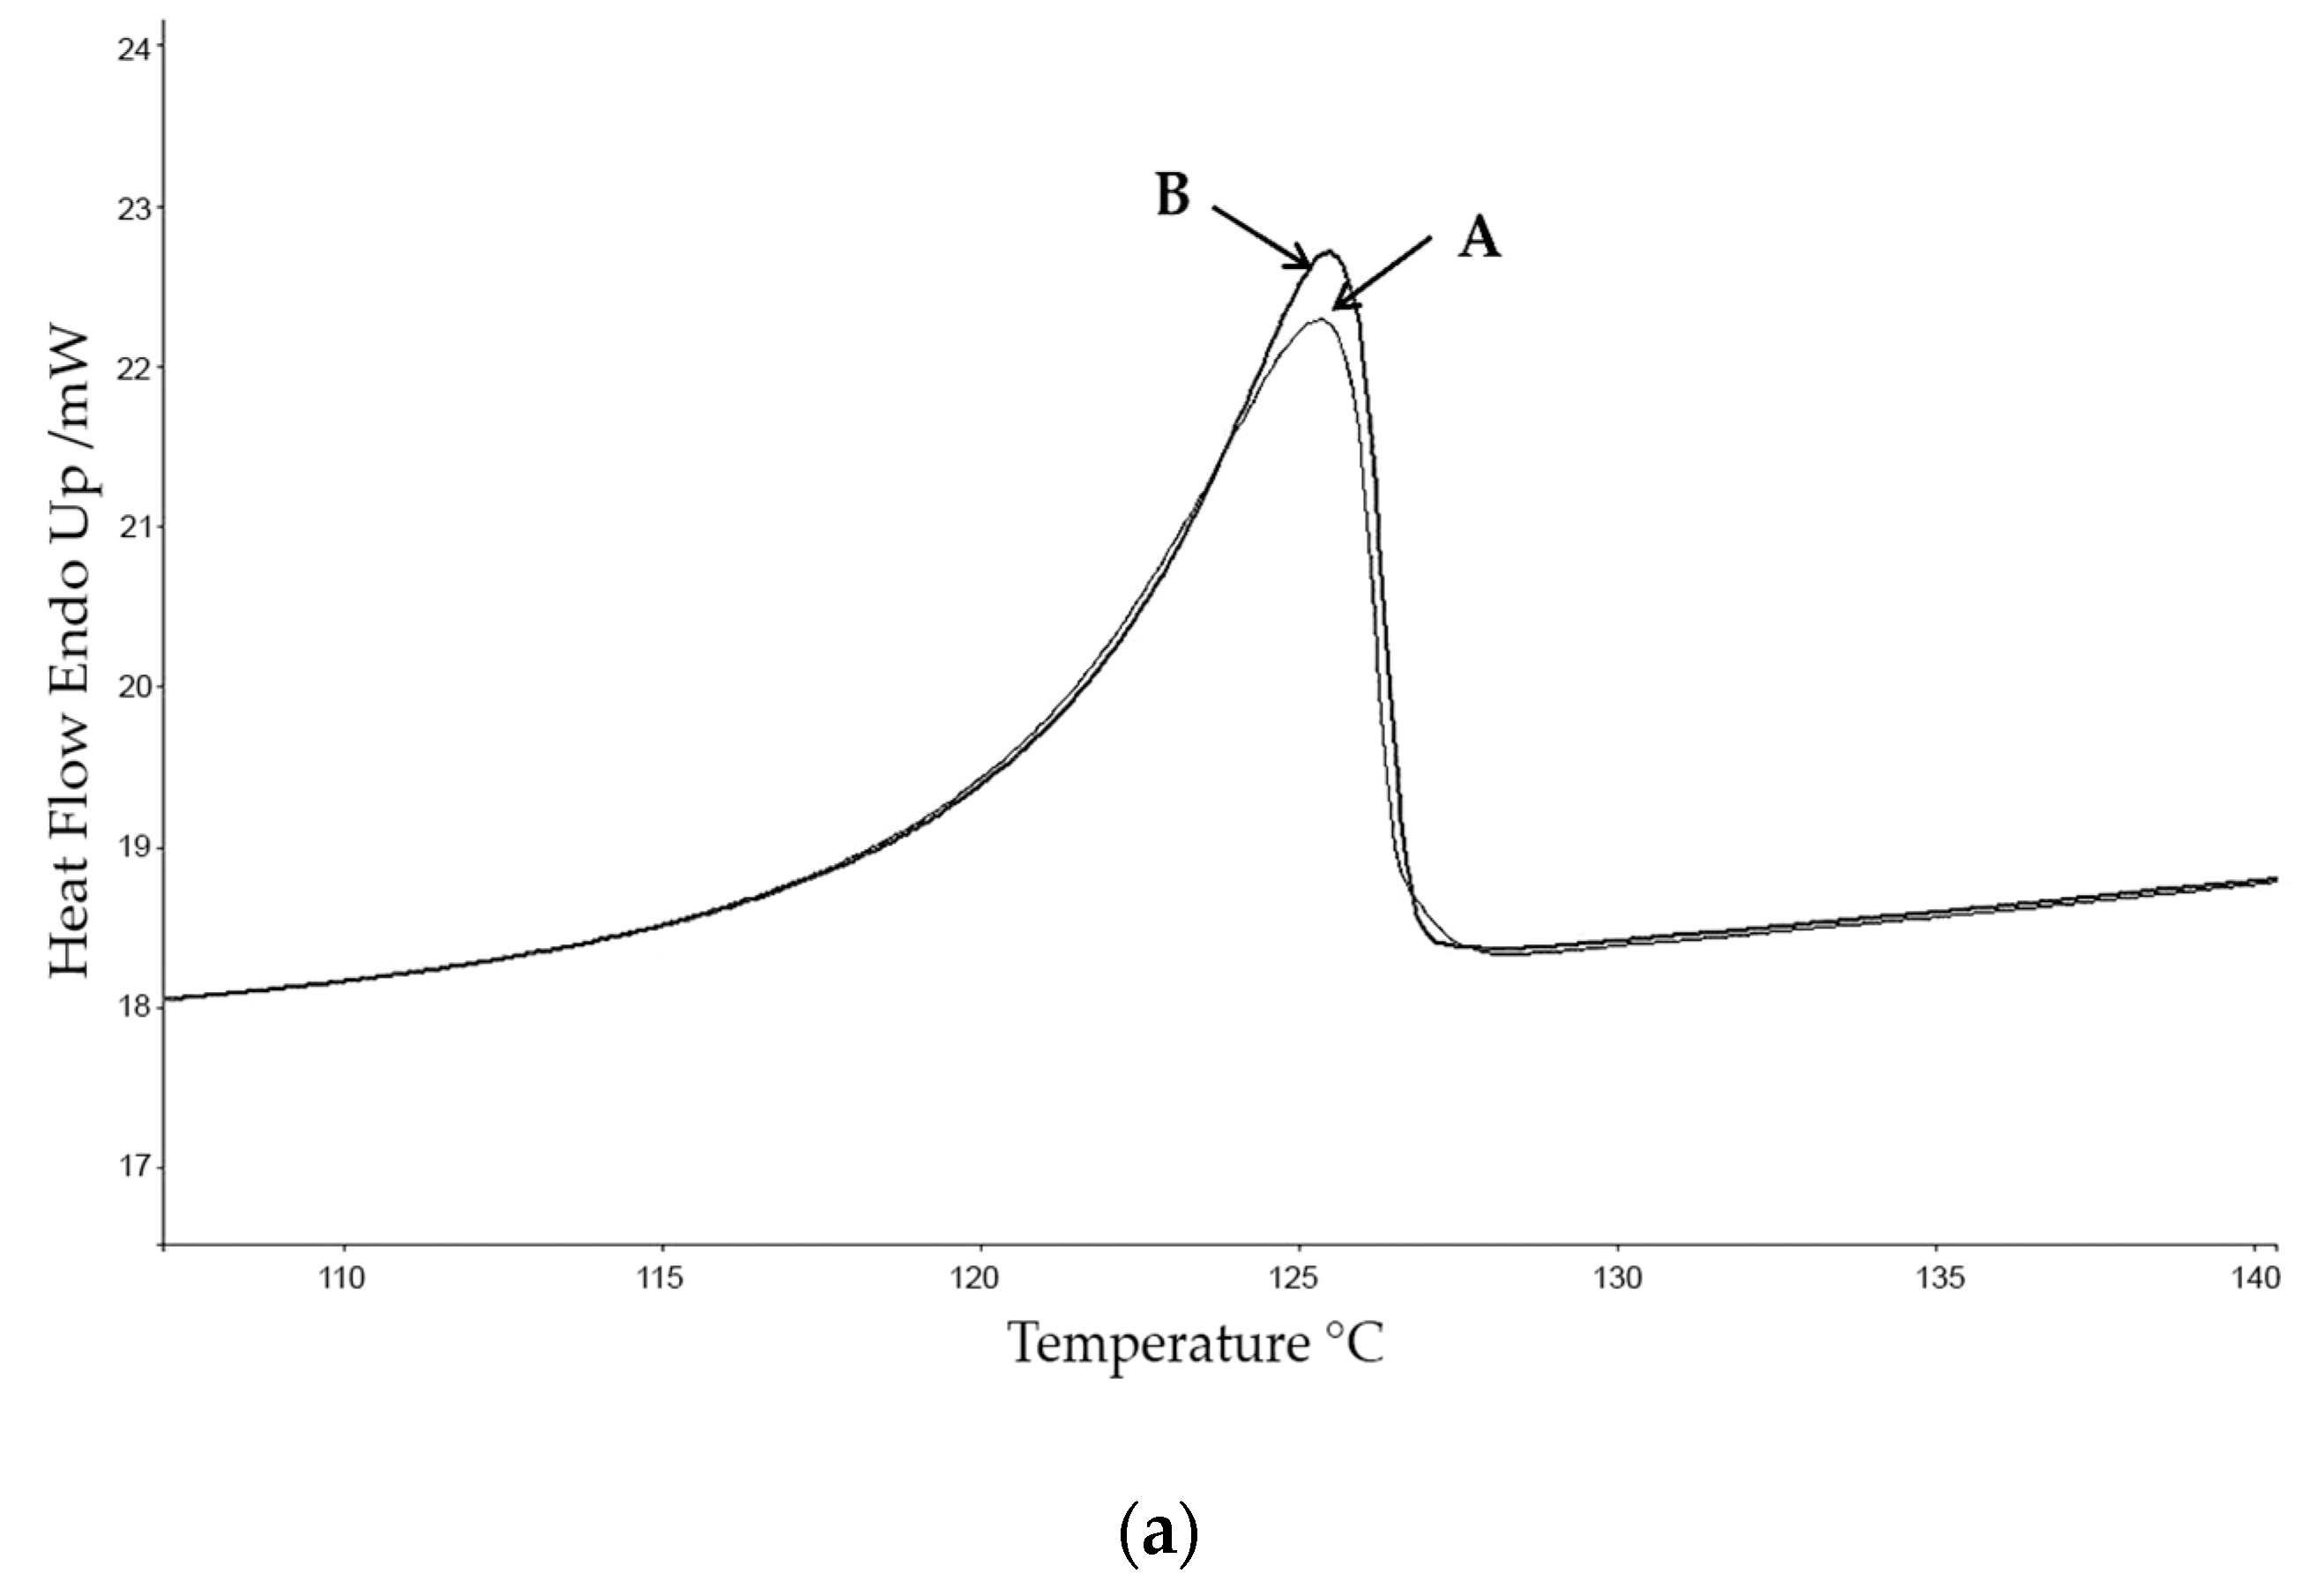
For calorimetric studies a Perkin–Elmer DSC diamond calibrated with indium and zinc (provided by Perkin–Elmer (Perkin Elmer, Inc. Watham, MA, USA) and fabricated according to guideline ISO35) at 10 °C·min−1 and nitrogen flow of 20 mL·min−1 was employed. The gas connected to the equipment was nitrogen with a purity of 99.999%. Calorimetric analyses were carried out in aluminium capsules for volatilities of 10 μL, at a heating rate of 10 °C·min−1, using a sample of approximately 3 mg, in order to establish the Tonset, Tmax and the enthalpy of fusion ∆Hf.
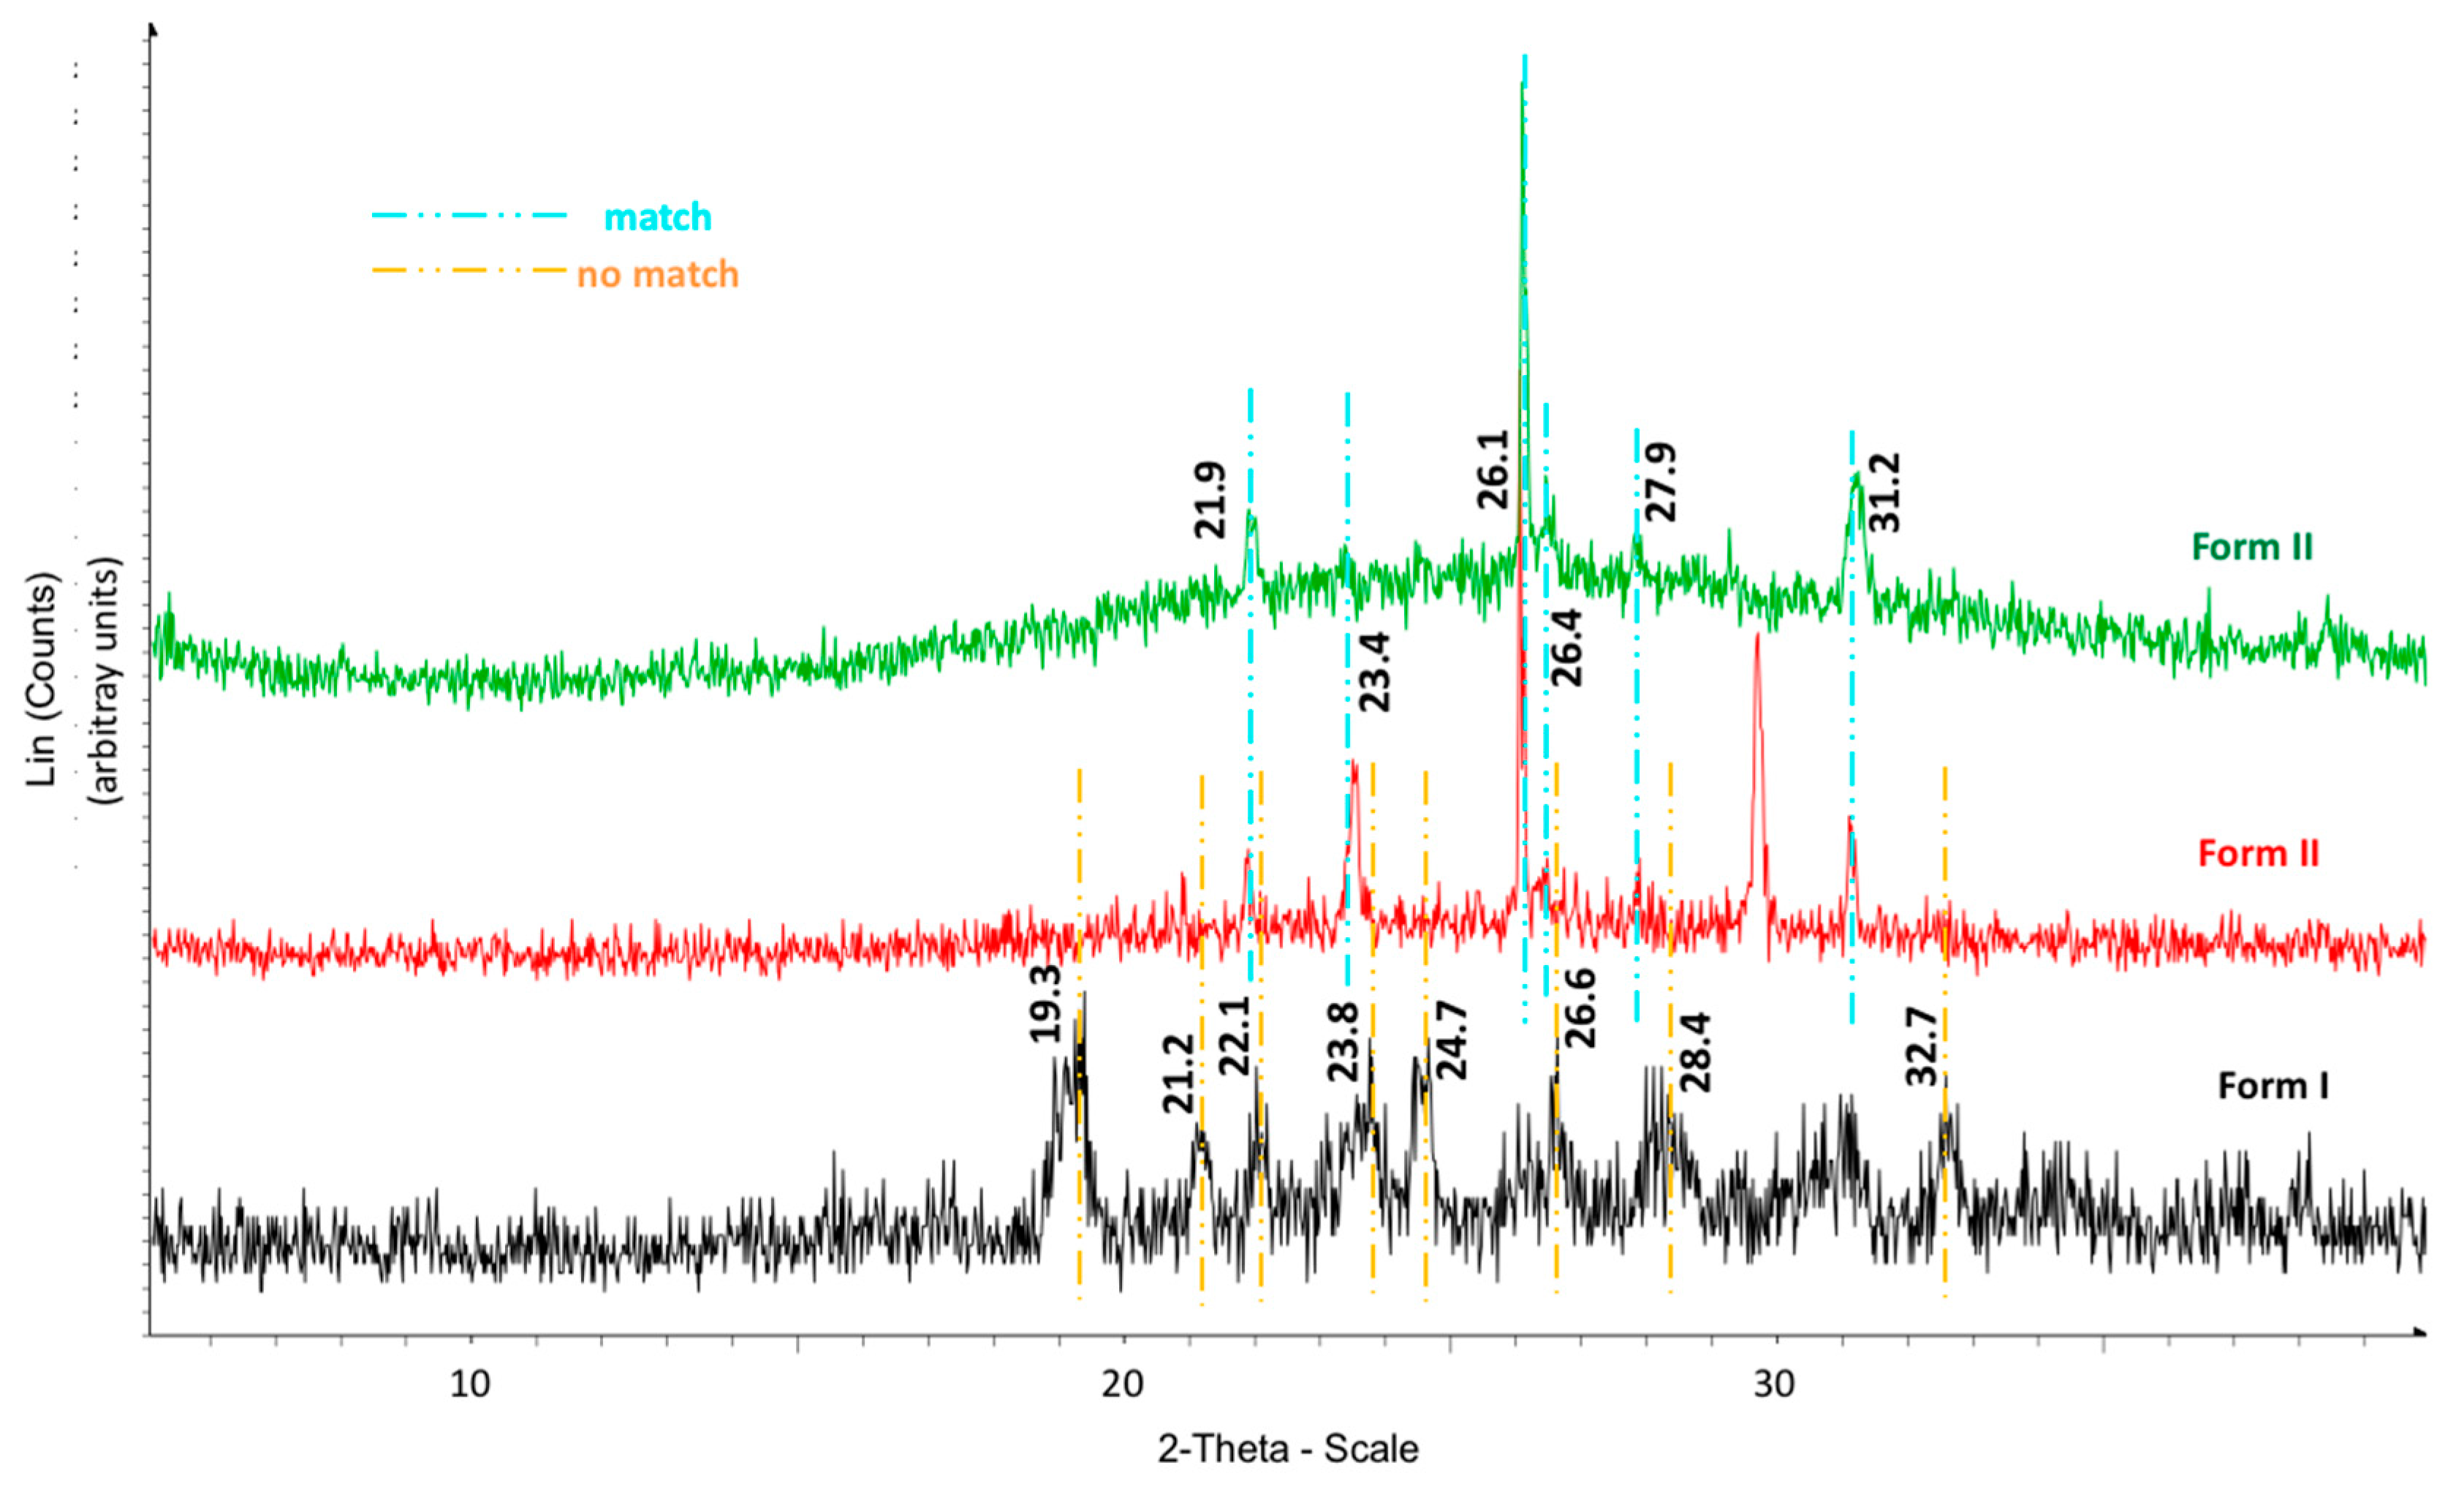
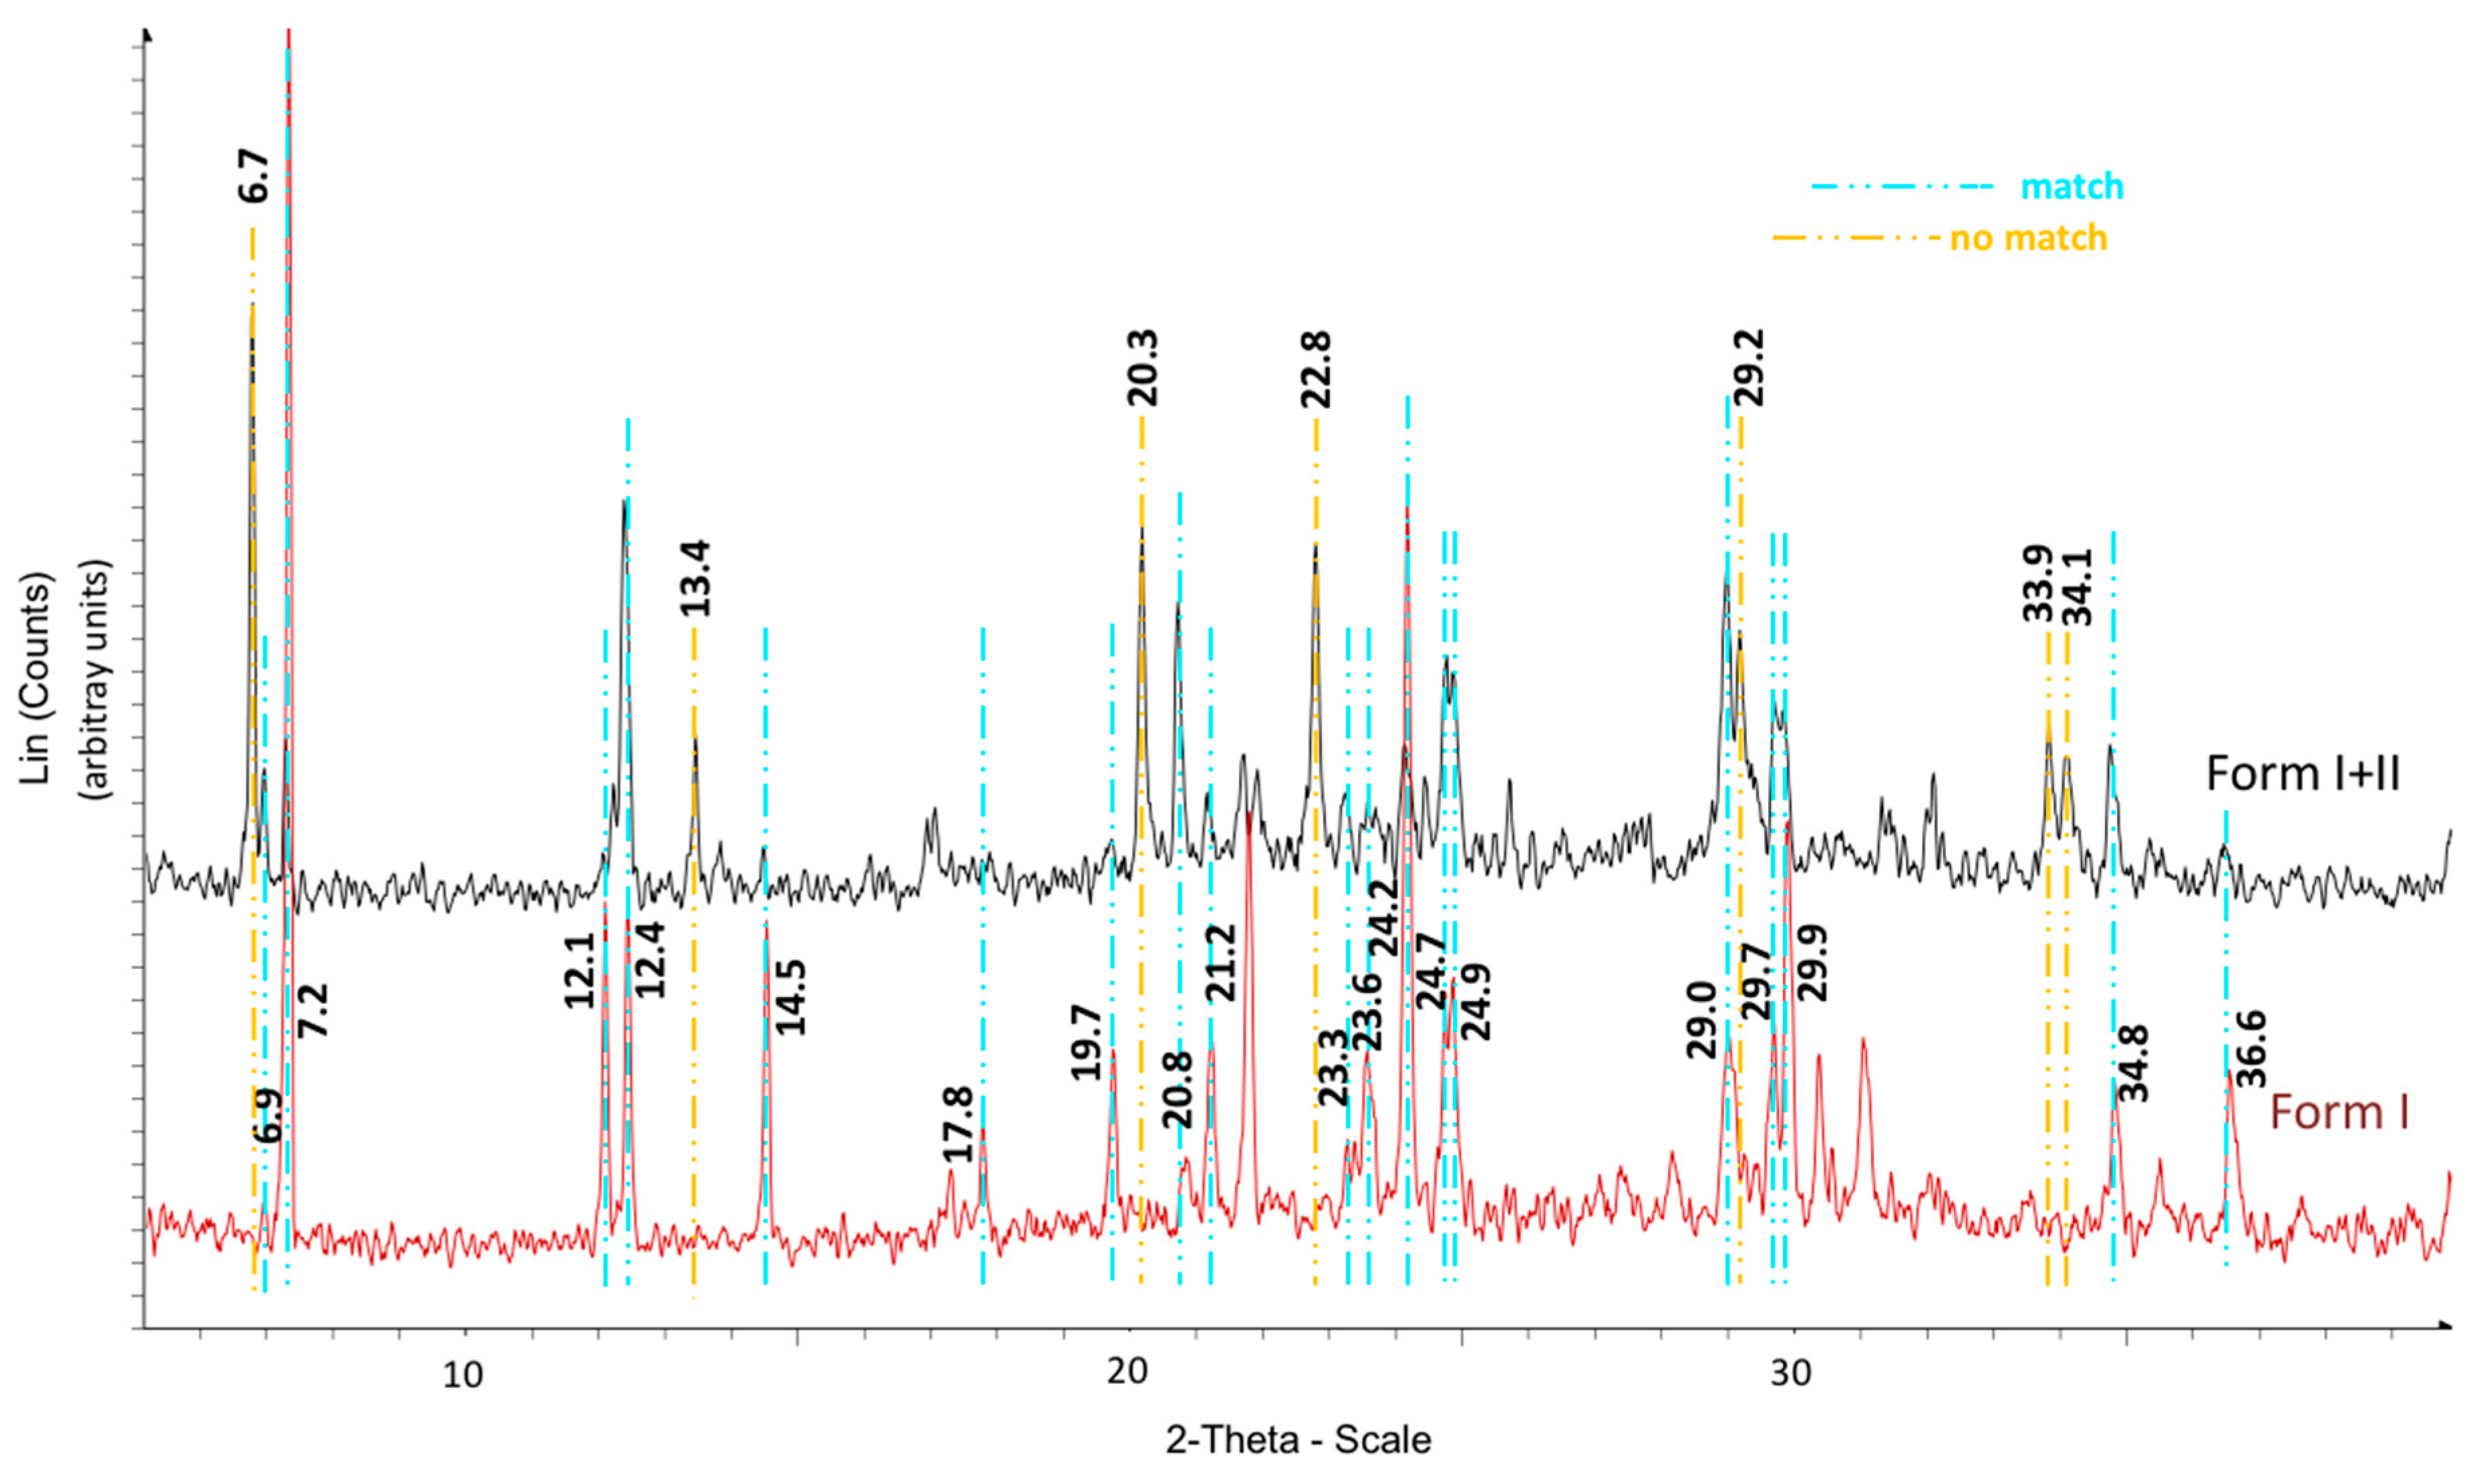
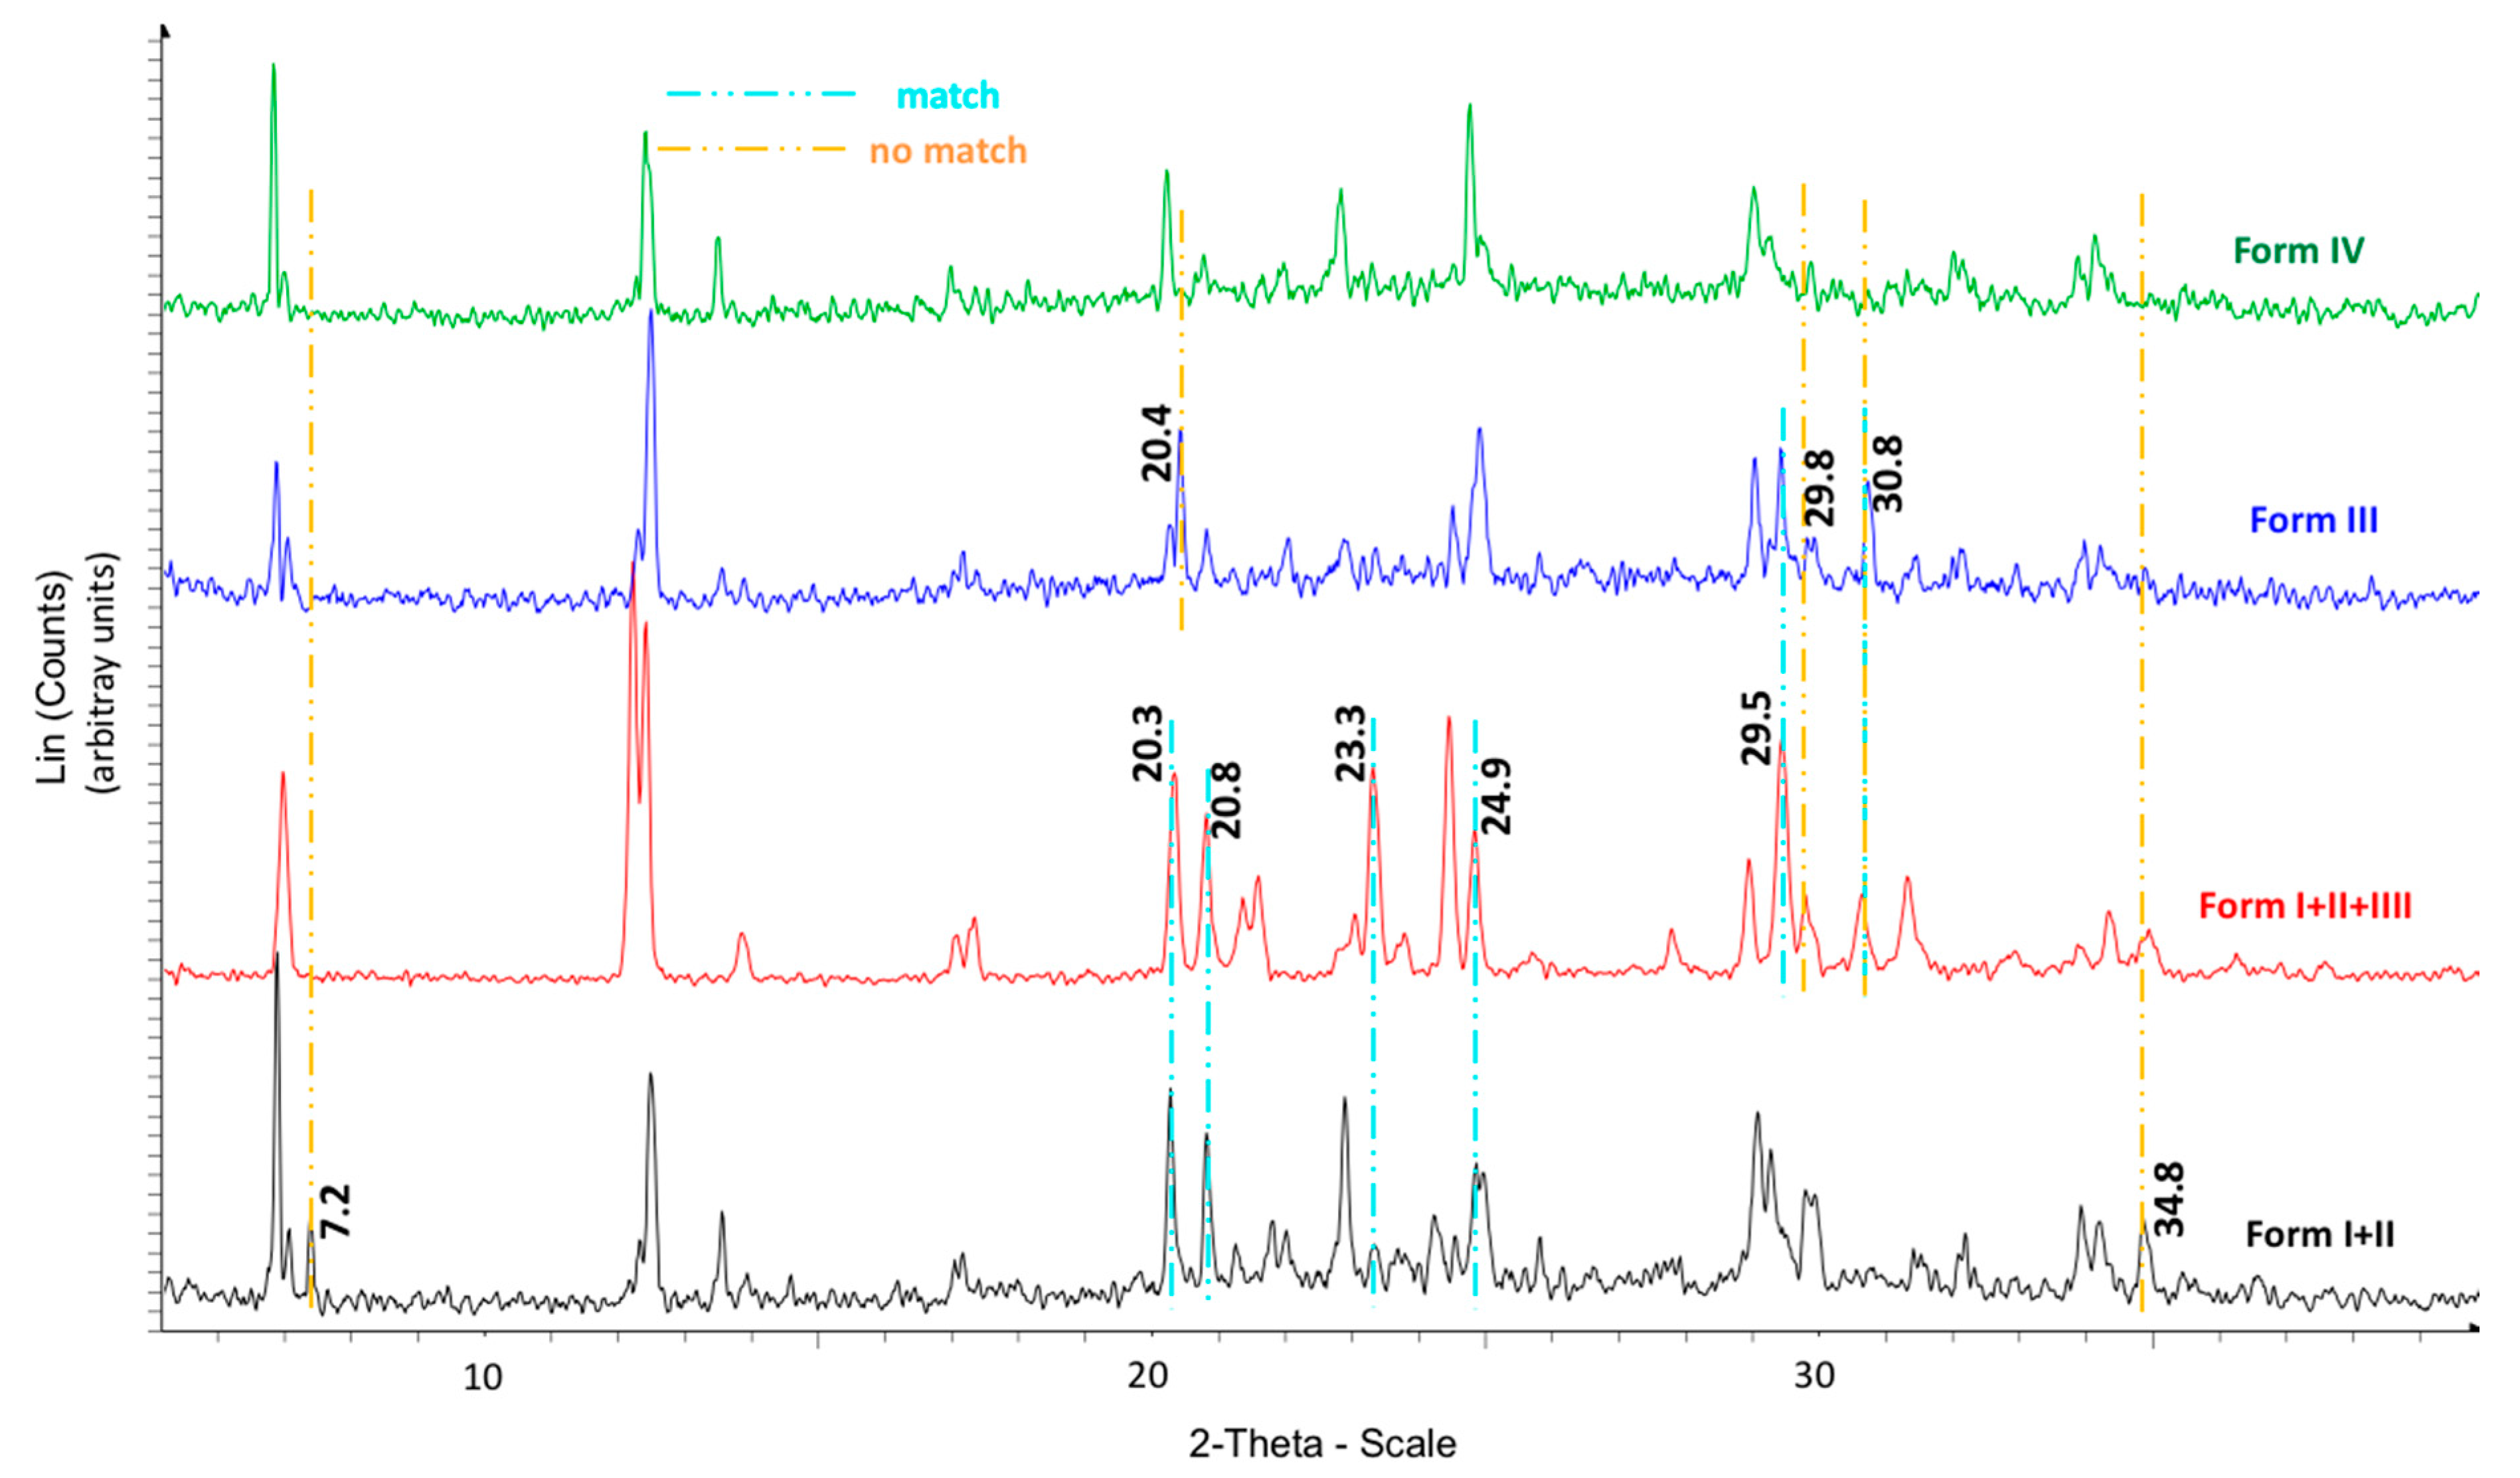
The calorimetric analyses started with the study of the thermal behaviour of the compounds before the process of degradation in order to evidence the possible existence of polymorphism. For this preliminary study, samples of all the compounds were exposed to successive cycles of heating–cooling. All samples were heated from 50 °C to temperatures 15–20 °C below
Tonset of the degradation process, in order to ensure that compounds were not degraded (
Table 6). After melting the samples, they were left at room temperature for enough time to allow the compounds to recrystallize before the successive thermal process. Additional cycles of heating–cooling were performed if polymorphism was detected.
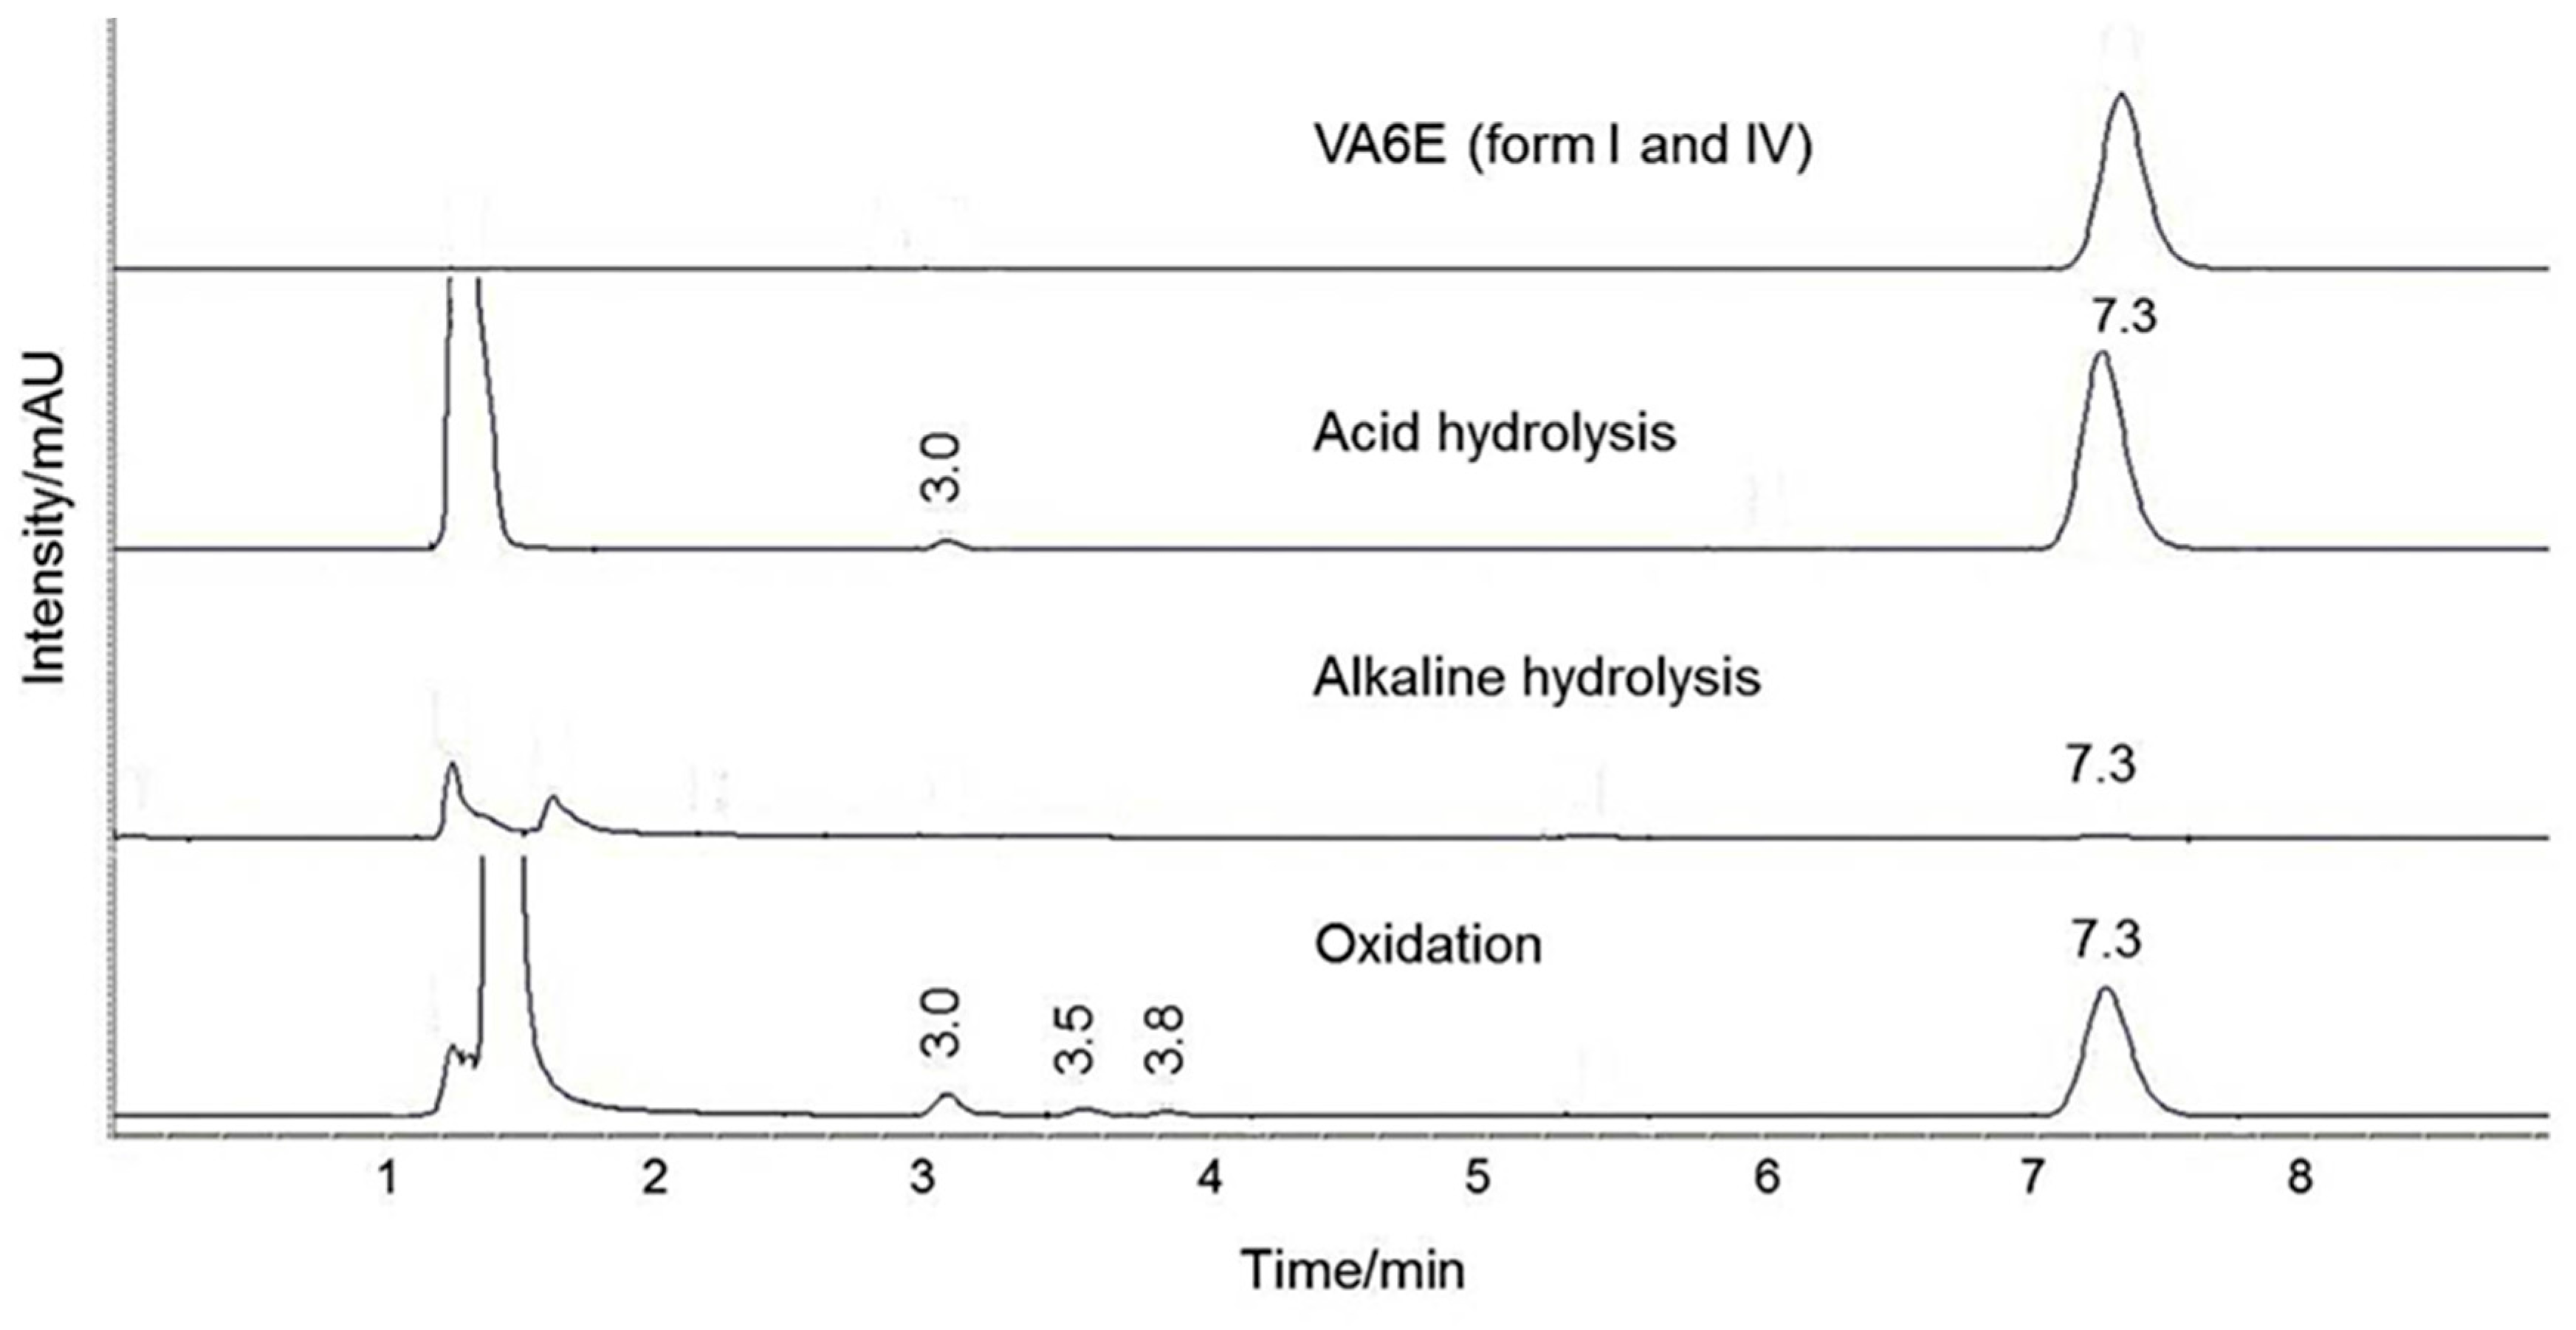
3.5. Chromatography
Chromatographic studies were performed using an HPLC/UV-DAD (HP 1200, Agilent Technologies. Santa Clara, CA, USA) with a C18 column (Gemini-NX 150 × 4.6 mm, 5 µm) from Phenomenex (Phenomenex. Torrance, CA, USA). The mobile phase was a mixture of acetonitrile/water (80:20; v/v) for compound VA4J, (50:50; v/v) for VA6E and (80:20, 0.1% formic acid; v/v) for compound VA7J. The injection volume was 50 µL and the flow rate was 1 mL/min. Chromatography was performed at 35 °C. UV-DAD detection was established at λ = 254 nm.
In the assessment of linearity, calibration curves were plotted in the range of 3–119 µg/mL for VA6E and 0.8–59.5 µg/mL for VA4J and VA7J. Calibration curves were evaluated by the analysis of the distribution properties of the residuals, correlation coefficient r2 > 0.990, slope of the linear calibration curve statistically different from 0 (p = 95%) and the intercept not statistically different from 0 (p = 95%). Precision (as RSD%) of the method was evaluated by analysing three replicate calibration samples at five concentration values (including lower, medium and higher value) of the calibration curve.
Stock standard solutions containing 1 mg/mL of compound VA4J, VA6E and VA7J were prepared by diluting each compound in a mixture of acetonitrile/water (50:50; v/v). Calibration samples in the mobile phase were prepared by the dilution of the stock standard solutions.
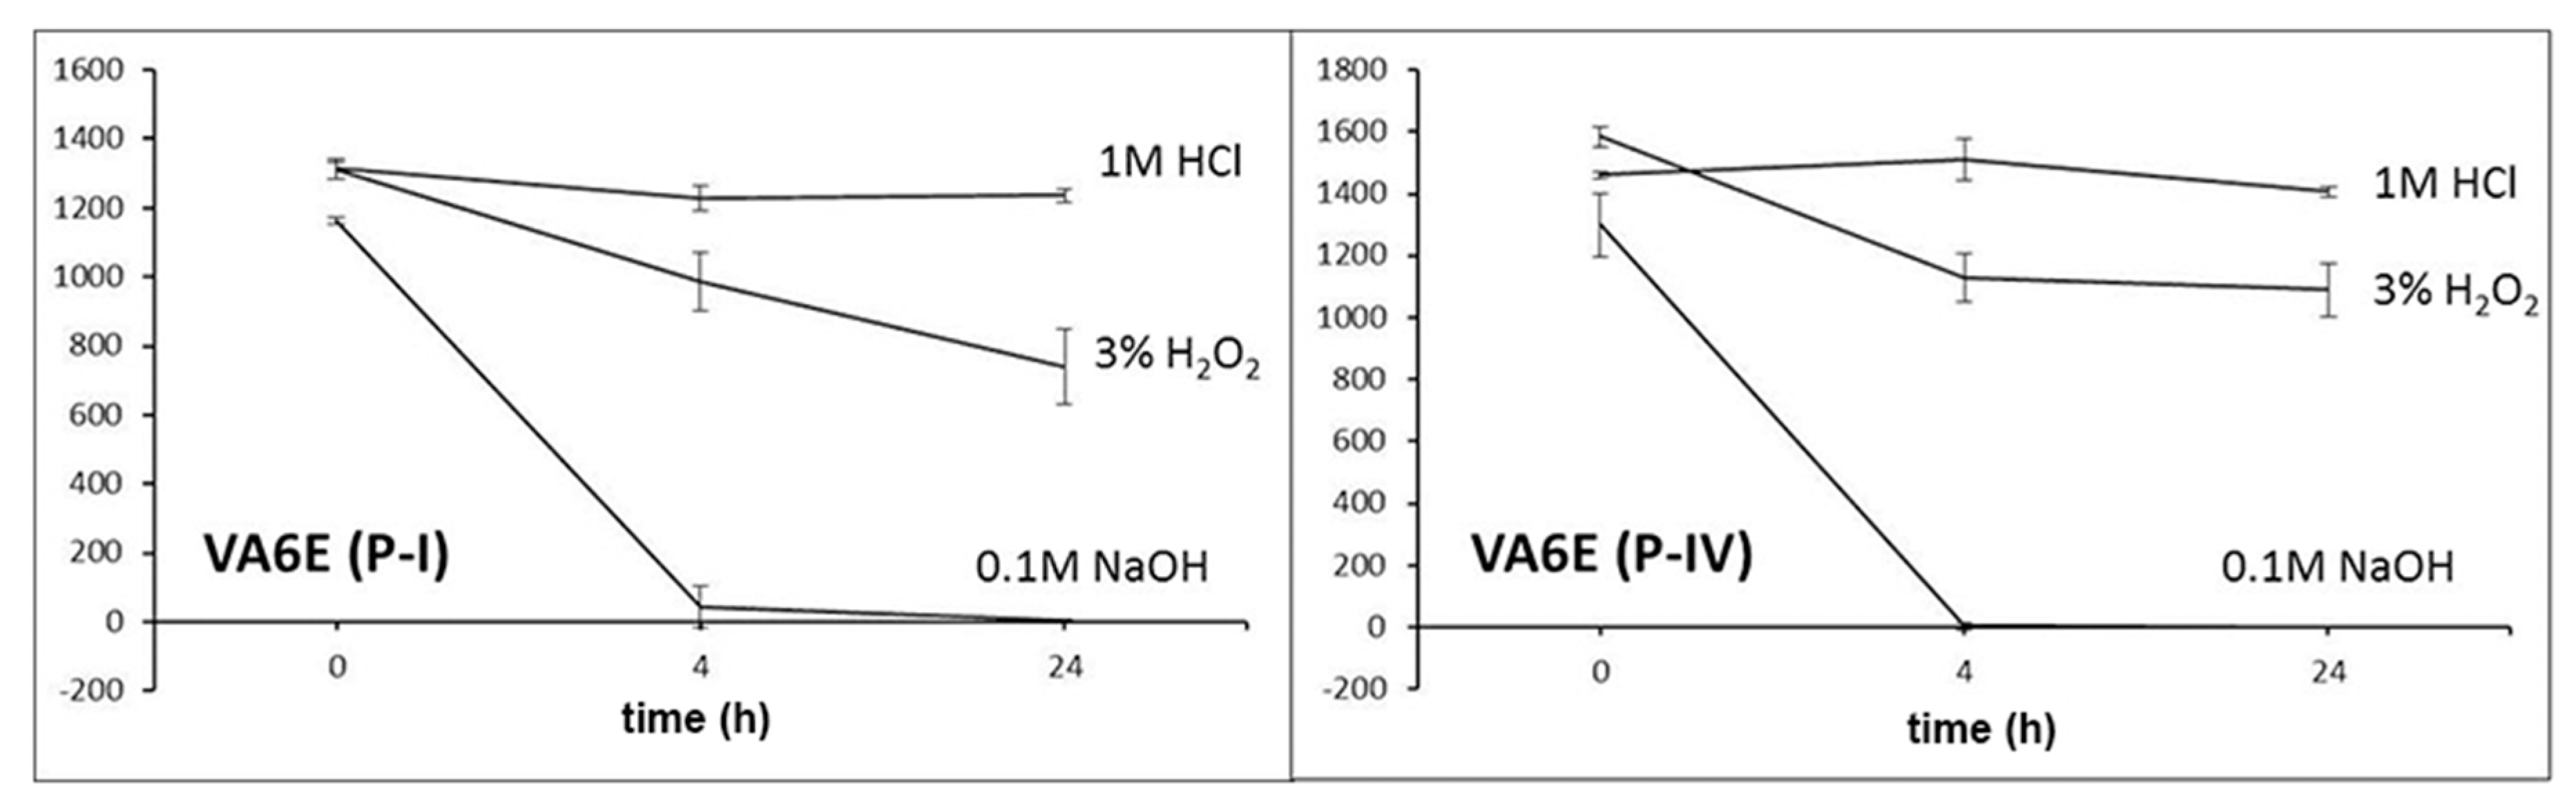
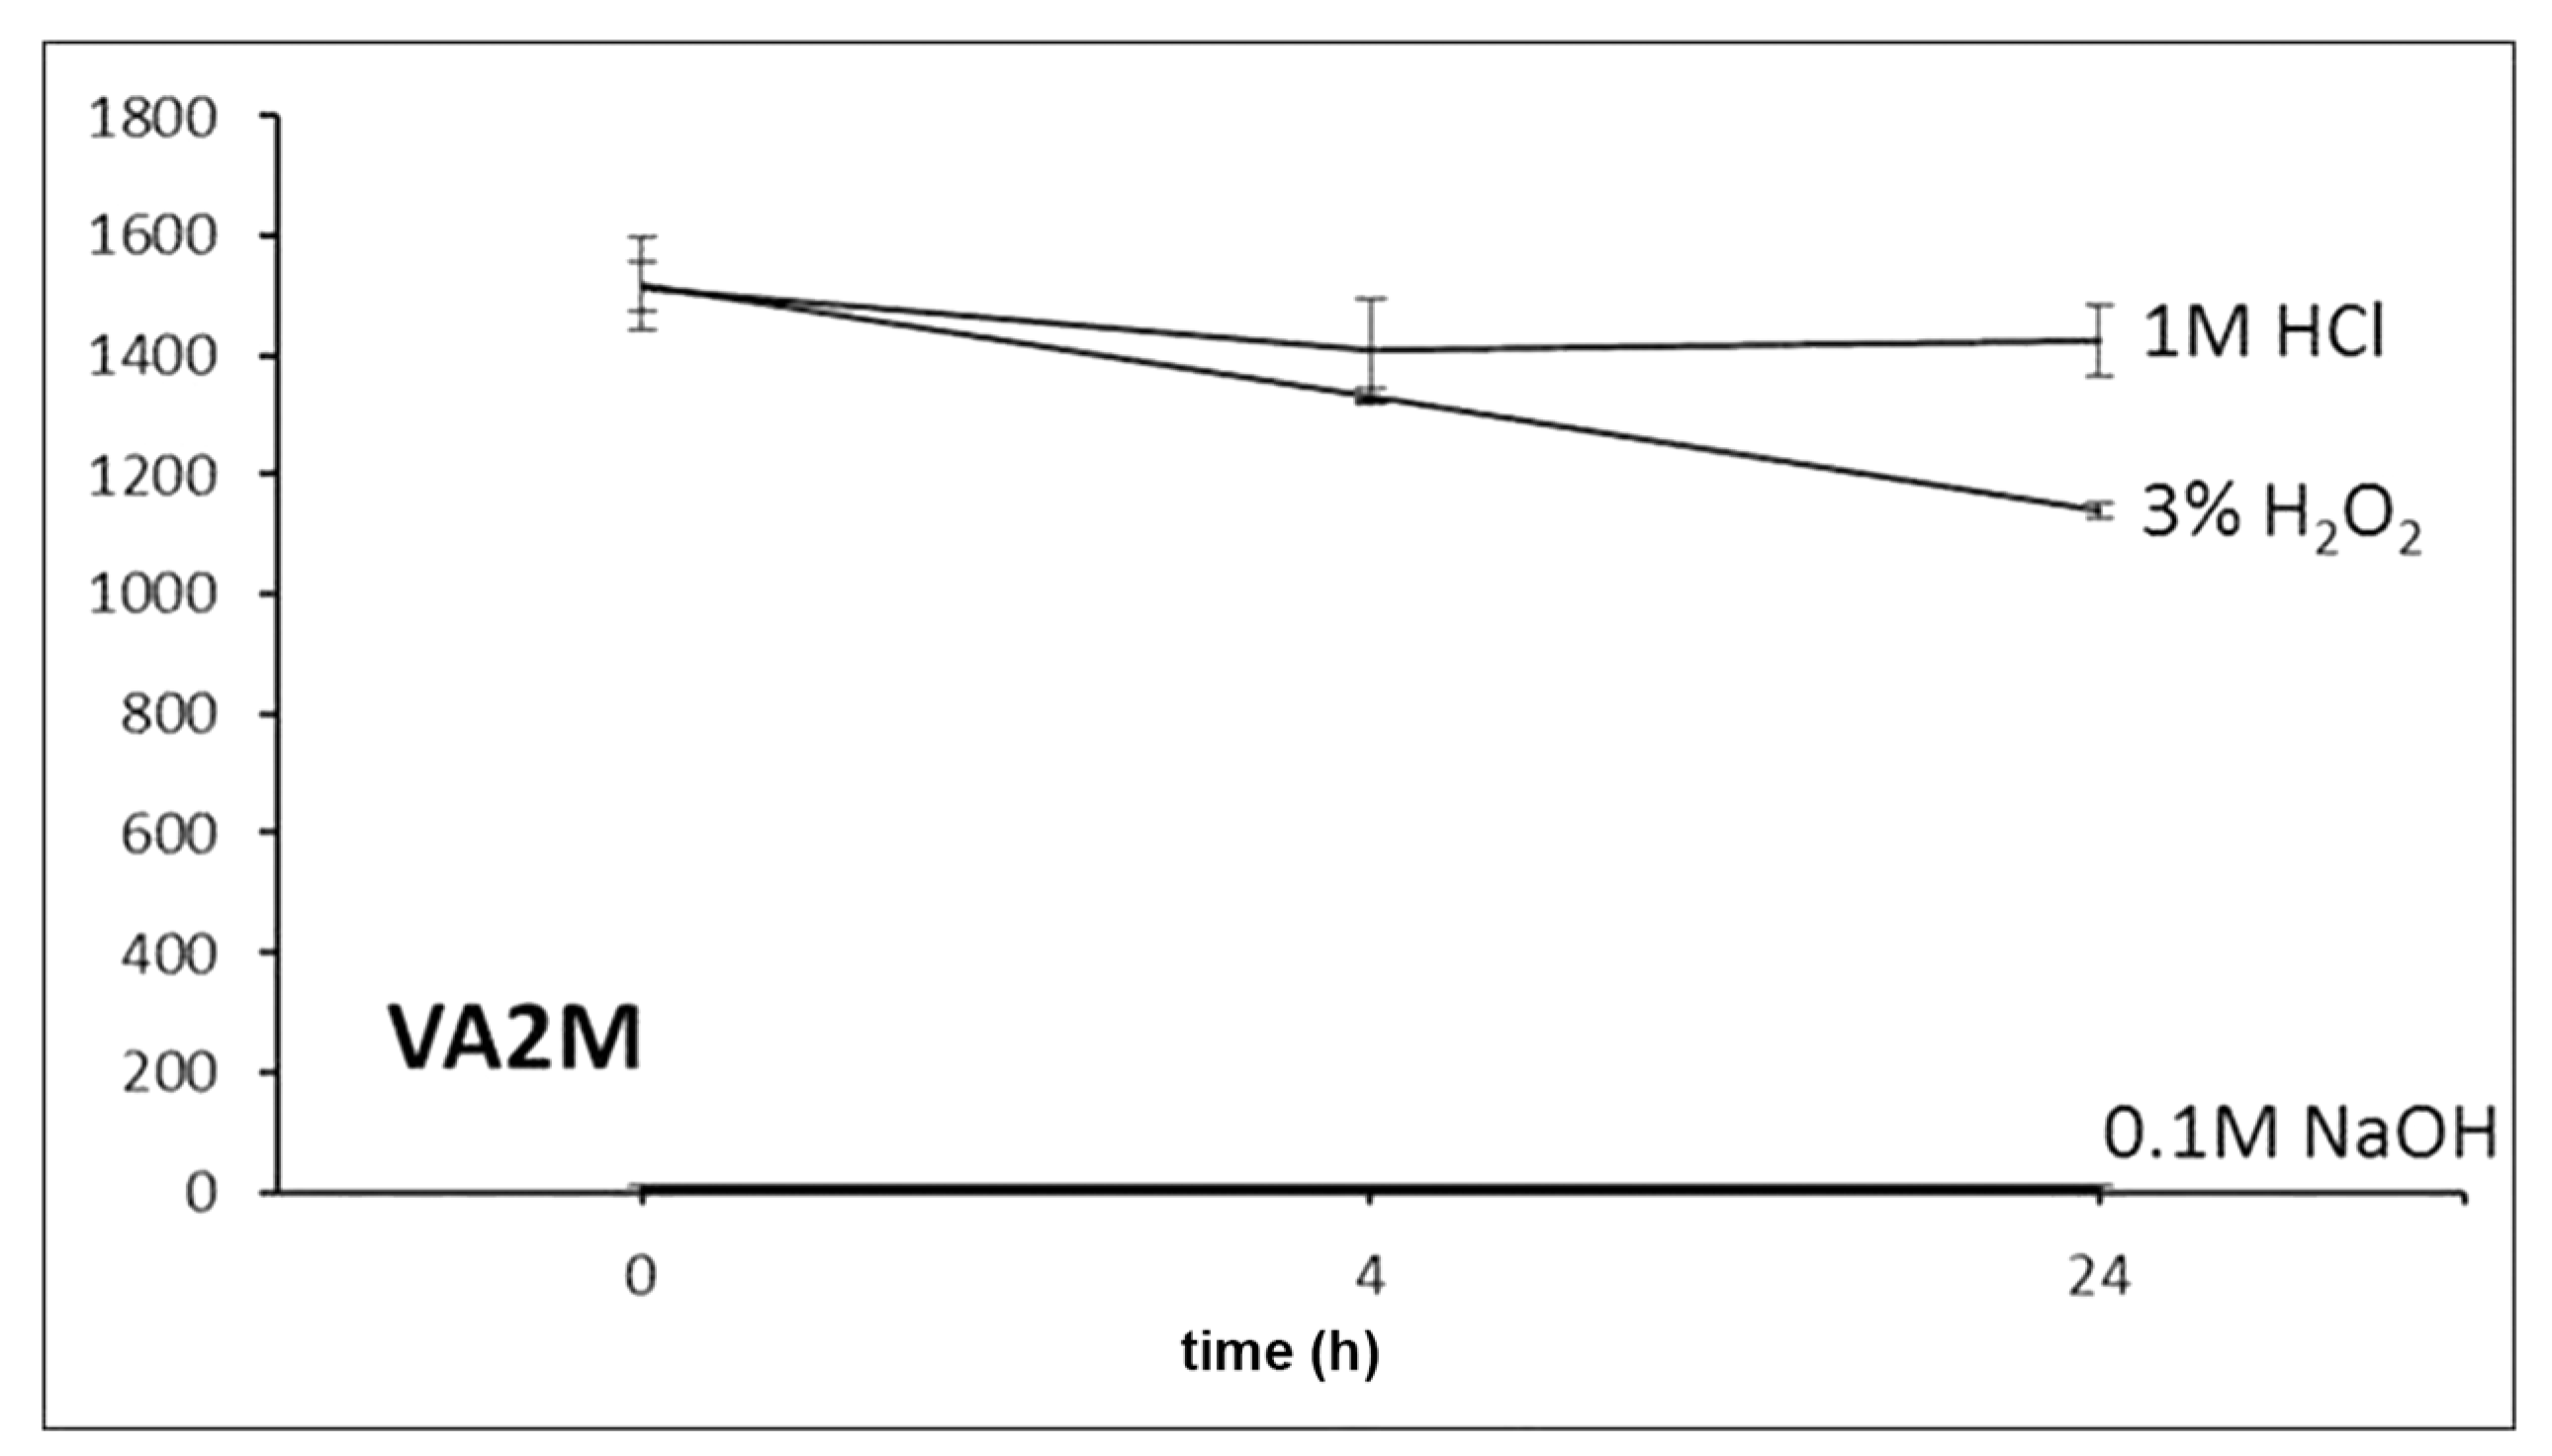
For stability evaluation in stress conditions, working solutions of 47.6 µg/mL were prepared by diluting 20 µL of each standard solution in 200 µL of acetonitrile and 200 µL of (a) 1 M HCl, (b) 0.1 M NaOH and (c) 3% H2O2. Data were recorded at zero time and after 4 and 24 h of exposure.

 ,
, 


