
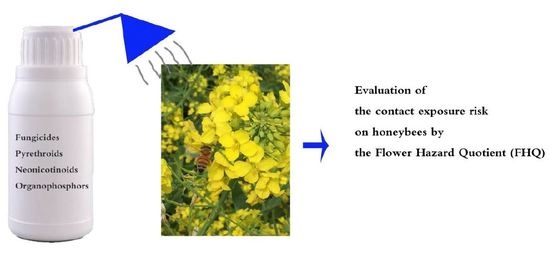
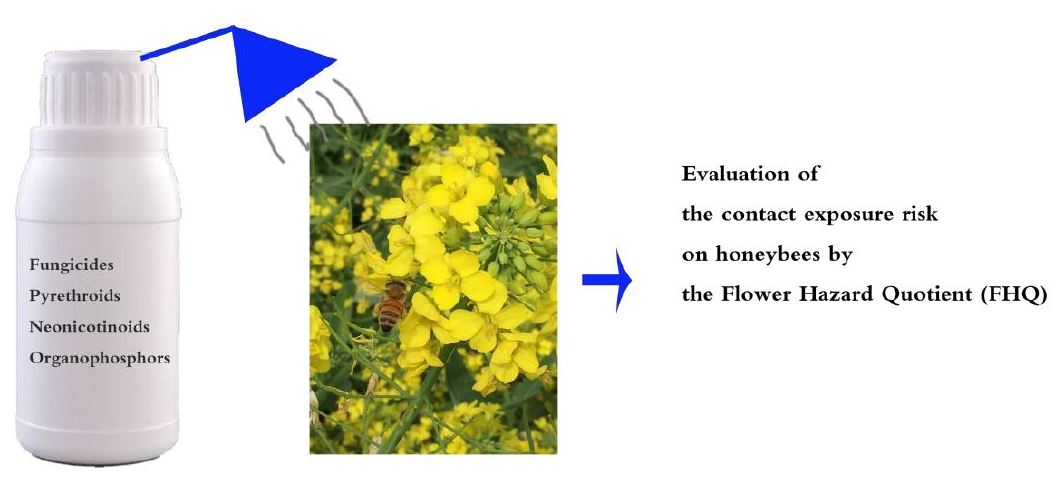
Evaluation of Highly Detectable Pesticides Sprayed in Brassica napus L.: Degradation Behavior and Risk Assessment for Honeybees


Abstract
:
1. Introduction
2. Materials and Methods
2.1. Chemicals and Standards
2.2. Experimental Design and Sample Collection
2.3. Sample Preparation
2.4. Chemical Analysis
2.5. Preparation of Standard Solutions
2.6. Data Analysis
3. Results and Discussion
3.1. Method Validation
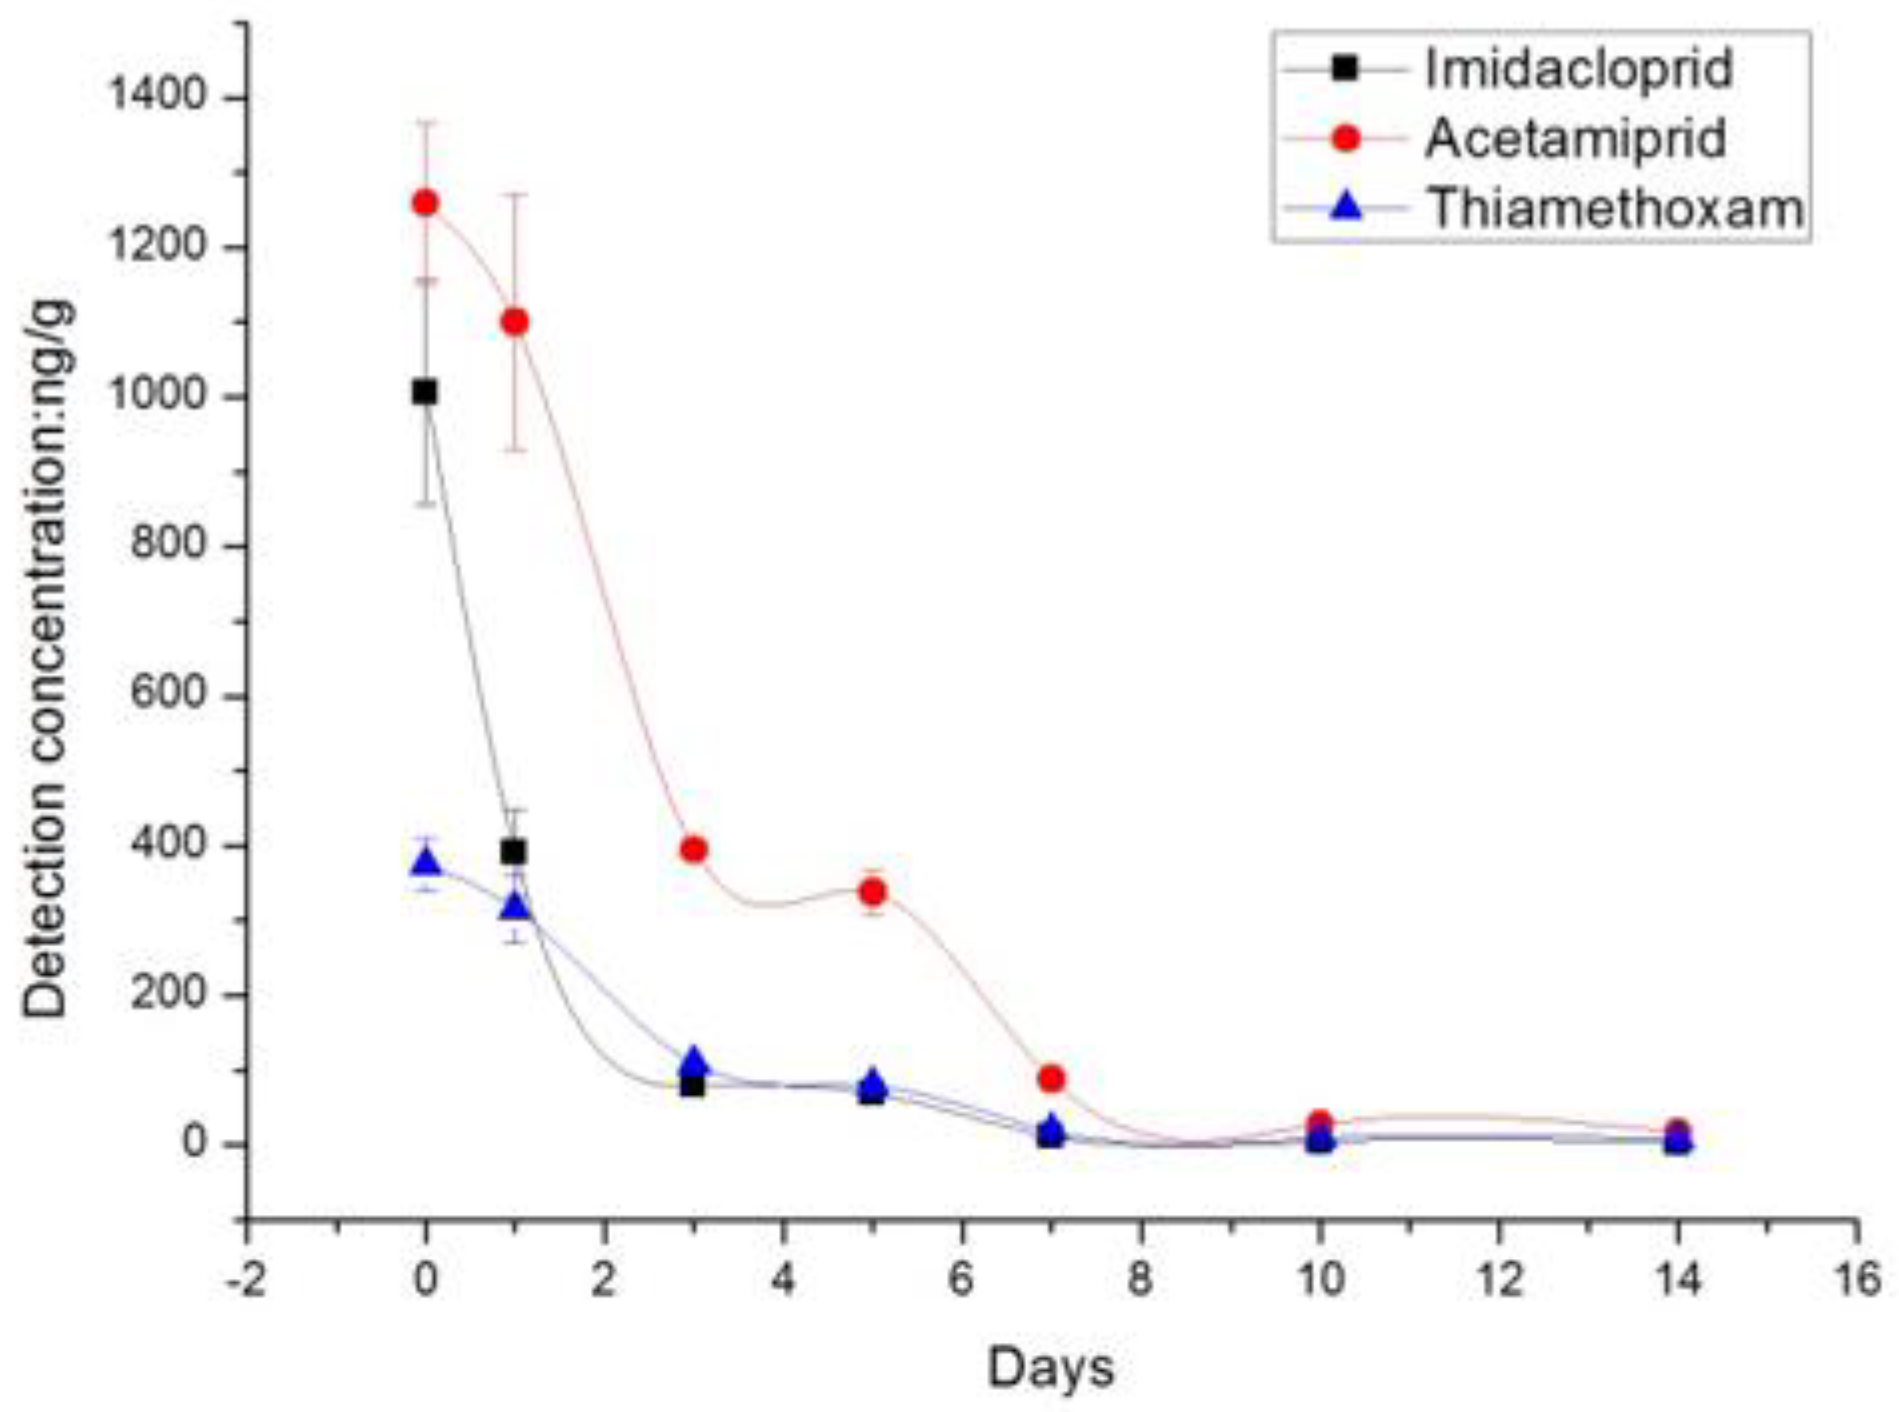
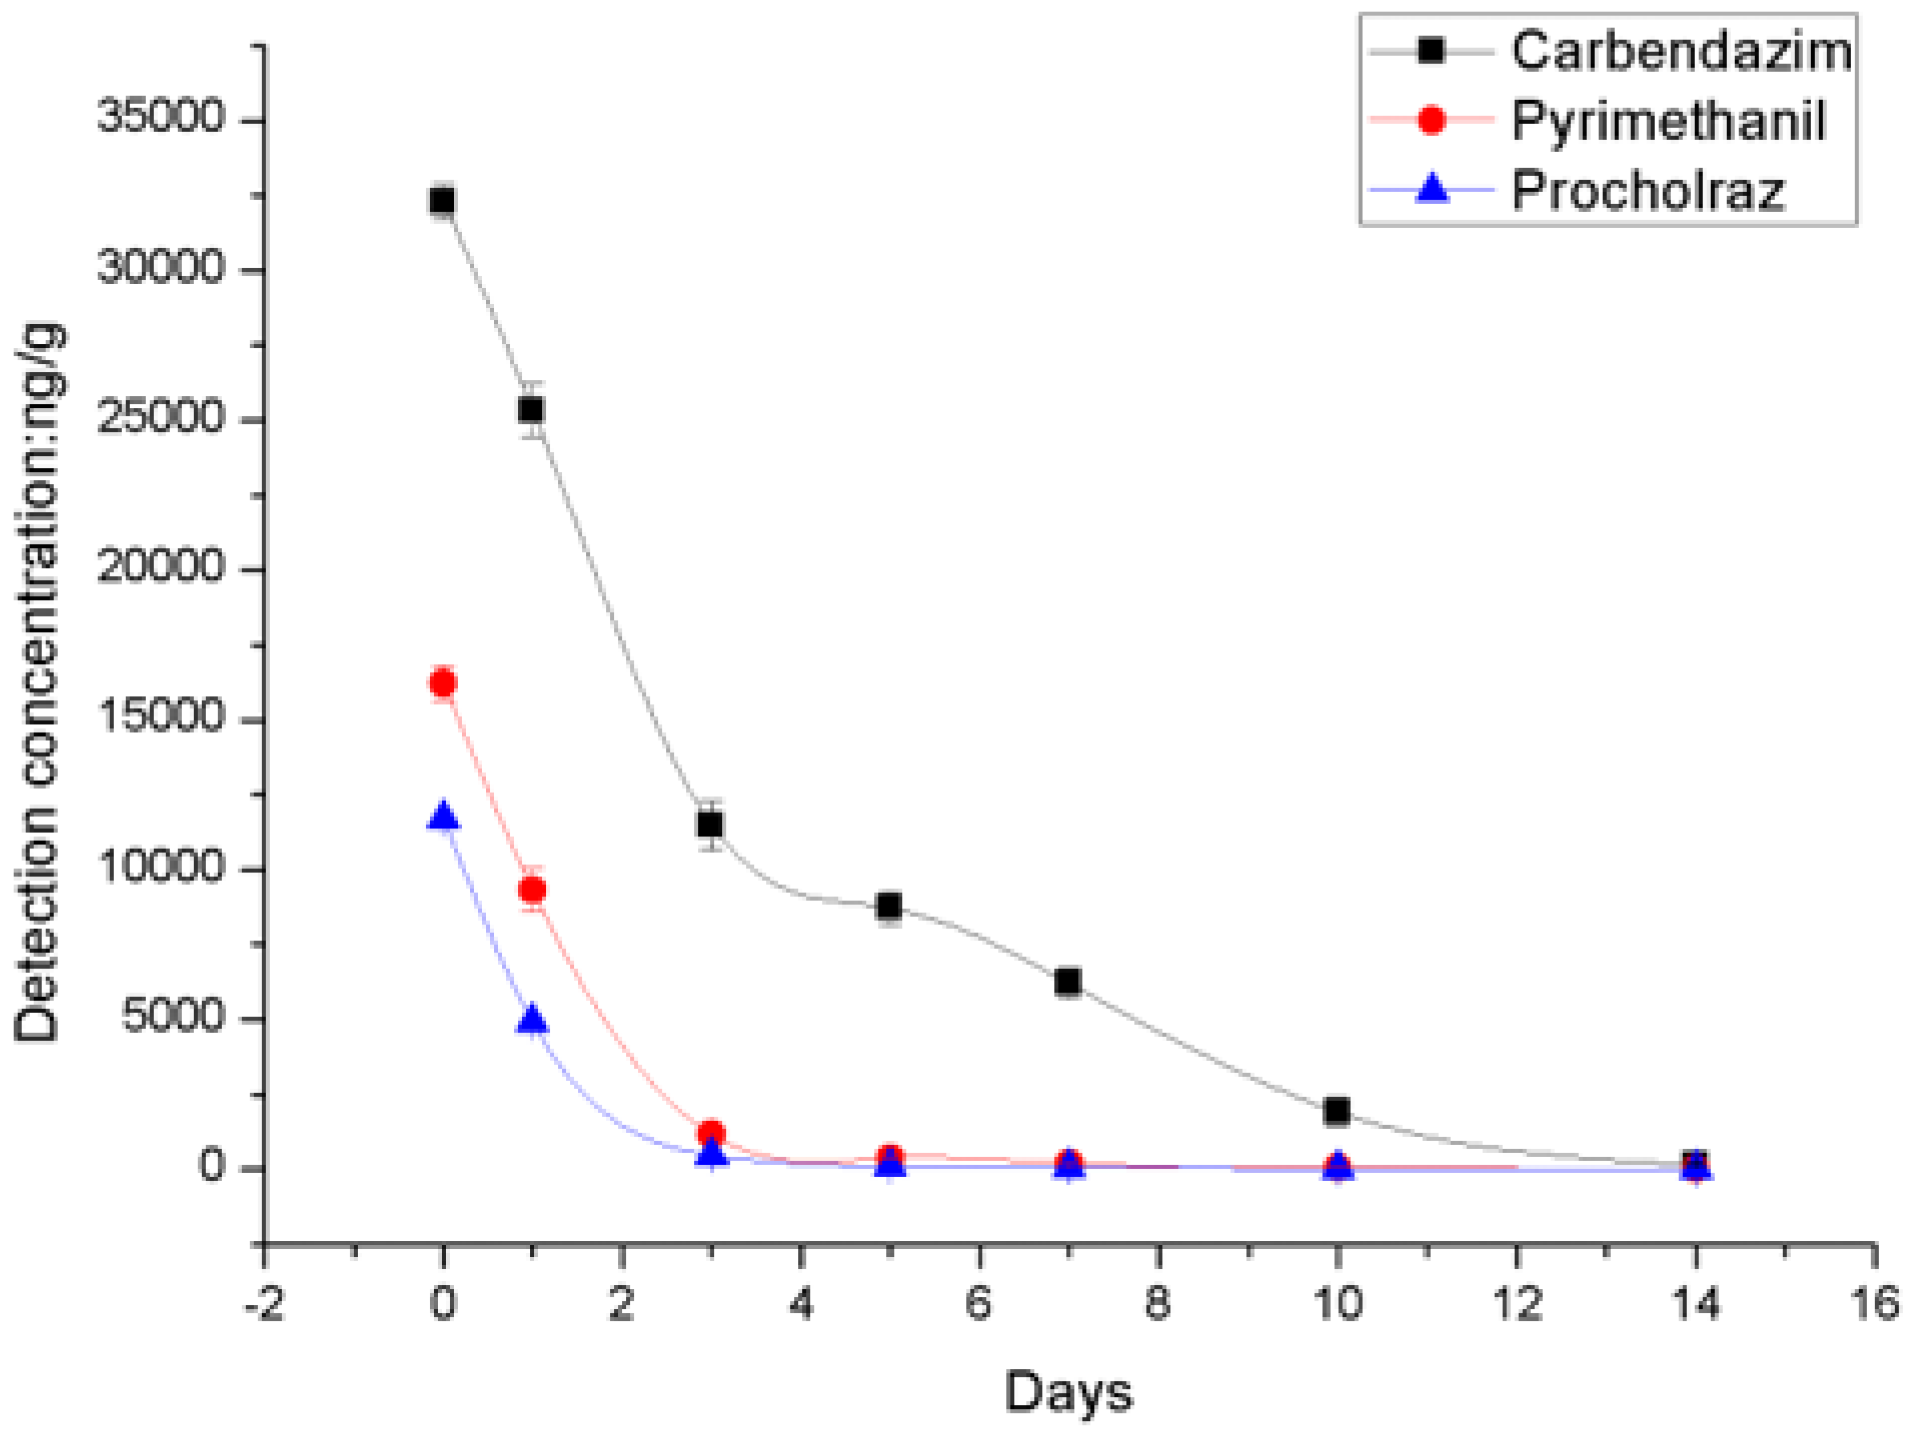
3.2. Residues of Highly Detectable Pesticides on Rape Flowers
3.3. Risk Assessment
4. Conclusions
Supplementary Materials
Author Contributions
Funding
Acknowledgments
Conflicts of Interest
References
- Klein, A.M.; Vaissière, B.E.; Cane, J.H.; Steffan-Dewenter, I.; Cunningham, S.A.; Kremen, C.; Tscharntke, T. Importance of pollinators in changing landscapes for world crops. Proc. Biol. Sci. 2007, 274, 303–313. [Google Scholar] [CrossRef] [PubMed] [Green Version]
- Gallai, N.; Salles, J.M.; Settele, J.; Vaissière, B.E. Economic valuation of the vulnerability of world agriculture confronted with pollinator decline. Ecol. Econ. 2009, 68, 810–821. [Google Scholar] [CrossRef] [Green Version]
- Brodschneide, R.; Moosbeckhofer, R.; Crailsheim, K. Preliminary Results of Honey Bee Colony Losses in Austria 2010/2011. Mellifera 2011, 11, 14–15. [Google Scholar]
- Genersch, E.; Ohe, W.V.D.; Kaatz, H.; Schroeder, A.; Otten, C.; Büchler, R.; Berg, S.; Ritter, W.; Mühlen, W.; Gisder, S. The German bee monitoring project: A long term study to understand periodically high winter losses of honey bee colonies. Apidologie 2010, 41, 332–352. [Google Scholar] [CrossRef]
- Higes, M.; Martín-Hernández, R.; Martínez-Salvador, A.; Garrido-Bailón, E.; González-Porto, A.V.; Meana, A.; Bernal, J.L.; Del Nozal, M.J.; Bernal, J. A preliminary study of the epidemiological factors related to honey bee colony loss in Spain. Environ. Microbiol. Rep. 2010, 2, 243–250. [Google Scholar] [CrossRef] [PubMed]
- Potts, S.G.; Biesmeijer, J.C.; Kremen, C.; Neumann, P.; Schweiger, O.; Kunin, W.E. Global pollinator declines: Trends, impacts and drivers. Trends Ecol. Evol. 2010, 25, 345. [Google Scholar] [CrossRef] [PubMed]
- Zee, R.E.V.D.; Pisa, L.; Andonov, S.; Brodschneider, R.; Charrière, J.D.; Chlebo, R.; Coffey, M.F.; Crailsheim, K.; Dahle, B.; Gajda, A.; Gray, A.; et al. Managed honey bee colony losses in Canada, China, Europe, Israel and Turkey, for the winters of 2008-9 and 2009-10. J. Apic. Res. 2012, 51, 100–114. [Google Scholar] [Green Version]
- Kulhanek, K.; Steinhauer, N.; Rennich, K. A national survey of managed honey bee 2015–2016 annual colony losses in the USA. J. Agric. Res. 2017, 56, 328–340. [Google Scholar] [CrossRef]
- Vanengelsdorp, D.; Caron, D.; Hayes, J.; Underwood, R.; Henson, M.; Rennich, K.; Spleen, A.; Andree, M.; Snyder, R.; Lee, K.; et al. A national survey of managed honey bee 2010-11 winter colony losses in the USA: Results from the Bee Informed Partnership. Apidologie 2015, 46, 292–305. [Google Scholar] [CrossRef]
- Wilfert, L.; Long, G.; Leggett, H.C.; Schmid-Hempel, P.; Butlin, R.; Martin, S.J.M.; Boots, M. Deformed wing virus is a recent global epidemic in honeybees driven by Varroa mites. Science 2016, 351, 594–597. [Google Scholar] [CrossRef] [PubMed]
- Ravoet, J.; Maharramov, J.; Meeus, I.; De Smet, L.; Wenseleers, T.; Smagghe, G.; De Graaf, D.C. Comprehensive Bee Pathogen Screening in Belgium Reveals Crithidia mellificae as a New Contributory Factor to Winter Mortality. PLoS ONE 2013, 8, e72443. [Google Scholar] [CrossRef] [PubMed] [Green Version]
- Goulson, D.; Nicholls, E.; Botías, C.; Rotheray, E.L. Bee declines driven by combined stress from parasites, pesticides, and lack of flowers. Science 2015, 347, 1255957. [Google Scholar] [CrossRef] [PubMed]
- Maini, S.; Medrzycki, P.; Porrini, C. The puzzle of honey bee losses: A brief review. Bull. Insectol. 2010, 63, 153–160. [Google Scholar]
- Naug, D. Nutritional stress due to habitat loss may explain recent honeybee colony collapses. Biol. Conserv. 2009, 142, 2369–2372. [Google Scholar] [CrossRef]
- Memmott, J.; Craze, P.G.; Waser, N.M.; Price, M.V. Global warming and the disruption of plant-pollinator interactions. Ecol. Lett. 2007, 10, 710–717. [Google Scholar] [CrossRef] [PubMed]
- Decourtye, A.; Armengaud, C.; Renou, M.; Devillers, J.; Cluzeau, S.; Gauthier, M.; Pham-Delègue, M.H. Imidacloprid impairs memory and brain metabolism in the honeybee (Apis mellifera L.). Pestic. Biochem. Phys. 2004, 78, 83–92. [Google Scholar] [CrossRef]
- Williamson, S.M.; Wright, G.A. Exposure to multiple cholinergic pesticides impairs olfactory learning and memory in honeybees. J. Exp. Biol. 2013, 216, 1799. [Google Scholar] [CrossRef] [PubMed]
- Sanchez-Bayo, F.; Goulson, D.; Pennacchio, F.; Nazzi, F.; Goka, K.; Desneux, N. Are bee diseases linked to pesticides?—A brief review. Environ. Int. 2016, 89, 7–11. [Google Scholar] [CrossRef] [PubMed]
- Alburaki, M.; Boutin, S.; Mercier, P.L.; Loublier, Y.; Chagnon, M.; Derome, N. Neonicotinoid-Coated Zea mays Seeds Indirectly Affect Honeybee Performance and Pathogen Susceptibility in Field Trials. PLoS ONE 2015, 10, e0125790. [Google Scholar] [CrossRef] [PubMed]
- Villaverde, J.; Sevilla-Morán, B.; López-Goti, C.; Alonso-Prados, J.; Sandín-España, P. Computational-Based Study of QuEChERS Extraction of Cyclohexanedione Herbicide Residues in Soil by Chemometric Modeling. Molecules 2018, 23, 2009. [Google Scholar] [CrossRef] [PubMed]
- Chang, C.C.; Kao, T.H.; Zhang, D.; Wang, Z.; Inbaraj, B.S.; Hsu, K.Y.; Chen, B.H. Application of QuEChERS Coupled with HPLC-DAD-ESI-MS/MS for Determination of Heterocyclic Amines in Commercial Meat Products. Food Anal. Methods 2018, 11, 3243–3256. [Google Scholar] [CrossRef]
- Jiang, J.; Ma, D.; Zou, N.; Yu, X.; Zhang, Z.; Liu, F.; Mu, W. Concentrations of imidacloprid and thiamethoxam in pollen, nectar and leaves from seed-dressed cotton crops and their potential risk to honeybees (Apis mellifera L.). Chemosphere 2018, 201, 159. [Google Scholar] [CrossRef] [PubMed]
- Li, C.; Chen, J.; Chen, Y.; Wang, J.; Ping, H.; Lu, A. Graphene-Derivatized Silica Composite as Solid-Phase Extraction Sorbent Combined with GC-MS/MS for the Determination of Polycyclic Musks in Aqueous Samples. Molecules 2018, 23, 318. [Google Scholar] [CrossRef] [PubMed]
- Martinello, M.; Baratto, C.; Manzinello, C.; Piva, E.; Borin, A.; Toson, M.; Granato, A.; Boniotti, M.B.; Gallina, A.; Franco, M. Spring mortality in honey bees in northeastern Italy: Detection of pesticides and viruses in dead honey bees and other matrices. J. Agric. Res. 2017, 56, 239–254. [Google Scholar]
- Tosi, S.; Costa, C.; Vesco, U.; Quaglia, G.; Guido, G. A 3-year survey of Italian honey bee-collected pollen reveals widespread contamination by agricultural pesticides. Sci. Total Environ. 2018, 615, 208–218. [Google Scholar] [CrossRef] [PubMed]
- Boi, M.; Serra, G.; Colombo, R.; Lodesani, M.; Massi, S.; Costa, C. A 10 year survey of acaricide residues in beeswax analysed in Italy. Pest Manag. Sci. 2016, 72, 1366–1372. [Google Scholar] [CrossRef] [PubMed]
- Rortais, A.S.; Arnold, G.R.; Halm, M.-P.; Touffet-Briens, F. Modes of honeybees exposure to systemic insecticides: Estimated amounts of contaminated pollen and nectar consumed by different categories of bees. Apidologie 2005, 36, 71–83. [Google Scholar] [CrossRef]
- Chauzat, M.P.; Faucon, J.P. Pesticide residues in beeswax samples collected from honey bee colonies (Apis mellifera L.) in France. Pest. Manag. Sci. 2007, 63, 11001106. [Google Scholar] [CrossRef] [PubMed]
- Chauzat, M.P.; Martel, A.C.; Cougoule, N.; Porta, P.; Sarah Zeggane, J.L.; Aubert, M.; Carpentier, P.; Faucon, J.P. An assessment of honeybee colony matrices, Apis mellifera (Hymenoptera: Apidae) to monitor pesticide presence in continental France. Environ. Toxicol. Chem. 2011, 30, 103–111. [Google Scholar] [CrossRef] [PubMed]
- Lambert, O.; Piroux, M.; Puyo, S.; Thorin, C.; Thorin, C.; L’Hostis, M.; Wiest, L.; Buleté, A.; Delbac, F.; Pouliquen, H. Widespread occurrence of chemical residues in beehive matrices from apiaries located in different landscapes of Western France. PLoS ONE 2013, 8, e67007. [Google Scholar] [CrossRef] [PubMed]
- Giroud, B.; Vauchez, A.; Vulliet, E.; Wiest, L.; Buleté, A. Trace level determination of pyrethroid and neonicotinoid insecticides in beebread using acetonitrile-based extraction followed by analysis with ultra-high-performance liquid chromatography-tandem mass spectrometry. J. Chromatogr. A 2013, 1316, 53–61. [Google Scholar] [CrossRef] [PubMed]
- Daniele, G.; Giroud, B.; Jabot, C.; Vulliet, E. Exposure assessment of honeybees through study of hive matrices: Analysis of selected pesticide residues in honeybees, beebread, and beeswax from French beehives by LC-MS/MS. Environ. Sci. Pollut. Res. Int. 2017, 25, 6145–6153. [Google Scholar] [CrossRef] [PubMed]
- Lozowicka, B. The development, validation and application of a GC-dual detector (NPD-ECD) multi-pesticide residue method for monitoring bee poisoning incidents. Ecotoxicol. Environ. Saf. 2013, 97, 210–222. [Google Scholar] [CrossRef] [PubMed]
- Barganska, Z.; Slebioda, M.; Namiesnik, J. Determination of pesticide residues in honeybees using modified QUEChERS sample work-up and liquid chromatography-tandem mass spectrometry. Molecules 2014, 19, 2911–2924. [Google Scholar] [CrossRef] [PubMed]
- Kiljanek, T.; Niewiadowska, A.; Gawel, M.; Semeniuk, S.; Borzęcka, M.; Posyniak, A.; Pohorecka, K. Multiple pesticide residues in live and poisoned honeybees—Preliminary exposure assessment. Chemosphere 2017, 175, 36–44. [Google Scholar] [CrossRef] [PubMed]
- Migdał, P.; Roman, A.; Popiela-Pleban, E.; Kowalska-Góralska, M.; Opaliński, S. The Impact of Selected Pesticides on Honey Bees. Pol. J. Environ. Stud. 2018, 27, 787–792. [Google Scholar] [CrossRef] [Green Version]
- Tong, Z.; Wu, Y.C.; Liu, Q.Q.; Shi, Y.H.; Zhou, L.J.; Liu, Z.Y.; Yu, L.S.; Cao, H.Q. Multi-Residue Analysis of Pesticide Residues in Crude Pollens by UPLC-MS/MS. Molecules 2016, 21, 1652. [Google Scholar] [CrossRef] [PubMed]
- Campbell, P.J.; Brown, K.C.; Harrison, E.G.; Bakker, F.; Barrett, K.L.; Candolfi, M.P.; Canez, V.; Dinter, A.; Lewis, G.; Mead-Briggs, M.; et al. A hazard quotient approach for assessing the risk to non-target arthropods from. J. Pest Sci. 2000, 73, 117. [Google Scholar]
- Environmental Risk Assessment for Plant Protection Products. PP 3/10 (3): Chapter 10: Honeybees. EPPO Bull. 2010, 40, 323–331. [Google Scholar] [CrossRef]
- Stoner, K.A.; Eitzer, B.D. Using a hazard quotient to evaluate pesticide residues detected in pollen trapped from honey bees (Apis mellifera) in Connecticut. PLoS ONE 2013, 8, e77550. [Google Scholar] [CrossRef] [PubMed]
- Walorczyk, S.; Gnusowski, B. Development and validation of a multi-residue method for the determination of pesticides in honeybees using acetonitrile-based extraction and gas chromatography-tandem quadrupole mass spectrometry. J. Chromatogr. A 2009, 1216, 6522–6531. [Google Scholar] [CrossRef] [PubMed]
- Kong, W.J.; Liu, Q.T.; Kong, D.D.; Liu, Q.Z.; Ma, X.P.; Yang, M.H. Trace analysis of multi-class pesticide residues in Chinese medicinal health wines using gas chromatography with electron capture detection. Sci. Rep. 2016, 6, 21558. [Google Scholar] [CrossRef] [PubMed] [Green Version]
- Sanchez-Bayo, F.; Goka, K. Pesticide residues and bees—A risk assessment. PLoS ONE 2014, 9, e94482. [Google Scholar] [CrossRef] [PubMed]
- Hermansson, J. Biology of the diamondback moth (Plutella xylostella) and its future impact in Swedish oilseed rape production. Swedish Univ. Agric. Sci. 2016, 15, 1–44. [Google Scholar]
- Simondelso, N.; San, M.G.; Bruneau, E.; Minsart, L.A.; Mouret, C.; Hautier, L. Honeybee colony disorder in crop areas: The role of pesticides and viruses. PLoS ONE 2013, 9, e103073. [Google Scholar]
- Pilling, E.D.; Bromleychallenor, K.A.C.; Walker, C.H.; Jepson, P.C. Mechanism of Synergism between the Pyrethroid Insecticide λ-Cyhalothrin and the Imidazole Fungicide Prochloraz, in the Honeybee (Apis mellifera L.). Pest. Biochem. Physiol. 1995, 51, 1–11. [Google Scholar] [CrossRef]
Sample Availability: Samples of the rape flowers are available from the authors. |


| Days after Treatment | Untreated Control | Residue Levels of the Neonicotinoids (ng/g) ± SD | |||||
|---|---|---|---|---|---|---|---|
| Thiamethoxam (30 g a.i./ha) ME (29%) | Imidacloprid (60 g a.i./ha) ME (75%) | Acetamiprid (60 g a.i./ha) ME (−5%) | |||||
| Residue | Degradation Rate (%) | Residue | Degradation Rate (%) | Residue | Degradation Rate (%) | ||
| 0 day | ND | 375.0 ± 35.5 | - | 1006.0 ± 150.3 | - | 1259.0 ± 108.2 | - |
| 1 day | ND | 315.3 ± 45.3 | 15.9 | 390.0 ± 57.5 | 61.2 | 1099.7 ± 170.4 | 12.7 |
| 3 day | ND | 108.7 ± 3.1 | 71.0 | 78.7 ± 1.5 | 92.2 | 394.3 ± 8.6 | 68.7 |
| 5 day | ND | 78.7 ± 7.2 | 79.0 | 68.3 ± 3.1 | 93.2 | 337.7 ± 29.3 | 73.2 |
| 7 day | ND | 18.7 ± 2.5 | 95.0 | 11.3 ± 1.2 | 98.9 | 87.3 ± 5.5 | 93.1 |
| 10 day | ND | 9.3 ± 1.2 | 97.5 | ND | - | 27.3 ± 1.5 | 97.8 |
| 14 day | ND | 8.0 ± 1.0 | 97.9 | ND | - | 10.3 ± 0.6 | 98.7 |
| DT50 day | - | 2.3 | 1.2 | 1.9 | |||
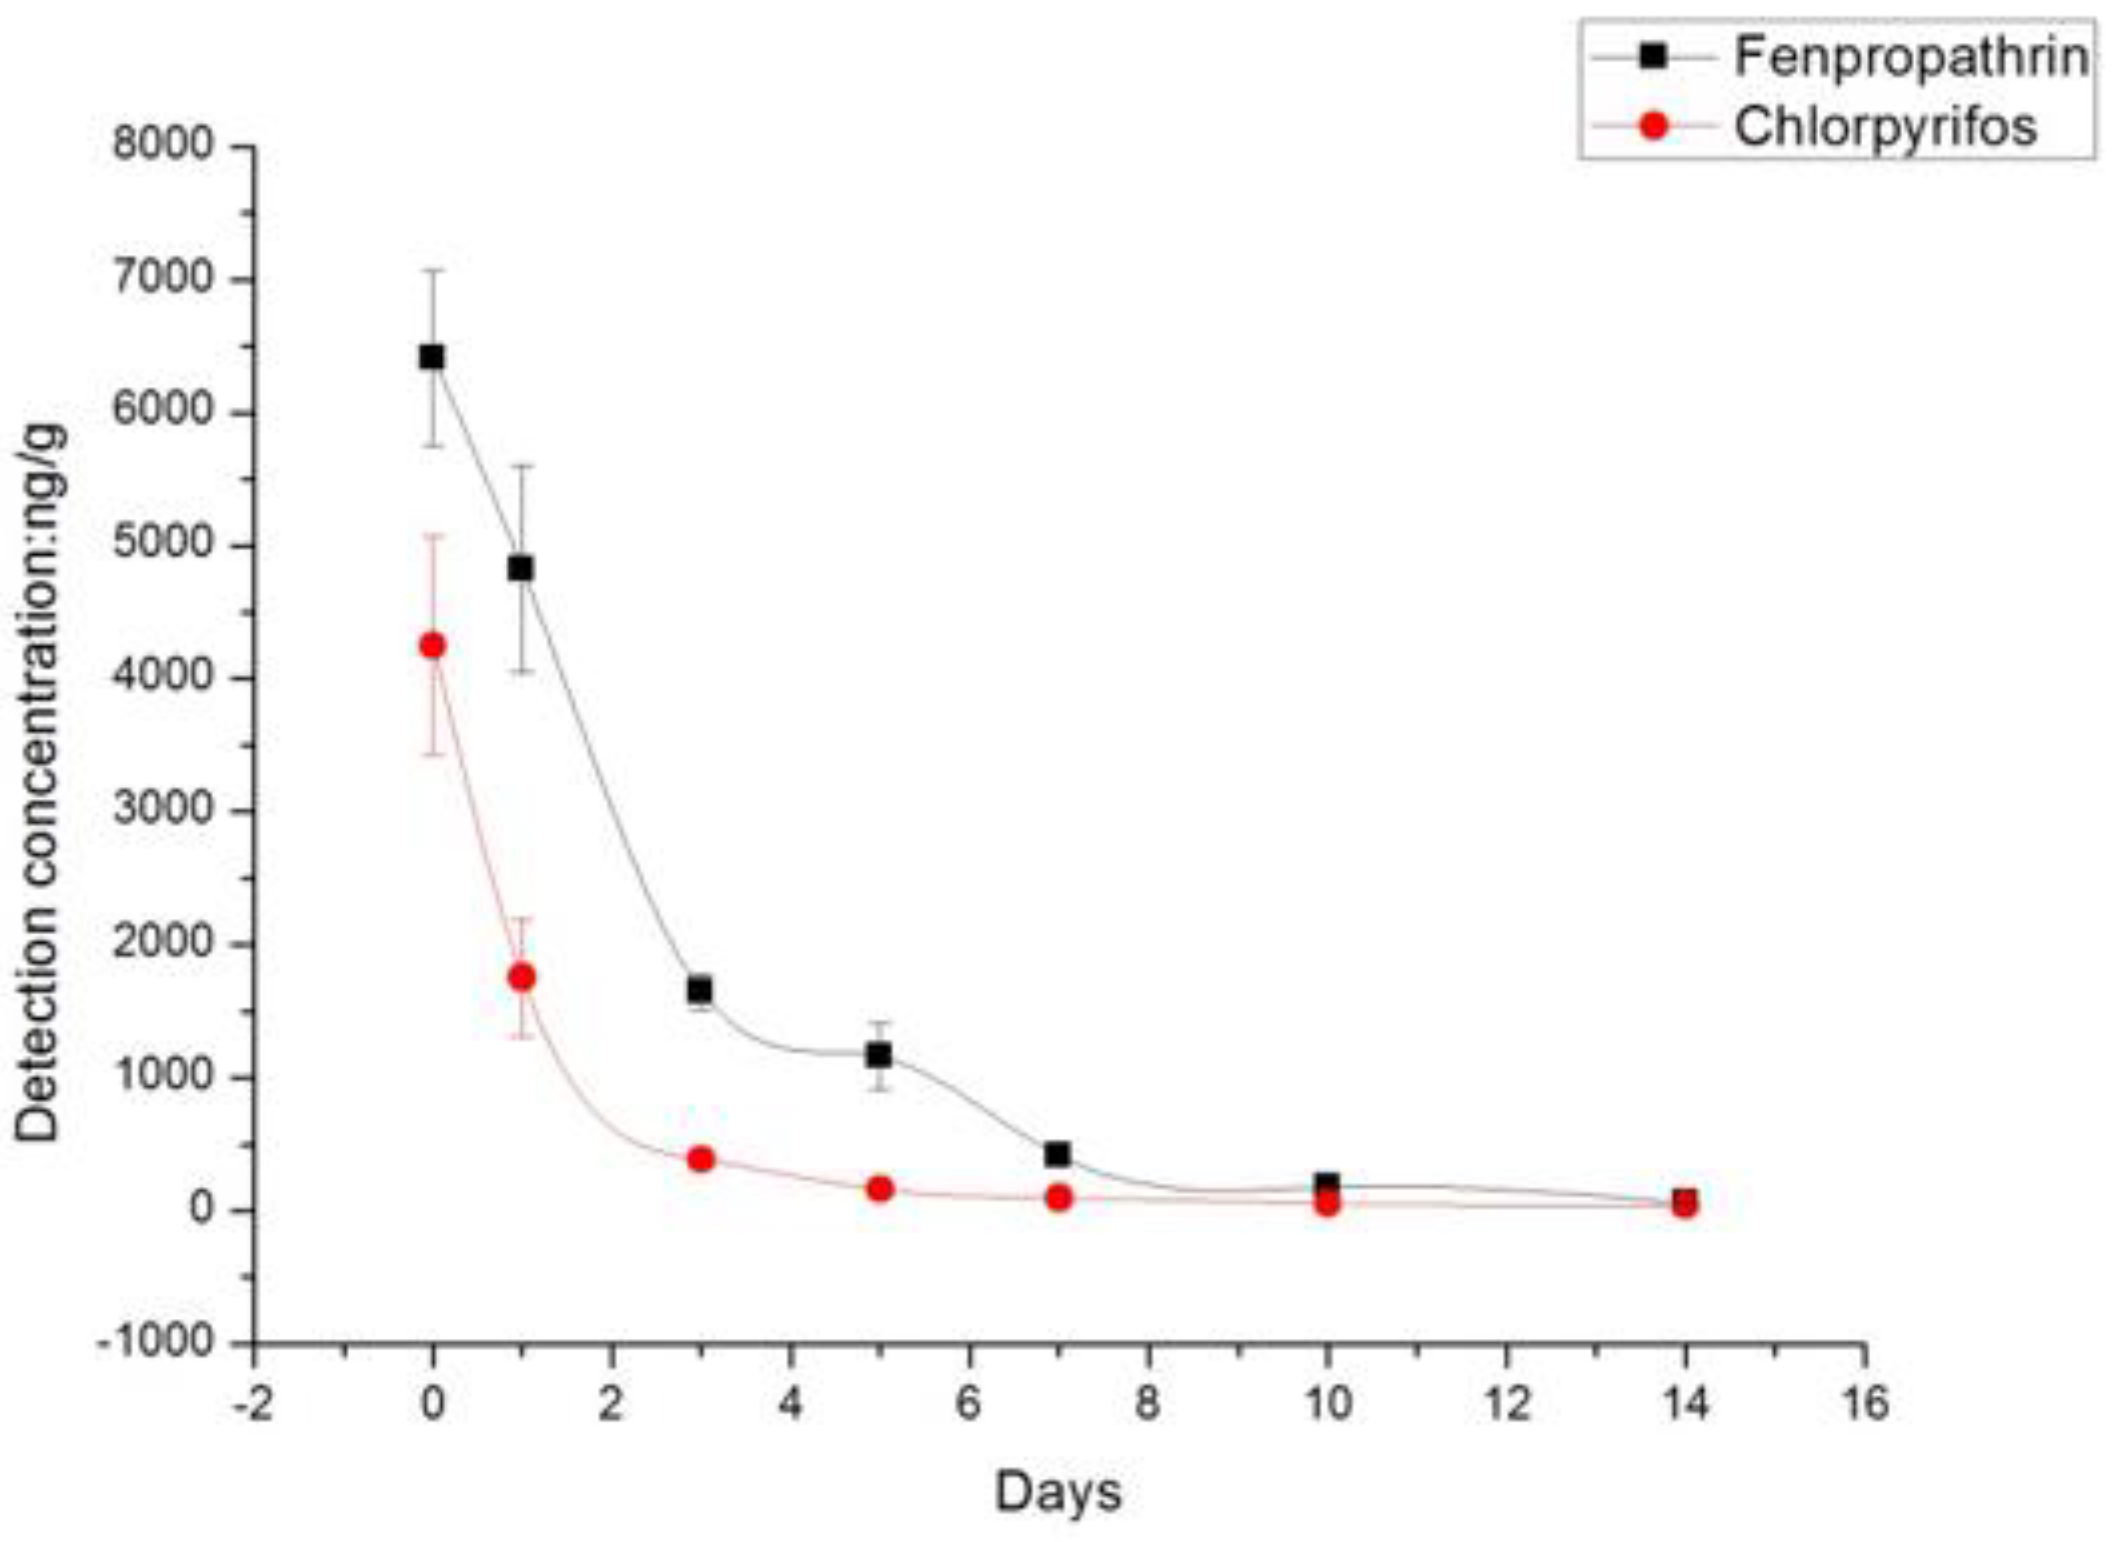
| Days after Treatment | Untreated Control | Residue Levels of Insecticides (ng/g) ± SD | |||
|---|---|---|---|---|---|
| Chlorpyrifos (360 g a.i./ha) ME (22%) | Fenpropathrin (60 g a.i./ha) ME (−8%) | ||||
| Residue | Degradation Rate (%) | Residue | Degradation Rate (%) | ||
| 0 day | ND | 4249 ± 821.1 | - | 6409 ± 656.6 | - |
| 1 day | ND | 1755 ± 441.6 | 58.7 | 4824.± 778.7 | 24.7 |
| 3 day | ND | 386.3 ± 14.3 | 90.9 | 1646 ± 129.5 | 74.3 |
| 5 day | ND | 160.7 ± 15.6 | 96.2 | 1159 ± 246.0 | 81.9 |
| 7 day | ND | 98.3 ± 14.0 | 97.7 | 412.0 ± 66.8 | 93.6 |
| 10 day | ND | 57.3 ± 4.9 | 98.7 | 179.0 ± 21.1 | 97.2 |
| 14 day | ND | 38.7 ± 5.5 | 99.1 | 58.7 ± 11.5 | 99.1 |
| DT50 day | - | 2.1 | 2.0 | ||
| Days after Treatment | Untreated Control | Residue Levels of the Fungicides (ng/g) ± SD | |||||
|---|---|---|---|---|---|---|---|
| Carbendazim (1500 g a.i./ha) ME (50%) | Pyrimethanil (360 g a.i./ha) ME (−34%) | Prochloraz (181.5 g a.i./ha) ME (−20%) | |||||
| Residue | Degradation Rate (%) | Residue | Degradation Rate (%) | Residue | Degradation Rate (%) | ||
| 0 day | ND | 32,299 ± 583.0 | - | 16,222 ± 573.7 | - | 11,684 ± 167.0 | - |
| 1 day | ND | 25,316 ± 878.0 | 21.6 | 93,089 ± 724.9 | 42.6 | 4891 ± 150.3 | 58.1 |
| 3 day | ND | 11,478 ± 814.5 | 64.5 | 1155 ± 104.4 | 92.9 | 471.7 ± 58.1 | 96.0 |
| 5 day | ND | 8713 ± 564.2 | 73.0 | 374.3 ± 23.6 | 97.7 | 100.3 ± 4.7 | 99.1 |
| 7 day | ND | 6196 ± 498.3 | 80.8 | 195.7 ± 2.1 | 98.8 | 57.3 ± 0.6 | 99.5 |
| 10 day | ND | 1908 ± 477.6 | 94.1 | 50.3 ± 3.2 | 99.7 | 11.3 ± 2.9 | 99.9 |
| 14 day | ND | 153.3 ± 17.9 | 99.5 | 9.3 ± 1.5 | 99.9 | ND | - |
| DT50 day | 2.0 | 1.3 | 1.0 | ||||
| Days after Treatment | 0 Day | 1 Day | 3 Day | 5 Day | 7 Day | 10 Day | 14 Day |
|---|---|---|---|---|---|---|---|
| Data | 27 March | 28 March | 30 March | 1 April | 3 April | 6 April | 10 April |
| Season | Spring | ||||||
| Weather | Sunny | Sunny | Cloudy | Rain | Cloudy | Cloudy | Sunny |
| Rainfall | - | - | - | 4 mm | - | - | - |
| Temperature | 24 °C | 25 °C | 22 °C | 22 °C | 21 °C | 25 °C | 26 °C |
| Compound | ME | Spiked Level (ng/g) | Intra-Day (n = 5) | (Inter-Day) (n = 15) RSDR (%) | |||||
|---|---|---|---|---|---|---|---|---|---|
| Day 1 | Day 2 | Day 3 | |||||||
| Recovery (%) | RSDr (%) | Recovery (%) | RSDr (%) | Recovery (%) | RSDr (%) | ||||
| Carbendazim | 50 | 5 | 95.6 | 4.7 | 88.9 | 3.9 | 90.5 | 6.9 | 5.2 |
| 50 | 88.4 | 3.6 | 78.9 | 2.2 | 92.6 | 6.5 | 4.1 | ||
| 500 | 97.6 | 3.2 | 88.5 | 5.7 | 91.8 | 6.2 | 5.0 | ||
| Thiamethoxam | 29 | 5 | 100.5 | 1.2 | 97.6 | 5.0 | 95.3 | 4.6 | 3.6 |
| 50 | 94.3 | 4.8 | 95.3 | 4.2 | 92.8 | 4.0 | 3.0 | ||
| 500 | 97.1 | 2.4 | 93.2 | 2.8 | 115.2 | 6.1 | 3.8 | ||
| Imidacloprid | 75 | 5 | 95.7 | 4.2 | 88.4 | 9.7 | 90.6 | 6.3 | 4.7 |
| 50 | 88.4 | 1.2 | 93.4 | 2.3 | 93.7 | 5.6 | 3.0 | ||
| 500 | 96.5 | 2.9 | 93.2 | 5.2 | 95.6 | 4.9 | 4.3 | ||
| Acetamiprid | −5 | 5 | 100.1 | 4.6 | 95.6 | 4.9 | 93.2 | 6.1 | 5.2 |
| 50 | 91.2 | 2.1 | 105.2 | 5.6 | 92.9 | 4.8 | 4.2 | ||
| 500 | 98.0 | 5.6 | 94.2 | 4.2 | 89.9 | 5.9 | 5.2 | ||
| Pyrimethanil | −34 | 5 | 88.9 | 3.6 | 94.2 | 3.8 | 89.5 | 8.9 | 5.4 |
| 50 | 89.7 | 4.2 | 91.3 | 4.9 | 90.8 | 5.4 | 4.8 | ||
| 500 | 90.8 | 5.2 | 96.5 | 3.1 | 92.7 | 5.6 | 3.0 | ||
| Procholraz | −20 | 5 | 95.7 | 4.2 | 88.4 | 3.7 | 90.6 | 6.3 | 4.7 |
| 50 | 88.4 | 1.2 | 93.4 | 2.3 | 93.7 | 5.6 | 3.0 | ||
| 500 | 96.5 | 2.9 | 93.2 | 5.2 | 95.6 | 4.9 | 4.3 | ||
| Chlorpyrifos | 22 | 5 | 100.1 | 4.6 | 95.6 | 4.9 | 93.2 | 6.1 | 11.2 |
| 50 | 91.2 | 2.1 | 95.2 | 5.6 | 92.9 | 4.8 | 4.2 | ||
| 500 | 98.0 | 10.6 | 94.2 | 4.2 | 89.9 | 5.9 | 5.2 | ||
| Fenpropathrin | −8 | 5 | 92.3 | 4.8 | 99.2 | 4.5 | 91.2 | 6.2 | 5.2 |
| 50 | 89.6 | 2.5 | 92.5 | 3.7 | 91.8 | 6.5 | 4.2 | ||
| 500 | 95.2 | 6.6 | 94.6 | 2.5 | 88.3 | 5.4 | 4.8 | ||
| Days after Treatment | Oral Flower Hazard Quotient (FHQdo) | |||||||
|---|---|---|---|---|---|---|---|---|
| Thiamethoxam | Imidacloprid | Acetamiprid | Chlorpyrifos | Fenpropathrin | Carbendazim | Pyrimethanil | Prochloraz | |
| 0 day | 75.02 | 773.78 | 0.09 | 17.71 | 128.18 | 0.65 | 0.32 | 116.80 |
| 1 day | 63.15 | 300.21 | 0.08 | 7.31 | 96.48 | 0.51 | 0.19 | 48.91 |
| 3 day | 21.76 | 60.76 | - | 1.61 | 32.91 | 0.23 | 0.02 | 4.72 |
| 5 day | 15.42 | 52.49 | - | 0.67 | 23.19 | 0.17 | - | 1.03 |
| 7 day | 3.72 | 8.74 | - | 0.41 | 8.24 | 0.12 | - | 0.57 |
| 10 day | 1.91 | 3.61 | - | 0.24 | 3.58 | 0.04 | - | 0.11 |
| 14 day | 1.62 | 2.38 | - | 0.16 | 1.17 | - | - | 0.02 |
© 2018 by the authors. Licensee MDPI, Basel, Switzerland. This article is an open access article distributed under the terms and conditions of the Creative Commons Attribution (CC BY) license (http://creativecommons.org/licenses/by/4.0/).
Share and Cite
Tong, Z.; Duan, J.; Wu, Y.; Liu, Q.; He, Q.; Shi, Y.; Yu, L.; Cao, H. Evaluation of Highly Detectable Pesticides Sprayed in Brassica napus L.: Degradation Behavior and Risk Assessment for Honeybees. Molecules 2018, 23, 2482. https://doi.org/10.3390/molecules23102482
Tong Z, Duan J, Wu Y, Liu Q, He Q, Shi Y, Yu L, Cao H. Evaluation of Highly Detectable Pesticides Sprayed in Brassica napus L.: Degradation Behavior and Risk Assessment for Honeybees. Molecules. 2018; 23(10):2482. https://doi.org/10.3390/molecules23102482
Chicago/Turabian StyleTong, Zhou, Jinsheng Duan, Yancan Wu, Qiongqiong Liu, Qibao He, Yanhong Shi, Linsheng Yu, and Haiqun Cao. 2018. "Evaluation of Highly Detectable Pesticides Sprayed in Brassica napus L.: Degradation Behavior and Risk Assessment for Honeybees" Molecules 23, no. 10: 2482. https://doi.org/10.3390/molecules23102482