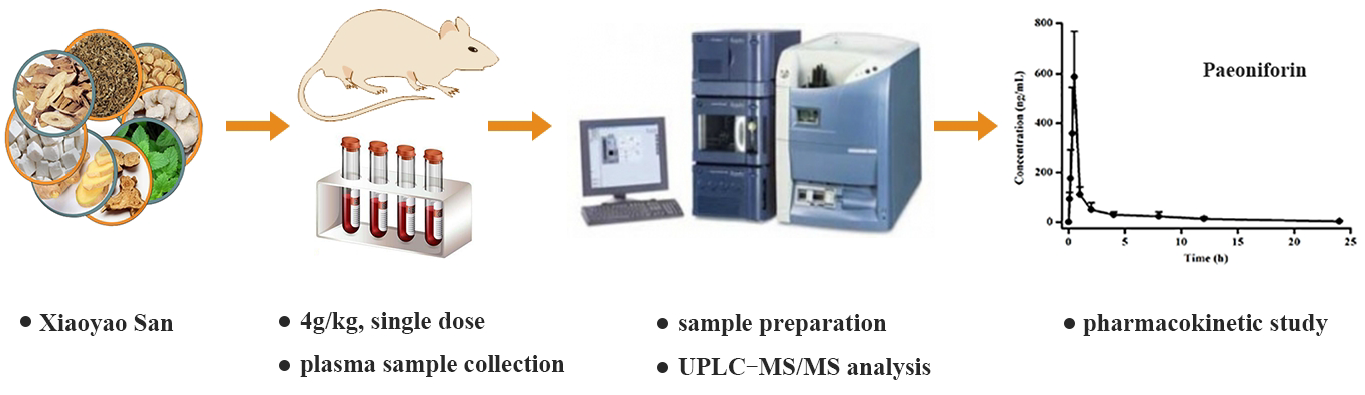
UPLC-MS/MS Method for the Determination of 14 Compounds in Rat Plasma and Its Application in a Pharmacokinetic Study of Orally Administered Xiaoyao Powder

 , and
, and
Abstract
:
1. Introduction
2. Results and Discussion
2.1. Method Validation
2.1.1. Specificity
2.1.2. Linearity and Calibration Curve
2.1.3. Precision and Accuracy
2.1.4. Extraction Recovery and Matrix Effect
2.1.5. Stability
2.1.6. Pharmacokinetic Study
3. Materials and Methods
3.1. Chemicals and Reagents
3.2. Instrumentation and Ultraperformance Liquid Chromatography-Tandem Mass Spectrometry (UPLC-MS/MS) Analytical Conditions
3.3. Preparation of Standards and Quality Control (QC) Samples
3.4. Preparation and Quality Assessment of XYP Extract
3.5. Plasma Sample Preparation
3.6. Method Validation
3.6.1. Specificity
3.6.2. Linearity and Lower Limit of Quantitation (LLOQ)
3.6.3. Precision and Accuracy
3.6.4. Extraction Recovery and Matrix Effect
3.5.5. Stability
3.7. Pharmacokinetic Study
4. Conclusions
Author Contributions
Funding
Acknowledgments
Conflicts of Interest
References
- Geng, F.; Zhang, N.; Fang, H.; Li, J.M.; Zhao, X.; Liu, H.Y. Metabonomic study on protective effect of xiaoyao powder for acute hepatic injury in rats. Zhong Yao Cai 2014, 37, 275–279. [Google Scholar] [PubMed]
- Li, X.J.; Ma, Q.Y.; Jiang, Y.M.; Bai, X.H.; Yan, Z.Y.; Liu, Q.; Pan, Q.X.; Liu, Y.Y.; Chen, J.X. Xiaoyaosan exerts anxiolytic-like effects by down-regulating the TNF-α/JAK2-STAT3 pathway in the rat hippocampus. Sci. Rep. 2017, 7, 353. [Google Scholar] [CrossRef] [PubMed]
- Man, C.F.; Li, C.; Gong, D.D.; Xu, J.; Fan, Y. Meta-analysis of chinese herbal xiaoyao formula as an adjuvant treatment in relieving depression in chinese patients. Complement Ther. Med. 2014, 22, 362–370. [Google Scholar] [CrossRef] [PubMed]
- Wang, J.J.; Li, X.F.; He, S.G.; Hu, L.J.; Guo, J.W.; Huang, X.N.; Hu, J.Q.; Qi, Y.Q.; Chen, B.; Shang, D.W.; et al. Regulation of the kynurenine metabolism pathway by xiaoyao san and the underlying effect in the hippocampus of the depressed rat. J. Ethnopharmacol. 2018, 214, 13–21. [Google Scholar] [CrossRef] [PubMed]
- Chinese Pharmacopoeia Commission. Pharmacopoeia of the People’s Republic of China, 2015 ed.; Chinese Medical Science and Technology Press: Beijing, China, 2015; Volume 1, p. 11354. [Google Scholar]
- Geng, F.; Zou, T.B.; Wang, Y.Q.; Li, J.M.; Zhang, N.; Ren, Y.D.; Liu, H.Y. UPLC-MS fingerprint of Xiaoyao San. Chin. J. Pharm. Anal. 2013, 33, 1250–1253. [Google Scholar]
- Liu, H.; Wang, Y.Y.; Yu, Q.; Li, J.M.; Zhang, N.; Geng, F. GC-MS characteristic chromatograms of xiaoyao powder. Chin. J. Pharm. Anal. 2013, 33, 1507–1517. [Google Scholar]
- Zhang, N.; Fang, H.; Wang, X.; Zhang, C.S.; Liu, B.; Zhao, X.; Geng, F. Metabonomic study of intervene effect of xiaoyao powder on rats with hepatic fibrosis. Chin. J. Pharm. Anal. 2014, 34, 588–594. [Google Scholar]
- Wang, X.Y.; Ma, X.H.; Li, W.; Chu, Y.; Guo, J.H.; Li, S.M.; Wang, J.M.; Zhang, H.C.; Zhou, S.P.; Zhu, Y.H. Simultaneous determination of five phenolic components and paeoniflorin in rat plasma by liquid chromatography-tandem mass spectrometry and pharmacokinetic study after oral administration of cerebralcare granule (®). J. Pharm. Biomed. Anal. 2013, 86, 82–91. [Google Scholar] [CrossRef] [PubMed]
- Wang, R.; Zhang, H.; Wang, Y.Y.; Song, F.X.; Yuan, Y.F. Inhibitory effects of quercetin on the progression of liver fibrosis through the regulation of NF-кB/IкBα, p38 MAPK, and Bcl-2/Bax signaling. Int. Immunopharmacol. 2017, 47, 126–133. [Google Scholar] [CrossRef] [PubMed]
- Du, Z.A.; Sun, M.N.; Hu, Z.S. Saikosaponin a ameliorates LPS-Induced acute lung injury in mice. Inflammation 2018, 41, 193–198. [Google Scholar] [CrossRef] [PubMed]
- Lee, T.H.; Park, S.; You, M.H.; Lim, J.H.; Min, S.H.; Kim, B.M. A potential therapeutic effect of saikosaponin c as a novel dual-target anti-Alzheimer agent. J. Neurochem. 2016, 136, 1232–1245. [Google Scholar] [CrossRef] [PubMed]
- Kuang, X.; Zhou, H.J.; Thorne, A.H.; Chen, X.N.; Li, L.J.; Du, J.R. Neuroprotective effect of ligustilide through induction of α-Secretase processing of both APP and klotho in a mouse model of alzheimer’s disease. Front. Aging Neurosci. 2017, 9, 353. [Google Scholar] [CrossRef] [PubMed]
- Luo, N.; Li, Z.; Qian, D.; Qian, Y.; Guo, J.; Duan, J.; Zhu, M. Simultaneous determination of bioactive components of Radix Angelicae Sinensis—Radix Paeoniae Alba herb couple in rat plasma and tissues by UPLC-MS/MS and its application to pharmacokinetics and tissue distribution. J. Chromatogr. B Anal. Technol. Biomed. Life Sci. 2014, 963, 29–39. [Google Scholar] [CrossRef] [PubMed]
- Kim, H.Y.; Park, J.Y.; Lee, K.H.; Lee, D.U.; Kwak, J.H.; Kim, Y.S.; Lee, S.M. Ferulic acid protects against carbon tetrachloride-induced liver injury in mice. Toxicology 2011, 282, 104–111. [Google Scholar] [CrossRef] [PubMed]
- Kim, Y.W.; Ki, S.H.; Lee, J.R.; Lee, S.J.; Kim, C.W.; Kim, S.C.; Kim, S.G. Liquiritigenin, an aglycone of liquiritin in Glycyrrhizae radix, prevents acute liver injuries in rats induced by acetaminophen with or without buthionine sulfoximine. Chem. Biol. Interact. 2006, 161, 125–138. [Google Scholar] [CrossRef] [PubMed]
- Zhao, Z.; Park, S.M.; Guan, L.; Wu, Y.; Lee, J.R.; Kim, S.C.; Kim, Y.W.; Zhao, R. Isoliquiritigenin attenuates oxidative hepatic damage induced by carbon tetrachloride with or without buthionine sulfoximine. Chem. Biol. Interact. 2015, 225, 13–20. [Google Scholar] [CrossRef] [PubMed]
- Zhao, Z.Y.; Wang, W.X.; Guo, H.Z.; Zhou, D.F. Antidepressant-like effect of liquiritin from glycyrrhiza uralensis in chronic variable stress induced depression model rats. Behav. Brain. Res. 2008, 194, 108–113. [Google Scholar] [CrossRef]
- Sun, X.; Duan, X.P.; Wang, C.Y.; Liu, Z.H.; Sun, P.Y.; Huo, X.K.; Ma, X.D.; Sun, H.J.; Liu, K.X.; Meng, Q. Protective effects of glycyrrhizic acid against non-alcoholic fatty liver disease in mice. Eur. J. Pharmacol. 2017, 806, 75–82. [Google Scholar] [CrossRef] [PubMed]
- Wang, B.; Lian, Y.J.; Dong, X.; Peng, W.; Liu, L.L.; Su, W.J.; Gong, H.; Zhang, T.; Jiang, C.L.; Li, J.S.; et al. Glycyrrhizic acid ameliorates the kynurenine pathway in association with its antidepressant effect. Behav. Brain. Res. 2018. [Google Scholar] [CrossRef] [PubMed]
- Qiu, F.; Zhong, X.; Mao, Q.; Huang, Z. The antidepressant-like effects of paeoniflorin in mouse models. Exp. Ther. Med. 2013, 5, 1113–1116. [Google Scholar] [CrossRef] [PubMed] [Green Version]
- Qiu, F.M.; Zhong, X.M.; Mao, Q.Q.; Huang, Z. Antidepressant-like effects of paeoniflorin on the behavioural, biochemical, and neurochemical patterns of rats exposed to chronic unpredictable stress. Neurosci. Lett. 2013, 541, 209–213. [Google Scholar] [CrossRef] [PubMed]
- Wang, Y.L.; Wang, J.X.; Hu, X.X.; Chen, L.; Qiu, Z.K.; Zhao, N.; Yu, Z.D.; Sun, S.Z.; Xu, Y.Y.; Guo, Y.; et al. Antidepressant-like effects of albiflorin extracted from Radix paeoniae Alba. J. Ethnopharmacol. 2016, 179, 9–15. [Google Scholar] [CrossRef] [PubMed]
- Hu, Y.Y.; Duan, M.Y.; Liang, S.; Wang, Y.; Feng, Y. Senkyunolide I protects rat brain against focal cerebral ischemia-reperfusion injury by up-regulating p-Erk1/2, Nrf2/HO-1 and inhibiting caspase 3. Brain. Res. 2015, 1605, 39–48. [Google Scholar] [CrossRef] [PubMed]
- Fu, X.Q.; Chou, G.X.; Kwan, H.Y.; Tse, A.K.; Zhao, L.H.; Yuen, T.K.; Cao, H.H.; Yu, H.; Chao, X.J.; Su, T.; et al. Inhibition of STAT3 signalling contributes to the antimelanoma action of atractylenolide II. Exp. Dermatol. 2014, 23, 855–864. [Google Scholar] [CrossRef] [PubMed]
- Liu, C.; Zhao, H.; Ji, Z.H.; Yu, X.Y. Neuroprotection of atractylenolide III from Atractylodis macrocephalae against glutamate-induced neuronal apoptosis via inhibiting caspase signaling pathway. Neurochem. Res. 2014, 39, 1753–1758. [Google Scholar] [CrossRef] [PubMed]
- Zhao, L.S.; Li, F.M. UHPLC-MS strategies and applications for bioanalyses related to pharmacokinetics and drug metabolism. Trends Anal. Chem. 2014, 63, 170–179. [Google Scholar] [CrossRef]
- Li, W.X.; Guo, J.M.; Tang, Y.P.; Wang, H.; Huang, M.Y.; Qian, D.W.; Duan, J.A. Pharmacokinetic comparison of ferulic acid in normal and blood deficiency rats after oraladministration of Angelica sinensis, Ligusticum chuanxiong and their combination. Int. J. Mol. Sci. 2012, 13, 3583–3597. [Google Scholar] [CrossRef] [PubMed]
- Zhu, Z.M.; Li, H.C.; Luo, J.B. Simultaneous determination of atractylenolide I, II, III by HPLC-MS method and its application to pharmacokinetic study. Pharmacol. Clin. Chin. Mater. Med. 2013, 29, 25–29. [Google Scholar]
- Yan, H.; Sun, Y.Y.; Zhang, Q.L.; Yang, M.J.; Wang, X.R.; Wang, Y.; Yu, Z.G.; Zhao, Y.L. Simultaneous determination and pharmacokinetic study of Atractylenolide I, II and III in ratplasma after intragastric administration of Baizhufuling extract and Atractylodis extract by UPLC-MS/MS. J. Chromatogr. B 2015, 993–994, 86–92. [Google Scholar] [CrossRef] [PubMed]
- Yang, L.L.; Xiao, N.; Li, X.W.; Fan, Y.; Alolga, R.N.; Sun, X.Y.; Wang, S.L.; Li, P.; Qi, L.W. Pharmacokinetic comparison between quercetin and quercetin 3-O-β-glucuronide in rats by UHPLC-MS/MS. Sci. Rep. 2016, 6, 35460. [Google Scholar] [CrossRef] [PubMed]
- Day, A.J.; DuPont, M.S.; Ridley, S.; Rhodes, M.; Rhodes, M.J.C.; Morgan, M.R.A.; Williamson, G. Deglycosylation of flavonoid and isoflavonoid glycosides by human small intestine and liver β-glucosidase activity. FEBS Lett. 1998, 436, 71–75. [Google Scholar] [CrossRef] [Green Version]
- Qiao, X.; Ye, M.; Xiang, C.; Wang, Q.; Liu, C.F.; Miao, W.J.; Guo, D.A. Analytical strategy to reveal the in vivo process of multi-component herbal medicine: A pharmacokinetic study of licorice using liquid chromatography coupled with triple quadrupole mass spectrometry. J. Chromatogr. A 2012, 1258, 84–93. [Google Scholar] [CrossRef] [PubMed]
- He, C.Y.; Wang, S.; Feng, Y.; Liang, S.; Lin, X.; Xu, D.S.; Ruan, K.F. Pharmacokinetics, tissue distribution and metabolism of senkyunolide I, a major bioactivecomponent in Ligusticum chuanxiong Hort. (Umbelliferae). J. Ethnopharmacol. 2012, 142, 706–713. [Google Scholar] [CrossRef] [PubMed]
- Shi, Y.F.; He, L.C.; Wang, S. Determination of ligustilide in rat blood and tissues by capillary gas chromatography/mass spectrometry. Biomed. Chromatogr. 2006, 20, 993–998. [Google Scholar] [CrossRef] [PubMed]
- Guan, X.; Wang, X.; Yan, K.; Chu, Y.; Li, S.; Li, W.; Yan, X.; Ma, X.; Zhou, S.; Sun, H.; et al. UFLC-MS/MS determination and pharmacokinetic studies of six Saikosaponins in rat plasma after oral administration of Bupleurum Dropping Pills. J. Pharm. Biomed. Anal. 2016, 124, 288–293. [Google Scholar] [CrossRef] [PubMed]
- Xu, C.H.; Wang, P.; Wang, Y.; Yang, Y.; Li, D.H.; Li, H.F.; Sun, S.Q.; Wu, X.Z. Pharmacolcinetic comparisons of two different combinations of Shaoyao-Gancao Decoction in rats: Competing mechanisms between paeoniflorin and glycyrrhetinic acid. J. Ethnopharmacol. 2013, 149, 443–452. [Google Scholar] [CrossRef] [PubMed]
- Chen, Z.J.; Zheng, S.R.; Li, L.P.; Jiang, H.D. Metabolism of flavonoids in human: A comprehensive review. Curr. Drug Metab. 2014, 15, 48–61. [Google Scholar] [CrossRef] [PubMed]
Sample Availability: Samples of the compounds and herbs are available from the authors. |


| Analytes | Regression Equation | Correlation Coefficient (r2) | Linear Range (ng/mL) | LLOQ (ng/mL) |
|---|---|---|---|---|
| Albiflorin | y = 8.9467x + 43.276 | 0.9996 | 0.46–480 | 0.46 |
| Paeoniflorin | y = 2.8358x + 51.224 | 0.9999 | 1.02–1080 | 1.02 |
| Ferulic acid | y = 1.6548x + 0.5608 | 0.9989 | 2.08–1100 | 2.08 |
| Senkyunolide I | y = 3.4788x − 1.5320 | 0.9997 | 2.70–1150 | 2.70 |
| Quercetin | y = 1.9983x + 8.4101 | 0.9974 | 2.15–1085 | 2.15 |
| Isoliquiritigenin | y = 44.035x + 25.188 | 0.9993 | 0.54–485 | 0.54 |
| Atractylenolide III | y = 30.767x − 9.5428 | 0.9999 | 1.05–1105 | 1.05 |
| Ligustilide | y = 2.3836x + 33.177 | 0.9989 | 1.44–1050 | 1.44 |
| Atractylenolide II | y = 20.035x + 48.474 | 0.9990 | 0.51–480 | 0.51 |
| Liquiritin | y = 17.470x + 52.527 | 0.9995 | 0.53–495 | 0.53 |
| Liquiritigenin | y = 0.3824x + 5.4505 | 0.9993 | 1.13–1050 | 1.13 |
| Saikosaponin c | y = 38.923x + 39.843 | 0.9988 | 0.48–510 | 0.48 |
| Glycyrrhizic acid | y = 47.474x + 24.225 | 0.9994 | 0.96–1120 | 0.96 |
| Saikosaponin a | y = 39.303x + 37.598 | 0.9990 | 0.49–510 | 0.49 |
| Analytes | Normal Concentration (ng/mL) | Intra-Day | Inter-Day | ||||
|---|---|---|---|---|---|---|---|
| Concentration Measured (ng/mL) | Precision (RSD%) | Accuracy (%) | Concentration Measured (ng/mL) | Precision (RSD%) | Accuracy (%) | ||
| Albiflorin | 3.8 | 3.86 ± 0.17 | 4.38 | 101.67 | 3.66 ± 0.22 | 6.06 | 96.18 |
| 38.0 | 36.66 ± 2.77 | 7.55 | 96.48 | 39.20 ± 2.23 | 5.70 | 103.16 | |
| 380.0 | 385.32 ± 23.40 | 6.07 | 101.40 | 388.22 ± 15.25 | 3.93 | 102.16 | |
| Paeoniflorin | 5.1 | 4.66 ± 0.39 | 8.33 | 91.34 | 4.94 ± 0.25 | 4.98 | 96.76 |
| 510.0 | 495.77 ± 6.01 | 1.21 | 97.21 | 491.59 ± 17.60 | 3.58 | 96.39 | |
| 1020.0 | 1032.32 ± 36.04 | 3.49 | 101.21 | 1065.80 ± 70.41 | 6.61 | 104.49 | |
| Ferulic acid | 5.1 | 5.10 ± 0.15 | 2.89 | 100.96 | 5.11 ± 0.13 | 2.60 | 101.22 |
| 505.0 | 502.84 ± 29.69 | 5.90 | 99.57 | 486.81 ± 15.09 | 3.10 | 96.40 | |
| 1010.0 | 1037.86 ± 84.16 | 8.11 | 102.76 | 1039.58 ± 102.41 | 9.85 | 102.93 | |
| Senkyunolide I | 4.2 | 4.13 ± 0.16 | 3.94 | 98.21 | 4.08 ± 0.19 | 4.65 | 97.02 |
| 42.0 | 39.15 ± 2.50 | 6.39 | 93.21 | 42.49 ± 2.41 | 5.67 | 101.17 | |
| 840.0 | 778.87 ± 46.41 | 5.96 | 92.72 | 846.56 ± 35.76 | 4.22 | 100.78 | |
| Quercetin | 5.0 | 4.95 ± 0.15 | 2.98 | 98.15 | 4.94 ± 0.13 | 2.62 | 98.05 |
| 504.0 | 474.88 ± 41.79 | 8.80 | 94.22 | 494.74 ± 11.51 | 2.33 | 98.16 | |
| 1008.0 | 1005.27 ± 43.45 | 4.32 | 99.73 | 980.91 ± 26.41 | 2.69 | 97.31 | |
| Isoliquiritigenin | 3.8 | 3.71 ± 0.18 | 4.98 | 98.89 | 3.46 ± 0.16 | 4.55 | 92.31 |
| 37.5 | 39.22 ± 1.65 | 4.21 | 104.59 | 39.25 ± 2.02 | 5.14 | 104.66 | |
| 375.0 | 370.56 ± 43.39 | 11.71 | 98.82 | 390.86 ± 16.99 | 4.35 | 104.23 | |
| Atractylenolide III | 4.5 | 4.19 ± 0.25 | 5.93 | 93.19 | 4.23 ± 0.41 | 9.73 | 93.89 |
| 90.0 | 93.92 ± 9.80 | 10.43 | 104.35 | 95.97 ± 3.44 | 3.58 | 106.64 | |
| 900.0 | 958.69 ± 59.32 | 6.19 | 106.52 | 931.56 ± 48.21 | 5.18 | 103.51 | |
| Ligustilide | 5.2 | 4.94 ± 0.15 | 3.06 | 95.03 | 4.86 ± 0.56 | 11.55 | 93.40 |
| 104.0 | 94.37 ± 8.39 | 8.89 | 90.74 | 96.37 ± 4.44 | 4.60 | 92.66 | |
| 1040.0 | 940.05 ± 67.12 | 7.14 | 90.39 | 973.42 ± 57.66 | 5.92 | 93.60 | |
| Atractylenolide II | 2.4 | 2.33 ± 0.14 | 5.91 | 97.01 | 2.24 ± 0.08 | 3.42 | 93.19 |
| 48.0 | 47.12 ± 1.55 | 3.29 | 98.17 | 49.78 ± 1.92 | 3.87 | 103.70 | |
| 480.0 | 469.78 ± 33.54 | 7.14 | 97.87 | 458.48 ± 24.18 | 5.27 | 95.52 | |
| Liquiritin | 2.1 | 1.94 ± 0.09 | 4.48 | 94.72 | 2.01 ± 0.11 | 5.39 | 98.21 |
| 41.0 | 39.30 ± 1.56 | 3.96 | 95.85 | 40.67 ± 3.16 | 7.76 | 99.19 | |
| 410.0 | 383.02 ± 28.28 | 7.38 | 93.42 | 391.23 ± 20.06 | 5.13 | 95.42 | |
| Liquiritigenin | 4.5 | 4.20 ± 0.28 | 6.79 | 93.26 | 4.05 ± 0.28 | 6.96 | 89.93 |
| 90.0 | 93.48 ± 5.16 | 5.52 | 103.87 | 93.71 ± 2.87 | 3.06 | 104.12 | |
| 900.0 | 952.35 ± 52.75 | 5.54 | 105.82 | 959.66 ± 71.44 | 7.44 | 106.63 | |
| Saikosaponin c | 1.2 | 1.16 ± 0.06 | 5.58 | 96.25 | 1.21 ± 0.06 | 5.02 | 101.11 |
| 24.0 | 22.33 ± 2.09 | 9.37 | 93.02 | 23.34 ± 2.08 | 8.89 | 97.26 | |
| 480.0 | 504.04 ± 11.29 | 2.24 | 105.01 | 493.36 ± 13.73 | 2.78 | 102.78 | |
| Glycyrrhizic acid | 4.6 | 4.24 ± 0.34 | 8.03 | 92.25 | 4.32 ± 0.30 | 6.90 | 93.91 |
| 460.0 | 430.82 ± 24.47 | 5.68 | 93.66 | 434.50 ± 27.53 | 6.34 | 94.46 | |
| 920.0 | 910.12 ± 33.66 | 3.70 | 98.93 | 935.77 ± 22.66 | 2.42 | 101.71 | |
| Saikosaponin a | 1.3 | 1.20 ± 0.06 | 5.20 | 94.23 | 1.17 ± 0.07 | 5.96 | 91.99 |
| 25.5 | 26.78 ± 1.18 | 4.42 | 105.01 | 23.51 ± 2.00 | 8.51 | 92.18 | |
| 510.0 | 491.71 ± 14.57 | 2.96 | 96.41 | 496.81 ± 15.44 | 3.11 | 97.41 |
| Analyte | Normal Concentration (ng/mL) | Extraction Recovery (%) | Matrix Effect (%) |
|---|---|---|---|
| Albiflorin | 3.8 | 101.11 ± 2.90 | 95.28 ± 4.49 |
| 38 | 101.49 ± 4.99 | 93.33 ± 2.71 | |
| 380 | 95.48 ± 6.14 | 93.81 ± 4.46 | |
| Paeoniflorin | 5.1 | 94.74 ± 4.63 | 92.58 ± 3.26 |
| 510 | 101.03 ± 5.86 | 95.36 ± 4.47 | |
| 1020 | 94.73 ± 5.98 | 94.54 ± 3.24 | |
| Ferulic acid | 5.1 | 94.23 ± 5.33 | 91.89 ± 4.10 |
| 505 | 96.97 ± 3.00 | 86.75 ± 2.97 | |
| 1010 | 99.97 ± 5.06 | 98.31 ± 5.77 | |
| Senkyunolide I | 4.2 | 105.77 ± 6.42 | 97.43 ± 4.98 |
| 42 | 103.25 ± 3.04 | 93.14 ± 3.80 | |
| 840 | 109.75 ± 7.55 | 97.42 ± 5.82 | |
| Quercetin | 5 | 88.84 ± 2.40 | 88.56 ± 2.23 |
| 504 | 88.58 ± 3.61 | 95.25 ± 6.04 | |
| 1008 | 88.58 ± 3.61 | 86.95 ± 3.81 | |
| Isoliquiritigenin | 3.8 | 95.24 ± 6.57 | 94.24 ± 6.16 |
| 37.5 | 103.67 ± 5.20 | 97.77 ± 2.90 | |
| 375 | 97.68 ± 7.33 | 94.35 ± 3.53 | |
| Atractylenolide III | 4.5 | 94.92 ± 7.83 | 91.59 ± 6.30 |
| 90 | 87.21 ± 4.50 | 88.21 ± 3.10 | |
| 900 | 95.53 ± 7.38 | 95.77 ± 7.23 | |
| Ligustilide | 5.2 | 87.68 ± 5.09 | 87.01 ± 3.67 |
| 104 | 85.53 ± 3.58 | 85.79 ± 3.37 | |
| 1040 | 85.48 ± 3.99 | 86.81 ± 3.42 | |
| Atractylenolide II | 2.4 | 101.48 ± 7.06 | 98.42 ± 5.00 |
| 48 | 99.79 ± 3.81 | 94.96 ± 7.54 | |
| 480 | 103.41 ± 7.25 | 98.41 ± 3.62 | |
| Liquiritin | 2.1 | 107.64 ± 7.48 | 98.62 ± 4.87 |
| 41 | 104.79 ± 2.57 | 94.62 ± 5.85 | |
| 410 | 111.77 ± 2.80 | 102.69 ± 7.25 | |
| Liquiritigenin | 4.5 | 87.65 ± 4.41 | 87.32 ± 4.43 |
| 90 | 99.49 ± 7.97 | 99.49 ± 7.97 | |
| 900 | 99.49 ± 7.97 | 94.66 ± 4.64 | |
| Saikosaponin c | 1.2 | 100.43 ± 6.77 | 92.73 ± 3.79 |
| 24 | 99.35 ± 7.45 | 93.85 ± 3.95 | |
| 480 | 95.81 ± 8.53 | 95.81 ± 8.53 | |
| Glycyrrhizic acid | 4.6 | 82.33 ± 2.97 | 85.17 ± 4.42 |
| 460 | 85.67 ± 2.67 | 87.47 ± 2.05 | |
| 920 | 85.18 ± 3.17 | 86.52 ± 4.03 | |
| Saikosaponin a | 1.3 | 93.02 ± 6.79 | 92.69 ± 6.93 |
| 25.5 | 88.10 ± 4.68 | 87.31 ± 4.75 | |
| 510 | 90.20 ± 6.28 | 91.13 ± 5.58 |
| Analytes | Spiked (ng/mL) | Auto-Sampler (4 °C, 36 h) | Long-Term (−20 °C, 30 Days) | Freeze-Thaw (−20 °C-Room Temperature) | |||
|---|---|---|---|---|---|---|---|
| Measured | RE (%) | Measured | RE (%) | Measured | RE (%) | ||
| Albiflorin | 3.80 | 3.91 ± 0.27 | 2.81 | 3.76 ± 0.50 | −1.18 | 3.65 ± 0.06 | −4.04 |
| 38.00 | 37.83 ± 2.50 | −0.45 | 38.87 ± 1.83 | 2.29 | 37.00 ± 2.32 | −2.64 | |
| 380.00 | 389.79 ± 11.12 | 2.58 | 386.55 ± 12.40 | 1.72 | 385.16 ± 23.24 | 1.36 | |
| Paeoniflorin | 5.10 | 5.02 ± 0.18 | −1.63 | 4.99 ± 0.07 | −2.19 | 5.01 ± 0.21 | −1.80 |
| 510.00 | 497.41 ± 11.78 | −2.47 | 501.59 ± 11.11 | −1.65 | 494.11 ± 8.68 | −3.12 | |
| 1020.00 | 1056.41 ± 30.28 | 3.57 | 1032.46 ± 35.15 | 1.22 | 1030.65 ± 34.59 | 1.04 | |
| Ferulic acid | 5.05 | 5.10 ± 0.06 | 0.92 | 5.10 ± 0.11 | 0.89 | 5.08 ± 0.11 | 0.66 |
| 505.00 | 481.27 ± 13.64 | −4.70 | 491.81 ± 7.89 | −2.61 | 486.01 ± 17.15 | −3.76 | |
| 1010.00 | 1000.91 ± 21.30 | −0.90 | 1006.25 ± 27.81 | −0.37 | 1016.19 ± 45.28 | 0.61 | |
| Senkyunolide I | 4.20 | 4.10 ± 0.13 | −2.46 | 4.09 ± 0.13 | −2.58 | 4.09 ± 0.09 | −2.58 |
| 42.00 | 41.50 ± 3.05 | −1.20 | 41.33 ± 3.09 | −1.60 | 41.13 ± 3.11 | −2.07 | |
| 840.00 | 834.09 ± 23.38 | −0.70 | 837.06 ± 26.59 | −0.35 | 824.21 ± 18.77 | −1.88 | |
| Quercetin | 5.04 | 4.95 ± 0.14 | −1.85 | 4.93 ± 0.13 | −2.28 | 4.94 ± 0.14 | −1.95 |
| 504.00 | 494.39 ± 10.55 | −1.91 | 493.07 ± 13.07 | −2.17 | 491.55 ± 18.55 | −2.47 | |
| 1008.00 | 990.24 ± 31.42 | −1.76 | 987.58 ± 36.41 | −2.03 | 986.94 ± 24.22 | −2.09 | |
| Isoliquiritigenin | 3.75 | 3.75 ± 0.16 | −0.13 | 3.71 ± 0.16 | −1.02 | 3.64 ± 0.34 | −2.89 |
| 37.50 | 37.85 ± 1.42 | 0.94 | 38.08 ± 1.50 | 1.55 | 37.39 ± 1.90 | −0.30 | |
| 375.00 | 371.62 ± 13.67 | −0.90 | 377.52 ± 13.03 | 0.67 | 364.56 ± 15.01 | −2.78 | |
| Atractylenolide III | 4.50 | 4.48 ± 0.16 | −0.37 | 4.41 ± 0.14 | −2.11 | 4.44 ± 0.15 | −1.26 |
| 90.00 | 91.66 ± 3.92 | 1.85 | 90.31 ± 2.21 | 0.34 | 92.25 ± 3.91 | 2.50 | |
| 900.00 | 920.70 ± 44.64 | 2.30 | 919.90 ± 34.37 | 2.21 | 925.35 ± 39.89 | 2.82 | |
| Ligustilide | 5.20 | 5.05 ± 0.13 | −2.82 | 5.02 ± 0.32 | −3.40 | 5.09 ± 0.15 | −2.08 |
| 104.00 | 101.10 ± 4.29 | −2.79 | 99.70 ± 3.76 | −4.14 | 102.04 ± 4.00 | −1.89 | |
| 1040.00 | 1023.55 ± 34.04 | −1.58 | 1028.42 ± 35.42 | −1.11 | 1023.38 ± 30.28 | −1.60 | |
| Atractylenolide II | 2.40 | 2.37 ± 0.27 | −1.25 | 2.49 ± 0.31 | 3.61 | 2.36 ± 0.10 | −1.60 |
| 48.00 | 46.05 ± 4.17 | −4.06 | 48.45 ± 6.78 | 0.93 | 47.29 ± 1.81 | −1.48 | |
| 480.00 | 478.79 ± 24.29 | −0.25 | 465.14 ± 15.69 | −3.10 | 478.11 ± 25.41 | −0.39 | |
| Liquiritin | 2.05 | 1.96 ± 0.06 | −4.39 | 1.96 ± 0.06 | −4.23 | 1.99 ± 0.07 | −2.85 |
| 41.00 | 40.59 ± 1.99 | −1.01 | 40.50 ± 2.82 | −1.22 | 39.80 ± 1.92 | −2.93 | |
| 410.00 | 409.01 ± 8.13 | −0.24 | 407.90 ± 9.65 | −0.51 | 409.52 ± 11.42 | −0.12 | |
| Liquiritigenin | 4.50 | 4.50 ± 0.12 | −0.07 | 4.35 ± 0.26 | −3.41 | 4.41 ± 0.10 | −1.93 |
| 90.00 | 90.20 ± 3.79 | 0.22 | 89.87 ± 3.18 | −0.14 | 91.81 ± 3.04 | 2.01 | |
| 900.00 | 910.32 ± 16.62 | 1.15 | 919.66 ± 9.21 | 2.18 | 912.35 ± 24.55 | 1.37 | |
| Saikosaponin c | 1.20 | 1.15 ± 0.14 | −4.03 | 1.20 ± 0.09 | −0.28 | 1.19 ± 0.18 | −1.11 |
| 24.00 | 23.48 ± 1.37 | −2.15 | 24.01 ± 2.90 | 0.04 | 23.49 ± 2.06 | −2.12 | |
| 480.00 | 492.33 ± 8.81 | 2.57 | 491.69 ± 4.90 | 2.44 | 491.04 ± 9.82 | 2.30 | |
| Glycyrrhizic acid | 4.60 | 4.62 ± 0.25 | 0.43 | 4.57 ± 0.19 | −0.65 | 4.54 ± 0.25 | −1.23 |
| 460.00 | 459.19 ± 22.29 | −0.18 | 462.84 ± 28.06 | 0.62 | 447.49 ± 23.22 | −2.72 | |
| 920.00 | 920.55 ± 40.71 | 0.06 | 930.77 ± 22.18 | 1.17 | 910.12 ± 33.66 | −1.07 | |
| Saikosaponin a | 1.27 | 1.32 ± 0.04 | 3.54 | 1.27 ± 0.09 | −0.13 | 1.26 ± 0.10 | −1.05 |
| 25.50 | 27.40 ± 3.34 | 7.45 | 25.17 ± 3.20 | −1.29 | 26.19 ± 3.61 | 2.72 | |
| 510.00 | 501.35 ± 16.88 | −1.70 | 508.81 ± 8.83 | −0.23 | 486.71 ± 15.18 | −4.57 | |
| Analytes | Parameters | |||||||
|---|---|---|---|---|---|---|---|---|
| tmax (h) | Cmax (ng/mL) | Kel | t1/2 (h) | AUC0–t (ng h/mL) | AUC0–∞ (ng h/mL) | MRT0–t (h) | MRT0–∞ (h) | |
| Albiflorin | 0.39 ± 0.09 | 58.28 ± 27.50 | 0.13 ± 0.06 | 7.11 ± 4.57 | 127.67 ± 64.94 | 135.02 ± 65.64 | 4.18 ± 1.58 | 6.34 ± 4.50 |
| Paeoniflorin | 0.42 ± 0.09 | 586.92 ± 180.66 | 0.16 ± 0.06 | 4.82 ± 1.71 | 696.90 ± 210.89 | 717.61 ± 227.27 | 4.17 ± 1.38 | 4.91 ± 1.68 |
| Ferulic acid | 0.21 ± 0.10 | 632.47 ± 244.04 | 0.15 ± 0.05 | 5.30 ± 1.85 | 1584.14 ± 850.88 | 1611.48 ± 852.75 | 3.97 ± 0.80 | 4.66 ± 0.52 |
| Senkyunolide I | 0.36 ± 0.13 | 403.26 ± 201.00 | 0.18 ± 0.07 | 4.75 ± 2.78 | 1582.38 ± 985.86 | 1616.46 ± 967.01 | 5.31 ± 0.72 | 6.37 ± 2.39 |
| Quercetin | 0.10 ± 0.03 | 491.43 ± 167.80 | 0.19 ± 0.07 | 4.09 ± 1.24 | 766.28 ± 410.22 | 781.69 ± 415.12 | 6.40 ± 0.85 | 7.03 ± 1.02 |
| Isoliquiritigenin | 0.39 ± 0.09 | 33.58 ± 9.37 | 0.17 ± 0.12 | 5.82 ± 3.25 | 156.61 ± 76.73 | 185.17 ± 89.88 | 5.98 ± 1.50 | 7.81 ± 3.39 |
| Atractylenolide III | 0.67 ± 0.26 | 229.66 ± 107.94 | 0.11 ± 0.05 | 6.95 ± 2.65 | 1044.70 ± 496.68 | 1125.88 ± 487.04 | 6.23 ± 1.55 | 8.60 ± 3.13 |
| Ligustilide | 0.31 ± 0.13 | 64.97 ± 42.21 | 0.17 ± 0.10 | 5.44 ± 3.09 | 194.11 ± 57.72 | 207.32 ± 58.47 | 5.63 ± 2.32 | 7.47 ± 4.23 |
| Atractylenolide II | 0.64 ± 0.29 | 22.48 ± 8.04 | 0.21 ± 0.07 | 3.54 ± 1.21 | 69.53 ± 25.72 | 70.15 ± 25.63 | 4.15 ± 0.82 | 4.43 ± 0.98 |
| Liquiritin | 0.39 ± 0.09 | 57.93 ± 36.64 | 0.09 ± 0.04 | 9.32 ± 5.49 | 163.02 ± 91.45 | 180.94 ± 90.94 | 5.70 ± 1.25 | 10.17 ± 6.79 |
| Liquiritigenin | 0.19 ± 0.07 | 33.17 ± 11.99 | 0.12 ± 0.06 | 6.43 ± 2.42 | 286.43 ± 144.06 | 328.43 ± 198.16 | 8.85 ± 1.09 | 11.49 ± 3.02 |
| Saikosaponin c | 0.42 ± 0.09 | 0.96 ± 0.33 | 0.22 ± 0.11 | 4.23 ± 2.83 | 5.61 ± 1.92 | 5.93 ± 2.19 | 6.49 ± 1.17 | 7.67 ± 2.70 |
| Glycyrrhizic acid | 0.33 ± 0.11 | 18.65 ± 6.61 | 0.12 ± 0.05 | 7.63 ± 5.35 | 138.46 ± 56.98 | 156.17 ± 59.56 | 10.06 ± 0.58 | 13.61 ± 5.72 |
| Saikosaponin a | 0.42 ± 0.09 | 6.05 ± 1.30 | 0.12 ± 0.03 | 6.46 ± 2.57 | 16.26 ± 5.15 | 18.00 ± 6.88 | 6.61 ± 1.12 | 8.88 ± 3.49 |
| Analytes | CAS No. | Retention Time (min) | Precursor Ion Species | MRM Transitions Precursor Ion → Product Ion (m/z) | Cone Voltage (V) | Collision Energy (eV) |
|---|---|---|---|---|---|---|
| Albiflorin | 39011-90-0 | 2.94 | 481.50 [M + H]+ | 481.50 → 104.90 | 10.00 | 20.00 |
| Paeoniflorin | 23180-57-6 | 3.23 | 497.90 [M + NH3]+ | 497.90 → 178.90 | 25.00 | 30.00 |
| Ferulic acid | 1135-24-6 | 3.57 | 195.00 [M + H]+ | 195.00 → 145.00 | 25.00 | 20.00 |
| Senkyunolide I | 94596-28-8 | 4.97 | 225.10 [M + H]+ | 225.10 → 207.00 | 10.00 | 20.00 |
| Quercetin | 117-39-5 | 5.10 | 303.20 [M + H]+ | 303.20 → 153.10 | 30.00 | 35.00 |
| Isoliquiritigenin | 961-29-5 | 7.23 | 257.00 [M + H]+ | 257.00 → 136.80 | 25.00 | 25.00 |
| Atractylenolide III | 73030-71-4 | 9.22 | 249.00 [M + H]+ | 249.00 → 231.00 | 15.00 | 10.00 |
| Ligustilide | 81944-09-4 | 10.22 | 191.20 [M + H]+ | 191.20 → 90.93 | 35.00 | 20.00 |
| Atractylenolide II | 73069-14-4 | 10.82 | 233.30 [M + H]+ | 233.30 → 91.00 | 25.00 | 30.00 |
| Liquiritin | 551-15-5 | 3.76 | 417.00 [M − H]− | 417.00 → 255.00 | 35.00 | 20.00 |
| Liquiritigenin | 578-86-9 | 5.30 | 255.00 [M − H]− | 255.00 → 135.00 | 25.00 | 30.00 |
| Saikosaponin c | 20736-08-7 | 7.55 | 971.60 [M + COOH]− | 971.60 → 925.50 | 35.00 | 25.00 |
| Glycyrrhizic acid | 1405-86-3 | 8.14 | 821.00 [M − H]− | 821.00 → 351.00 | 40.00 | 40.00 |
| Saikosaponin a | 20736-09-8 | 8.76 | 825.40 [M + COOH]− | 825.40 → 779.60 | 35.00 | 45.00 |
| Naringenin | 480-41-1 | 4.43 | 273.10 [M + H]+ | 273.10 → 153.10 | 30.00 | 25.00 |
| Naringenin | 480-41-1 | 4.46 | 271.10 [M − H]− | 271.10 → 151.10 | 30.00 | 25.00 |
© 2018 by the authors. Licensee MDPI, Basel, Switzerland. This article is an open access article distributed under the terms and conditions of the Creative Commons Attribution (CC BY) license (http://creativecommons.org/licenses/by/4.0/).
Share and Cite
Xu, M.; Xu, Z.; Xu, Q.; Zhang, H.; Liu, M.; Geng, F.; Zhang, N. UPLC-MS/MS Method for the Determination of 14 Compounds in Rat Plasma and Its Application in a Pharmacokinetic Study of Orally Administered Xiaoyao Powder. Molecules 2018, 23, 2514. https://doi.org/10.3390/molecules23102514
Xu M, Xu Z, Xu Q, Zhang H, Liu M, Geng F, Zhang N. UPLC-MS/MS Method for the Determination of 14 Compounds in Rat Plasma and Its Application in a Pharmacokinetic Study of Orally Administered Xiaoyao Powder. Molecules. 2018; 23(10):2514. https://doi.org/10.3390/molecules23102514
Chicago/Turabian StyleXu, Mingyue, Zhanling Xu, Qingxuan Xu, Hongyue Zhang, Mingyang Liu, Fang Geng, and Ning Zhang. 2018. "UPLC-MS/MS Method for the Determination of 14 Compounds in Rat Plasma and Its Application in a Pharmacokinetic Study of Orally Administered Xiaoyao Powder" Molecules 23, no. 10: 2514. https://doi.org/10.3390/molecules23102514