Next Article in Journal
Essential Oils from Humulus Lupulus scCO2 Extract by Hydrodistillation and Microwave-Assisted Hydrodistillation
Next Article in Special Issue
Correction: Fujiki, M., et al. Questions of Mirror Symmetry at the Photoexcited and Ground States of Non-Rigid Luminophores Raised by Circularly Polarized Luminescence and Circular Dichroism Spectroscopy: Part 1. Oligofluorenes, Oligophenylenes, Binaphthyls and Fused Aromatics. Molecules, 2018, 23, 2606
Article

Sample Volume Reduction Using the Schwarzschild Objective for a Circular Dichroism Spectrophotometer and an Application to the Structural Analysis of Lysine-36 Trimethylated Histone H3 Protein

Hiroshima Synchrotron Radiation Center, Hiroshima University, 2-313 Kagamiyama, Higashi-Hiroshima, Hiroshima 739-0046, Japan
*
Author to whom correspondence should be addressed.
Molecules 2018, 23(11), 2865; https://doi.org/10.3390/molecules23112865
Submission received: 30 August 2018 / Revised: 31 October 2018 / Accepted: 1 November 2018 / Published: 2 November 2018
(This article belongs to the Special Issue Recent Advances in Chiroptical Spectroscopy)

Abstract

:
With the increasing interest in scarce proteins, reducing the sample volume for circular dichroism (CD) spectroscopy has become desirable. Demagnification of the incident beam size is required to reduce the sample volume for CD spectroscopy detecting transmitted light passed through the sample. In this study, the beam size was demagnified using a focal mirror, and small-capacity sample cells were developed in an attempt to reduce the sample volume. The original beam size was 6 × 6 mm2; we successfully converged it to a size of 25 × 25 μm2 using the Schwarzschild objective (SO). The new sample cell and SO allowed the required sample volume to be reduced to 1/10 (15 → 1.5 μL), when using a 15 μm path length cell. By adopting a smaller sample cell, further sample reduction could be achieved. By using the SO system, the secondary structural contents of the lysine-36 trimethylated histone H3 protein were analyzed. The trimethylation induced the increment of helix structures and decrement of unordered structures. These structural alterations may play a role in regulating cellular function(s), such as DNA damage repair processes.

1. Introduction

Circular dichroism (CD) spectroscopy in the ultraviolet (UV) region is widely used for the secondary structural analysis of proteins in an aqueous solution. Although the structural information from CD spectra is limited compared with that from X-ray crystallography and nuclear magnetic resonance (NMR), both of which display three-dimensional structures with atomic-level resolutions, CD spectroscopy is a powerful tool because it can more easily provide structural information, including the structural dynamics, because of some notable advantages: (i) the required sample amount is smaller (1–10% of those needed for X-ray crystallography and NMR [1]) and (ii) the samples can be easily prepared by simply dissolving the proteins in a solvent. Neither crystallization nor isotopic substitution is required. Therefore, the loss of the samples and accidental denaturations during sample preparation are negligible in most cases.
The use of synchrotron radiation (SR) as a light source for CD spectroscopy allows more precise structural information to be obtained, because an SR beam can expand the measurement region to the vacuum-ultraviolet (VUV) region where additional CD peaks are often observed. Indeed, synchrotron radiation circular dichroism (SRCD) spectroscopy has produced successful outcomes over the past two decades [2]. It has also become desirable to reduce the sample volume with the increasing interest in scarce proteins that are difficult to synthesize.
Although the sample volume could be reduced using small-capacity cuvettes, this is insufficient in most cases of CD spectroscopy. Most commercial and SR-based CD spectrophotometers adopt a so-called “transmission method”, i.e., they detect transmitted light passed through the sample and provide CD spectra. In this case, the required sample volume largely depends on the size of the incident beam because the sample area must be larger than the beam size for the whole beam to pass through the sample. Therefore, most CD spectrophotometers require beam-size demagnification and cuvette capacity reduction.
One of the better ways to demagnify the beam size is using lenses and/or mirrors to focus the beam. Indeed, some groups have succeeded in measuring CD spectra using focal beams (although their motivations were different from that of this study). For example, Kane et al. focused the beam on a spot size of 20 × 60 μm2 using a focal lens and succeeded in measuring the CD spectra of a cytochrome c protein using a micro flow channel of 200–250 nm at the German SR facility BESSY II [3]. Yamada et al. developed a circularly polarizing microscope using the Schwarzschild objective (SO), combined with a convex mirror and polarizing undulator, at the Japanese SR facility TERAS. They achieved a sub-micron beam (0.66 μm at wavelength 200 nm) and obtained a CD image of a d-10-camphorsulfonic acid film on a copper grid [4]. For CD spectroscopy, the focusing systems must conserve the polarization degree, and chromatic aberrations must be eliminated in the wide wavelength range. The use of focal lenses is generally not enough to eliminate aberrations for wide-range CD measurements in the UV region to the VUV region. However, according to Yamada’s complicated system, it seems that the chromatic aberration due to the SO systems is negligible or small. Thus, for this study, the SO was installed on a VUV-CD spectrophotometer, which uses the SR light of beamline BL-12 [5] of the Hiroshima Synchrotron Radiation Center (HiSOR), to demagnify the incident beam size. Small-capacity sample cells were also developed. As a result, the sample volume for CD spectroscopy was successfully reduced using the SO and cells. In addition, a CD spectrum of a scarce protein, lysine-36 trimethylated histone H3 protein (H3K36me3), was measured using the same system, and its secondary structural contents were analyzed.
In the next section, the performance of the new VUV-CD spectrophotometer measurement system and the application of this system to the structural analysis of H3K36me3 are reported.

2. Results and Discussion

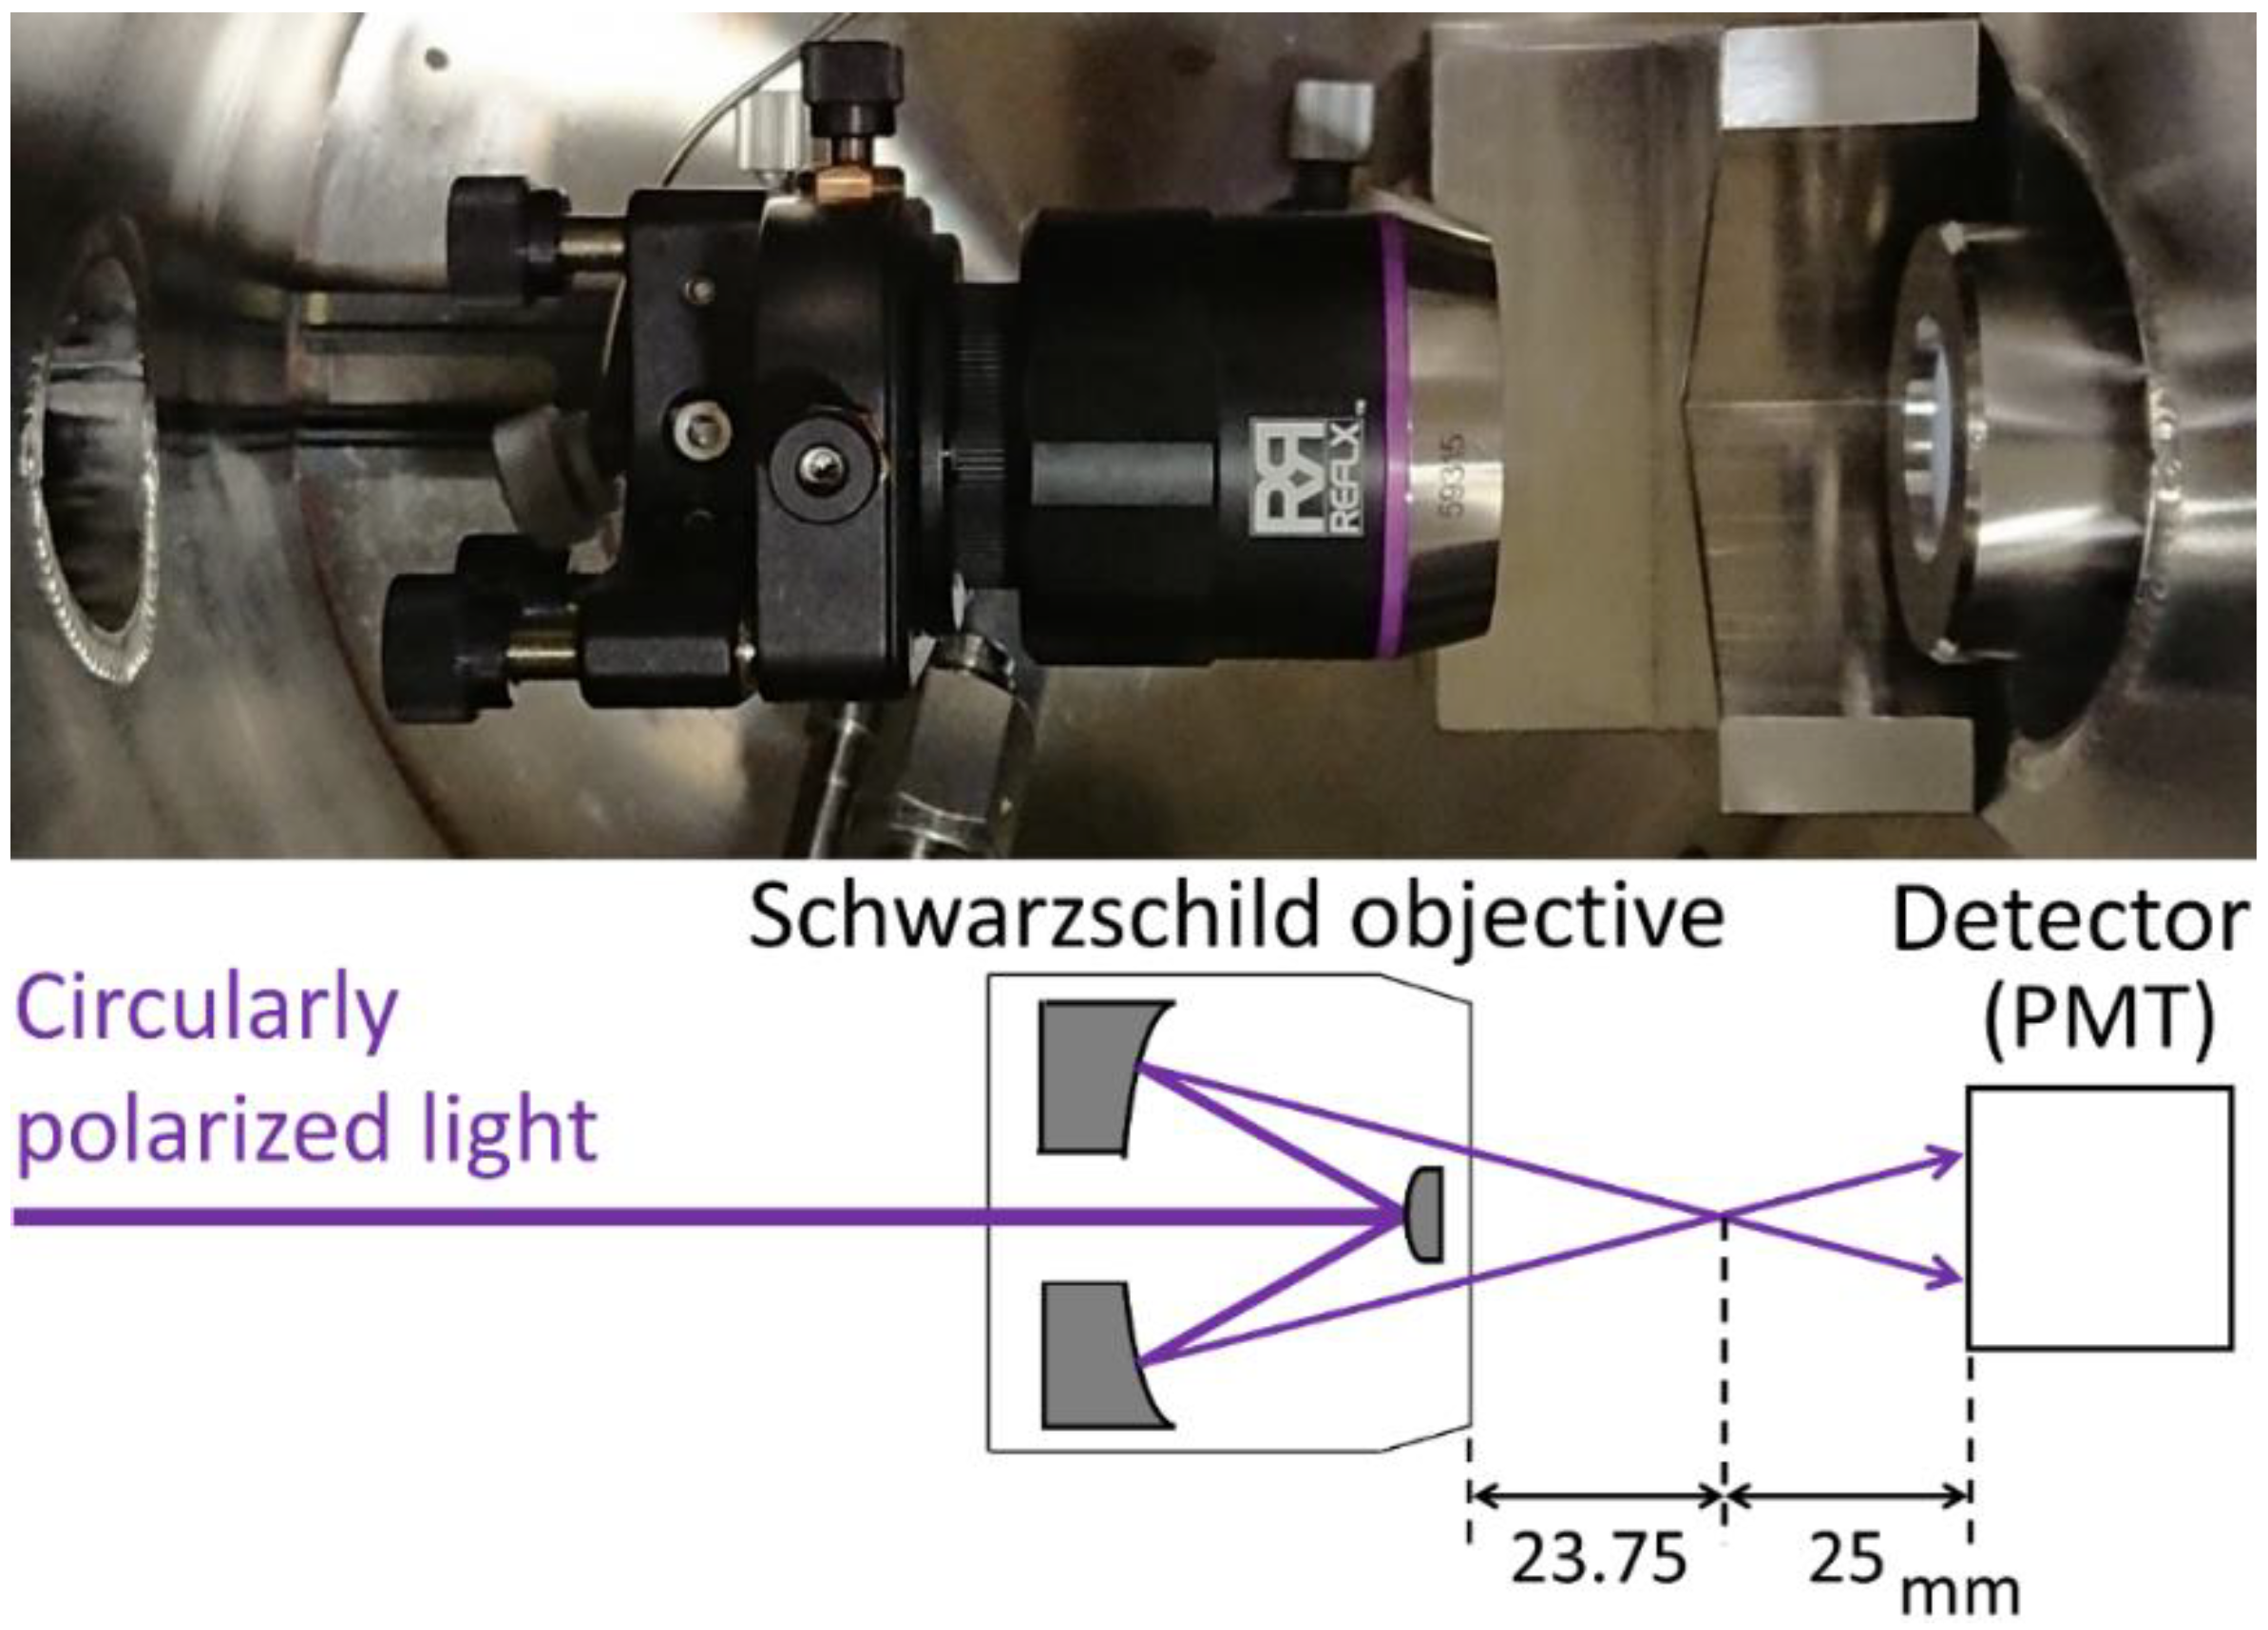
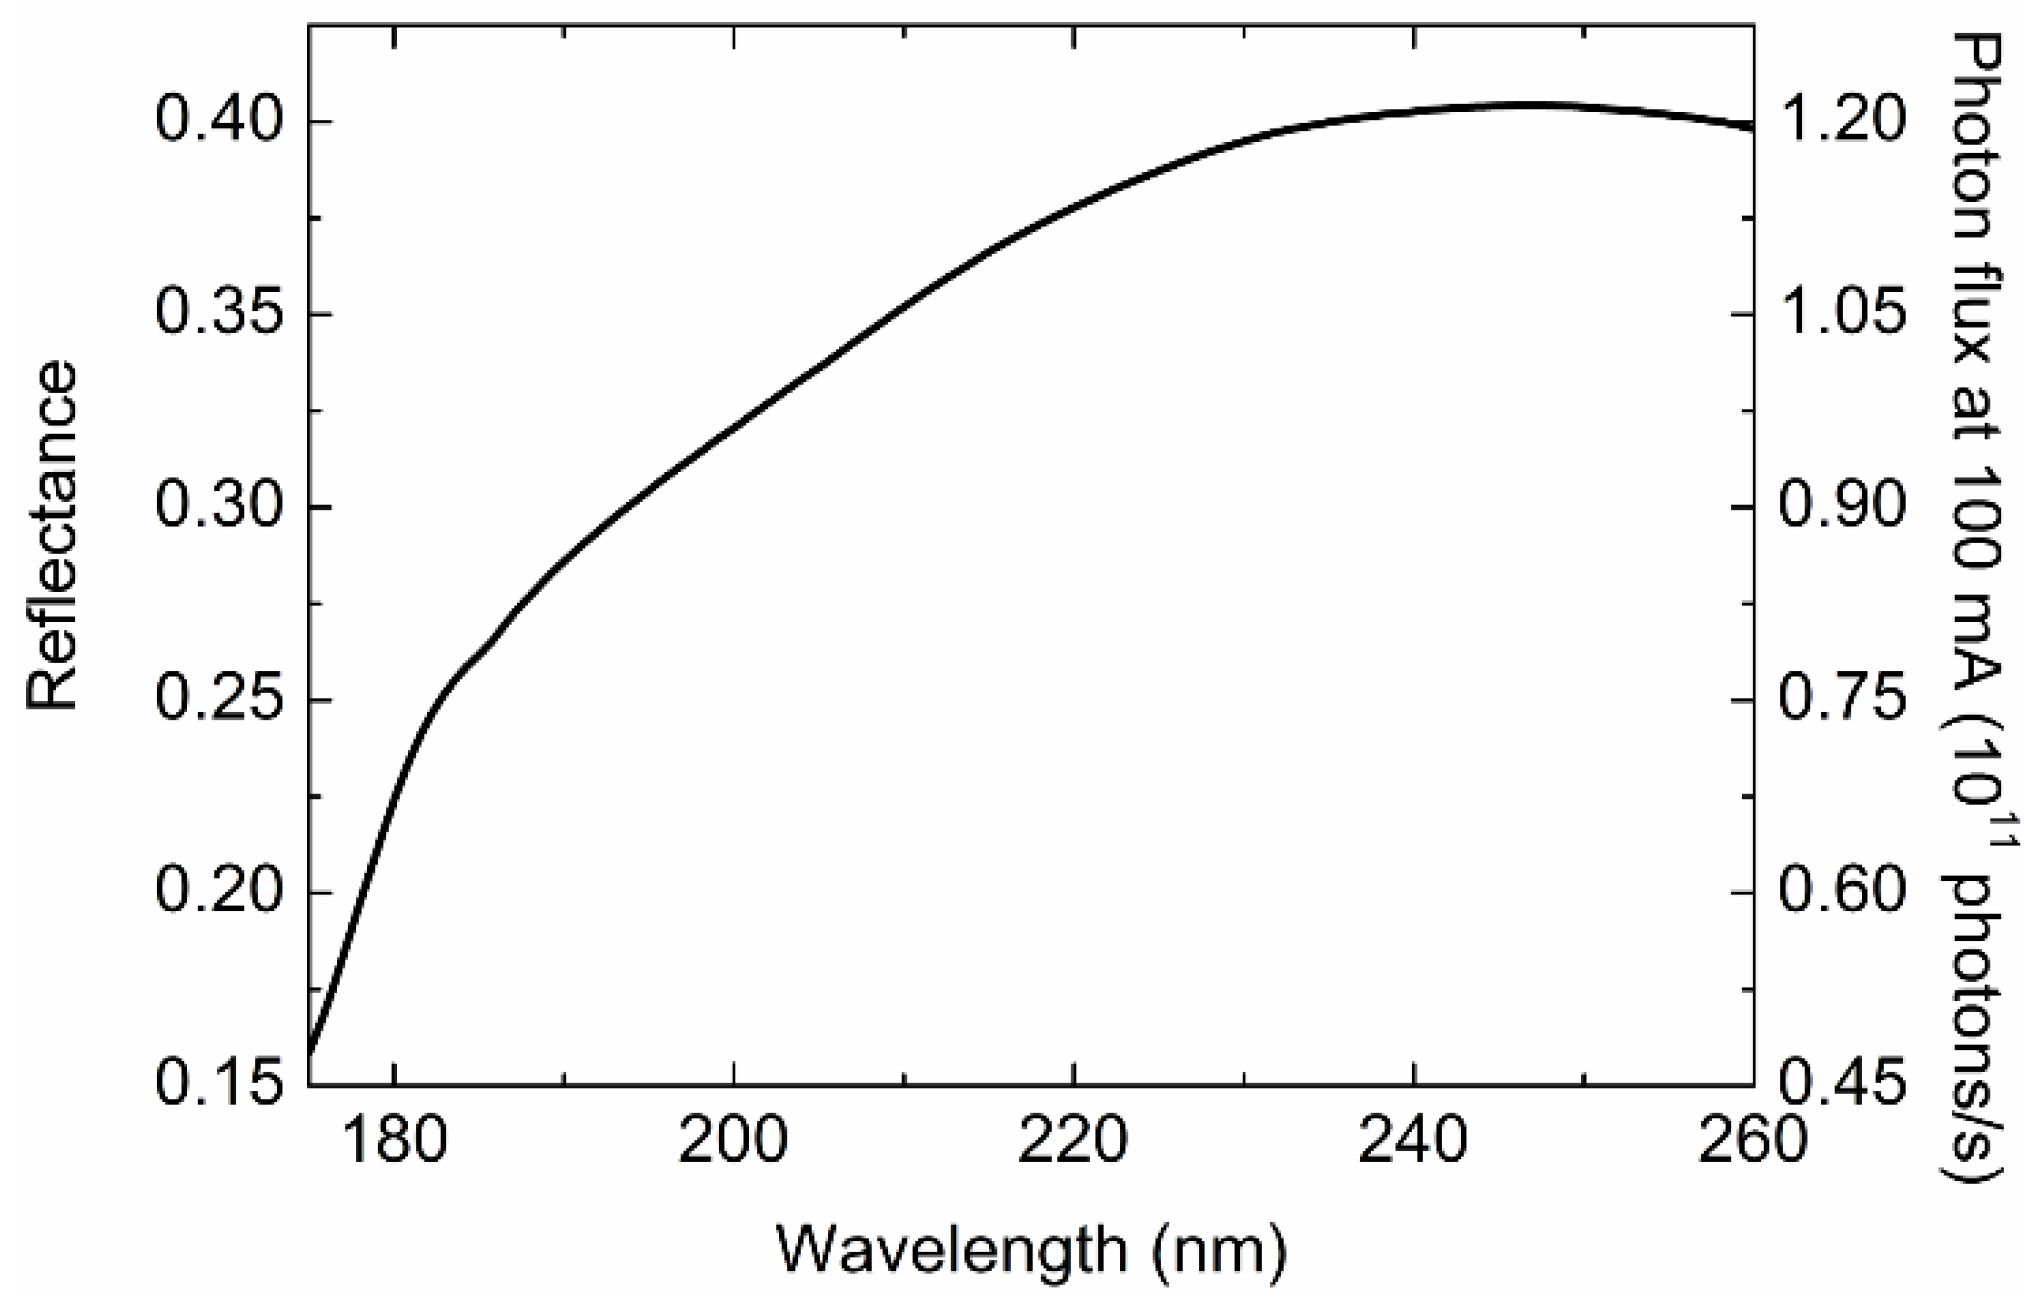
2.1. Beam Focusing by the SO

The SO (Infinite Conjugate, DUV Coated, 15X/0.28NA, ReflX Objective; Edmund Optics, Barrington, NJ, USA), which had a working distance of 23.75 mm, was installed in front of the detector (photomultiplier tube: PMT) (Figure 1). Since the SO consisted of two spherical mirrors with coincident curvature centers, the incident beam was reflected twice and then focused. After that, the beam spread out for the detector. The position of the SO was precisely adjusted using a mechanical mount (5-axis kinematic mount; Thorlabs, Newton, NJ, USA) as the beam passed through the center of the sample and detector. The distance between the focal position and the detector was about 25 mm.
The light intensity of the focal unmonochromatized SR beam against the horizontal and vertical directions was measured by the PMT (R6836; Hamamatsu Photonics, Shizuoka, Japan) using a knife-edge method, and the data were fitted by the Lorentz function, as shown in Figure 2. The overall spot size was ca. 25 × 25 μm2 at the focal position, and the full width at half-maximum of the beam intensities was 1.9 μm (horizontal) and 2.7 μm (vertical), indicating that the effective spot size would be much smaller than 25 × 25 μm2. The spot size without the SO was ca. 6 × 6 mm2, and thus it can be observed that the size was reduced down to 1/240 or less.
Figure 3 shows the reflectance of the SO in the wavelength region of 175–260 nm. The beam intensity was reduced down to 16–40% owing, presumably, to the bi-reflection in the SO system. The photon flux after the SO (Figure 3) was smaller than that of most of the other SRCD beamlines [6,7]. Nevertheless, the beam intensity was enough to measure the CD spectra, as shown in Section 2.4 and Section 2.5. The intensity of the focal beam would be improved by using optimized mirrors with high reflectance in the UV–VUV region.

2.2. Determination of the Sample Position

Although the sample should be set at the focal position to reduce the required sample volume, great care should be taken regarding the radiation damage of samples such as biomolecules, because the photon flux density, which is the photon flux divided by the area of the beam spot, is the highest at the focal position. Indeed, in this study, the photon flux density at the focal position was 2 × 10¹⁴ photons·s−1·mm−2 at 200 nm, which is much higher than that of other SRCD beamlines [6,7]; this is due to the small spot area (ca. 5 × 10⁻⁴ mm2), although the total flux is low, as mentioned above. Radiation damage during CD measurements is often observed at high-flux-density SRCD beamlines [8,9]. For example, at the CD12 beamline of SRS in the U.K., the CD spectrum of myoglobin differed between the first and the second spectra, i.e., denaturation was induced by radiation damage within only 10 min [10], even though the photon flux density of the CD12 beamline was only 1% that of the focal position of the SO system used in this study. These results indicate that protein samples placed at the focal position of this system would be immediately decomposed.
Therefore, the sample position was carefully adjusted, comparing the flux density to that of other SRCD beamlines. As a result, the sample position was set at about 4 mm behind the focal position. At this point, the defocused spot area was about 1 mm2, and the photon flux density was 1 × 10¹¹ photons·s−1·mm−2 at 200 nm, which is comparable to the flux density threshold value for denaturation proposed by Miles et al. [9]. Evaluation of the radiation damage is discussed in Section 2.4.1.

2.3. Small-Capacity Sample Cell

A schematic view of the developed cell is shown in Figure 4. It was composed of two synthetic silica glasses with a thickness of 1 mm and an outer diameter of 20 mm. One of the glasses was flat (Ohyo Koken Kogyo, Tokyo, Japan) and the other had a counterbore hole 5 mm in diameter. The depth of the counterbore hole (15 μm: ATOCK, Ibaraki, Japan and 60 μm: Kyokuei-Kenma, Tokyo, Japan) corresponds to the path length of the cell. The hole was filled with the sample solution and covered with the flat glass. The capacities of the counterbore holes with 15 and 60 μm depths are 0.29 and 1.2 μL, respectively, and are comparable with those of CaF2 micro cells from Hellma Optics (Jena, Germany) [11].
Basically, the sample volume injected into the cell was much larger in practice to avoid foaming, although the volumes would depend on the types of solutions and skill of users. The counterbored glasses with depths of 15 μm and 60 μm developed in this study required 1.5 and 2.0 μL sample solution, respectively. The sample volume described here was reduced down to 1/10 or less as compared to that required by the pre-existing cells used at the BL-12 of HiSOR (15 and 20 μL for 10 and 50 μm pathlength cells, respectively) [12] and the commercial micro-volume cells (~20 μL for 10 μm pathlength cell) [13,14,15] for laboratory-based CD spectrophotometers. On the other hand, the sample volume of the developed cells was comparable to those required by the CaF2 micro cells [11] (2 μL and 3 μL for 12 and 13.3 μm pathlength cells, respectively, in recent reports using other SRCD beamlines [16,17]) owing to the similar capacities of the cells. From this point of view, the benefit of the SO may seem low for users of other SRCD beamlines. However, since the area of the counterbored hole (ca. 20 mm2) used in this study is much larger than the size of the defocused beam (ca. 1 mm2) given by the SO system, the volumes can be reduced further by adopting a smaller counterbored hole (estimated sample volume: 0.04 μL for 10 μm pathlength and 1 mm2 sample area). Then, the effect of the SO system on the volume reduction would be also obtained in other SRCD beamlines.

2.4. Performance of CD Measurement Using the SO

2.4.1. Radiation Damage to Protein Sample

Figure 5 shows the CD spectra of myoglobin of the 1st, 7th (0.5 h later), and 14th scan (1 h later). These spectra were in good agreement with one another. Thus, it could be concluded that the radiation damage during CD measurements would be negligible for at least 1 h within this wavelength region. The measurement time for each sample is usually shorter than 1 h at the BL-12 of HiSOR; therefore, it was concluded that additional treatments to prevent radiation damage, such as closing the slits, were unnecessary as long as the CD measurements were performed at this defocus point.

2.4.2. Distortion of CD Spectrum by the SO

To confirm whether the SO and/or new cells cause distortion in the CD spectra, the CD spectra of myoglobin were measured using (1) the pre-existent sample cell, (2) pre-existent cell and SO, (3) new cell (15 μm path length) and SO, and (4) new cell (60 μm path length) and SO, as shown in Figure 6. These spectra demonstrated good agreement with one another in the wavelength region from 180 to 260 nm. Hence, the use of the new sample cells with the SO would cause no distortion in the CD spectra, at least within this wavelength range. Linear dichroism and birefringence (LD and LB, respectively) exhibited by the cells and the SO would also be negligible within this range.

2.5. Structural Analysis of H3K36me3

Finally, the CD spectrum of H3K36me3 was measured using the SO system and small-capacity sample cell.
Knowledge of post-translational modifications (such as methylation) of histone proteins, induced during the DNA damage repair process in eukaryotic cells, has increased over time [18,19,20,21,22,23,24,25]. For example, it is assumed that H3K36me3 is linked to DNA repair in transcriptionally active regions, and it is thought the DNA repair processes involve drastic structural alterations of chromatin, namely complex of DNA and histone proteins, induced by the post-translational modifications of histones [21,22,26,27]. However, experimental and theoretical studies on the structural changes of histone, induced by modifications or DNA damage repair processes, are not so abundant [17,28,29,30,31,32,33,34,35,36,37]. To precisely understand the mechanism of chromatin structural remodeling, cyclopedic studies of modification-induced structural changes of histones would be necessary.

2.5.1. CD Spectrum of H3K36me3

Figure 7 shows the CD spectrum of H3K36me3. The spectrum of unmethylated H3, which is reproduced from the data of ref. [36], is also shown in this figure for comparison. Unmethylated H3 exhibited a positive peak around 190 nm and negative peaks around 210 and 220 nm; these were characteristic CD peaks of α-helix structures [38]. H3K36me3 showed a spectral shape similar to that of unmethylated H3, but with largely different peak intensities and positions. Since CD spectra reflect protein conformations, the spectral differences show that the trimethylation of H3 lysine-36 residue induced structural alteration.

2.5.2. Secondary Structural Contents of H3K36me3

The secondary structural contents of H3K36me3 and unmethylated H3 [36] are listed in Table 1, where each content is 100% normalized. As shown in Table 1, the secondary structural contents were increased in the helix (25.0 ± 1.2% → 35.6 ± 1.3%) by the trimethylations. On the other hand, unordered structures were decreased (32.7 ± 1.7% → 23.3 ± 2.8%). The contents of the β-strand and turn structures were the same within the error range. For the trimethylations of lysine-4 or lysine-9 residues of H3 (H3K4me3 and H3K9me3, respectively), a decrement in the content of helix structures and an increment of β-strand structures were observed [36,37], showing that the structural alterations observed in H3K4me3 and H3K9me3 were quite different from those of H3K36me3. These results suggest that the structural changes induced by post-translational trimethylations are not uniform, but are rich in variation depending on the sites of methylation. The various structural changes induced by post-translational modifications may be strongly related to the regulation of cellular functions.

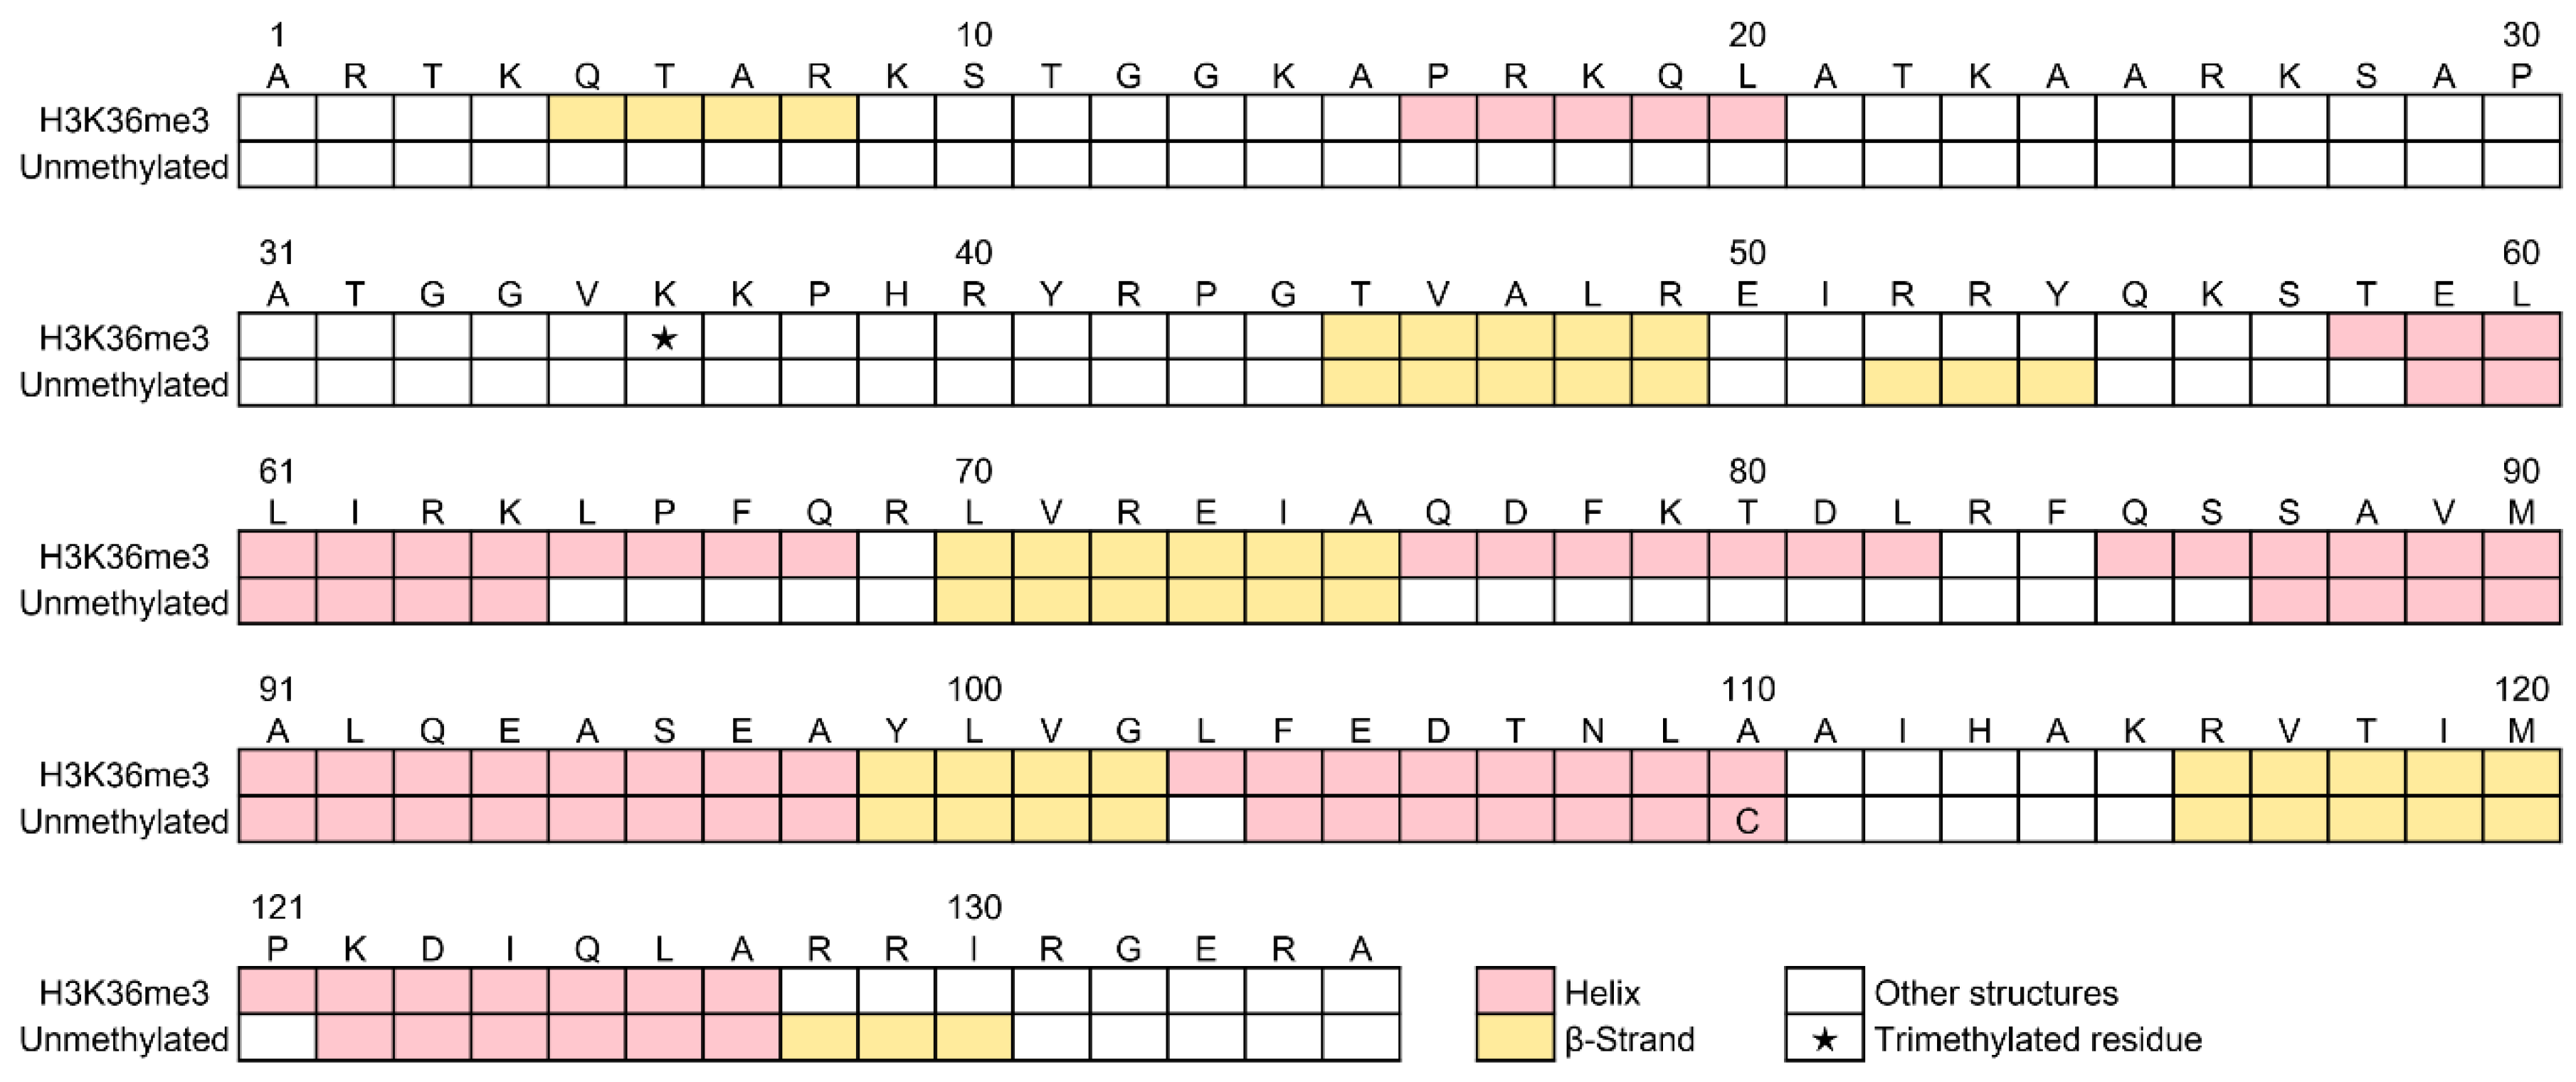
2.5.3. Predicted Positions of α-Helices and β-Strands

Figure 8 shows the predicted secondary structural sequences of H3K36me3 and unmethylated H3 [36]. Remarkable results in H3K36me3 were the β-strand formation in the 5th–8th residues and helix formations in the 16th–20th residues. These residues were located in the N-terminal tail of H3. This tail region strongly interacts with various histone-binding proteins, such as enzymes, in cells [18,19,20,21,22,23,24,25,26,27]. Thus, the structural alterations in the N-terminal tail induced by the modification(s) would affect the reactivity. In addition, a newly formed helix segment (76th–82nd), some elongated helix segments (58th–68th and 85th–98th), and decrement of β-strand segments (52nd–54th and 128th–130th) were also predicted other than in the region of the N-terminal tail. These results show that the structural alterations of isolated H3 are not limited to the region around the methylation site. To investigate the interactions between the histone-binding proteins and H3K36me3 [39,40,41,42] or other (un)modified histone proteins in vitro, short peptides in the vicinity of the modification site(s) (ca. 10–20 residues) are often used. However, the prediction implies that the residues distant from the modification site(s) should also be considered. Indeed, it is known that the catalytic activities of lysine-specific demethylase 1 and 2 (LSD1 and LSD2, respectively) depend on the peptide-length of lysine-4 methylated H3; the first 21 residues, at least, of lysine-4 mono- or dimethylated H3 are required for effective demethylation, though only the first 12–16 residues seem to contact the binding site of LSD1 and LSD2 [43,44,45,46]. It is also known that the binding affinity between LSD1 and full-length unmethylated H3 is nearly 100-fold higher than that between LSD1 and unmethylated H3 peptides (first 21 residues) [47].
It seems that the optimum peptide length for mimicking cellular histones and/or chromatin has not been sufficiently investigated. Systematic studies on the optimum peptide length should be carried out.

3. Materials and Methods

3.1. Sample Preparation

A reagent of myoglobin from a horse heart (purity > 90%) was purchased from Sigma-Aldrich (St. Louis, MO, USA) and used without further purification. The reagent was dissolved in Milli-Q water, and the concentration of the sample was about 5 μg/μL.
Recombinant Xenopus laevis H3K36me3 (purity > 98%), synthesized using methylated lysine analog technology [48], was purchased from Active Motif (Carlsbad, CA, USA). The reagent was dissolved in a 25 mM sodium phosphate buffer supplemented by 250 mM sodium fluoride (pH = 8.6 at 25 °C) and used without further purification. It is known that this solvent condition can prevent the aggregation of methylated H3 proteins [37]. The concentration of H3K36me3 was 1 μg/μL.

3.2. CD Measurements

All CD spectra were measured between 180 and 260 nm at 25 °C, using the VUVCD spectrophotometer at HiSOR [5]. The consecutive scans of myoglobin described in Section 2.4.1 were carried out using the new cell with a path length of 60 μm and the SO. For evaluation of the spectral distortion, CD spectra of myoglobin were measured five times and averaged in each condition described in Section 2.4.2. The CD spectrum of the solvent, which should be zero under ideal conditions, was also measured as a baseline. This baseline was subtracted from the CD spectra of the samples to remove artificial CD signals that might have originated from the optical systems, cells, etc.
The CD spectra of H3K36me3 were measured twice (5 scans/measurement), using the SO and the new cell with a 15 μm path length, in a similar manner. The data of H3K36me3 and the baseline are deposited as a supplementary information in this journal.

3.3. Analysis of Secondary Structures

We used the SELCON3 program [49,50] based on the reference proteins measured at HiSOR [51,52] to analyze the contents of helix, β-strand, turn, and unordered structures and numbers of segments of helix and β-strand in H3K36me3. The program and the dataset were selected for the following reasons: (i) the program can successfully provide the numbers of helix and β-strand segments which are necessary for estimating those positions (see detail in below), and (ii) the dataset of the reference proteins was obtained using the same CD instrument at HiSOR and it allows us to avoid any inaccuracy and/or ambiguity which might originate from the usage of different CD instruments [53]. We also analyzed the secondary structure contents of H3K36me3 using CONTIN/LL program [54,55] and a dataset SP29 provided in CDPro software package [50] for confirmation and obtained comparable results. However, the results obtained here (e.g., for the helix content) are still controversial because other programs and datasets might provide the different results as reported in a previous paper [56]. Although SELCON3 program based on the 31 reference proteins was used in this study by the reasons mentioned above, the usage of larger reference dataset such as SP175 (more than 70 proteins) [57] and the latest program such as BeStSel [58] should be considered in future. The SELCON3 program was applied over the wavelength range of 185–260 nm. It is noted that helix content include the α-helix and 310-helix structures and the content of unordered structures includes bend, π-helix, and β-bridge structures.
The positions of the helices and β-strands in H3K36me3 were estimated by a neural network (NN) method based on the CD spectroscopic results, which is termed the VUVCD-NN combination method. In this prediction, methylated residue was regarded as normal lysine residues. The computational protocol is described elsewhere [59]. We used a NN algorithm that predicts the positions of secondary structures by using evolutionary sequence information based on the position-specific scoring matrices generated by the PSI-BLAST algorithm [60], referring to the numbers of amino acid residues of helices and β-strands determined by CD spectroscopy and SELCON3 analyses (Nh and Nβ, respectively) and the number of segments of helices and β-strands (nh and nβ, respectively). The Nh and Nβ were calculated by multiplying the total number of amino acid residues of H3K36me3 (N = 135) with the secondary structural contents of helix and β-strand structures, respectively. nh and nβ were calculated by the following equations [49]:
nh = hD N/4
and
nβ = βD N/2
where hD and βD are the contents of the helix and β-strand structures, respectively, in distorted regions. We assumed that the distorted region corresponds to two residues at each end of the helix structure or one residue at each end of the β-strand structure. In this work, hD and βD were 17.7 ± 1.1 and 7.2 ± 0.7%, respectively. The turn and unordered structures estimated by the SELCON3 analysis were classified as other structures. It is known that the accuracy of the VUVCD-NN combination method is about 75% for 30 reference proteins [59].

4. Conclusions

The beam size at the focal position was reduced down to 1/240 (6 × 6 mm2 → 25 × 25 μm2) or less using the SO. The use of the SO and developed small-capacity sample cell allowed the sample volume to be reduced to 1/10 (20 μL → 2 μL for a 60 μm path-length cell and 15 μL → 1.5 μL for a 15 μm path-length cell). Each required volume is one of the smallest among those for similar path-length cells, to our knowledge. It could be reduced more when adopting a smaller sample area and path-length cell. The high-flux-density beam at the focal position is very attractive for CD measurements under the flow condition, such as time-resolved CD measurements, because the exposure time becomes quite short (in the millisecond time range) [3], making the radiation damage negligible. The system developed in this study can be easily available to other SR-based and commercial CD spectrophotometers; thus, it is expected to contribute to advances in CD spectroscopic science.
As an application of this system, the CD spectrum of a scarce protein (H3K36me3) was measured and its secondary structures were analyzed. From the comparison between H3K36me3 and unmethylated H3, the increment of helix structures and the decrement of unordered structures were clearly observed. Post-translational methylation can induce various structural alterations of histones, depending on the methylation sites. Those structural alterations may contribute to regulating cellular functions such as DNA damage repair systems. Cyclopedic structural analyses of modified histones are important for understanding the role of the modification-induced structural changes of histones. Obtaining or refining the proteins involved in the DNA damage repair system is generally difficult; thus, this system will contribute to easing the challenge of structural analyses of such proteins.

Supplementary Materials

The following is available online, spectral data of H3K36me3 and the baseline.

Author Contributions

Conceptualization, Y.I.; Investigation, Y.I. and K.M.; Writing—original draft, Y.I. and K.M.

Funding

This work was supported by JSPS KAKENHI grant number [JP17K12825].

Acknowledgments

CD spectroscopy was carried out with the approval of the Hiroshima Synchrotron Radiation Center (HiSOR) of Hiroshima University (proposal number: 18AG021). Installation of the SO and development of the new sample cells were financially supported by HiSOR.

Conflicts of Interest

The authors declare no conflict of interest.

References

  1. Kim, Y.; Bigelow, L.; Borovilos, M.; Dementieva, I.; Duggan, E.; Hatzos, C.; Joachimiak, G.; Li, H.; Mulligan, R.; Quartey, P.; et al. High-throughput protein purification for X-ray crystallography and NMR. Adv. Protein Chem. Struct. Biol. 2008, 75, 85–105. [Google Scholar] [CrossRef] [PubMed]
  2. Kumagai, P.S.; Araujo, A.P.U.; Lopes, J.L.S. Going deep into protein secondary structure with synchrotron radiation circular dichroism spectroscopy. Biophys. Rev. 2017, 9, 517–527. [Google Scholar] [CrossRef] [PubMed]
  3. Kane, A.S.; Hoffmann, A.; Baumgärtel, P.; Seckler, R.; Reichardt, G.; Horsley, D.A.; Schuler, B.; Bakajin, O. Microfluidic mixers for the investigation of rapid protein folding kinetics using synchrotron radiation circular dichroism spectroscopy. Anal. Chem. 2008, 80, 9534–9541. [Google Scholar] [CrossRef] [PubMed]
  4. Yamada, T.; Yuri, M.; Onuki, H.; Ishizaka, S. Microscopic imaging of circular dichroism using a polarizing undulator. Jpn. J. Appl. Phys. 2000, 39, 310–315. [Google Scholar] [CrossRef]
  5. Sawada, M.; Namatame, H.; Taniguchi, M. Optical design of a compact and practical UV beamline at HiSOR-BL 12. J. Phys. Conf. Ser. 2013, 425, 162010. [Google Scholar] [CrossRef]
  6. Hussain, R.; Jávorfi, T.; Siligardi, G. Circular dichroism beamline B34 at the Diamond Light Source. J. Synchrotron Rad. 2012, 19, 132–135. [Google Scholar] [CrossRef] [PubMed]
  7. Bürck, J.; Roth, S.; Windisch, D.; Wadhwani, P.; Moss, D.; Ulrich, A.S. UV-CD12: Synchrotron radiation circular dichroism beamline at ANKA. J. Synchrotron Rad. 2015, 22, 845–852. [Google Scholar] [CrossRef] [PubMed]
  8. Wien, F.; Miles, A.J.; Lees, J.G.; Hoffmann, S.V.; Wallace, B.A. VUV irradiation effects on proteins in high-flux synchrotron radiation circular dichroism spectroscopy. J. Synchrotron Rad. 2005, 12, 517–523. [Google Scholar] [CrossRef] [PubMed] [Green Version]
  9. Miles, A.J.; Janes, R.W.; Brown, A.; Clarke, D.T.; Sutherland, J.C.; Tao, Y.; Wallace, B.A.; Hoffmann, S.V. Light flux density threshold at which protein denaturation is induced by synchrotron radiation circular dichroism beamlines. J. Synchrotron Rad. 2008, 15, 420–422. [Google Scholar] [CrossRef] [PubMed]
  10. Clarke, D.T.; Jones, G. CD12: A new high-flux beamline for ultraviolet and vacuum-ultraviolet circular dichroism on the SRS, Daresbury. J. Synchrotron Rad. 2004, 11, 142–149. [Google Scholar] [CrossRef] [PubMed]
  11. Wien, F.; Wallace, B.A. Calcium fluoride micro cells for synchrotron radiation circular dichroism spectroscopy. Appl. Spectrosc. 2005, 59, 1109–1113. [Google Scholar] [CrossRef] [PubMed]
  12. Matsuo, K.; Sakai, K.; Matsushita, Y.; Fukuyama, T.; Gekko, K. Optical cell with a temperature-control unit for a vacuum-ultraviolet circular dichroism spectrophotometer. Anal. Sci. 2003, 19, 129–132. [Google Scholar] [CrossRef] [PubMed]
  13. Warner, L.R.; Brown, R.J.; Yingst, S.M.C.; Oxford, J.T. Isoform-specific heparin sulfate binding within the amino-terminal noncollagenous domain of collagen α1 (XI). J. Biol. Chem. 2006, 281, 39507–39516. [Google Scholar] [CrossRef] [PubMed]
  14. Šťovíčková, L.; Tatarkovič, M.; Logerová, H.; Vavřinec, J.; Setnička, V. Identification of spectral biomarkers for type 1 diabetes mellitus using the combination of chiroptical and vibrational spectroscopy. Analyst 2015, 140, 2266–2272. [Google Scholar] [CrossRef] [PubMed] [Green Version]
  15. Habartová, L.; Bunganič, B.; Tatarkovič, M.; Zavoral, M.; Vondroušová, J.; Syslová, K.; Setnička, V. Chiroptical spectroscopy and metabolomics for blood-based sensing of pancreatic cancer. Chirality 2018, 30, 581–591. [Google Scholar] [CrossRef] [PubMed]
  16. Manzo, G.; Scorciapino, M.A.; Wadhwani, P.; Bürck, J.; Montaldo, N.P.; Pintus, M.; Sanna, R.; Casu, M.; Giuliani, A.; Pirri, G.; et al. Enhanced amphiphilic profile of a short β-stranded petide improves its antimicrobial activity. PLoS ONE 2015, 10, e0116379. [Google Scholar] [CrossRef] [PubMed]
  17. Izumi, Y.; Fujii, K.; Wien, F.; Houée-Lévin, C.; Lacombe, S.; Salado-Leza, D.; Porcel, E.; Masoud, R.; Yamamoto, S.; Réfrégiers, M.; et al. Structure change from β-strand and turn to α-helix in histone H2A-H2B induced by DNA damage response. Biophys. J. 2016, 111, 69–78. [Google Scholar] [CrossRef] [PubMed]
  18. van Attikum, H.; Gasser, S.M. Crosstalk between histone modifications during the DNA damage response. Trends Cell Biol. 2009, 19, 207–217. [Google Scholar] [CrossRef] [PubMed]
  19. Pandita, T.K.; Richardson, C. Chromatin remodeling finds its place in the DNA double-strand break response. Nucleic. Acids Res. 2009, 37, 1363–1377. [Google Scholar] [CrossRef] [PubMed] [Green Version]
  20. Hunt, C.R.; Ramnarain, D.; Horikoshi, N.; Iyengar, P.; Pandita, R.L.; Shay, J.W.; Pandita, T.K. Histone modifications and DNA double-strand break repair after exposure to ionizing radiations. Radiat. Res. 2013, 179, 383–392. [Google Scholar] [CrossRef] [PubMed]
  21. Price, B.D.; D’Andrea, A.D. Chromatin remodeling at DNA double-strand breaks. Cell 2013, 152, 1344–1354. [Google Scholar] [CrossRef] [PubMed]
  22. Gong, F.; Miller, K.M. Mammalian DNA repair: HATs and HDACs make their mark through histone acetylation. Mutat. Res. 2013, 750, 23–30. [Google Scholar] [CrossRef] [PubMed]
  23. Cao, L.-L.; Shen, C.; Zhu, W.-G. Histone modifications in DNA damage response. Sci. China Life Sci. 2016, 59, 257–270. [Google Scholar] [CrossRef] [PubMed] [Green Version]
  24. Gong, F.; Miller, K.M. Histone methylation and the DNA damage response. Mutat. Res. Rev. 2017. [Google Scholar] [CrossRef]
  25. Downs, J.A.; Nussenzweig, M.C.; Nussenzweig, A. Chromatin dynamics and the preservation of genetic information. Nature 2007, 447, 951–958. [Google Scholar] [CrossRef] [PubMed]
  26. Lans, H.; Marteijn, J.A.; Vermeulen, W. ATP-dependent chromatin remodeling in the DNA-damage response. Epigenet. Chromatin 2012, 5, 4. [Google Scholar] [CrossRef] [PubMed] [Green Version]
  27. Polo, S.E. Reshaping chromatin after DNA damage: The choreography of histone proteins. J. Mol. Biol. 2015, 427, 626–636. [Google Scholar] [CrossRef] [PubMed]
  28. Adler, A.J.; Fasman, G.D. Altered conformational effects of naturally acetylated histone f2a1 (IV) in f2a1-deoxyribonucleic acid complexes. Circular dichroism studies. J. Biol. Chem. 1974, 249, 2911–2914. [Google Scholar] [PubMed]
  29. Prevelige, P.E., Jr.; Fasman, G.D. Structural studies of acetylated and control inner core histones. Biochemistry 1987, 26, 2944–2955. [Google Scholar] [CrossRef] [PubMed]
  30. Wang, X.; Moore, S.C.; Laszckzak, M.; Ausió, J. Acetylation increases the α-helical content of the histone tails of the nucleosome. J. Biol. Chem. 2000, 275, 35013–35020. [Google Scholar] [CrossRef] [PubMed]
  31. Yang, D.; Arya, G. Structure and binding of the H4 histone tail and the effects of lysine 16 acethylation. Phys. Chem. Chem. Phys. 2011, 13, 2911–2921. [Google Scholar] [CrossRef] [PubMed]
  32. Izumi, Y.; Yamamoto, S.; Fujii, K.; Yokoya, A. Secondary structure alterations of histone H2A and H2B in X-irradiated human cancer cells: Altered histones persist in cells for at least 24 hours. Radiat. Res. 2015, 184, 554–558. [Google Scholar] [CrossRef] [PubMed]
  33. Ikebe, J.; Sakuraba, S.; Kono, H. H3 histone tail conformation within the nucleosome and the impact of K14 acetylation studied using enhanced sampling simulation. PLoS Comput. Biol. 2016, 12, e1004788. [Google Scholar] [CrossRef] [PubMed]
  34. Izumi, Y.; Fujii, K.; Yamamoto, S.; Matsuo, K.; Namatame, H.; Taniguchi, M.; Yokoya, A. DNA damage response induces structural alterations in histone H3-H4. J. Radiat. Res. 2017, 58, 59–65. [Google Scholar] [CrossRef] [PubMed]
  35. du Preez, L.L.; Patterton, H.-G. The effect of epigenetic modifications on the secondary structures and possible binding positions of the N-terminal tail of histone H3 in the nucleosome: A computational study. J. Mol. Model. 2017, 23, 137. [Google Scholar] [CrossRef] [PubMed]
  36. Izumi, Y.; Matsuo, K.; Fujii, K.; Yokoya, A.; Taniguchi, M.; Namatame, H. Circular dichroism spectroscopic study on structural alterations of histones induced by post-translational modifications in DNA damage responses: Lysine-9 methylation of H3. J. Radiat. Res. 2018, 59, 108–115. [Google Scholar] [CrossRef] [PubMed]
  37. Izumi, Y.; Matsuo, K.; Namatame, H. Structural analysis of lysine-4 methylated histone H3 proteins using synchrotron radiation circular dichroism spectroscopy. Chirality 2018, 30, 536–540. [Google Scholar] [CrossRef] [PubMed]
  38. Greenfield, N.; Fasman, G.D. Computed circular dichroism spectra for the evaluation of protein conformation. Biochemistry 1969, 8, 4108–4116. [Google Scholar] [CrossRef] [PubMed]
  39. Cai, L.; Rothbart, S.B.; Lu, R.; Xu, B.; Chen, W.-Y.; Tripathy, A.; Rockowitz, S.; Zheng, D.; Patel, D.J.; Allis, C.D.; et al. An H3K36 methylation-engaging tudor motif of polycomb-like proteins mediates PRC2 complex targeting. Mol. Cell 2013, 49, 571–582. [Google Scholar] [CrossRef] [PubMed]
  40. Wu, H.; Zeng, H.; Lam, R.; Tempel, W.; Amaya, M.F.; Xu, C.; Dombrovski, L.; Qiu, W.; Wang, Y.; Min, J. Structural and histone binding ability characterizations of human PWWP domains. PLoS ONE 2011, 6, e18919. [Google Scholar] [CrossRef] [PubMed]
  41. Musselman, C.A.; Avvakumov, N.; Watanabe, R.; Abraham, C.G.; Lalonde, M.-E.; Hong, Z.; Allen, C.; Roy, S.; Nuñez, J.K.; Nickoloff, J.; et al. Molecular basis for H3K36me3 recognition by the tudor domain of PHF1. Nat. Struct. Mol. Biol. 2012, 19, 1266–1272. [Google Scholar] [CrossRef] [PubMed]
  42. Chowdhury, R.; Yeoh, K.K.; Tian, Y.-M.; Hilringhaus, L.; Bagg, E.A.; Rose, N.R.; Leung, I.K.H.; Li, X.S.; Woon, E.C.Y.; Yang, M.; et al. The oncometabolite 2-hydroxyglutarate inhibits histone lysine demethylases. EMBO Rep. 2011, 12, 463–469. [Google Scholar] [CrossRef] [PubMed] [Green Version]
  43. Forneris, F.; Binda, C.; Vanoni, M.A.; Battaglioli, E.; Mattevi, A. Human histone demethylase LSD1 reads the histone code. J. Biol. Chem. 2005, 280, 41360–41365. [Google Scholar] [CrossRef] [PubMed]
  44. Cheng, X.; Blumenthal, R.M. Coodinated chromatin control: Structural and functional linkage of DNA and histone methylation. Biochemistry 2010, 49, 2999–3008. [Google Scholar] [CrossRef] [PubMed]
  45. Yang, M.; Gocke, C.B.; Luo, X.; Borek, D.; Tomchick, D.R.; Machius, M.; Otwinowski, Z.; Yu, H. Structural basis for CoREST-dependent demethylation of nucleosomes by the human LSD1 histone demethylase. Mol. Cell 2006, 23, 377–387. [Google Scholar] [CrossRef] [PubMed]
  46. Chen, F.; Yang, H.; Dong, Z.; Fang, J.; Wang, P.; Zhu, T.; Gong, W.; Fang, R.; Shi, Y.G.; Li, Z.; et al. Structural insight into substrate recognition by histone demethylase LSD2/KDM1b. Cell Res. 2013, 23, 306–309. [Google Scholar] [CrossRef] [PubMed] [Green Version]
  47. Burg, J.M.; Gonzalez, J.J.; Maksimchuk, K.R.; McCafferty, D.G. Lysine-specific demethylase 1A (KDM1A/LSD1): Product recognition and kinetic analysis of full-length histones. Biochemistry 2016, 55, 1652–1662. [Google Scholar] [CrossRef] [PubMed]
  48. Simon, M.D.; Chu, F.; Racki, L.R.; de la Cruz, C.C.; Burlingame, A.L.; Panning, B.; Narlikar, G.J.; Shokat, K.M. The site-specific installation of methyl-lysine analogs into recombinant histones. Cell 2007, 128, 1003–1012. [Google Scholar] [CrossRef] [PubMed]
  49. Sreerama, N.; Venyaminov, S.Y.; Woody, R.W. Estimation of the number of α-helical and β-strand segments in proteins using circular dichroism spectroscopy. Protein Sci. 1999, 8, 370–380. [Google Scholar] [CrossRef] [PubMed]
  50. Sreerama, N.; Woody, R.W. Estimation of protein secondary structure from circular dichroism spectra: Comparison of CONTIN, SELCON, and CDSSTR, methods with and expanded reference set. Anal. Biochem. 2000, 287, 252–260. [Google Scholar] [CrossRef] [PubMed]
  51. Matsuo, K.; Yonehara, R.; Gekko, K. Secondary-structure analysis of proteins by vacuum-ultraviolet circular dichroism spectroscopy. J. Biochem. 2004, 135, 405–411. [Google Scholar] [CrossRef] [PubMed]
  52. Matsuo, K.; Yonehara, R.; Gekko, K. Improved estimation of the secondary structures of proteins by vacuum-ultraviolet circular dichroism spectroscopy. J. Biochem. 2005, 138, 79–88. [Google Scholar] [CrossRef] [PubMed]
  53. Miles, A.J.; Wien, F.; Lees, J.G.; Rodger, A.; Janes, R.W.; Wallace, B.A. Calibration and standardisation of synchrotron radiation circular dichroism and conventional circular dichroism spectrophotometers. Spectroscopy 2003, 17, 653–661. [Google Scholar] [CrossRef]
  54. Provencher, S.W.; Glöckner, J. Estimation of globular protein secondary structure from circular dichroism. Biochemistry 1981, 20, 33–37. [Google Scholar] [CrossRef] [PubMed]
  55. van Stokkum, I.H.M.; Spoelder, H.J.W.; Bloemendal, M.; van Grondelle, R.; Groen, F.C.A. Estimation of protein secondary structure and error analysis from circular dichroism spectra. Anal. Biochem. 1990, 191, 110–118. [Google Scholar] [CrossRef]
  56. Miles, A.J.; Wallace, B.A. Synchrotron radiation circular dichroism spectroscopy of proteins and applications in structural and functional genomics. Chem. Soc. Rev. 2006, 35, 39–51. [Google Scholar] [CrossRef] [PubMed]
  57. Lees, J.G.; Miles, A.J.; Wien, F.; Wallace, B.A. A reference database for circular dichroism spectroscopy covering fold and secondary structure space. Bioinformatics 2006, 22, 1955–1962. [Google Scholar] [CrossRef] [PubMed] [Green Version]
  58. Micsonai, A.; Wien, F.; Kernya, L.; Lee, Y.-H.; Goto, Y.; Réfrégiers, M.; Kardos, J. Accurate secondary structure prediction and fold recognition for circular dichroism spectroscopy. Proc. Natl. Acad. Sci. USA 2015, 112, E3095–E3103. [Google Scholar] [CrossRef] [PubMed]
  59. Matsuo, K.; Watanabe, H.; Gekko, K. Improved sequence-based prediction of protein secondary structures by combining vacuum-ultraviolet circular dichroism spectroscopy with neutral network. Proteins 2008, 73, 104–112. [Google Scholar] [CrossRef] [PubMed]
  60. Jones, D.T. Protein secondary structure prediction based on position-specific scoring matrices. J. Mol. Biol. 1999, 292, 195–202. [Google Scholar] [CrossRef] [PubMed]
Sample Availability: Samples of the compounds are not available from the authors.
Figure 1. (Top) Top-view photograph of the VUVCD spectrophotometer sample chamber after Schwarzschild objective (SO) installation. (Bottom) A schematic view of beam focusing using the SO.
Molecules 23 02865 g001
Figure 2. Light intensity of the focal unmonochromatized SR beam against the horizontal and vertical positions at the focal position. The collected data (open circle) were fitted by a Lorentz function (solid line).
Molecules 23 02865 g002
Figure 3. Reflectance of the SO (left axis) and photon flux (normalized at 100 mA electron beam current) after passing through the SO (right axis) in the wavelength region of 175–260 nm.
Molecules 23 02865 g003
Figure 4. (a) A schematic view of the developed cell. (b) A photograph of the counterbored glass.
Molecules 23 02865 g004
Figure 5. CD spectra of myoglobin obtained by consecutive scans for 1 h. 1st scan: black, 7th scan (0.5 h later): red, and 14th scan (1 h later): blue.
Molecules 23 02865 g005
Figure 6. CD spectra of myoglobin measured using the pre-existent cell (black), pre-existent cell and SO (red), new cell (15 μm path length) and SO (green), and new cell (60 μm path length) and SO (blue).
Molecules 23 02865 g006
Figure 7. CD spectra of H3K36me3 (black) and unmethylated H3 (red), reproduced from literature data [36].
Molecules 23 02865 g007
Figure 8. Sequence-based secondary structures of H3K36me3 and unmethylated H3 predicted by the VUVCD-neural network (NN) method. The data of unmethylated H3 were reproduced from a previous paper [36]. The helix, β-strand, and other structures are shown in pink, yellow, and white rectangles, respectively. The star in the rectangle shows the trimethylated residue. The 110th residue of unmethylated H3 is cysteine (C) and is different from that of H3K36me3 (alanine; A).
Molecules 23 02865 g008
Table 1. The secondary structural contents of H3K36me3 and unmethylated H3, obtained using the SELCON3 program.
Structure Content (%)H3K36me3Unmethylated H3 1
Helix35.6 ± 1.325.0 ± 1.2
β-strand18.7 ± 2.521.3 ± 1.5
Turn22.3 ± 0.921.1 ± 1.0
Unordered23.3 ± 2.832.7 ± 1.7
1 Reproduced from ref. [36].

