Development of Phaleria macrocarpa (Scheff.) Boerl Fruits Using Response Surface Methodology Focused on Phenolics, Flavonoids and Antioxidant Properties

Abstract
1. Introduction
2. Results and Discussion
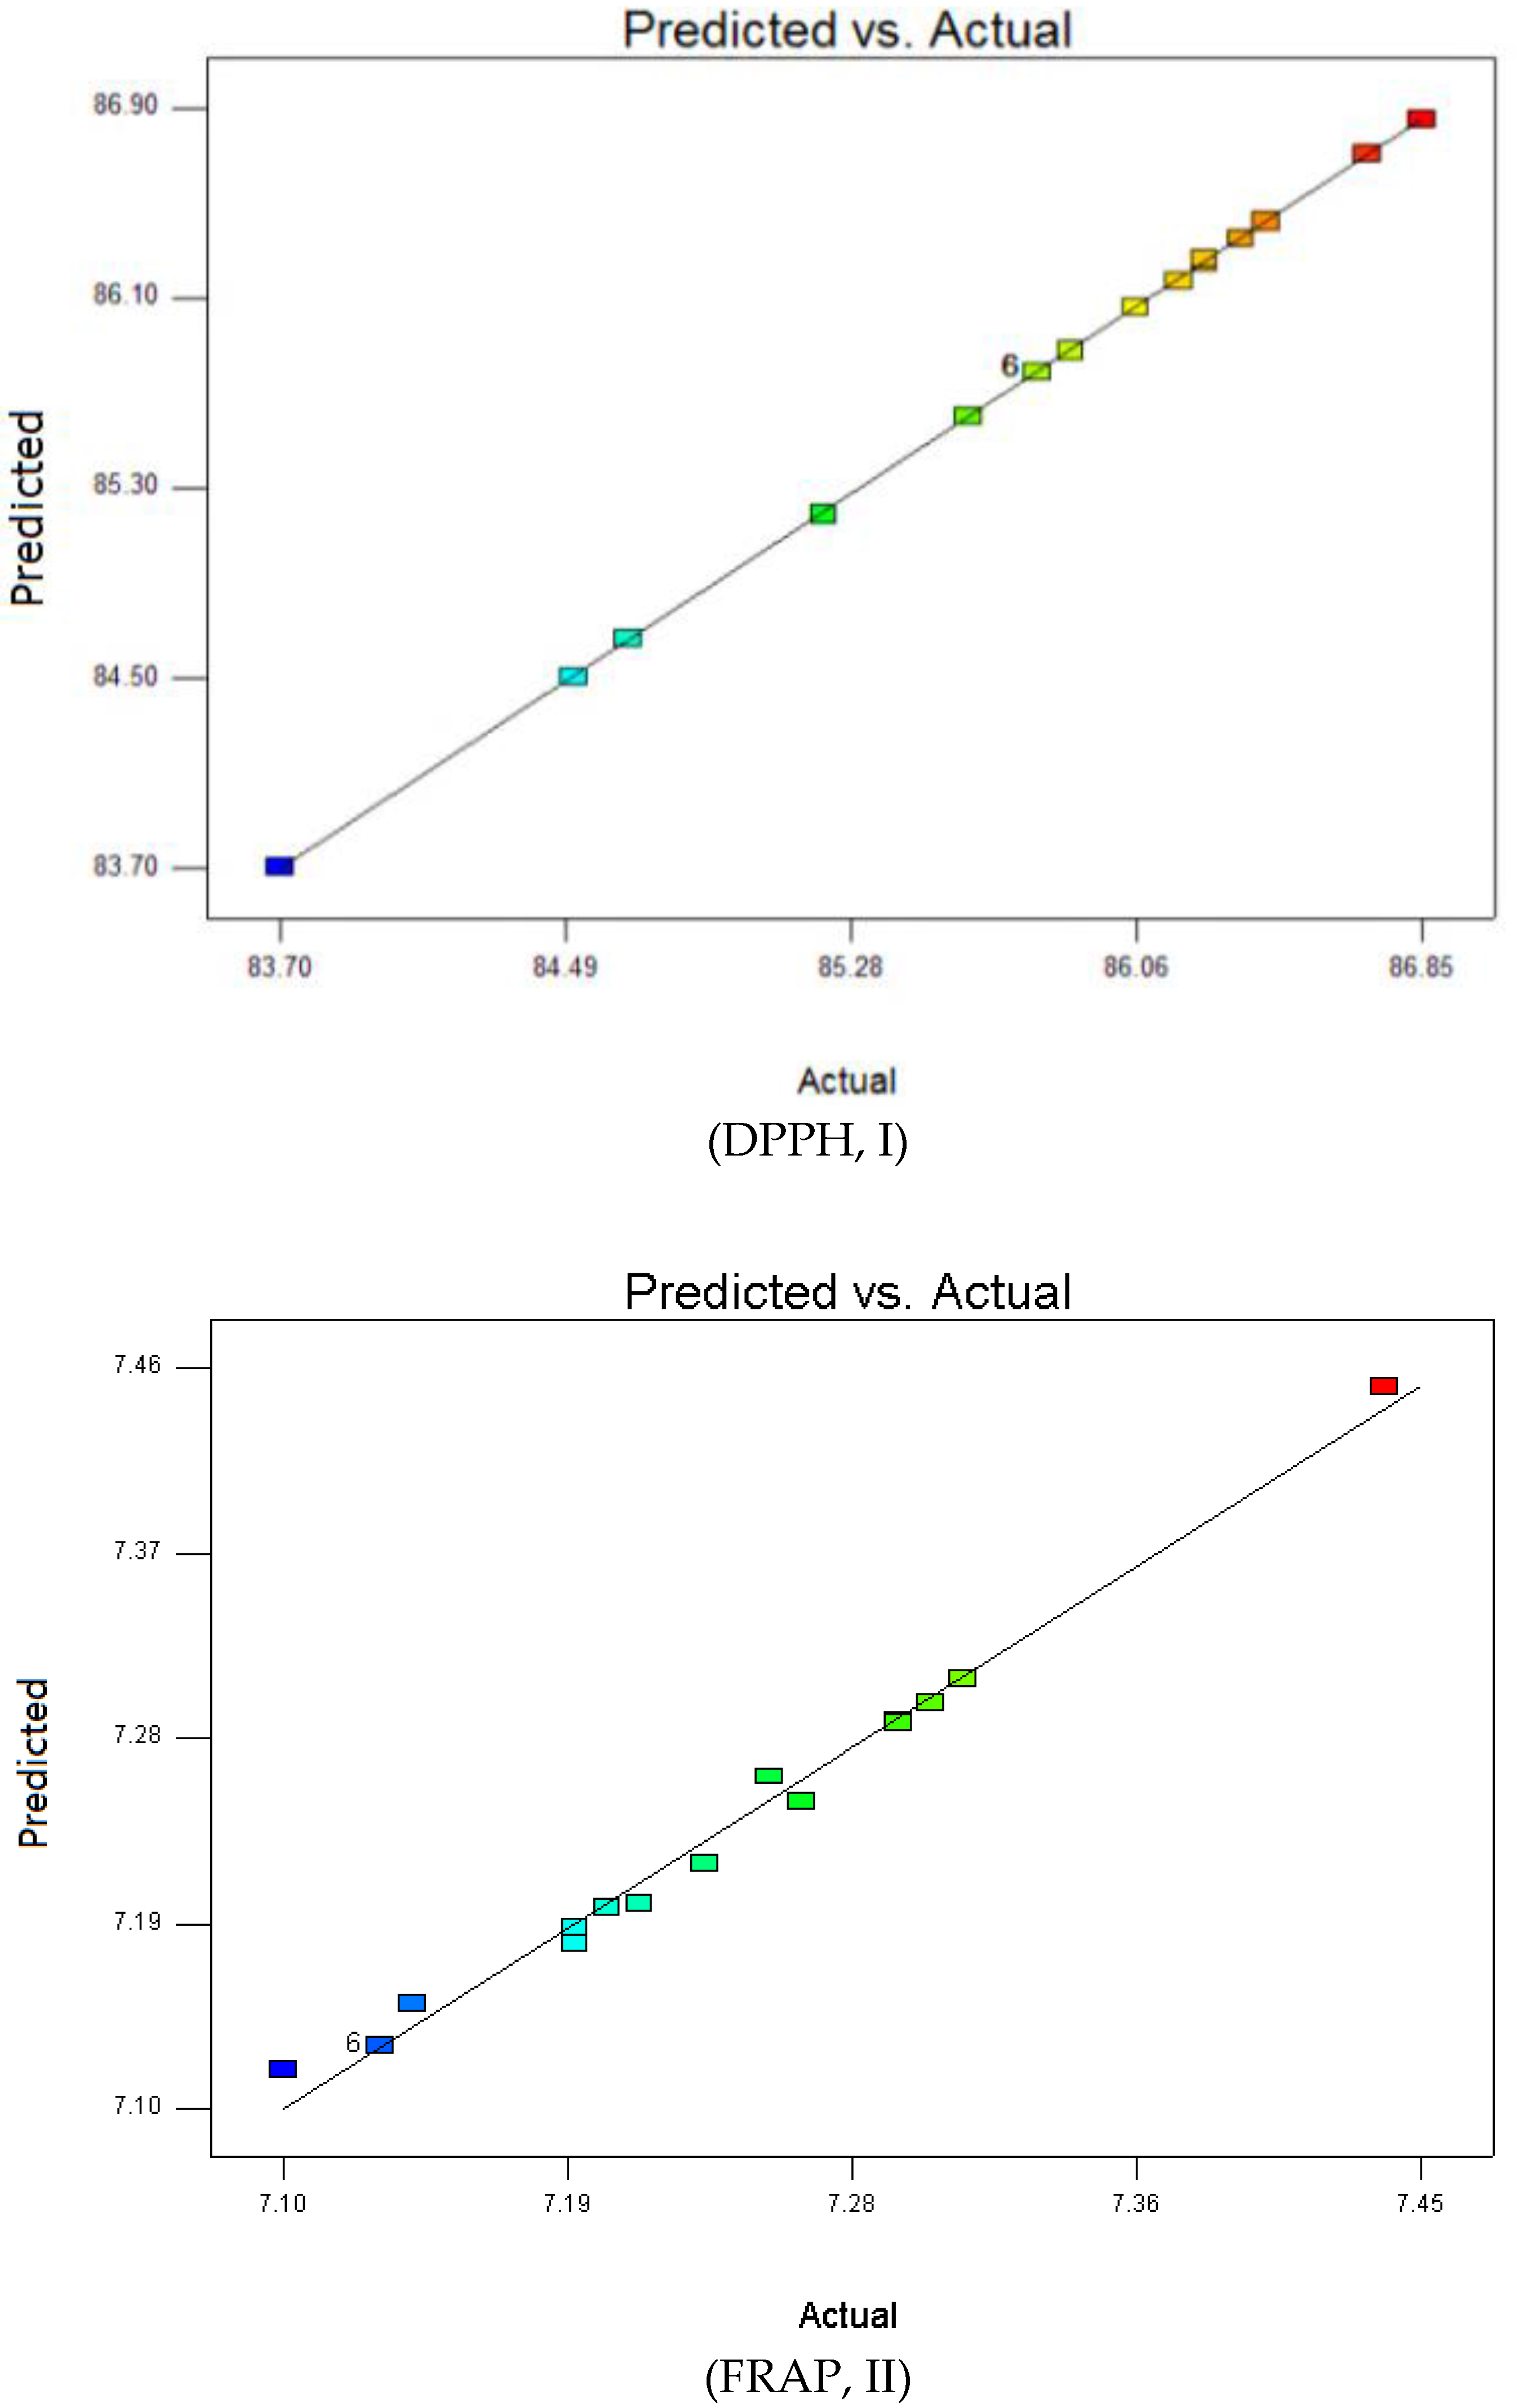
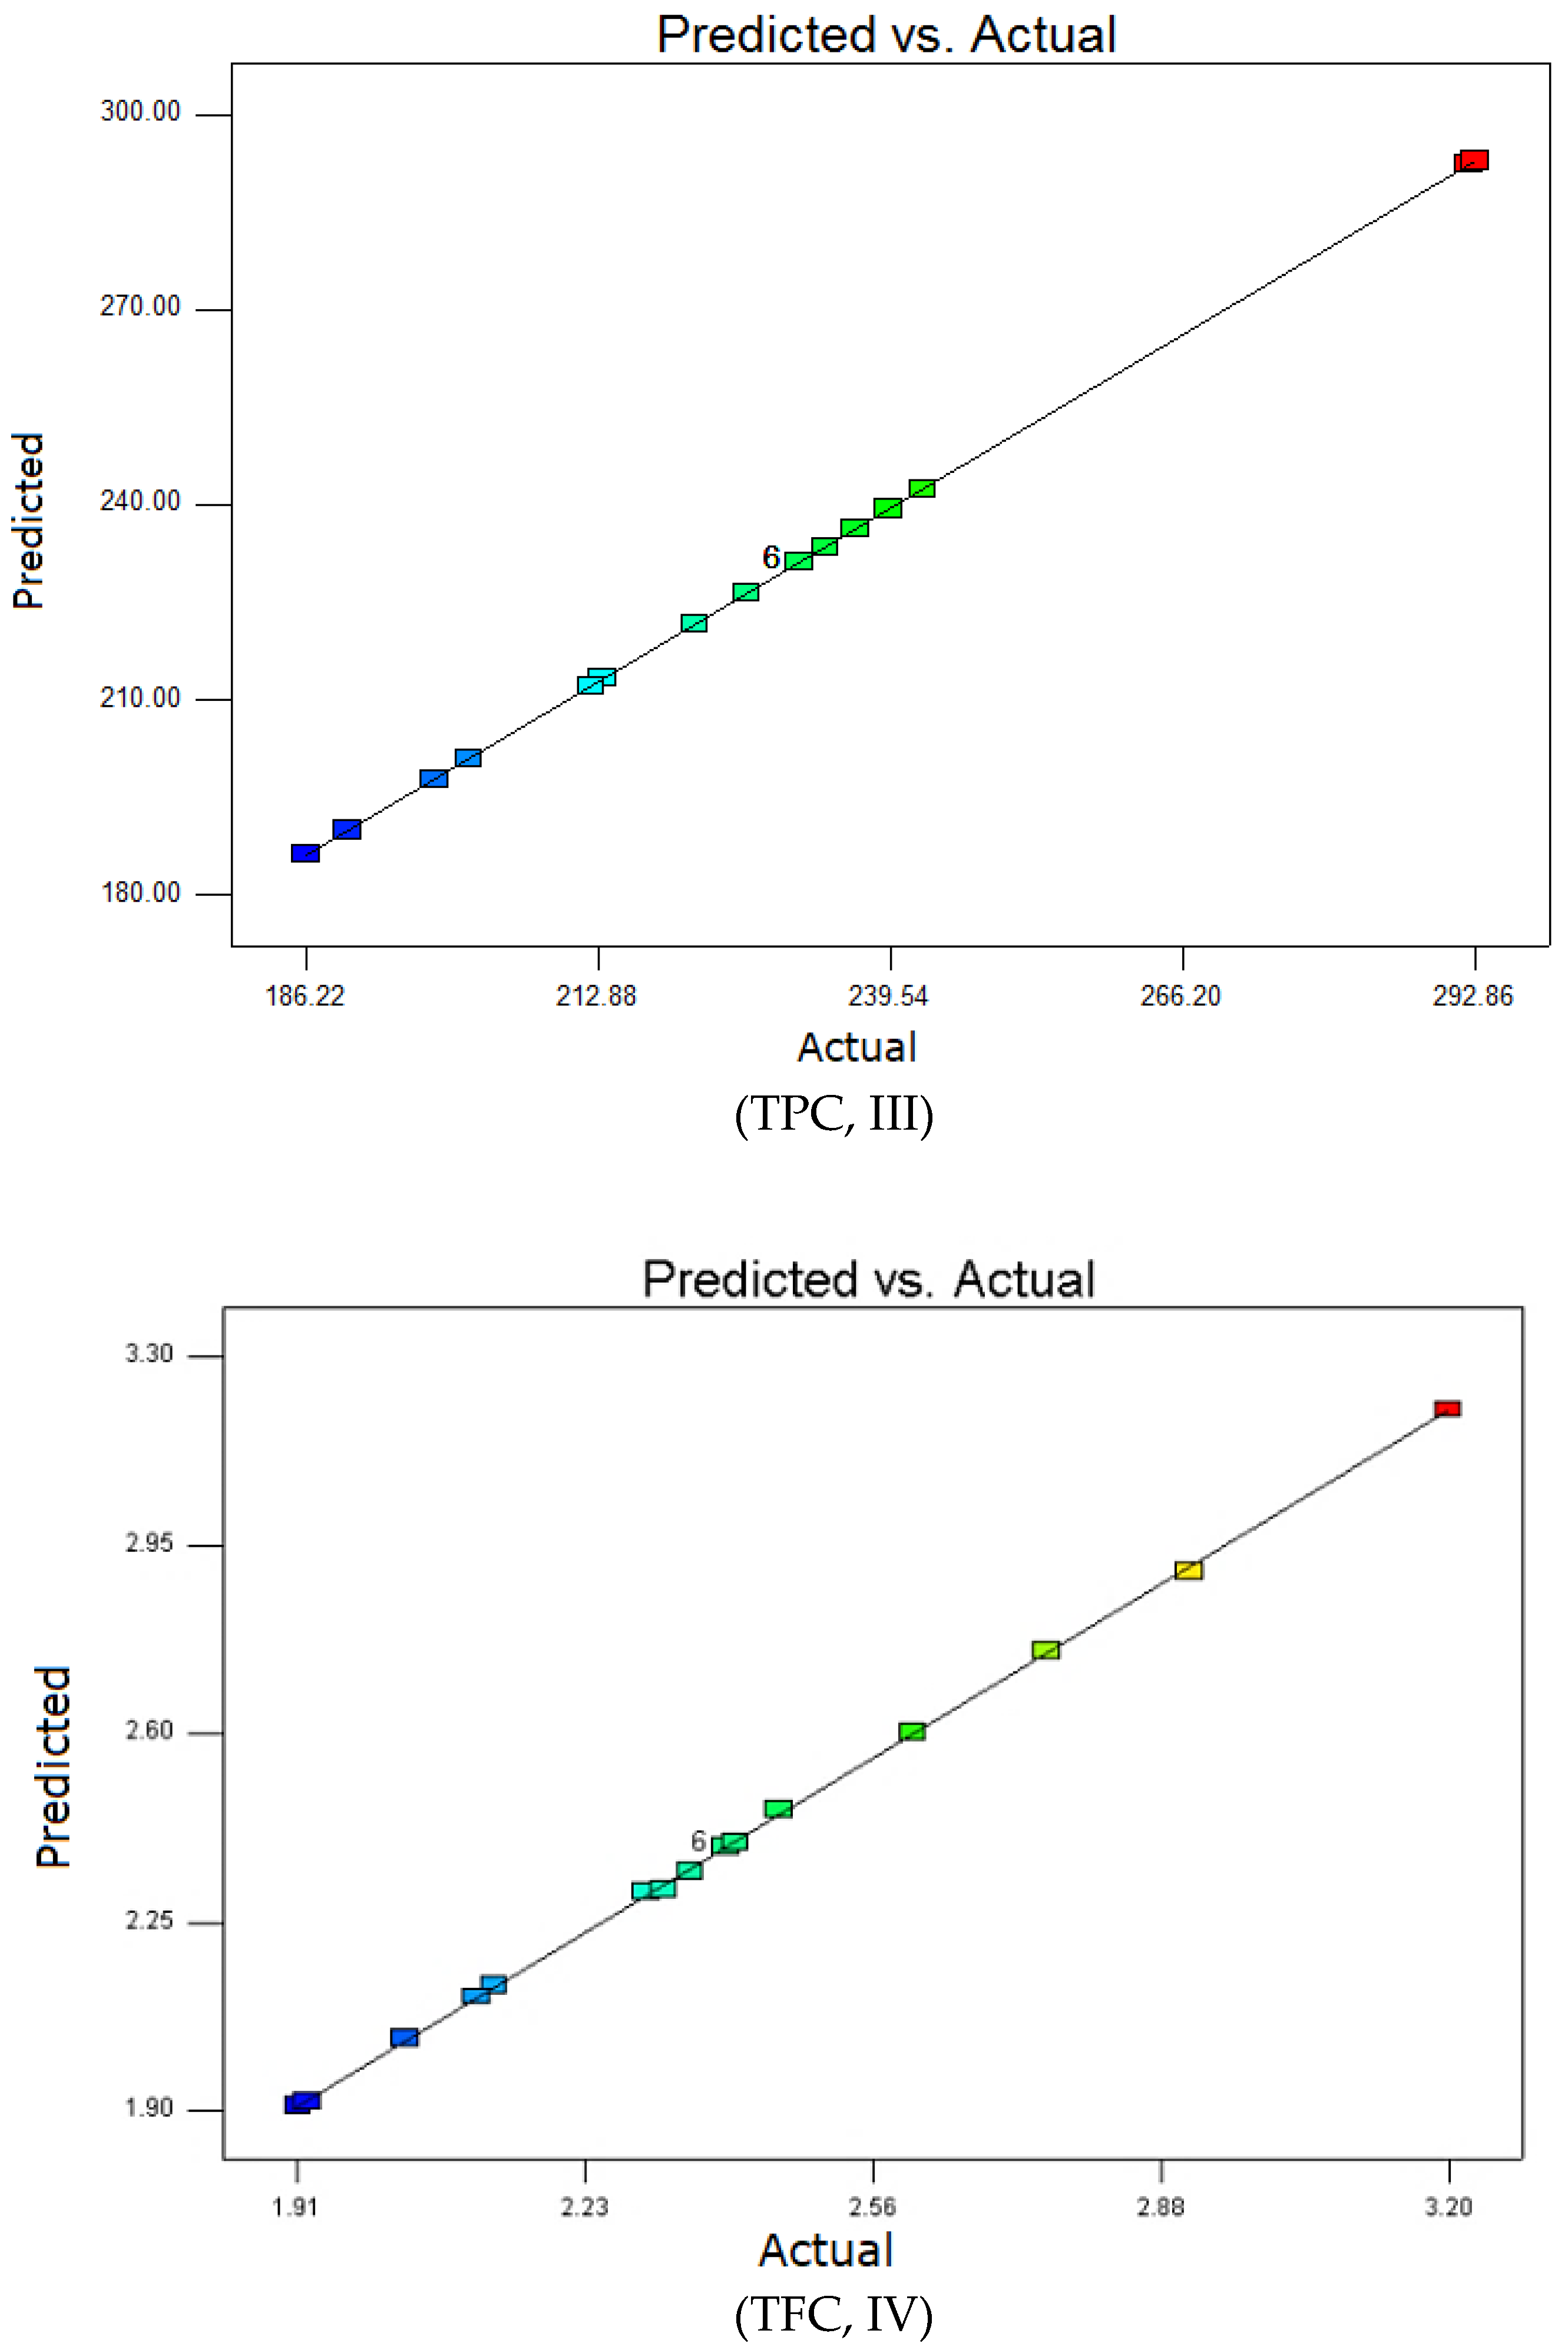
2.1. Model Fitting
2.2. Free Radical Scavenging Activity, DPPH
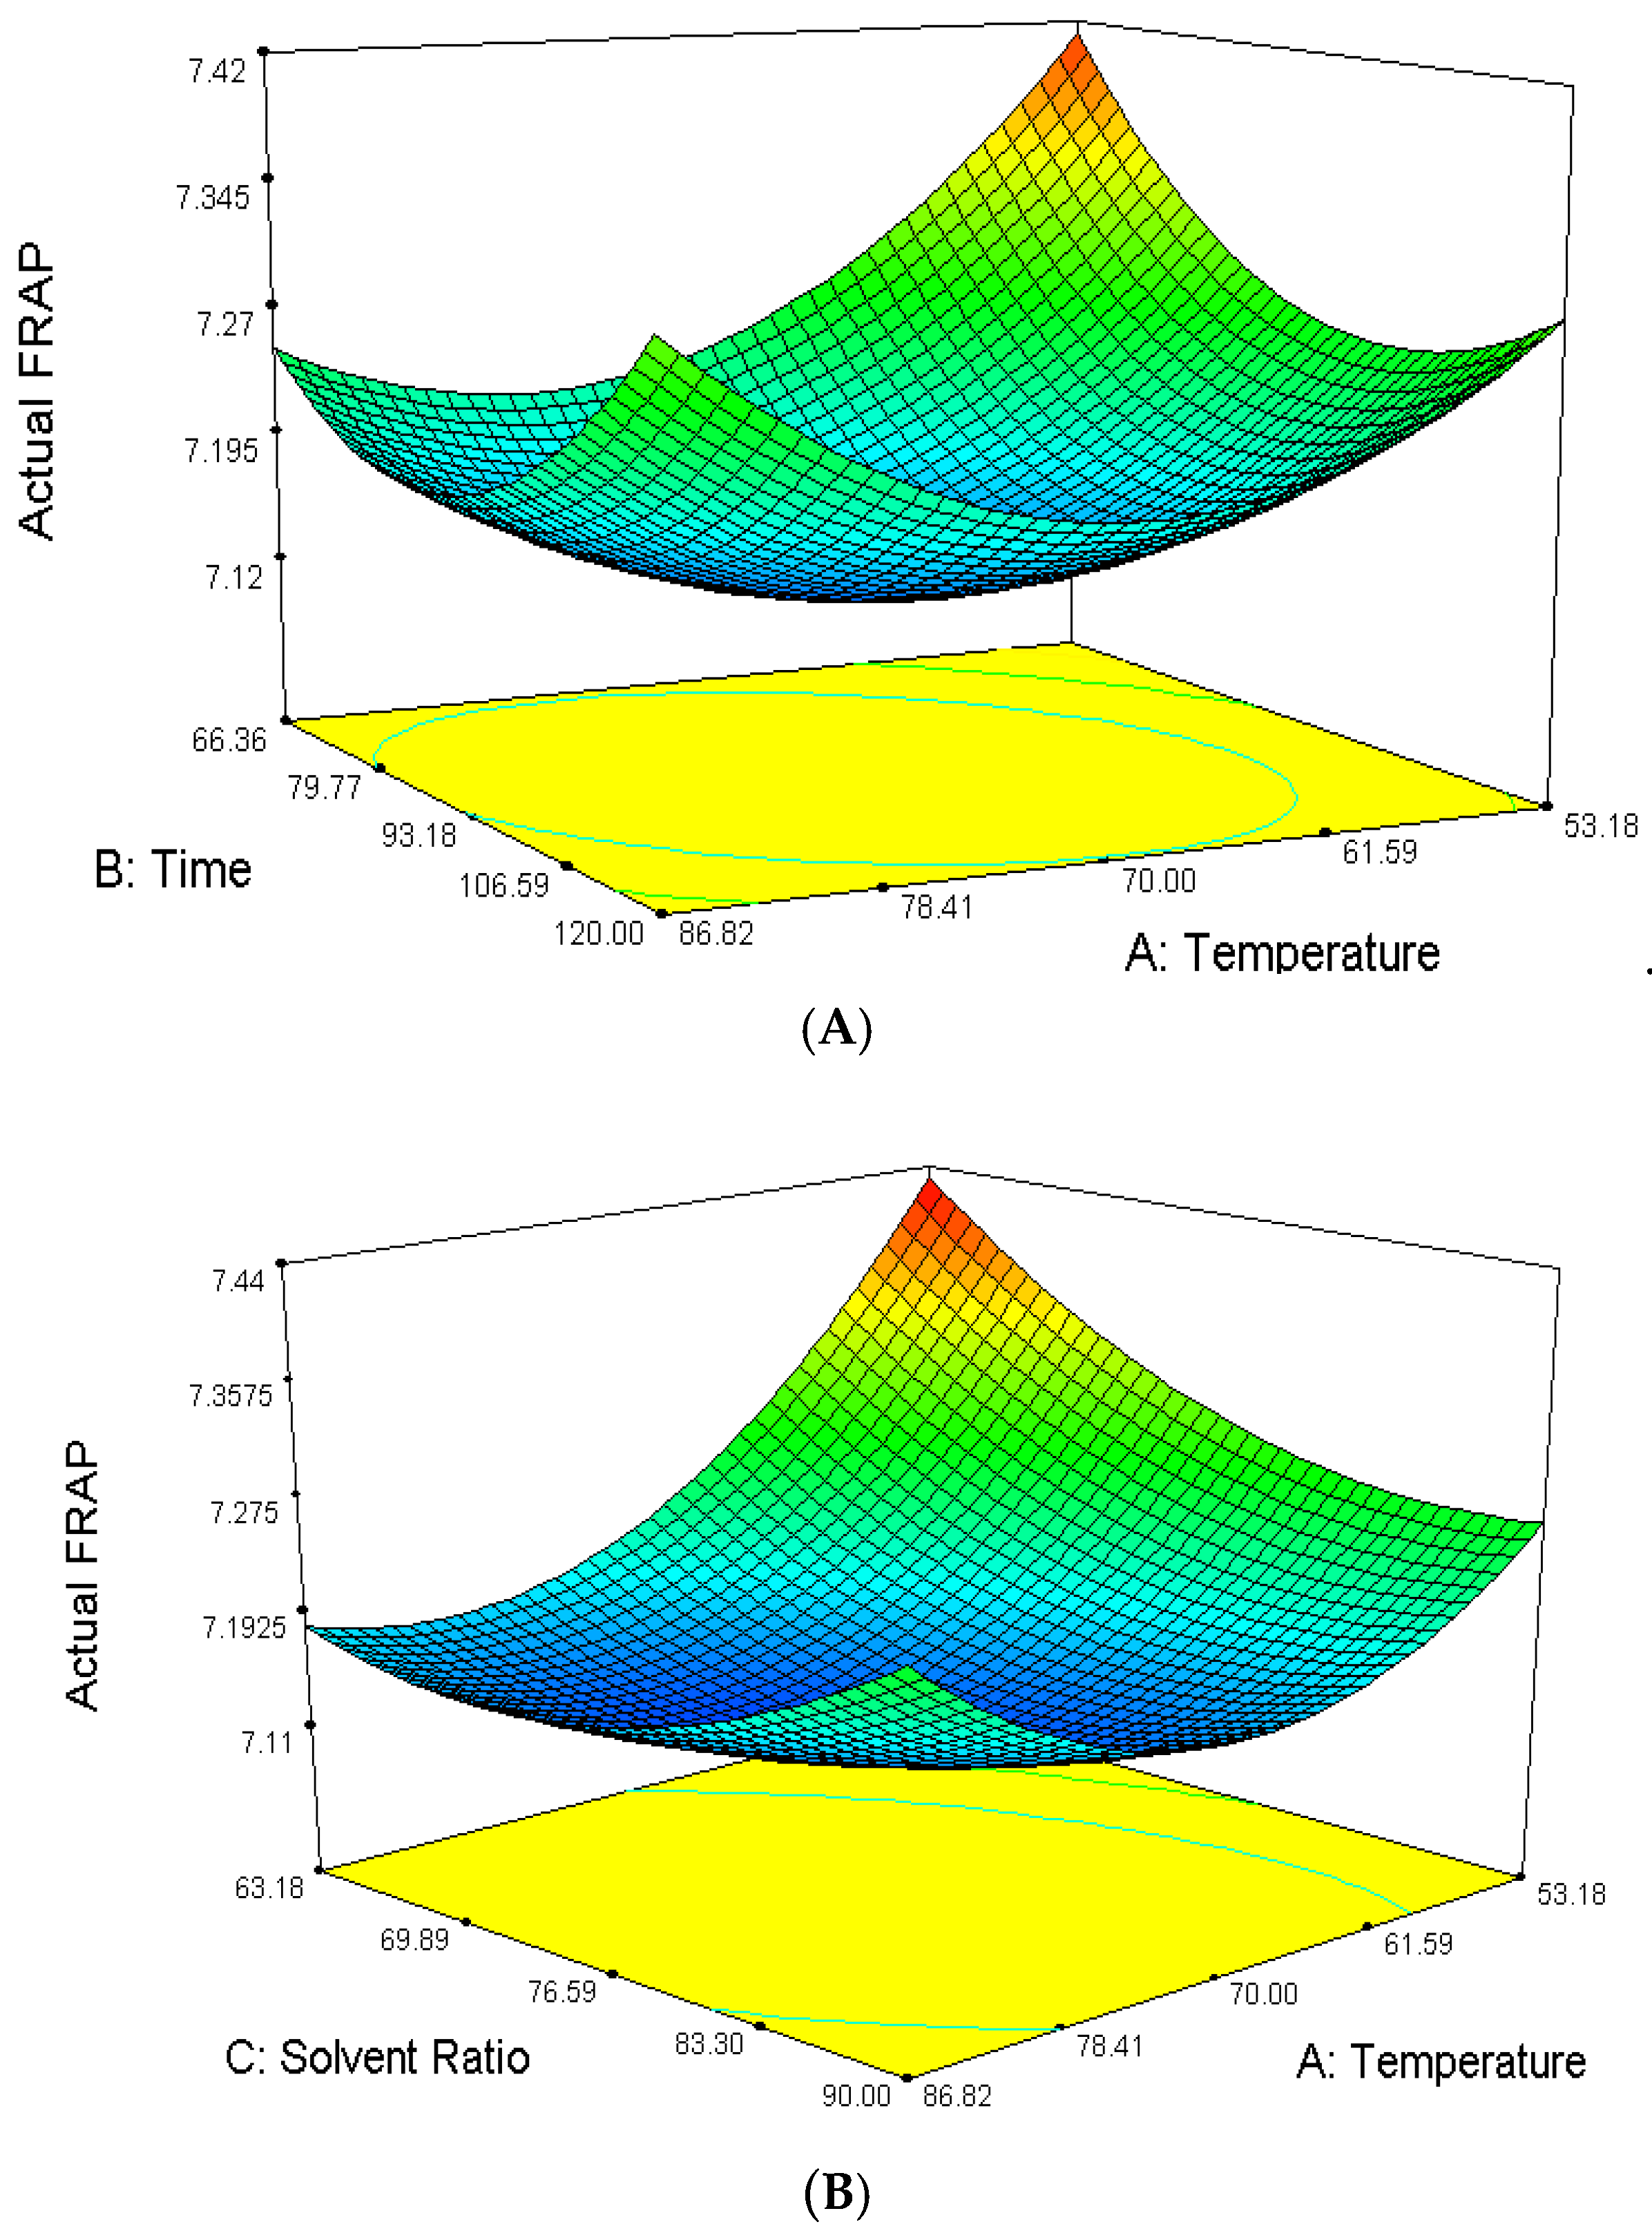
2.3. Ferric Ion Reducing Power Assay, FRAP
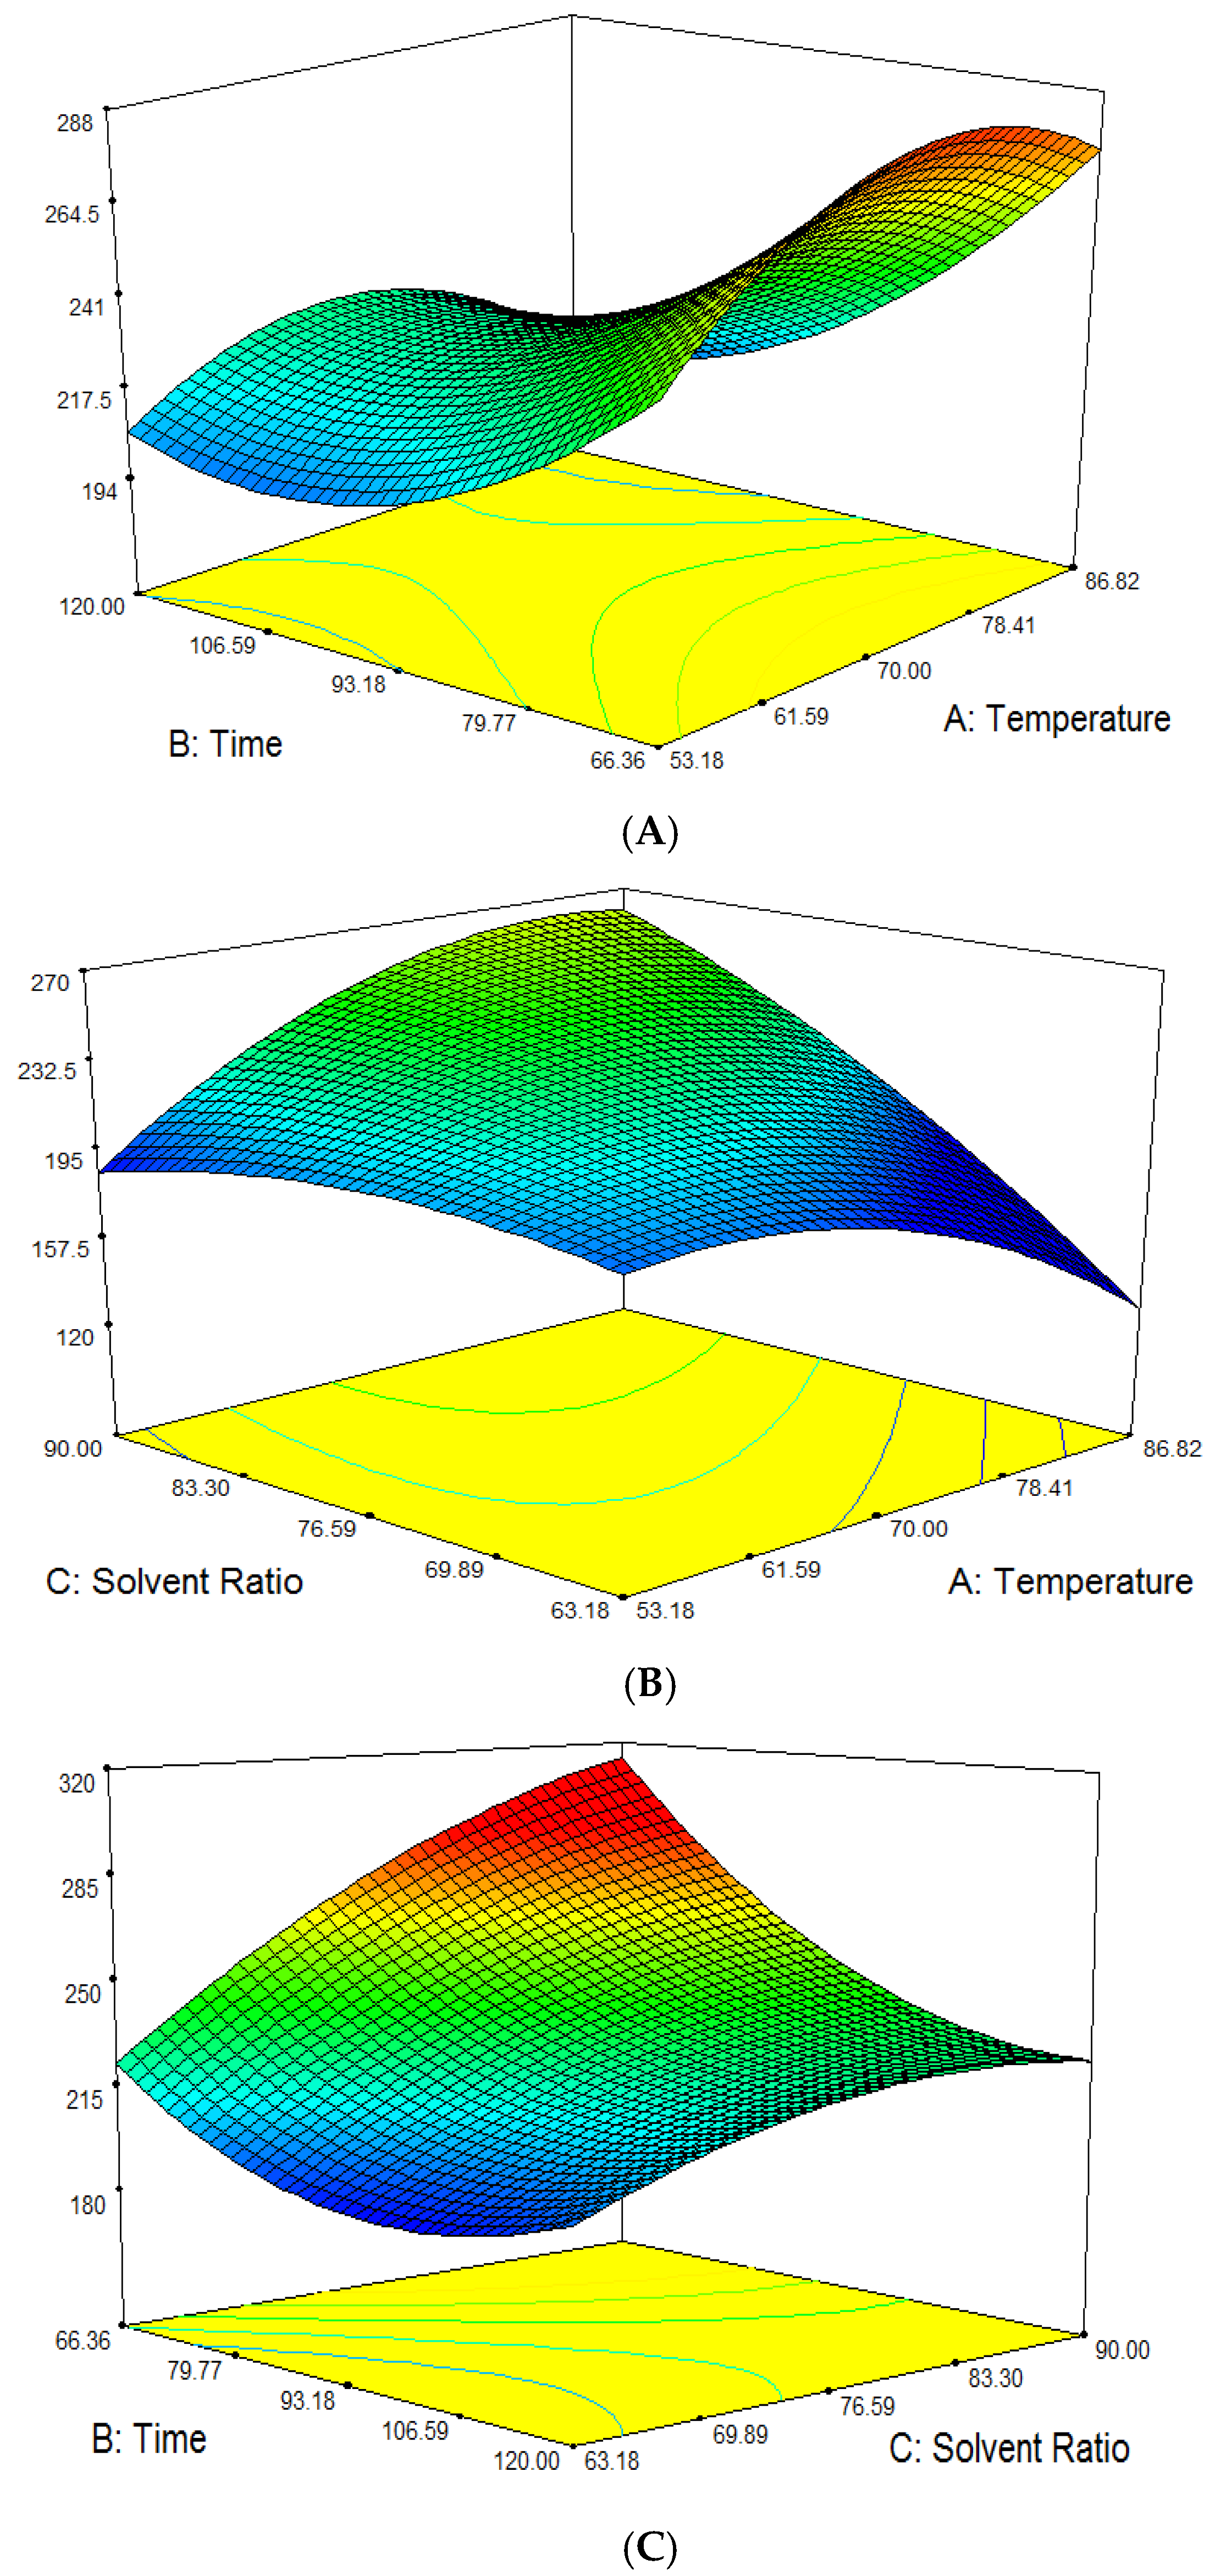
2.4. Total Phenolic Content, TPC
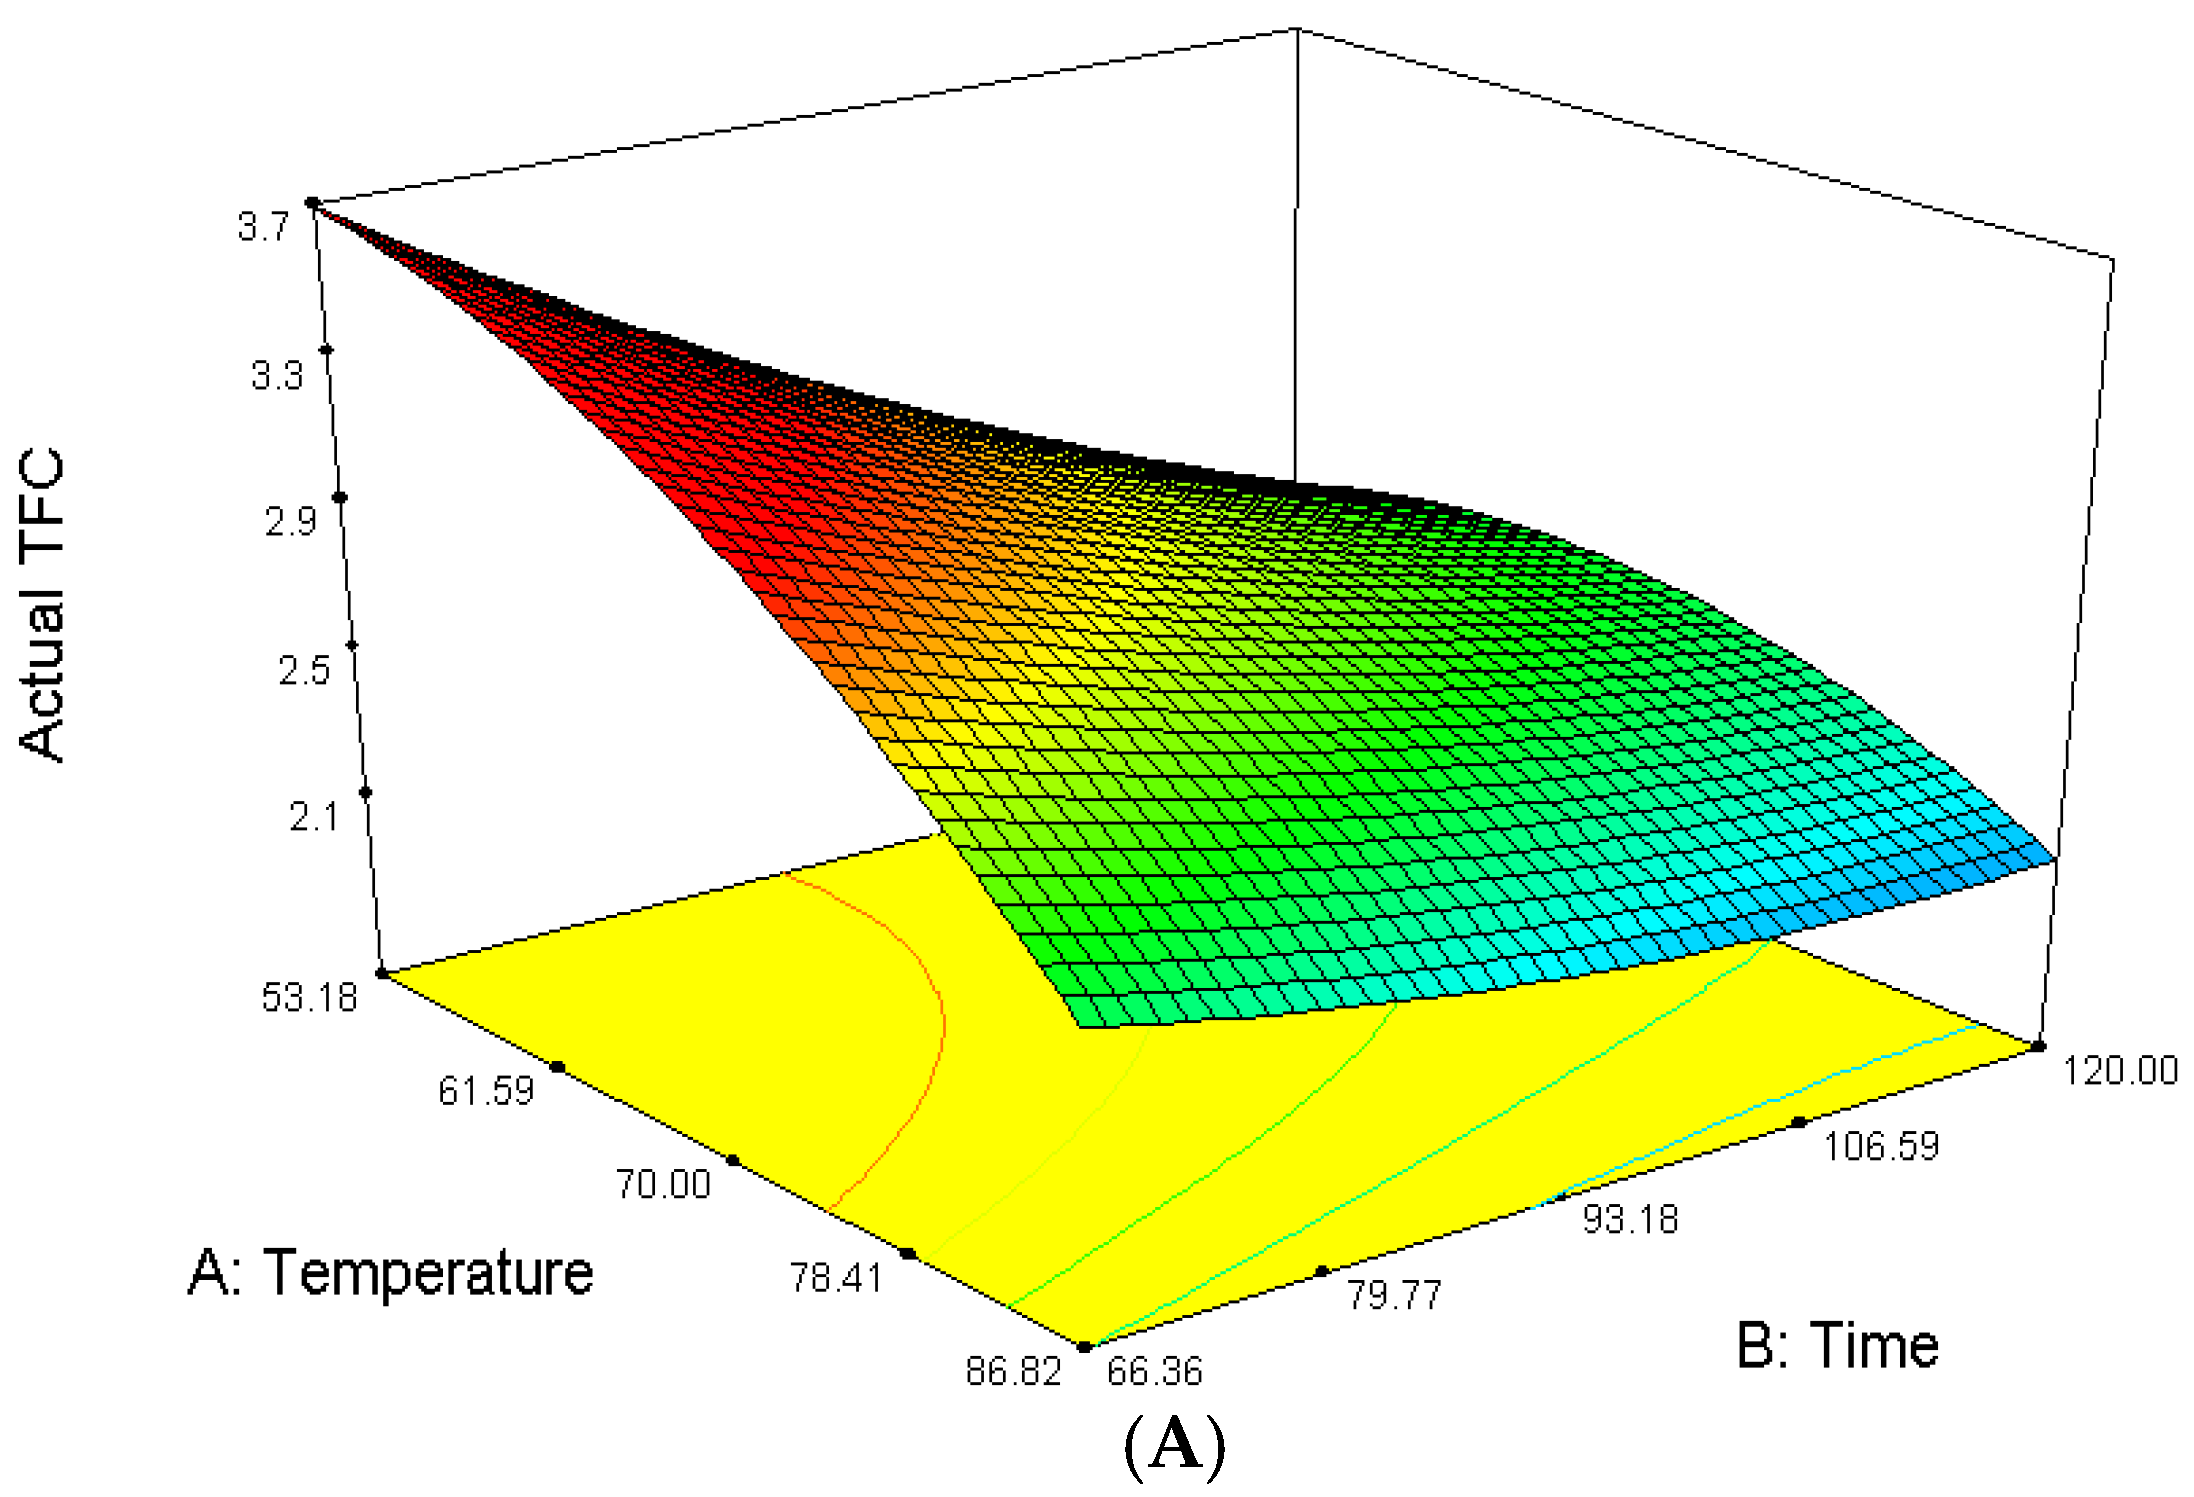
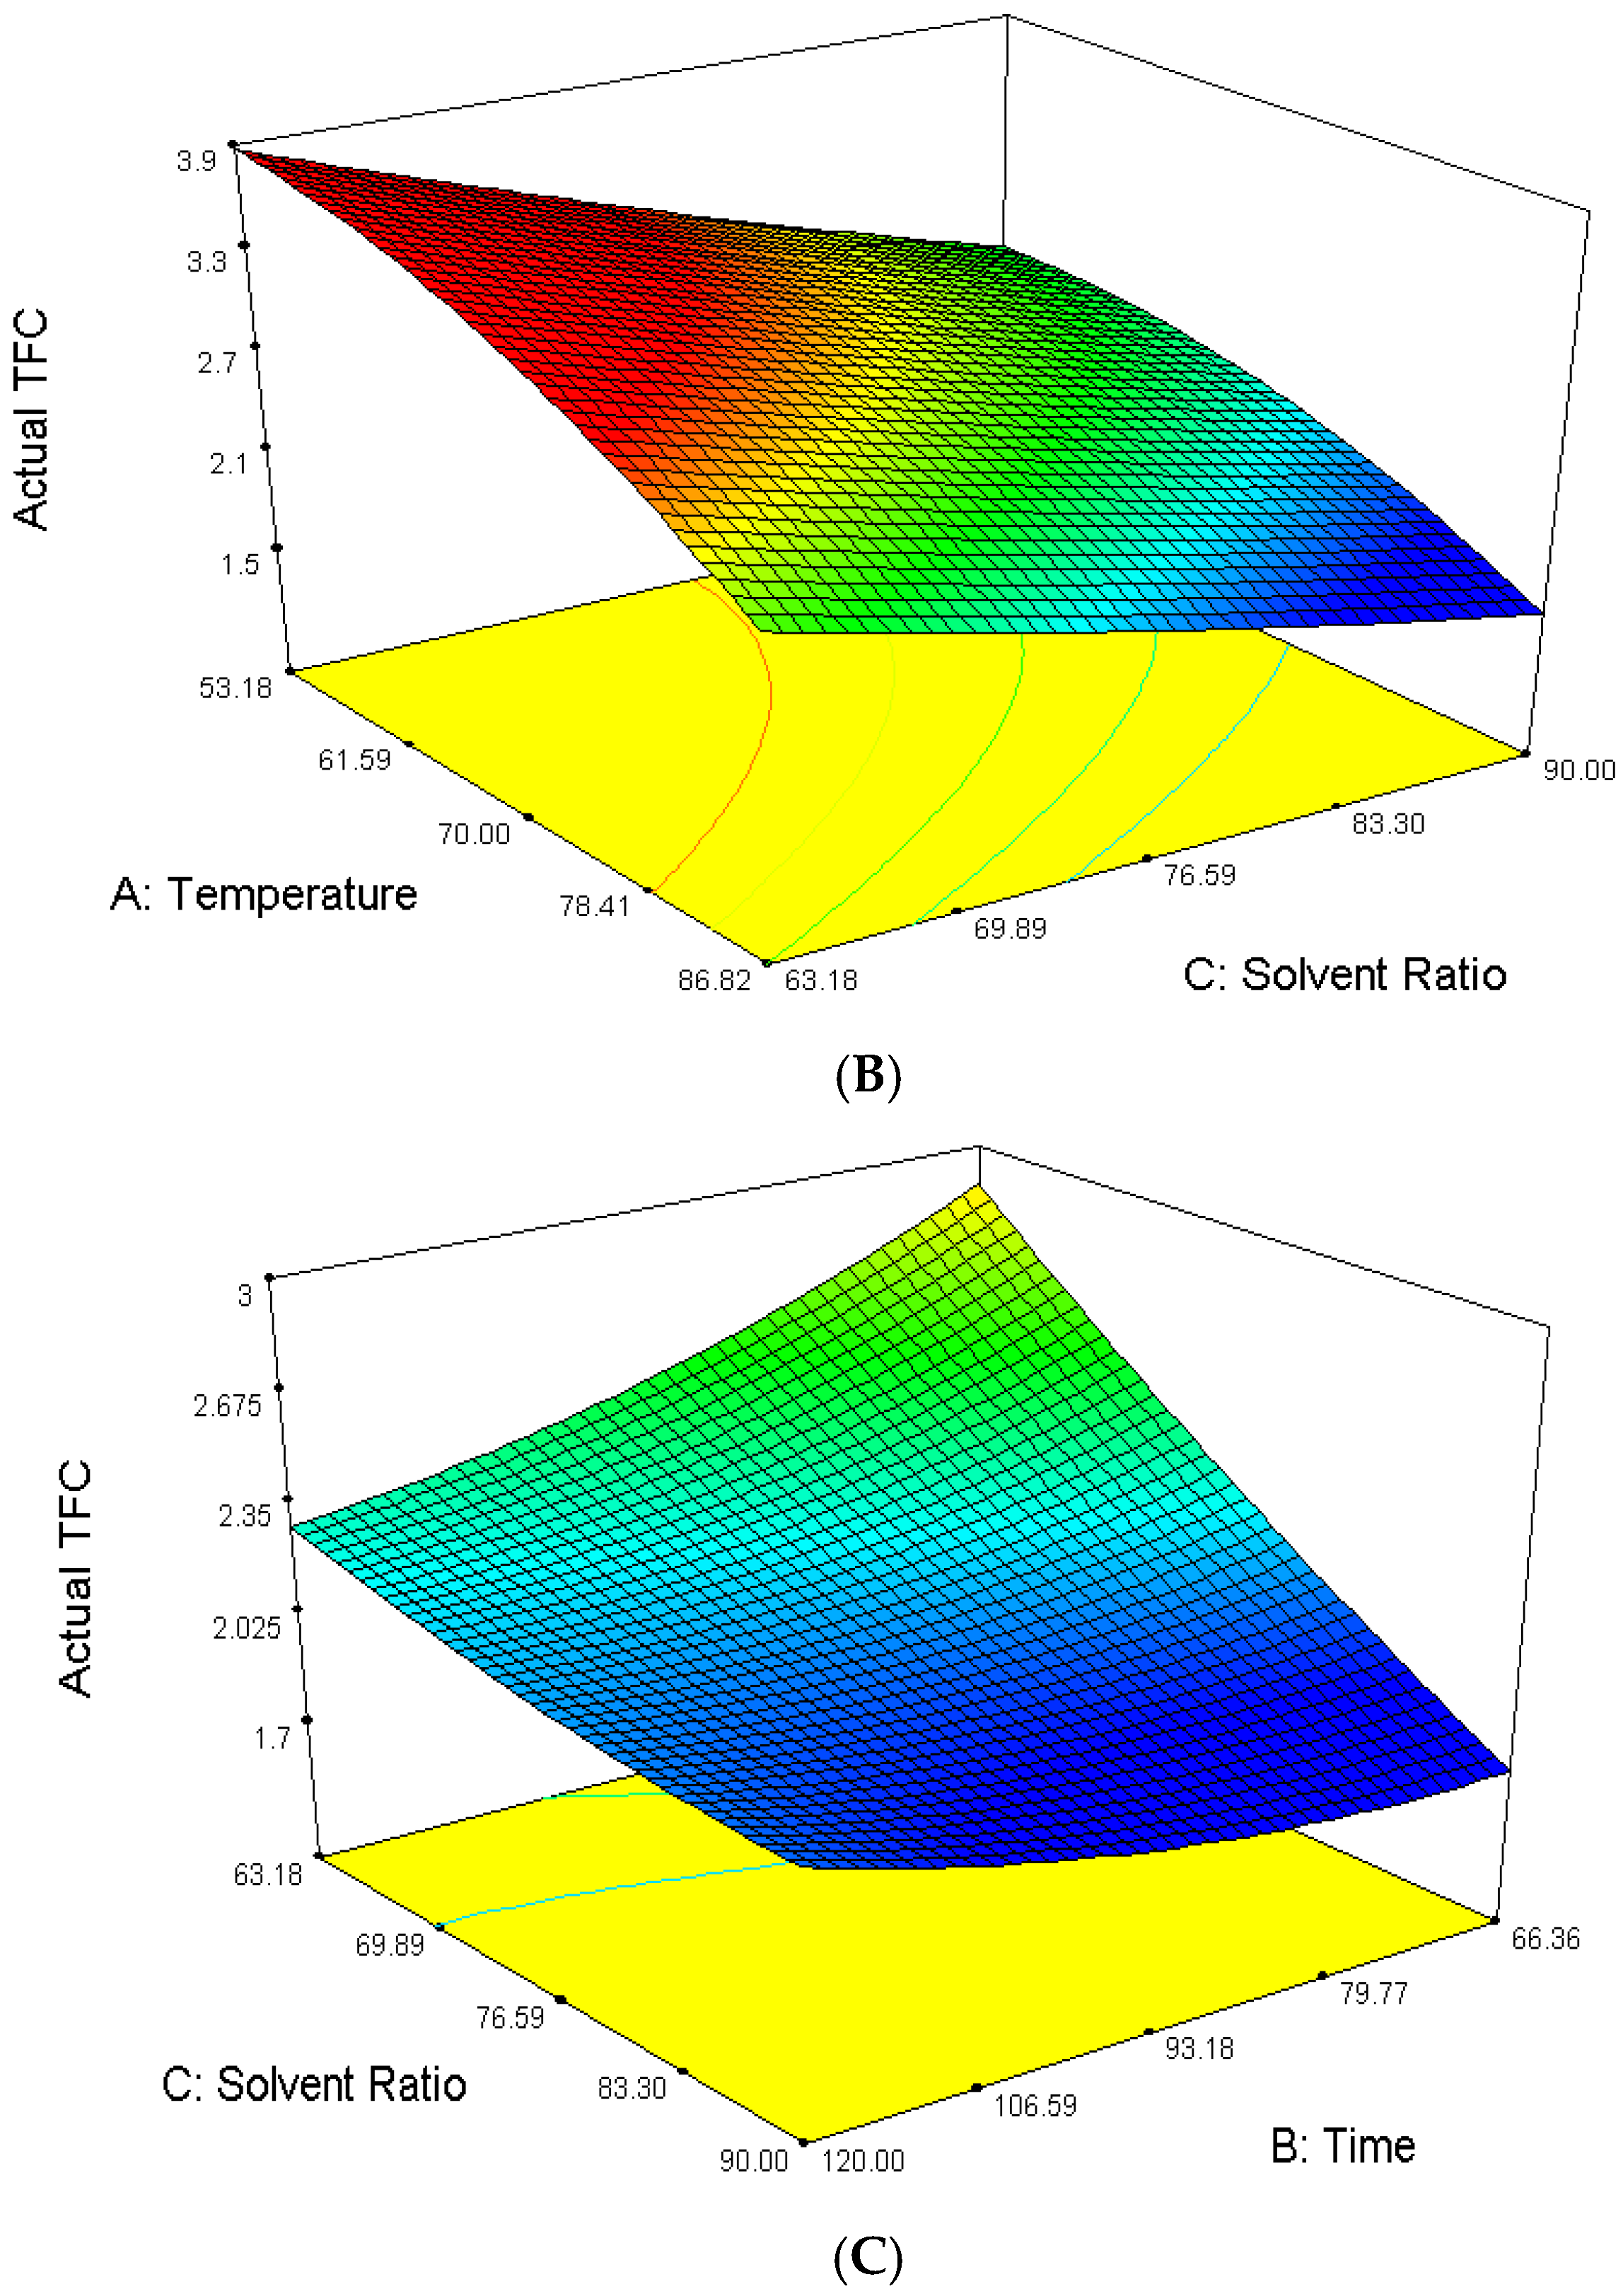
2.5. Total Flavonoid Content, TFC
2.6. FTIR Analysis
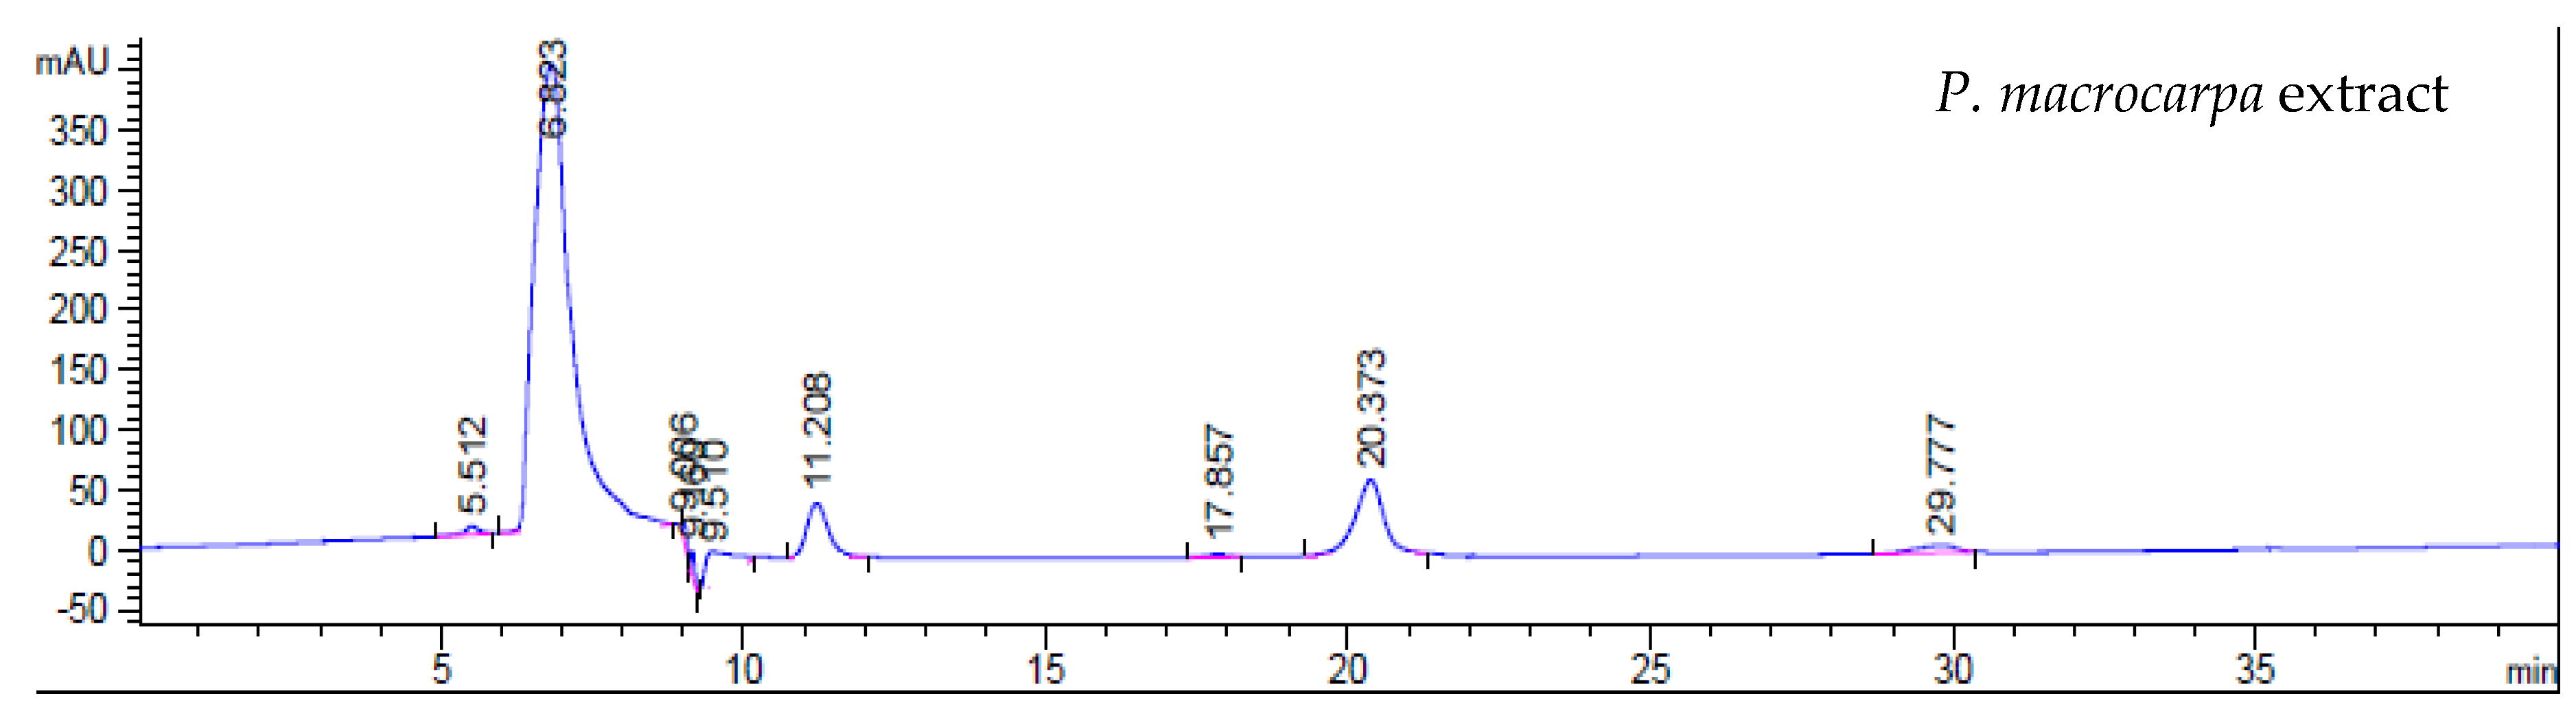
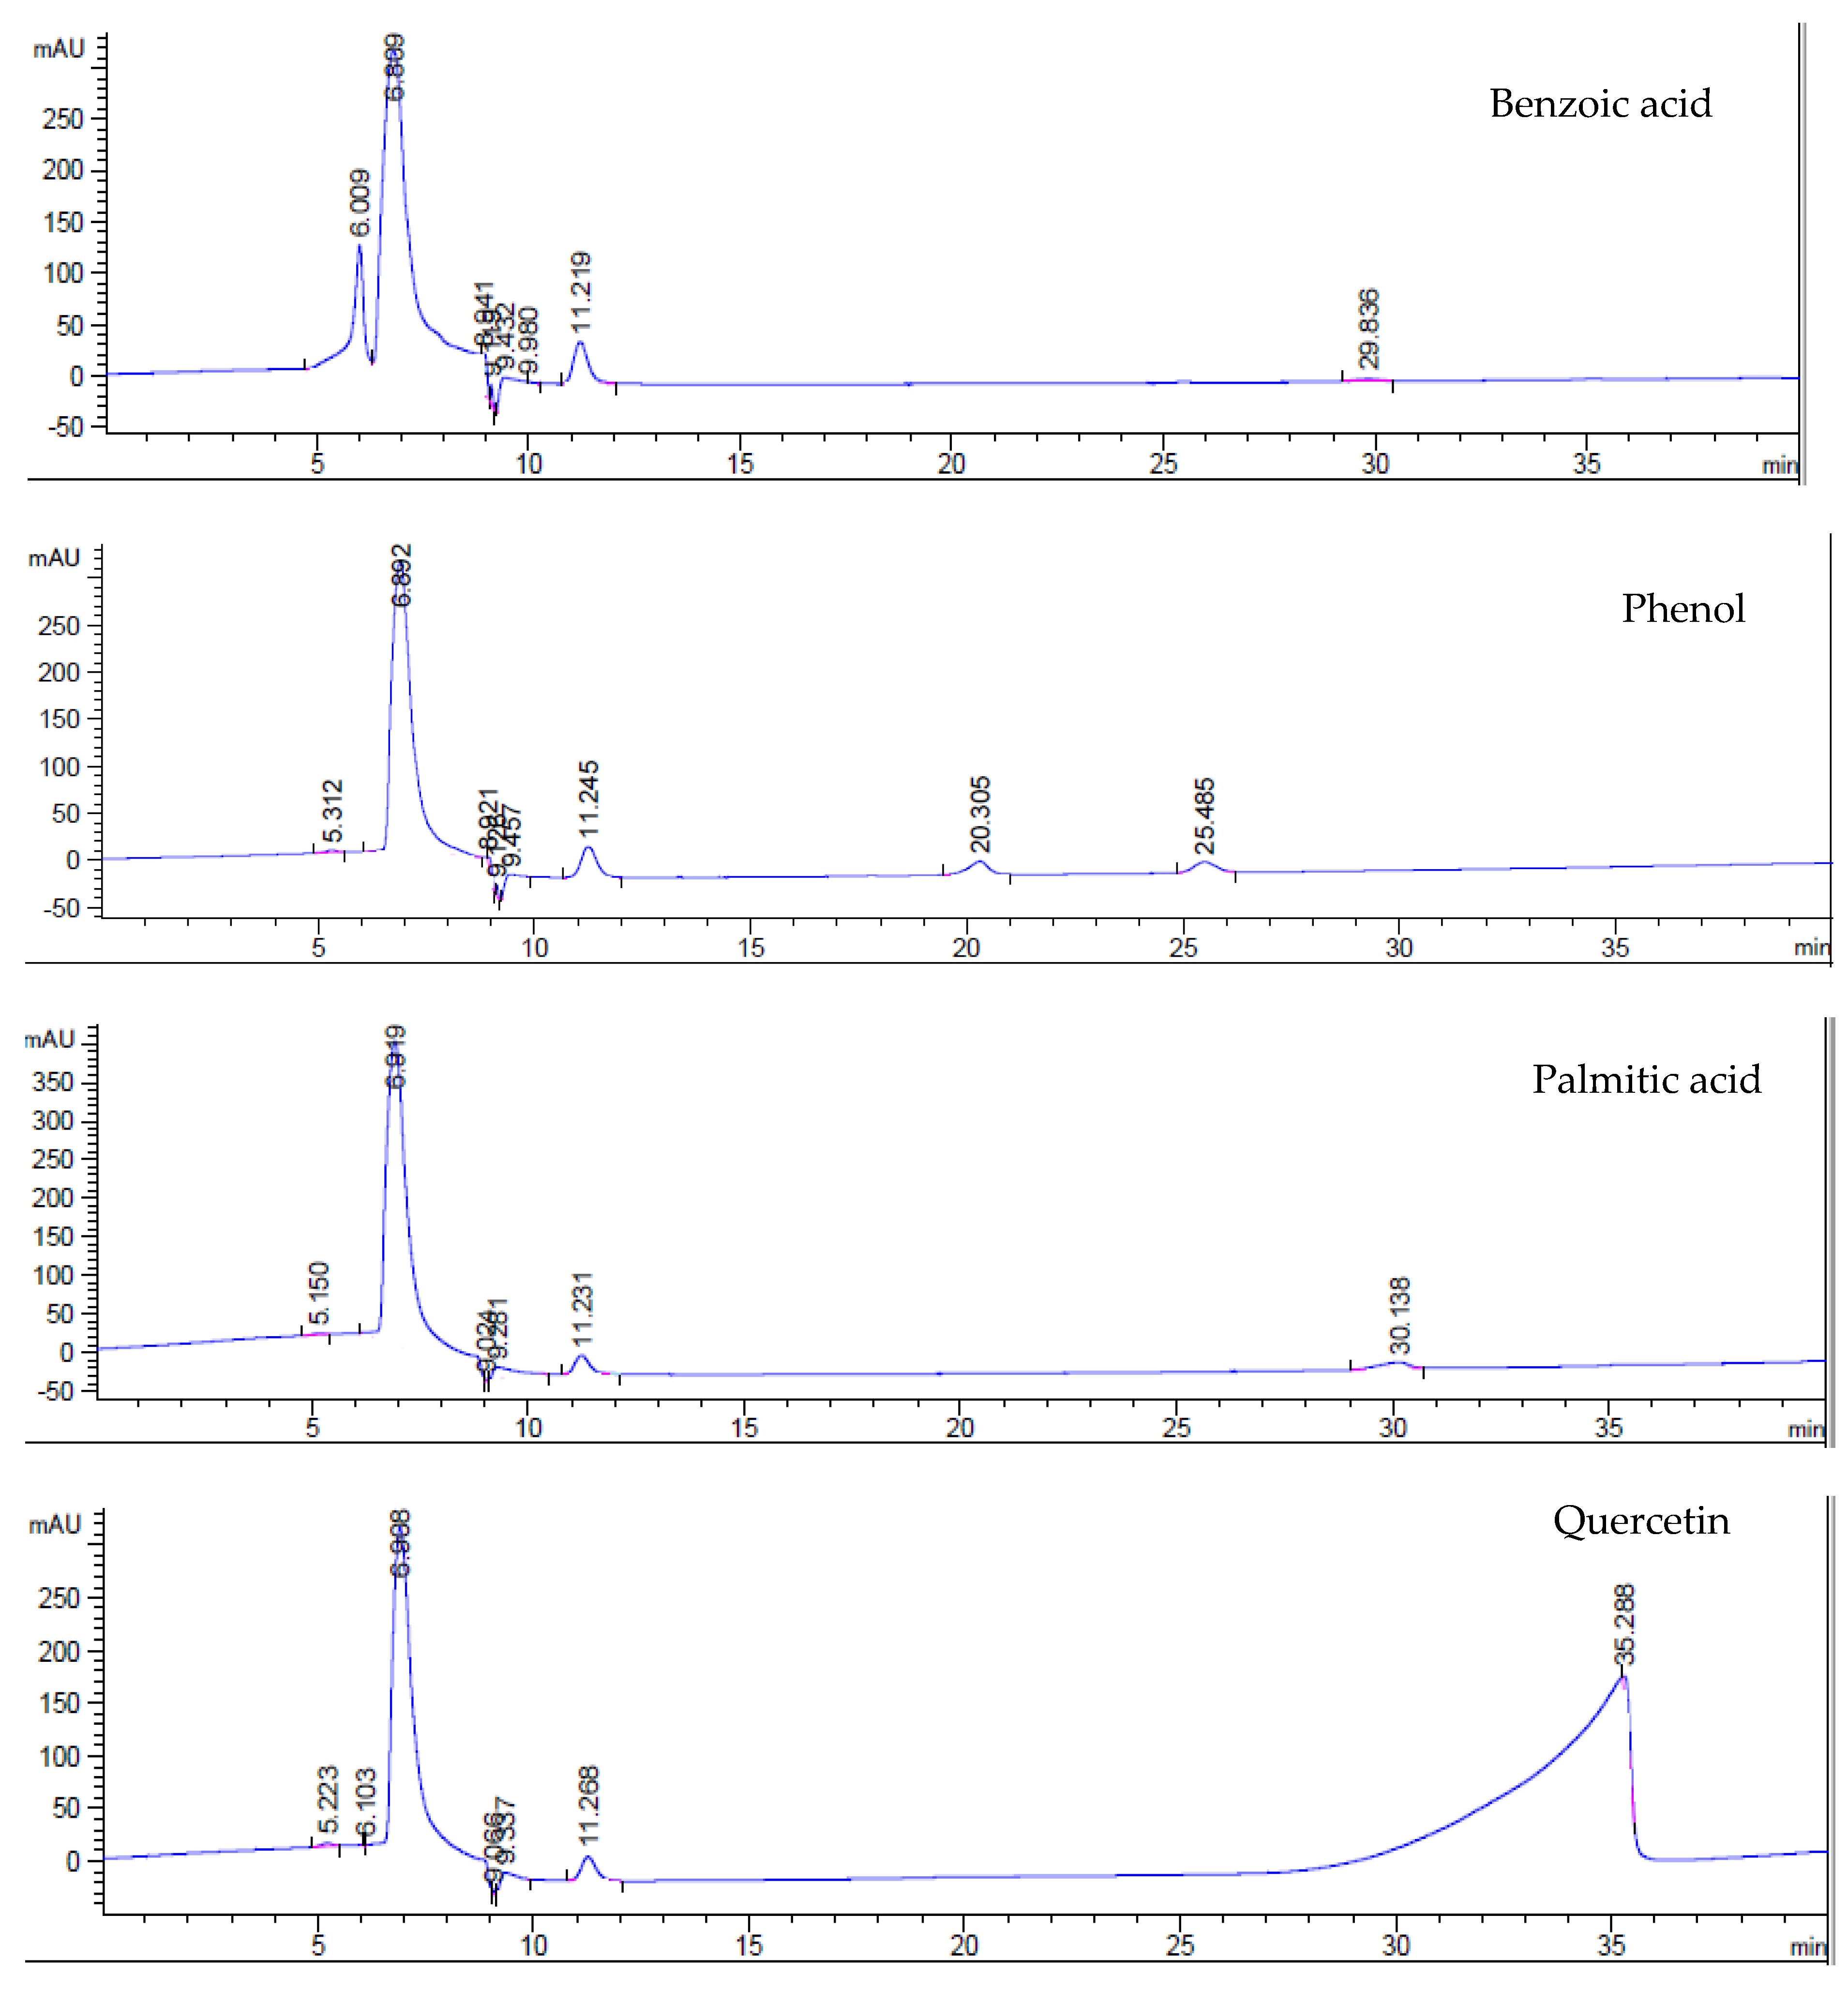
2.7. HPLC Analysis
2.8. Optimization of Extraction Conditions
3. Experimental Section
3.1. Plant Material and Chemicals
3.2. Extraction Procedure
3.3. Optimization of P. macrocarpa Extraction Using RSM
3.3.1. Experimental Design
3.3.2. Response Surface and Contour Plot
3.3.3. Statistical Analysis and Optimization of the Response
3.3.4. Verification of Models
3.4. Antioxidant Tests
3.4.1. DPPH Free Radical Scavenging
3.4.2. Ferric Reducing-Antioxidant Power (FRAP)
3.4.3. Determination of Total Phenolic Content (TPC)
3.4.4. Determination of Total Flavonoid Content (TFC)
3.5. Phytochemical Screening of P. macrocarpa Fruit
3.5.1. Fourier Transform Infrared Spectroscopy, FTIR
3.5.2. High Performance Liquid Chromatography, HPLC
4. Conclusions
Supplementary Materials
Supplementary File 1Acknowledgments
Author Contributions
Conflicts of Interest
References
- Gong, Y.; Hou, Z.; Gao, Y.; Xue, Y.; Liu, X.; Liu, G. Optimization of extraction parameters of bioactive components from defatted marigold (Tageteserecta L.) residue using response surface methodology. Food Bioprod. Process. 2012, 90, 9–16. [Google Scholar] [CrossRef]
- Kumar, S.; Kumar, D.; Singh, N.; Vasisht, B.D. In vitro, free radicals scavenging and antioxidant activity of Moringa Oleifera pods. J. Herbs Med. Toxicol. 2007, 1, 17–22. [Google Scholar]
- Winarto, W.P. Mahkota Dewa: Budidaya dan Pemanfaatan Untuk Obat; Penebar Swadaya: Jakarta, Indonesia, 2003. [Google Scholar]
- Sufi, A. Lignans in Phaleria Macrocarpa (Scheff.) Boerl. and in Linum Flavum var Compactum L; Faculty of Mathematics and Natural Sciences, Heinrich-Heine-University Dusseldorf: Mataram, Indonesia, 2007; p. 104. [Google Scholar]
- Hendra, R.; Ahmad, S.; Sukari, A.; Shukor, M.Y.; Oskoueian, E. Flavonoid Analyses and Antimicrobial Activity of Various Parts of Phaleria macrocarpa (Scheff.) Boerl Fruit. Int. J. Mol. Sci. 2011, 12, 3422–3431. [Google Scholar] [CrossRef] [PubMed]
- Kurnia, D.; Akiyama, K.; Hayashi, H. 29-Norcucurbitacin derivative isolated from Indonesian medicinal plant, Phaleria macrocarpa (Scheff.) Boerl. Biosci. Biotechnol. Biochem. 2008, 72, 618–620. [Google Scholar] [CrossRef] [PubMed]
- Ali, R.B.; Atangwho, I.J.; Kaur, N.; Abraika, O.S.; Ahmad, M.; Mahmud, R.; Asmawi, M.Z. Bioassay-guided antidiabetic study of Phaleria macrocarpa fruit extract. Molecules 2012, 17, 4986–5002. [Google Scholar] [CrossRef] [PubMed]
- Hending, W.; Ermin, K.W. Benzophenone glucoside isolated from the ethyl acetate extract of the bark of mahkota dewa Phaleria macrocarpa (Scheff.) Boerl. and its inhibitory activity on leukemia L1210 cell line. Ind. J. Chem. 2009, 9, 142–145. [Google Scholar]
- Altaf, R.; Asmawi, M.Z.; Bin Dewa, A.; Sadikun, A.; Umar, M.I. Phytochemistry and medicinal properties of Phaleria macrocarpa (Scheff.) Boerl. extracts. Pharmacogn. Rev. 2013, 7, 73–80. [Google Scholar] [CrossRef] [PubMed]
- Lay, M.M.; Karsani, S.A.; Banisalam, B.; Mohajer, S.; Abd Malek, S.N. Antioxidants, Phytochemicals, and Cytotoxicity Studies on Phaleria macrocarpa (Scheff.) Boerl Seeds. BioMed Res. Int. 2014, 2014, 1–13. [Google Scholar]
- Sanjoy, S.; Ghanapriya, N. Chemical Constituents and Antibacterial Activity of Phaleria macrocarpa (Scheff.) Boeal. Int. J. Pharm. Sci. Res. 2014, 5, 3157–3162. [Google Scholar]
- Azmir, J.; Zaidul, I.S.M.; Rahman, M.M.; Sharif, K.M.; Sahena, F.; Jahurul, M.H.A.; Mohamed, A. Optimization of oil yield of Phaleria macrocarpa seed using response surface methodology and its fatty acids constituents. Ind. Crops Prod. 2014, 52, 405–412. [Google Scholar] [CrossRef]
- Jiménez-Contreras, E.; Torres-Salinas, D.; Moreno, R.B.; Baños, R.R. Response Surface Methodology and Its Application in Evaluating Scientific Activity. Scientometrics 2009, 79, 201–218. [Google Scholar] [CrossRef]
- Bae, I.K.; Ham, H.M.; Jeong, M.H.; Kim, D.H.; Kim, H.J. Simultaneous determination of 15 phenolic compounds and caffeine in teas and mate using RPHPLC/UV detection: Method development and optimization of extraction process. Food Chem. 2015, 172, 469–475. [Google Scholar] [CrossRef] [PubMed]
- Kamaludin, N.H.I.; Mun, L.S.; Sa’adi, R.A. Evaluation of Antioxidant Activity of Some Tropical Fruit Peel Extracts: Extraction Conditions Optimization of Rambutan Peel Extract. ARPN J. Eng. Appl. Sci. 1997, 11, 1623–1631. [Google Scholar]
- Khoo, H.E.; Azlan, A.; Ismail, A.; Abas, F. Response surface methodology optimization for extraction of phenolics and antioxidant capacity in defatted dabai parts. Sains Malaysia 2013, 42, 949–954. [Google Scholar]
- Arruda, H.S.; Pereira, G.A.; Pastore, G.M. Optimization of Extraction Parameters of Total Phenolics from Annona crassiflora Mart. (Araticum) Fruits Using Response Surface Methodology. Food Anal. Methods 2016, 10, 100–110. [Google Scholar] [CrossRef]
- Abad-García, B.; Berrueta, L.A.; López-Márquez, D.M.; Crespo-Ferrer, I.; Gallo, B.; Vicente, F. Optimization and validation of a methodology based on solvent extraction and liquid chromatography for the simultaneous determination of several polyphenolic families in fruit juices. J. Chromatogr. A 2007, 1154, 87–96. [Google Scholar] [CrossRef] [PubMed]
- Chirinos, R.; Rogez, H.; Camposa, D.; Pedreschi, R.; Larondelle, Y. Optimization of extraction conditions of antioxidant phenolic compounds from mashua (Tropaeolum tuberosum Ruiz & Pavon) tubers. Sep. Purif. Technol. 2007, 55, 217–225. [Google Scholar]
- Pinelo, M.; Fabro, P.D.; Manzocco, L.; Nunez, M.J.; Nicoli, M.C. Optimization of continuos phenol extraction from Vitisvinifera byproducts. Food Chem. 2005, 92, 109–117. [Google Scholar] [CrossRef]
- Silva, E.; Rogez, H.; Larondelle, Y. Optimization of extraction of phenolics from Inga edulis leaves using response surface methodology. Sep. Purif. Technol. 2007, 55, 381–387. [Google Scholar] [CrossRef]
- Liyanapathirana, C.; Shahidi, F. Optimization of extraction of phenolic compounds from wheat using response surface methodology. Food Chem. 2005, 93, 47–56. [Google Scholar] [CrossRef]
- Shi, J.; Yu, J.; Pohorly, J.; Young, J.C.; Bryan, M.; Wu, Y. Optimization of the extraction of polyphenols from grape seed meal by aqueous ethanol solution. Food Agric. Environ. 2003, 1, 42–47. [Google Scholar]
- Chan, S.W.; Lee, C.Y.; Yap, C.F.; Wan Aida, W.M.; Ho, C.W. Optimisation of extraction conditions for phenolic compounds from limau purut (Citrus hystrix) peels. Int. Food Res. J. 2009, 16, 203–213. [Google Scholar]
- Bassani, D.C.; Nunes, D.S.; Granato, D. Optimization of phenolics and flavonoids extraction conditions and antioxidant activity of roasted yerba-mate leaves (Ilex paraguariensis A. St.-Hil., Aquifoliaceae) using response surface methodology. Anais Da Academia Brasileira de Ciencias 2014, 86, 923–934. [Google Scholar] [CrossRef]
- Myers, R.H.; Montgomery, D.C. Response Surface Methodology: Process and Product Optimization Using Designed Experiments; John Wiley and Sons, Inc.: Hoboken, NJ, USA, 2002; p. 704. [Google Scholar]
- Wang, S.; Chen, F.; Wu, J.; Wang, Z.; Liao, X.; Hu, X. Optimization of pectin extraction assisted by microwave from apple pomace using response surface methodology. J. Food Eng. 2007, 78, 693–700. [Google Scholar] [CrossRef]
- M anivannan, P.; Rajasimman, M. Optimization of process parameters for the osmotic dehydration of beetroot in sugar solution. J. Food Process Eng. 2011, 34, 804–825. [Google Scholar] [CrossRef]
- Yim, H.S.; Chye, F.Y.; Rao, V.; Low, J.Y.; Matanjun, P.; How, S.E.; Ho, C.W. Optimization of Extraction Time and Temperature on Antioxidant Activity of Schizophyllum Commune Aqueous Extract Using Response Surface Methodology. J. Food Sci. Technol. 2013, 50, 275–283. [Google Scholar] [CrossRef] [PubMed]
- Negi, P.S.; Chauhan, A.S.; Sadia, G.A.; Rohinishree, Y.S.; Ramteke, R.S. Antioxidant and antibacterial activities of various sea buck thorn (Hippophaerhamnoides L.) seed extracts. Food Chem. 2005, 92, 119–124. [Google Scholar] [CrossRef]
- Cacace, J.E.; Mazza, G. Mass transfer process during extraction of phenolic compounds from milled berries. J. Food Eng. 2003, 59, 379–389. [Google Scholar] [CrossRef]
- He, G.Q.; Xiong, H.P.; Chen, Q.H.; Ruan, H.; Wang, Z.Y.; Traore, L. Optimization of conditions for supercritical fluid extraction of flavonoids from hops (Humuluslupulus L.). J. Zhejiang Univ. Sci. B 2005, 6, 999–1004. [Google Scholar] [CrossRef] [PubMed]
- Kumar, S.T.; Baskar, R.; Shanmugam, S.; Rajsekaran, P.; Sadasivam, S.; Manikandan, V. Optimization of flavonoids extraction from the leaves of Tabernaemontanaheyneana Wall. Using L16 Orthogonal design. Nat. Sci. 2008, 6, 14–25. [Google Scholar]
- Luque De Castro, M.D.; Tena, M.T. Strategies for supercritical fluid extraction of polar and ionic compounds. Trends Anal. Chem. 1996, 15, 32–33. [Google Scholar] [CrossRef]
- Coates, J. Interpretation of Infrared Spectra, A Practical Approach. Encycl. Anal. Chem. 2000, 10815–10837. [Google Scholar]
- Ballard, T.S.; Mallikarjunan, P.; Zhou, K.; O’Keefe, S. Microwave-assisted extraction of phenolic antioxidant compounds from peanut skins. Food Chem. 2010, 120, 1185–1192. [Google Scholar] [CrossRef]
- Singh, B.; Sharma, H.K.; Sarkar, B.C. Optimization of extraction of antioxidants from wheat bran (Triticum spp.) using response surface methodology. J. Food Sci. Technol. 2012, 49, 294–308. [Google Scholar] [CrossRef] [PubMed][Green Version]
- Crozier, A.; Jensen, E.; Lean, M.E.J.; McDonald, M.S. Quantitative analysis of flavonoids by reversed-phase high performance liquid chromatography. J. Chromatogr. A 1997, 761, 315–321. [Google Scholar] [CrossRef]
Sample Availability: Samples of the compounds are available from the authors. |


| Run Order a | DPPH b | FRAP c | TPC d | TFC e | ||||
|---|---|---|---|---|---|---|---|---|
| Exp. f | Pred. g | Exp. f | Pred. g | Exp. f | Pred. g | Exp. f | Pred. g | |
| 1 | 86.70 | 86.70 | 7.47 | 7.47 | 226.44 | 226.44 | 3.22 | 3.22 |
| 2 | 85.88 | 85.88 | 7.29 | 7.29 | 212.21 | 212.20 | 2.60 | 2.60 |
| 3 | 84.66 | 84.68 | 7.20 | 7.20 | 221.64 | 221.64 | 2.47 | 2.47 |
| 4 | 83.70 | 83.71 | 7.12 | 7.12 | 190.01 | 190.02 | 2.32 | 2.32 |
| 5 | 86.06 | 86.06 | 7.21 | 7.20 | 242.45 | 242.47 | 2.35 | 2.36 |
| 6 | 86.35 | 86.35 | 7.14 | 7.13 | 292.33 | 292.35 | 1.92 | 1.92 |
| 7 | 86.25 | 86.26 | 7.25 | 7.28 | 201.04 | 201.04 | 2.11 | 2.11 |
| 8 | 86.42 | 86.42 | 7.30 | 7.32 | 233.55 | 233.55 | 2.13 | 2.14 |
| 9 | 86.18 | 86.18 | 7.29 | 7.29 | 197.95 | 197.95 | 2.40 | 2.43 |
| 10 | 85.60 | 85.60 | 7.19 | 7.17 | 213.32 | 213.32 | 1.93 | 1.94 |
| 11 | 86.85 | 86.84 | 7.31 | 7.31 | 292.86 | 292.88 | 2.75 | 2.74 |
| 12 | 84.20 | 85.20 | 7.23 | 7.24 | 239.38 | 239.39 | 2.30 | 2.30 |
| 13 | 85.41 | 84.50 | 7.26 | 7.26 | 186.22 | 186.22 | 2.90 | 2.91 |
| 14 | 86.25 | 86.25 | 7.19 | 7.20 | 236.31 | 236.30 | 2.03 | 2.04 |
| 15 | 85.79 | 85.79 | 7.13 | 7.13 | 231.20 | 231.20 | 2.39 | 2.39 |
| 16 | 85.79 | 85.79 | 7.13 | 7.13 | 231.20 | 231.20 | 2.39 | 2.39 |
| 17 | 85.79 | 85.79 | 7.13 | 7.13 | 231.20 | 231.20 | 2.39 | 2.39 |
| 18 | 85.79 | 85.79 | 7.13 | 7.13 | 231.20 | 231.20 | 2.39 | 2.39 |
| 19 | 85.79 | 85.79 | 7.13 | 7.13 | 231.20 | 231.20 | 2.39 | 2.39 |
| 20 | 85.79 | 85.79 | 7.13 | 7.13 | 231.20 | 231.20 | 2.39 | 2.39 |
| DPPH | FRAP | TPC | TFC | |||||||||||
|---|---|---|---|---|---|---|---|---|---|---|---|---|---|---|
| Variance Sources | dF | p-Value | Sum of Squares | Mean Square | F-value | Sum of Squares | Mean Square | F-Value | Sum of Squares | Mean Square | F-Value | Sum of Squares | Mean Square | F-Value |
| Model | 9 | <0.0001 | 10.98 | 1.22 | 17,783.61 | 0.14 | 0.016 | 134.76 | 14,152.19 | 1573.58 | 5.585 × 10⁷ | 1.84 | 0.20 | 5593.88 |
| A | 1 | <0.0001 | 0.54 | 0.54 | 7811.46 | 0.013 | 0.013 | 108.74 | 48.05 | 48.05 | 1.705 × 10⁶ | 0.46 | 0.46 | 12,619.20 |
| B | 1 | <0.0001 | 4.50 | 4.50 | 65,592.56 | 0.055 | 0.055 | 465.96 | 38,891.80 | 3889.18 | 1.380 × 10⁸ | 0.30 | 0.30 | 8167.97 |
| C | 1 | <0.0001 | 1.80 | 1.80 | 26,305.77 | 0.031 | 0.031 | 262.11 | 5221.77 | 5221.77 | 1.853 × 10⁸ | 0.80 | 0.80 | 21,729.86 |
| Interaction | ||||||||||||||
| AB | 1 | <0.0001 | 8.450 × 10⁻³ | 8.45 | 123.23 | 3.612 × 10⁻³ | 3.612 × 10⁻³ | 30.55 | 151.12 | 151.12 | 5.363 × 10⁶ | 0.10 | 0.10 | 2763.26 |
| AC | 1 | <0.0001 | 0.63 | 0.63 | 9146.45 | 6.163 × 10⁻³ | 6.613 × 10⁻³ | 55.93 | 2056.01 | 2056.01 | 7.297 × 10⁷ | 0.014 | 0.014 | 394.36 |
| BC | 1 | <0.0001 | 2.51 | 2.51 | 36,585.80 | 0.050 | 0.050 | 419.62 | 669.60 | 669.60 | 2.376 × 10⁷ | 0.13 | 0.13 | 3549.26 |
| Square | ||||||||||||||
| A2 | 1 | <0.0001 | 0.016 | 0.016 | 229.34 | 0.019 | 0.032 | 271.98 | 1176.92 | 1176.92 | 4.177 × 10⁷ | 0.10 | 0.10 | 2769.65 |
| B2 | 1 | <0.0001 | 0.094 | 0.09 | 1370.74 | 0.032 | 0.014 | 119.63 | 2196.13 | 2196.13 | 7.794 × 10⁷ | 0.037 | 0.037 | 1000.07 |
| C2 | 1 | <0.0001 | 0.31 | 0.31 | 4557.82 | 0.014 | 1.182 × 10⁻⁴ | 715.94 | 715.94 | 2.541 × 10⁷ | 0.011 | 0.011 | 296.27 | |
| Residual | 10 | 6.857 × 10⁻⁴ | 6.857 × 10⁻⁵ | 1.182 × 10⁻³ | 2.365 × 10⁻⁴ | 2.818 × 10⁻⁴ | 2.818 × 10⁻⁵ | 3.664 × 10⁻⁴ | 3.664 × 10⁻⁵ | |||||
| Lack of Fit | 5 | 6.857 × 10⁻⁴ | 1.371 × 10⁻⁴ | 1.182 × 10⁻³ | 0.000 | 2.818 × 10⁻⁴ | 5.635 × 10⁻⁵ | 3.664 × 10⁻⁴ | 7.328 × 10⁻⁴ | |||||
| Pure Error | 5 | 0.00 | 0.000 | 0.000 | 0.00 | 0.000 | 0.00 | 0.000 | ||||||
| Total | 19 | 10.98 | 0.14 | 14,162.19 | 1.85 | |||||||||
| R2 | 0.9999 | 0.9918 | 1.000 | 0.9998 | ||||||||||
| Adj-R2 | 0.9999 | 0.9845 | 1.000 | 0.9996 | ||||||||||
| Pre-R2 | 0.9999 | 0.9313 | 1.000 | 0.9985 | ||||||||||
| Adeq. Pre. | 536.669 | 43.252 | 28,409.729 | 302.131 | ||||||||||
| CV% | 9.65 | 0.15 | 2.32 | 0.25 | ||||||||||
| PRESS | 5.269 × 10⁻³ | 9.926 × 10⁻³ | 2.316 × 10⁻³ | 2.781 × 10⁻³ | ||||||||||
| Functional Group | Absorption (cm−1) | Range (cm−1) |
|---|---|---|
| O-H | 3295.68 | 3400–3200 |
| C-H stretch methylene (asy) | 2922.92 | 2935–2915 |
| C=C-C * aromatic | 1613.49 | 1615–1580 |
| Hetero-oxy compound (nitrogen-oxy, NO) | 1273.25 | 1285–1270 |
| Hetero-oxy compound (silicon-oxy, Si-o-Si) | 1041.84 | 1055–1020 |
| Optimum Value (In Range) | Optimum Value (Targeted) | ||
| Variables | Time | 66.36 min | 66 min |
| Temperature | 64.10 °C | 64 °C | |
| Solvent to-feed ratio | 74.59% (v/v) | 75% (v/v) | |
| Predicted value | Experimental value | ||
| Responses | DPPH | 86.84% | 86.85% |
| FRAP | 7.47% | 7.47% | |
| TPC | 292.88 mg/g | 292.86 mg/g | |
| TFC | 3.22 mg/g | 3.22 mg/g |
| Variables | Coded and Uncoded Level of Variables | ||||
|---|---|---|---|---|---|
| −1.682 | −1 | 0 | −1 | +1.682 | |
| Temperature (°C), X1 | 53.18 | 60 | 70 | 80 | 86.82 |
| Time (min), X2 | 66.36 | 90 | 100 | 120 | 133.64 |
| Solvent Ratio Ethanol:Water v/v (%), X3 | 63.18 | 70 | 80 | 90 | 96.82 |
© 2018 by the authors. Licensee MDPI, Basel, Switzerland. This article is an open access article distributed under the terms and conditions of the Creative Commons Attribution (CC BY) license (http://creativecommons.org/licenses/by/4.0/).
Share and Cite
Mohamed Mahzir, K.A.; Abd Gani, S.S.; Hasanah Zaidan, U.; Halmi, M.I.E. Development of Phaleria macrocarpa (Scheff.) Boerl Fruits Using Response Surface Methodology Focused on Phenolics, Flavonoids and Antioxidant Properties. Molecules 2018, 23, 724. https://doi.org/10.3390/molecules23040724
Mohamed Mahzir KA, Abd Gani SS, Hasanah Zaidan U, Halmi MIE. Development of Phaleria macrocarpa (Scheff.) Boerl Fruits Using Response Surface Methodology Focused on Phenolics, Flavonoids and Antioxidant Properties. Molecules. 2018; 23(4):724. https://doi.org/10.3390/molecules23040724
Chicago/Turabian StyleMohamed Mahzir, Khurul Ain, Siti Salwa Abd Gani, Uswatun Hasanah Zaidan, and Mohd Izuan Effendi Halmi. 2018. "Development of Phaleria macrocarpa (Scheff.) Boerl Fruits Using Response Surface Methodology Focused on Phenolics, Flavonoids and Antioxidant Properties" Molecules 23, no. 4: 724. https://doi.org/10.3390/molecules23040724
APA StyleMohamed Mahzir, K. A., Abd Gani, S. S., Hasanah Zaidan, U., & Halmi, M. I. E. (2018). Development of Phaleria macrocarpa (Scheff.) Boerl Fruits Using Response Surface Methodology Focused on Phenolics, Flavonoids and Antioxidant Properties. Molecules, 23(4), 724. https://doi.org/10.3390/molecules23040724