Computational Modeling of In Vitro Swelling of Mitochondria: A Biophysical Approach


1
Department of Physics, University of Puerto Rico, Rio Piedras Campus, San Juan, PR 00931-3343, USA
2
Faculty of Sciences and Technology, Department of Chemistry and Pharmacy, and Interdisciplinary Centre of Chemistry of Algarve, University of Algarve, 8005-139 Faro, Portugal
3
Department of Physiology and Biophysics, University of Puerto Rico, Medical Sciences Campus, San Juan, PR 00936-5067, USA
*
Author to whom correspondence should be addressed.
Molecules 2018, 23(4), 783; https://doi.org/10.3390/molecules23040783
Submission received: 22 February 2018
/
Revised: 12 March 2018
/
Accepted: 27 March 2018
/
Published: 28 March 2018
(This article belongs to the Special Issue Biology of Reactive Oxygen and Nitrogen Species: Redox Signaling, Metabolic Effects, Cellular Functions and Oxidative Damage)
Abstract
:Swelling of mitochondria plays an important role in the pathogenesis of human diseases by stimulating mitochondria-mediated cell death through apoptosis, necrosis, and autophagy. Changes in the permeability of the inner mitochondrial membrane (IMM) of ions and other substances induce an increase in the colloid osmotic pressure, leading to matrix swelling. Modeling of mitochondrial swelling is important for simulation and prediction of in vivo events in the cell during oxidative and energy stress. In the present study, we developed a computational model that describes the mechanism of mitochondrial swelling based on osmosis, the rigidity of the IMM, and dynamics of ionic/neutral species. The model describes a new biophysical approach to swelling dynamics, where osmotic pressure created in the matrix is compensated for by the rigidity of the IMM, i.e., osmotic pressure induces membrane deformation, which compensates for the osmotic pressure effect. Thus, the effect is linear and reversible at small membrane deformations, allowing the membrane to restore its normal form. On the other hand, the membrane rigidity drops to zero at large deformations, and the swelling becomes irreversible. As a result, an increased number of dysfunctional mitochondria can activate mitophagy and initiate cell death. Numerical modeling analysis produced results that reasonably describe the experimental data reported earlier.
1. Introduction
Mitochondria are widely accepted as the powerhouse and provide up to 90% of the ATP necessary for the cell. They are also important for the regulation of ionic homeostasis, cell growth, redox signaling, and cell death [1,2,3]. The electron transport chain (ETC) generates an electrochemical gradient across the inner mitochondrial membrane (IMM). This gradient, induced by the mitochondrial membrane potential (ΔΨm) and the H+ gradient, is known as the proton-motive force that drives ATP synthesis. Mitochondria contain two membranes, the outer mitochondrial membrane (OMM) and the IMM, with an intermembrane space (IMS) between them. The OMM is a semi-permeable membrane allowing the passage of species with a molecular weight up to 6 kDa. The IMM is impermeable under normal aerobic conditions and transports selected ions and solutes through specific channels and exchangers.
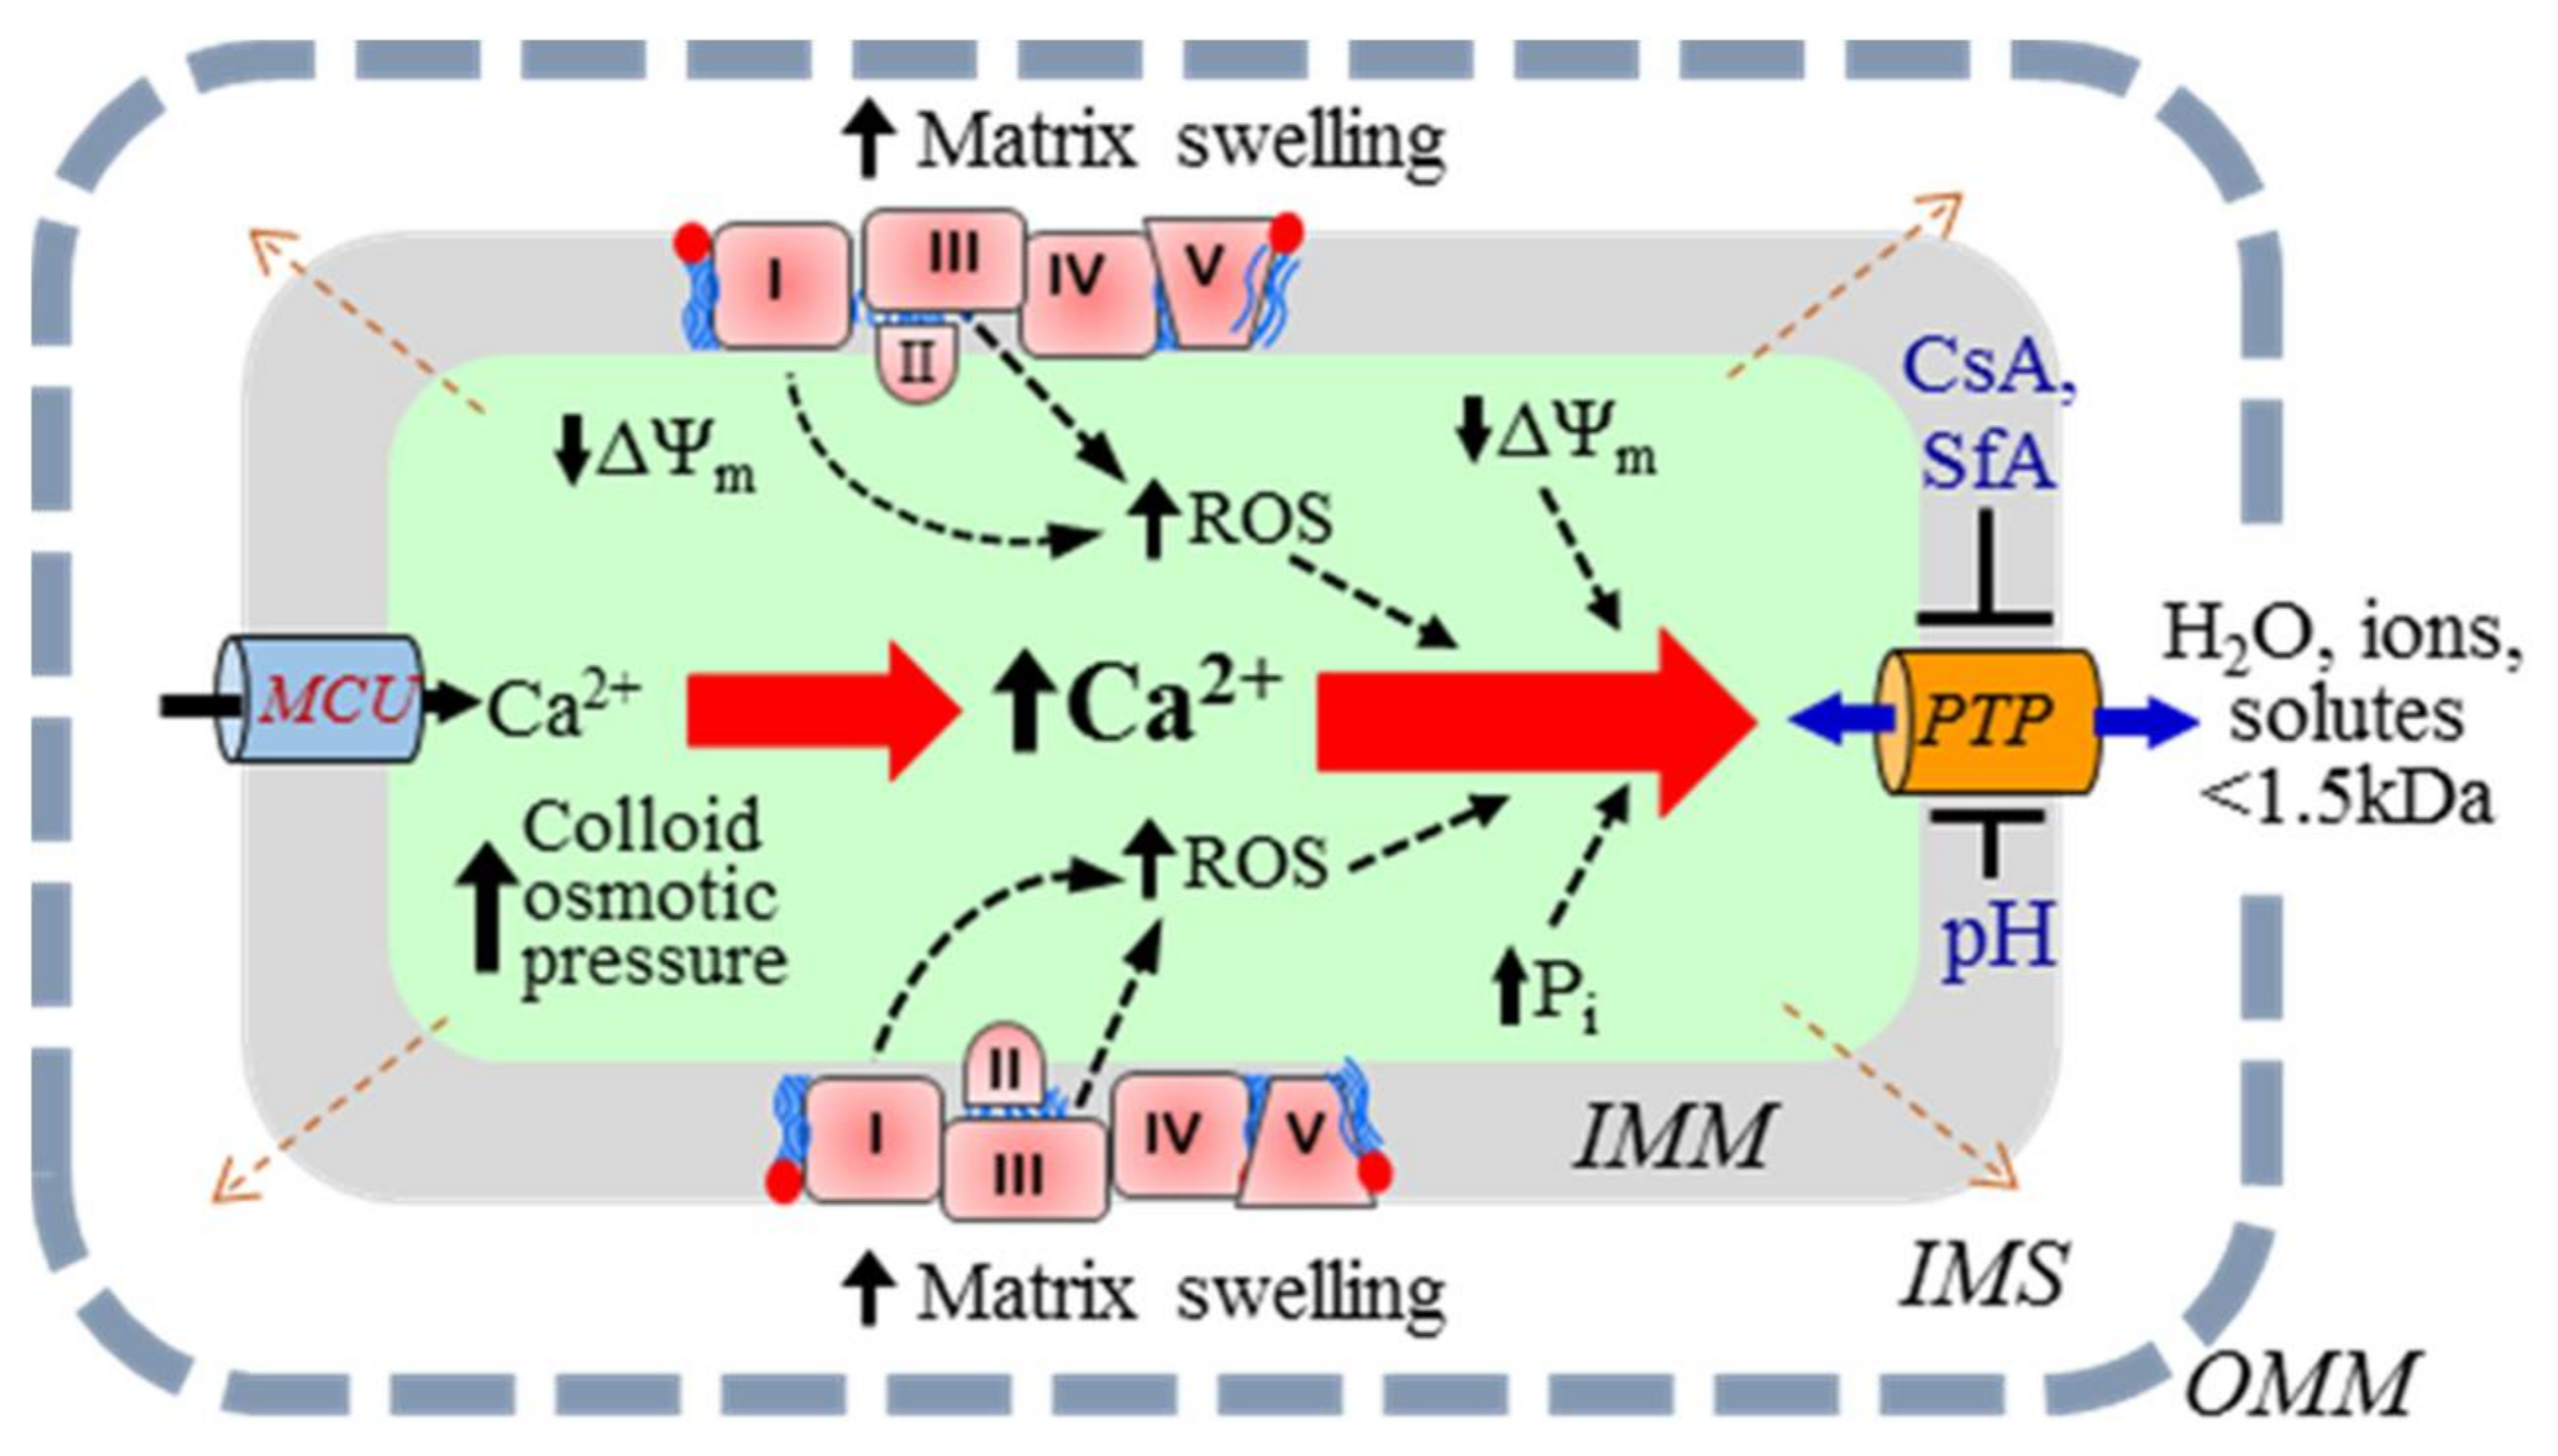
An increase in mitochondrial Ca2+ and reactive oxygen species (ROS) in response to oxidative and energetic stresses stimulates mitochondria-mediated cell death. Also, proteolysis due to protein oxidation can alter the structural and functional integrity of the IMM. The main mechanism of mitochondria-mediated cell death involves excessive matrix swelling induced by the opening of the non-selective channels, permeability transition pores (PTP) in the IMM [4,5,6] (Figure 1). The detailed molecular structure of PTPs is yet unknown. Although early studies revealed adenine nucleotide translocase (ANT) and voltage-dependent anion channel (VDAC) as the core components of the PTP complex, subsequent genetic studies noted a regulatory rather than structural role to these proteins in PTP formation. Cyclophilin D has been broadly accepted as a major regulator of the PTP (reviewed in [7]). Studies from several groups suggested that F1FO-ATPase was involved in the PTP complex [8,9]; however, recent findings challenged the pore-forming role of F1FO-ATPase [10,11].
The dynamics of PTP opening are usually described using various phenomenological approaches. The PTP opening can occur in the low-conductance (reversible) or high-conductance (irreversible) mode [6,12,13]. Low-conductance PTP flickering creates permeability to solutes up to 300 Da, mostly ions, and induces negligible matrix swelling [14]. However, the opening of the low-conductance PTP can initiate IMM depolarization [15]. Notably, the low-conductance PTP induction can regulate ATP synthesis through activation/inhibition of the Krebs cycle by Ca2+ in the matrix [16,17]. Furthermore, mitochondria are sensitive to small changes in the matrix volume that may be regulated by the low-conductance PTP. Increases in the matrix volume within the physiological range stimulate the ETC activity, ATP production, fatty acid oxidation, and other metabolic pathways [18]. The high-conductance open-state PTP has a channel ~3 nm in diameter, allowing for the diffusion of all species up to 1.5 kDa [4,19,20]. Therefore, PTP opening stimulates the free bi-directional movement of low molecular weight species (water and solutes) across the IMM, while the indiffusible proteins remain in the matrix. Consequently, an increase in the colloid osmotic pressure causes matrix swelling. Due to the ensuing OMM rupture, apoptotic proteins (e.g., cytochrome c) are released into the cytosol, promoting cell death via apoptosis [21,22]. It should be noted that whether cell death occurs through apoptosis or necrosis depends on the ATP level. Since apoptosis is the ATP-dependent process, at low (<50%) ATP, despite release of apoptotic proteins from the IMS, the cell will apparently die by necrosis rather than apoptosis.
Calcium is a key inducer of both PTP-dependent and PTP-independent swelling of mitochondria (Figure 1). Cytoplasmic Ca2+ is rapidly taken up by mitochondria due to the proton-motive force generated by the ETC [23]. The mitochondrial calcium uniporter (MCU) is the main channel that transports Ca2+ to the matrix when PTPs are closed. In fact, the MCU is a low-affinity and high-capacity channel that mediates Ca2+ influx in a ΔΨm-dependent manner [24]. Mitochondrial Ca2+ efflux occurs in three ways: (i) the mitochondrial Na+/Ca2+ exchanger, the main contributor, most relevant in muscle mitochondria [25]; (ii) the H+/Ca2+ antiporter, an Na-independent pathway [20,26,27]; and (iii) opening of the PTPs. The PTP opening occurs due to Ca2+ overload, inducing swelling of mitochondria caused by the influx of water and ions through the open pores [25,28].
In addition to Ca2+, H+ also plays an important regulatory role in PTP induction and, thus, mitochondrial swelling. Likely, H+ regulates the sensitivity of the PTP towards Ca2+; low pH inhibits pore opening, whereas pH above 7.0 stimulates permeability transition [26,29]. High H+ levels have been shown to inhibit the PTP induction through cyclophilin D [30] and F-ATP synthase [31]. Therefore, pharmacological agents that reduce pH and create temporary acidosis are able to prevent PTP opening and exert beneficial effects in pathological conditions associated with mitochondrial Ca2+ overload (e.g., ischemia–reperfusion) [32,33].
Modeling of mitochondrial swelling is important for the simulation and prediction of in vivo events under physiological and pathological conditions. The lack of knowledge on the molecular identity of the PTP complex obscures the understanding of the physical and chemical mechanisms of pore opening and mitochondrial swelling. Previous studies proposed several kinetic approaches to developing an optimized model of mitochondrial swelling. However, they do not provide an adequate mechanism underlying the transition from a reversible to an irreversible swelling state and should be improved by including additional factors. In particular, previous models did not take into consideration ΔΨm, the major parameter that regulates mitochondrial PTP induction, swelling, and cell death [34,35,36]. Simultaneous analysis of swelling and the dynamics of ΔΨm loss are important for understanding the relationship between changes in the matrix volume, ion flux, and mitochondrial bioenergetics. Also, previous models used the kinetic limit for the analysis of the transport of ions and solutes. As a result, diffusion was assumed to be faster than the respective kinetic rates. Therefore, an improved model should include diffusion-limited transport of Ca2+ from the cytosol to the matrix to generalize the modeling approaches.
We have earlier reported [37] a simple model to interpret the experimental data on Ca2+-induced mitochondrial swelling. In the current study, we further develop modeling analysis including the transport dynamics of different ions and species across the IMM, and their effects on matrix metabolism, with the objective to describe mitochondrial swelling based on detailed physical and chemical characteristics. Our model describes the mechanism of transition from reversible to irreversible swelling in mitochondria. We developed a FORTRAN code to carry out numerical simulations, with varying values of the model parameters. Our modeling approach is based on the experimental data reported earlier by different authors. It includes the mechanism of matrix swelling, where the IMM rigidity is described by the rigidity tensor, its components dependent on the IMM deformation scale. Simultaneously, the osmotic pressure in the matrix is compensated for by the IMM deformation. Based on earlier suggestions [38], our model couples the PTP opening dynamics with the matrix pH. We conclude that the model is suitable for the analysis of the transition of mitochondria from the reversible to irreversible swelling. However, the applicability range of the model is quite limited, as it only takes into account Ca2+, K+, and H+ to describe the irreversible swelling. In future, we plan to include a description of irreversible swelling in the more complex models with all of the relevant species, which currently disregard the possibility of irreversible swelling.
2. Model Description
There are two different approaches to the modeling of mitochondrial swelling dynamics [39]. The first approach introduces phenomenological kinetic parameters, which are fitted for better reproduction of the experimental kinetic results. The second approach develops a biophysical model based on the ionic and hydrodynamic fluxes across the IMM, and changes in ΔΨm and mitochondrial respiration rates [19,40].
The role of Ca2+ in mitochondrial swelling has been assessed using a simple kinetic approach in rat liver mitochondria [41]. The kinetics of the permeability transition were analyzed within a model based on the assumption that the transition follows first-order kinetics and that the solute diffusion rate depends on the pore conformation. In addition, several theoretical studies concerning mitochondrial swelling dynamics were reported [39,42,43,44,45,46]. Another study reported a model of mitochondrial ion transport and its application to the analysis of different modes of Ca2+ uptake by mitochondria [47]. However, this model failed to reproduce the swelling and the role of PTP opening in swelling. Likewise, several systematic studies reported modeling of Ca2+ transport across the IMM, and also PTP induction [42,43,44,45]. Their approach is based on a kinetic step that may be presented as Ca2+out ↔ Ca2+in, describing Ca2+ ion exchange between the outside and inside of the IMM.
2.1. A Basic Model of Mitochondrial Dynamics
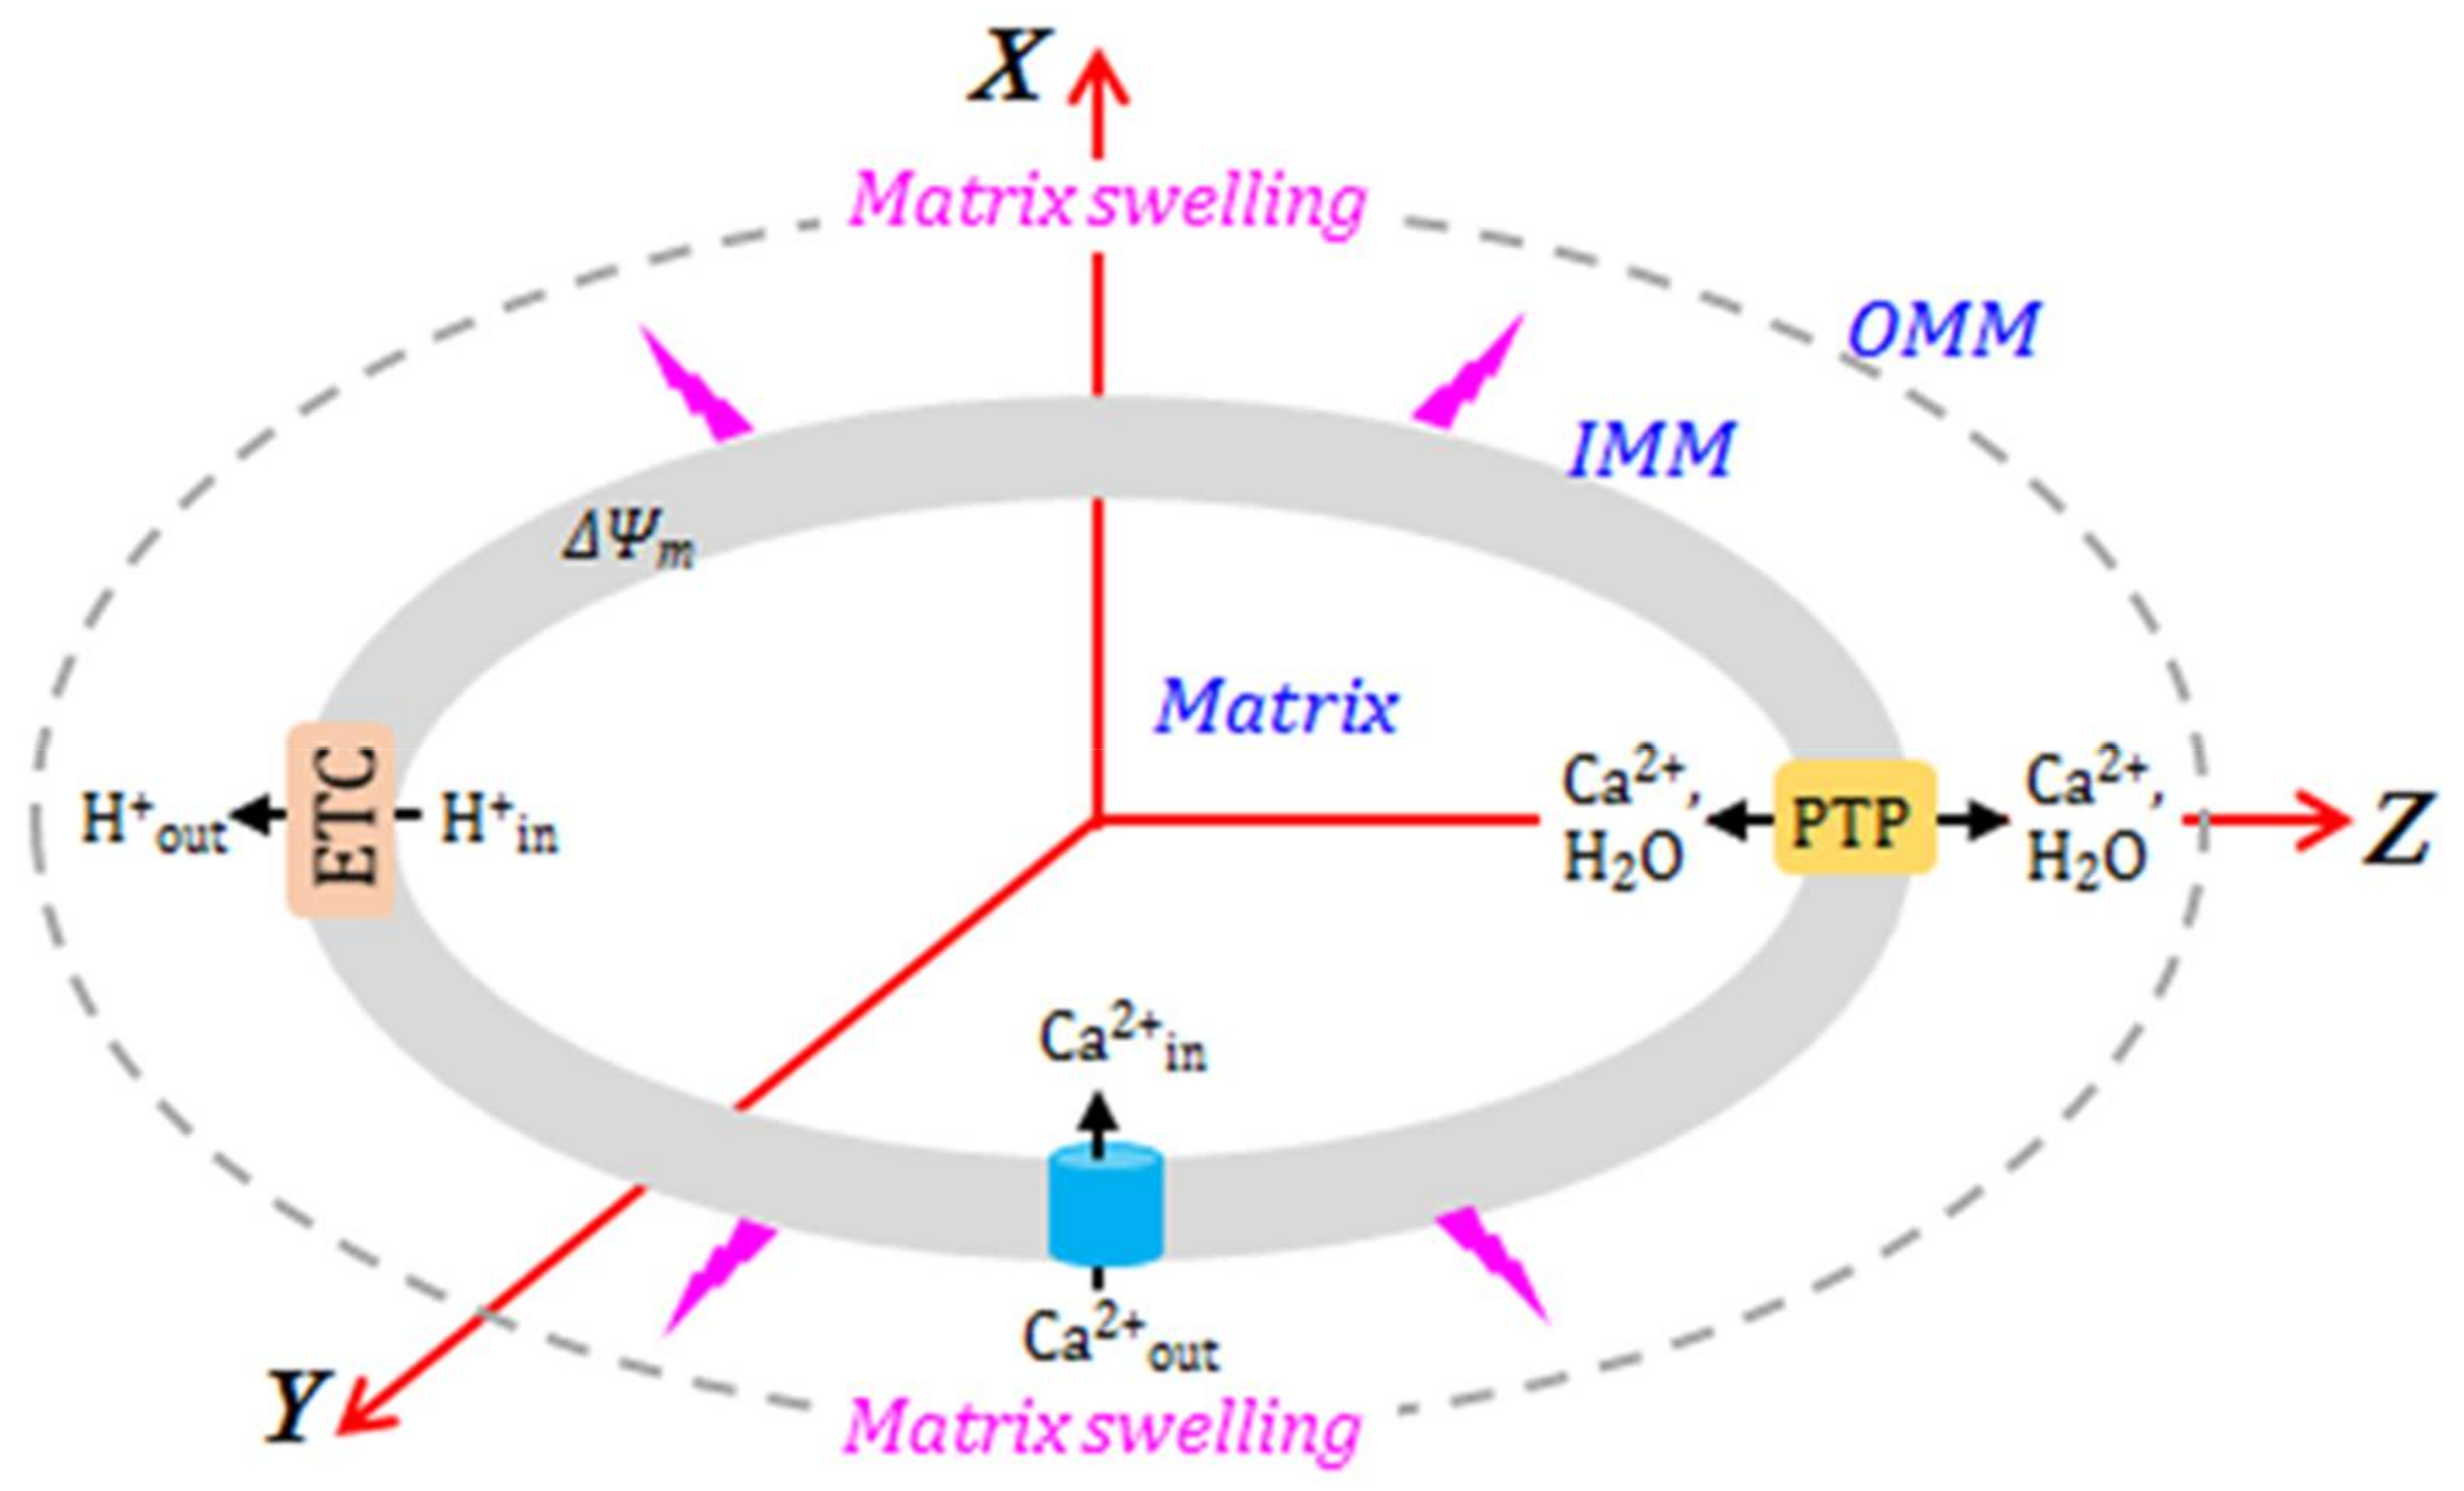
A simple scheme of the proposed model of Ca2+-induced mitochondrial swelling is shown in Figure 2. This model is an extended version of our earlier approach [37]. The Ca2+ concentration affects ΔΨm = Ψm, out – ΔΨm, in, the proton concentration in the matrix CH, in, the PTP opening dynamics, described by the PPTP, op parameter, matrix concentration of the respiration activator (A), matrix osmotic pressure Pos and matrix swelling. Mitochondrial swelling is induced by ionic/neutral species transport in/out of the matrix, which creates osmotic pressure inside the matrix. The osmotic pressure is compensated for by the IMM deformation induced by swelling. The present modeling approach aims to reproduce the IMM swelling dynamics, which is included in the transport model for the ionic and neutral species going in or out of the matrix, along with PTP opening dynamics.
We used the Goldman equation to describe ionic species transport in and out of the matrix [47], which may be presented as follows:
where Ji is the flux of i-th ionic species, Jiin and Jiout are the i-th ionic species fluxes coming in and going out of the matrix, kB is the Boltzmann constant, T is the absolute temperature, zi is the relative ionic charge, |e| is the absolute electron charge, and are the concentrations of the i-th ionic species inside and outside the matrix, respectively, and pi is the reduced permeability of the IMM to the i-th ionic species. The transport of neutral species may also be described by Equation (1), substituting ΔΨm → 0, i.e.,
where pi(0) is the diffusion coefficient of the respective species in the uniport channels. We assumed pi(0) = 0 for the uniport of the ionic species. Our model uses both Equations (1) and (2). We used published values of the model parameters in our numerical analysis, with the respective data and references listed in Table 1.
2.2. Ca2+ Transport across the IMM
Calcium influx through the IMM may be described by Equation (1), taking into account its background cytosolic concentration C0,cb = 0.5 μM [48]. The effective reduced permeability of Ca2+ uniport across the IMM is listed in Table 1. Our model includes the transport of Ca2+ only. The IMM is impermeable to Ca2+, K+, Na+, H+ and other ions; specific channels and exchangers control their flux and concentrations in the mitochondrial matrix. Specifically, mitochondrial K+ balance is controlled by ATP-dependent (mitochondrial KATP channel) and Ca2+-dependent channels responsible for influx, and by K+/H+ exchanger responsible for removal of the excess matrix K+. Sodium balance is controlled by Na+/Ca2+ (influx) and Na+/H+ (efflux) exchangers [20]. As we already stated, the present model does not include Na+ influx/efflux mechanisms. Therefore, the respective processes were omitted. However, we included the K+/H+ exchange mechanism because K+ transport at low [Ca2+] (low-conductance PTP) induces oscillations of the mitochondrial volume [53,54]. This effect resulting from K+ transport across the IMM is appropriately described by modified Equation (1), which may be presented as follows:
where the permeability for the K+ and H+ ion transport through the membrane depends linearly on H+ and K+ concentrations: and , respectively. The values of the and parameters are listed in Table 1.
2.3. PTP Transport of Ionic and Neutral Species
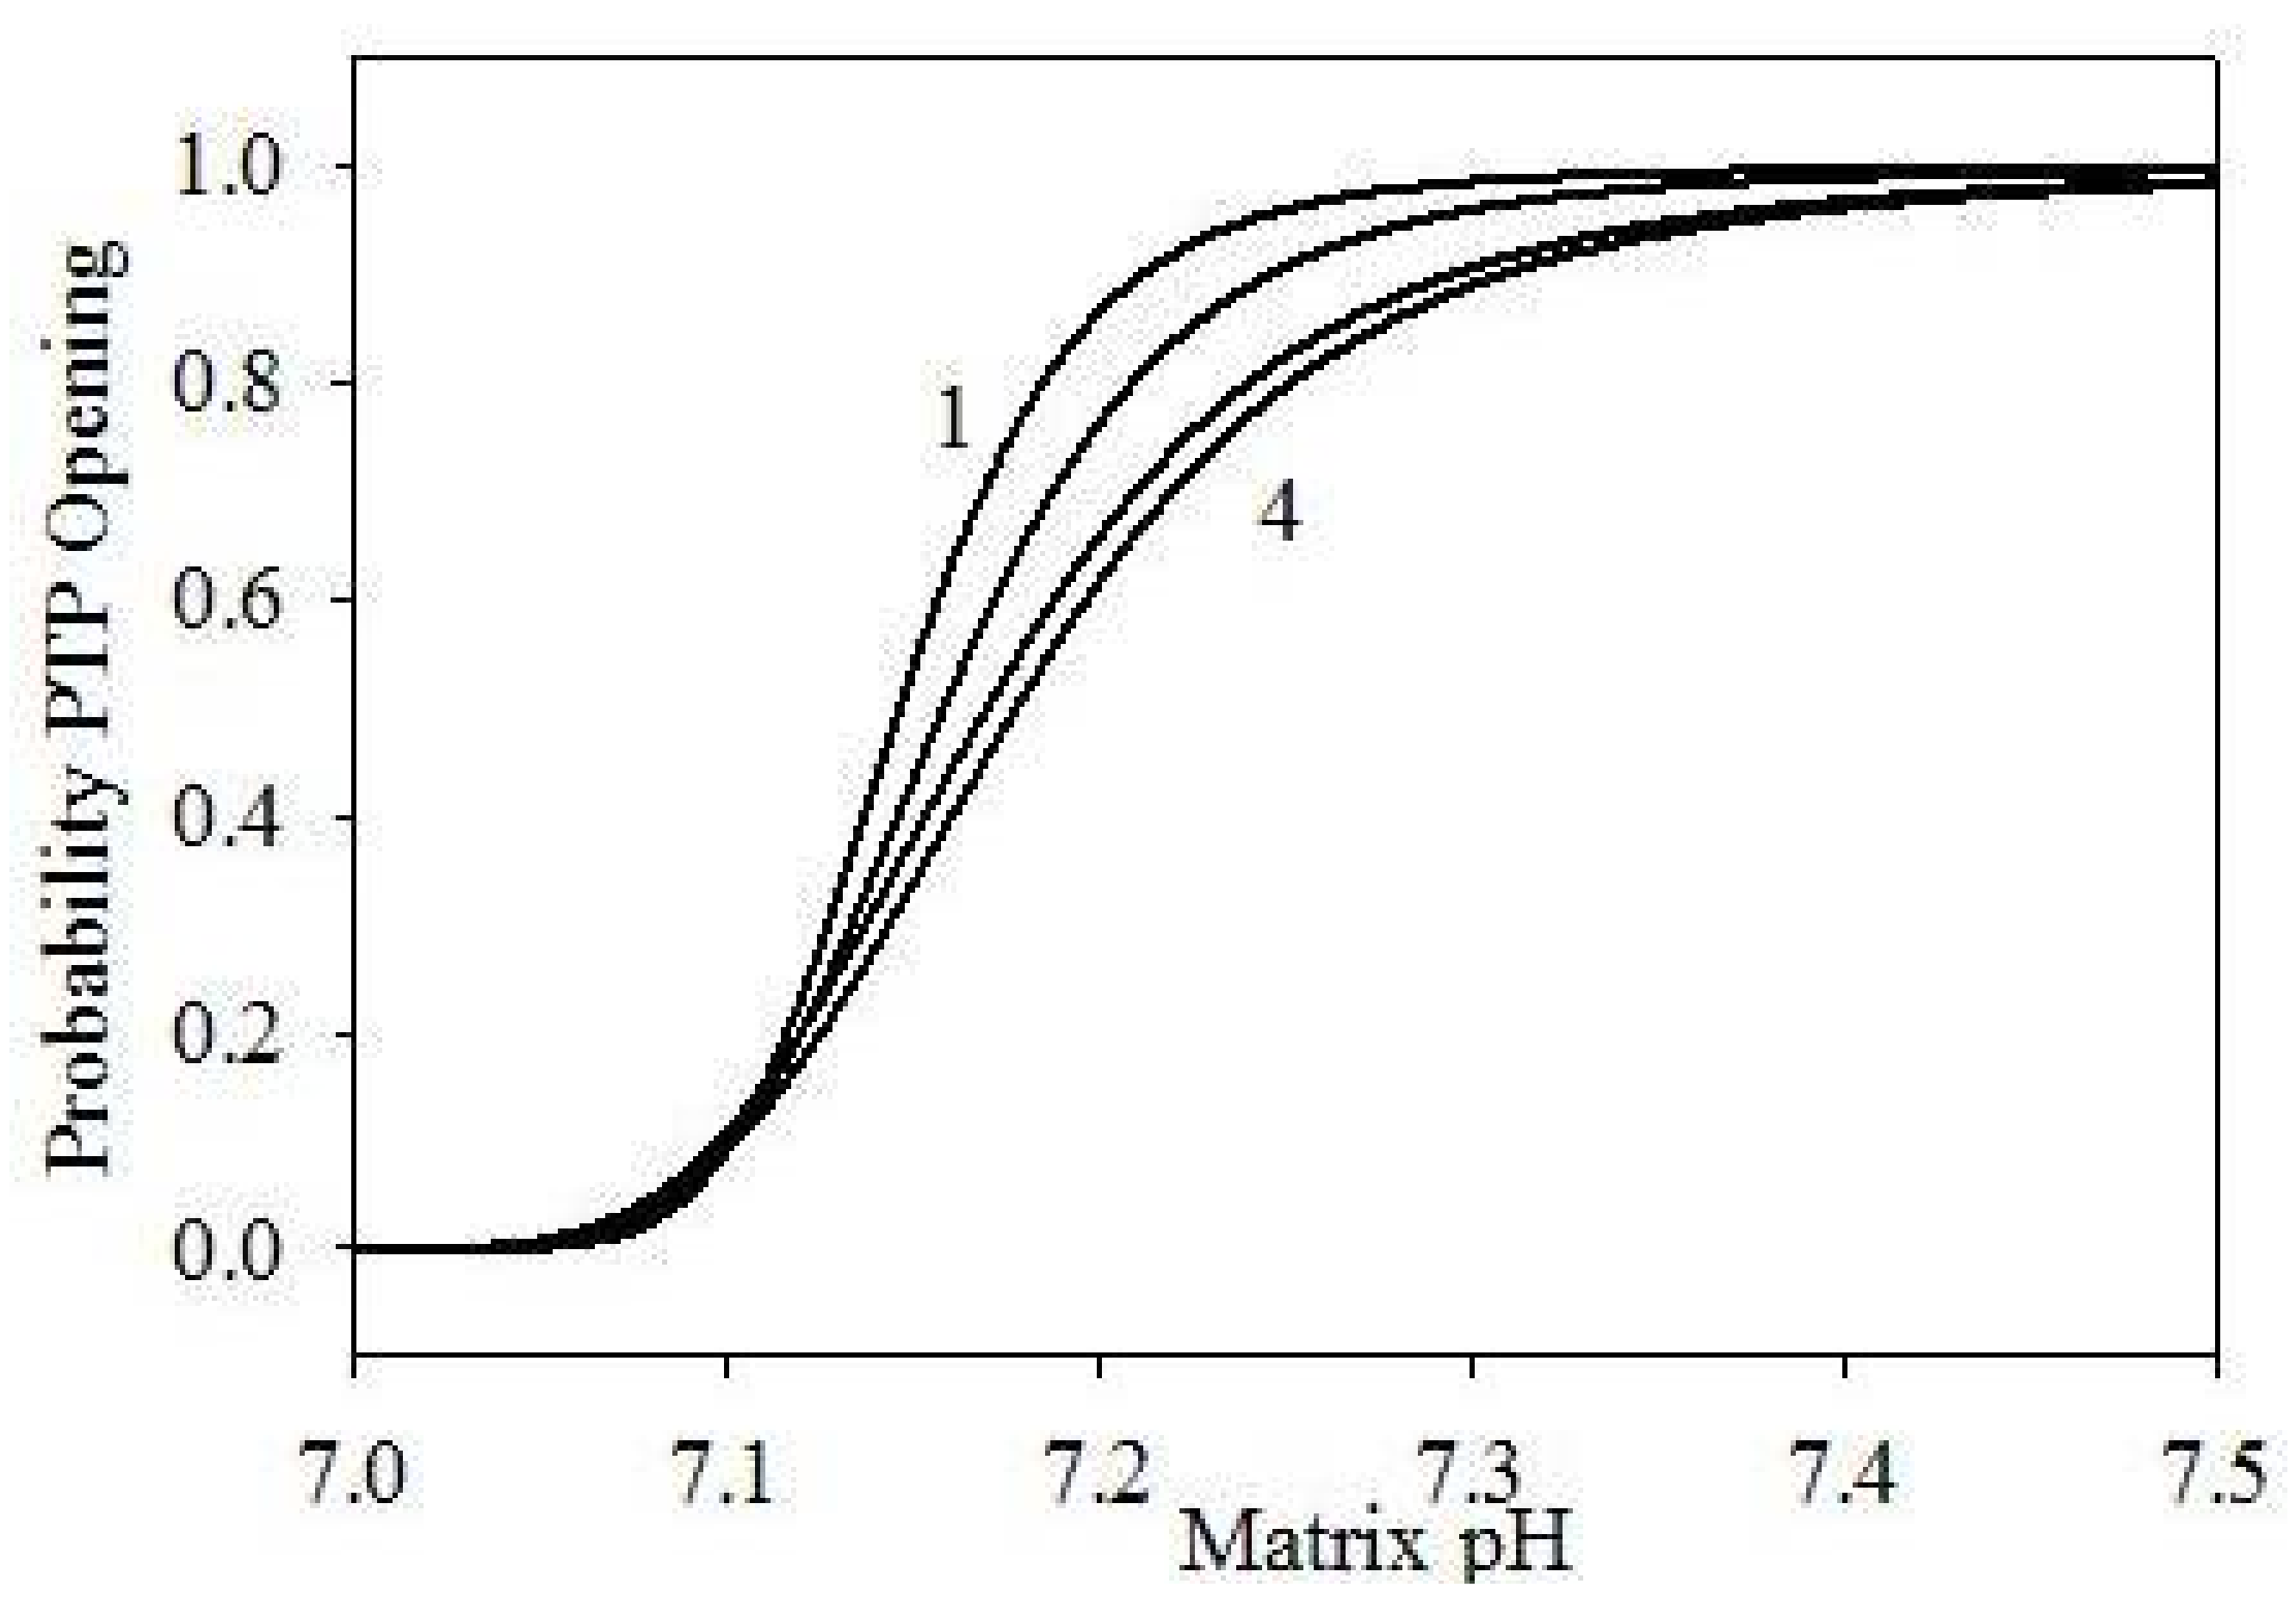
As we already mentioned, PTP opening also controls transport of different ions and neutral species to and from IMM. Factors controlling PTP opening include changes in [Ca2+] and ΔΨm, and matrix pH dynamics [48]. Hence, for simplicity, we assume that Ca2+ affects the PTP opening dynamics only indirectly, by inducing changes in ΔΨm or matrix pH. Presently, we follow the modeling approach proposed earlier [38], adding the model component required to describe the mitochondrial swelling dynamics. According to this approach, we assume that ΔΨm has no direct influence on the PTP opening dynamics in the autoinduced release of mitochondrial Ca2+. It is known that PTPs are completely open at pH ≥ 7.3–7.5, and completely closed at pH ≤ 7.0 [48]. Based on these facts, we define the probability of PTP opening as follows:
This expression correctly produces PPTP = 0 at pH < 7.0, and PPTP = 1 at pH > 7.5. Figure 3 shows the probability dependence on pH at different values of α and n. On the other hand, the PTP opening rate and the PTP closing rate may be presented as follows:
where ki is the respective rate constants (min−1), is the number of PTP on the IMM of a single mitochondrion, is the number of open PTP, and is the number of closed PTP.
Using these notations, the equation for the PTP opening dynamics may be presented as follows:
The latter relationship describes the dynamics of PTP opening. However, it does not include explicitly any effects of the matrix pH; these effects should then be included into the ki parameters. This makes the analysis quite complex. To simplify the calculations, we use Equation (3) instead of Equation (5). The matrix pH is now a time-dependent function, which we introduce below. Ion fluxes through the PTP may also be described by the modified Goldman Equation (1), and presented as follows:
In case of H+ transport, both and are variable parameters. The permeability coefficient for H+ coming through PTP is unknown. We assume that its value is close to that for Ca2+, with both values listed in Table 1, where pH+,PTP = pCa2+,PTP/2 due to the difference in ionic charges [55]. We also assume that the value of K+ permeability for PTP transport is the same as that for H+. Thus, we included H+, K+, and Ca2+ transport through PTP into the current model. In our calculations, we used the conservation relationships:
for K+ and Ca2+, and used a constant external hydrogen ion concentration outside of the matrix (Table 2). We also used the same initial [H+] in the matrix in all of the simulation runs and recorded its evolution in time. In the case of depolarized IMM, we may represent the ion transport through the PTP by the relationship similar to Equation (2):
where pi,PTP(0) is the effective diffusion coefficient of the respective species through PTP, unknown for live cells. However, we neglect the thermal diffusion of ions through PTP in a depolarized IMM, Equation (7), as the ion release, in this case, is dominated by the hydrodynamic flux induced by mitochondrial rigidity.
2.4. Weak Acid Dissociation
Since the probability of PTP opening is directly dependent on the matrix [H+] (CH+), we include the dissociation equilibrium for a weak acid AH. We use the latter as a simplified model for the second dissociation of phosphoric acid, falling into the pH interval of interest with pKa = 7.20. In this case, we obtain:
where KAH is the equilibrium constant of the acid and its initial concentration. Assuming that there are other sources of H+ producing its background concentration , Equation (8) becomes:
Next, we substitute concentrations by activities in Equations (1)–(8):
where the activity coefficient γI is determined using the Debye–Hückel theory [56]:
where I is the ionic force, given by:
We calculated activity coefficients using Equation (11). The mechanism involving electrodiffusion of anions and H+ through PTP may be extended to the transport of other weak organic acids to/from the matrix through PTP. The respective kinetic model for a weak acid AH is described by the following reactions:
- AHout ↔ A−out + H+out
- A−out ↔ A−in
- H+out ↔ H+in
- A−in + H+in ↔ AHin
The dissociation constants of weak acids are known quite well [56]. We assume that the dissociation equilibriums, described by Reactions (1) and (4), are much faster than diffusion, described by Reactions (3) and (4). We use the same values of the equilibrium constants inside and outside the matrix. Taking into account the relations (6), and (9) to (12), we described AH transport through PTP. Our model runs use the permeability value for the PTP transport of A− reported earlier [38] (see Table 1).
2.5. Effect of Respiration (ETC Activity) on H+ Generation
Taking into account that ΔΨm directly affects the respiration and depends on the ETC activity [46,47], we used WA, the generation rate of the respiration activator A, in our model in the following form [55]:
where kA [min−1mM−1] is the effective respiration rate constant, δ(ΔΨm) is a variable parameter and aA,0 is the activator activity at zero time. The respiration rate is constant at ΔΨm = 200 mV [38]. This was achieved in the model by requiring that WA = 0.99kAaA,0 at ΔΨm = 200 mV, which results in δ(ΔΨm) = 43.42 mV, the value used in all model calculations. The respiration activator flux may be presented by the modified Equation (7):
with the pA,PTP value listed in Table 1.
Mitochondrial respiration induces the formation of H+ in the IMS due to its ejection from the matrix by ETC complexes I, III, and IV. Our model does not include the detailed mechanism of H+ transport into the IMS. Therefore, it controls [H+] by its generation via an irreversible process:
with the S− product not participating in any other reactions. We determined the H+ transport using Equation (6) and now, discuss the implementation of the effects of H+ on ΔΨm. We calculated the rate of ETC-induced H+ generation:
where kA,H+ is the H+ formation rate constant in the respiration cycle.
A → H+ + S−,
2.6. Model Implementation
The dynamics of ΔΨm is determined by the matrix ion fluxes, calculated as explained above. Thus, the system of equations describing the evolution of the model in time may be written as:
where F is the Faraday constant, C is the IMM electric capacity, ai is the activity of the respective ion, Sm the mitochondrial surface area, and B = 3 × 10⁵ [38]. Here we assume that the evolution of PPTP, Equation (3) and that of WA, Equation (13), occurs much faster than the processes presented in Equations (16)–(20). We calculated the IMM electric capacity using the relationship , where h = 10 nm is the IMM thickness, used as a constant value in our analysis.
2.7. Mitochondrial Swelling Dynamics
We complement our model with the mitochondrial swelling induced by osmosis. Osmotic pressure results from the concentration differences of various species inside and outside the matrix, written as follows [51,57,58]:
where N is Avogadro’s number. The higher osmotic pressure inside the matrix induces mitochondrial swelling, while the IMM deformation compensates for osmotic pressure up to a certain limit, maintaining equilibrium:
where ΔPIMM is created by the IMM deformation. In the analysis of mitochondrial deformation, we assume that osmotic water transport in/out of the matrix is much faster than the rates of processes described by Equations (16)–(20). Our model calculations also assume ellipsoid shape for the mitochondrial matrix, with the IMM rigidity described by the second-order tensor:
with the matrix shape described by a prolate ellipsoid
where the rigidity tensor may be diagonalized in the reference system shown in Figure 2:
Using the rigidity tensor, we express the pressure created by the IMM deformation:
where
and
Δx(t) = x(t) – a, Δy(t) = y(t) – a, Δz(t) = z(t) – c
The matrix volume changes and the resulting changes in the concentrations/activities are given by:
where Δt is the time step used in the numerical integration of Equations (16)–(20).
To take into account the irreversibility of the mitochondrial swelling at large IMM deformations, the tensor components vanish at high deformations:
where g00, gzz,0, β0, βz, and n1 are adjustable parameters.
We also need to add to Equations (16)–(20) the terms describing the effluxes of the modeled species through PTP due to excess matrix pressure. According to Poiseuille’s law, the volume of homogeneous fluid escaping through a cylindrical tube is given by [44]:
where r is the effective PTP radius, η is the viscosity of the matrix fluid, and l is the IMM thickness. We define the effective PTP radius as:
where r0 ≤ 1.5 nm [26]. Thus, the hydrodynamic efflux of i-th species is given by:
Thus, our model calculations used Equations (16)–(20) with added hydrodynamic flux terms according to Equation (30). Assuming spherically symmetric mitochondria (gxx = gyy = gzz), the equations describing mitochondrial swelling dynamics become much simpler. The volume change rate will be given by:
where η is the coefficient defining the rate of water transfer inside the IMM, and κ the coefficient describing the water transfer outside the IMM due to rigidity, vanishing at high deformations:
Here, κ0 is the linear rigidity coefficient, and γ and m the parameters characterizing membrane properties. At small volume changes, Equation (32) becomes:
Its solution is still quite complex, because ΔPos is a time-dependent function, including ion transport and dilution dynamics created by volume dynamics. Using a linear approximation to Equation (33), the latter equation may be solved using Equation (22), with the result given by:
Assuming κ−1 is much shorter than the characteristic times of other processes included in the model, Equation (34) takes the form:
The earlier approach presented to mitochondrial swelling dynamics [46] is based on Equation (35). This approach, however, has limited utility, as swelling involves dilution of various components; additionally, Equation (35) is only applicable to spherically symmetric systems with homogeneous swelling. This equation also disregards the irreversibility of large deformations, introduced here by Equation (32).
All of the above considerations apply to the analysis of mitochondrial volume dynamics as a function of different system parameters. Our main objective was to gain an understanding of irreversible mitochondrial swelling, testing the new modeling approach. We are considering a set of equivalent mitochondria, with their number density given by nmit (cm−3), an additional model parameter.
3. Numerical Experiments
Since mitochondrial dimensions vary significantly between biological species and cell types, our model analysis specifically targets mitochondria of the adult rat cardiomyocytes. We implemented the numerical model in a homemade FORTRAN code, with the input parameter values listed in Table 2.
Our numerical experiments used constant values for the α, n, CAH,0, δ(ΔΨm), CA,0, kA, and kA,H+ parameters, selected (Table 2) according to previous reports [38,43,46,51,55,57,58,59,60]. We estimated the values of g00 and gzz,0 for spherical mitochondria based on their average mass and expected oscillation frequency [61]. We used the experimental criterion of irreversible swelling observed upon 50% increase in volume; this translates into Δr = 0.144a and Δz = 0.144c, and the rigidity tensor components vanishing at a = 0.5 μm and c = 1 μm [61]. Thus, and using Equation (28), we selected β0, βz, and n1 values as listed in Table 2. We also introduced an outside [H+] = , kept constant during the model run. We also kept constant in, the matrix [H+], in each of the numerical experiments. The values of these two parameters were selected using previous reports [61], with the respective data listed in Table 2. We selected K+ and Ca2+ concentrations, which we varied independently, to cover their entire natural range.
We solved the system of equations defining our model using a homemade FORTRAN code, and the parameters of Table 2, producing the following output parameters:
with PTP opening probability PPTP and
φ = ΔΨm(t), mV,
χ = pH = −log([H+]in),
η = [Ca2+]in, μM,
ξ = [K+]in, μM,
ζ = Vm(t)/Vm(t = 0) – 1.
All of the calculations used ΔΨm(t = 0) = 200 mV, (t = 0) = 0.5 μM, and (t = 0) = 0. In all of the numerical experiments, we kept the ratio of the cell volume to the initial mitochondrial volume constant. Usually an adult rat cardiomyocyte contains ~5000 mitochondria, with the cell to mitochondrial volume ratio of ca. 2.50–2.86 [62]. Thus, the free cell volume per each mitochondrion is (2.50 − 2.86)Vm(t = 0). Our numerical analysis additionally used the values of various constants as reported earlier [52,63,64] (Table 1).
4. Results and Discussion
According to Table 2, we varied only two variable parameters: the initial and concentrations. We made a total of 100 independent numerical experiments with the two concentrations of K+ and Ca2+ that were varied independently. However, we limited the analysis to only two concentrations of K+out (0.01 and 10 mM) and 10 different Ca2+out concentrations (Table 2), producing a total of the 20 most interesting numerical experiments. We calculated the dynamics of the , , and concentrations, ΔΨm, the probability of PTP opening, and the mitochondrial volume. The results of the initial cytosolic [K+] of 0.1 μM are plotted in Figure 4 and Figure 5.
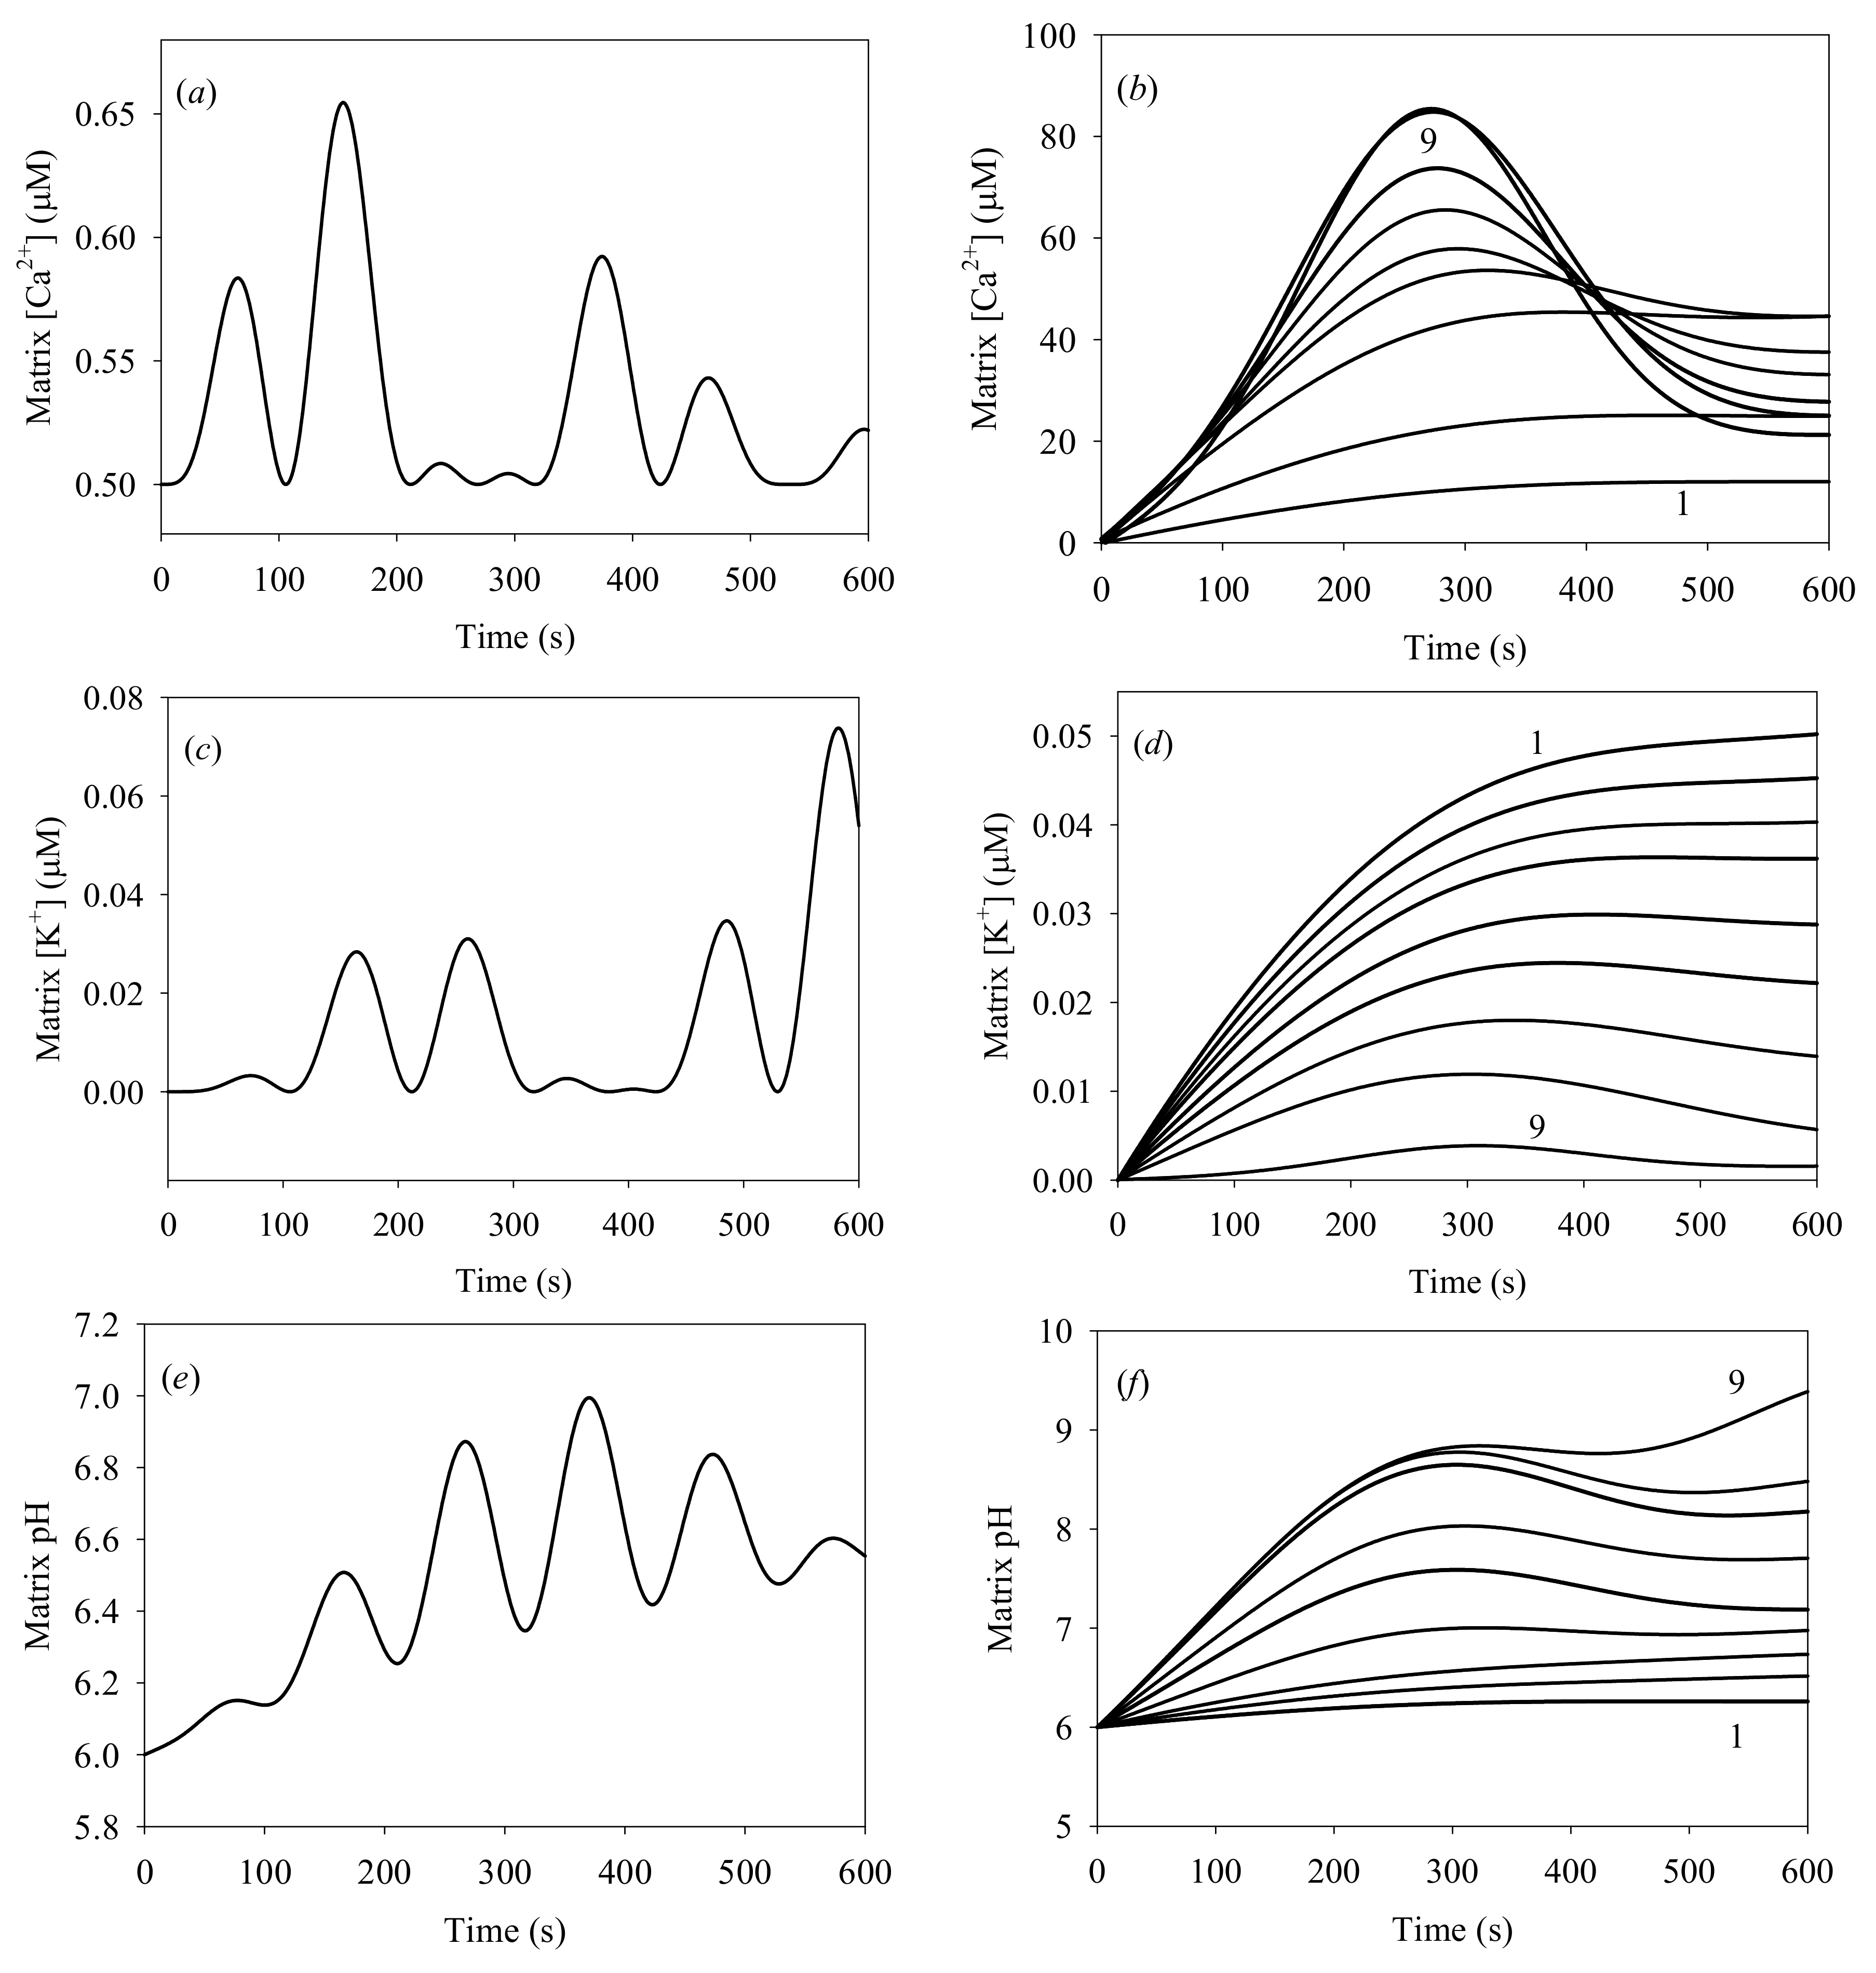
Figure 4a,c,e show oscillations with ca. 97 s period of the Ca2+, K+, and H+ concentrations, for the initial cytosolic concentrations of Ca2+ and K+ of 1.0 and 0.1 μM, respectively. These oscillations result from heterogeneous processes developing at the IMM surface. Such oscillations occur only at low K+ and Ca2+ concentrations; they were detected experimentally [49,50], and described theoretically [38] in previous studies. Experimental measurements of [K+] oscillations and a theoretical analysis of oscillations were reported earlier, with oscillation periods of 20 s and 93 s [38,46].
These results are quite similar to those produced by our model, in particular for pH oscillations. Notably, our model differs from previous studies since it includes the swelling of mitochondria.
Figure 4b,d,f plot matrix [Ca2+], [K+] and matrix pH for different initial cytosolic [Ca2+]. An interesting result is observed at t < 600 s: the matrix [Ca2+] never exceeds 100 μM, while the initial cytosolic [Ca2+] is 500 μM. The model generates correct distribution between the “in” and “out” Ca2+ at low cytosolic [Ca2+] < 200 μM, in agreement with earlier reports [24,43]. However, strong deviations from the expected equilibrium distribution between “in” and “out” Ca2+ are produced at high cytosolic Ca2+ concentrations, between 300 and 500 μM. These deviations may be attributed to the PTP efflux of Ca2+ from the matrix, generated by the excess pressure within the matrix due to IMM deformation. This effect has not been reported before. All of the data plotted in Figure 4b,d,f also demonstrate that irreversible processes arise at initial cytosolic [Ca2+] in the 200–300 μM range. This result agrees with acceptable accuracy with the earlier reported experimental data [37,41].
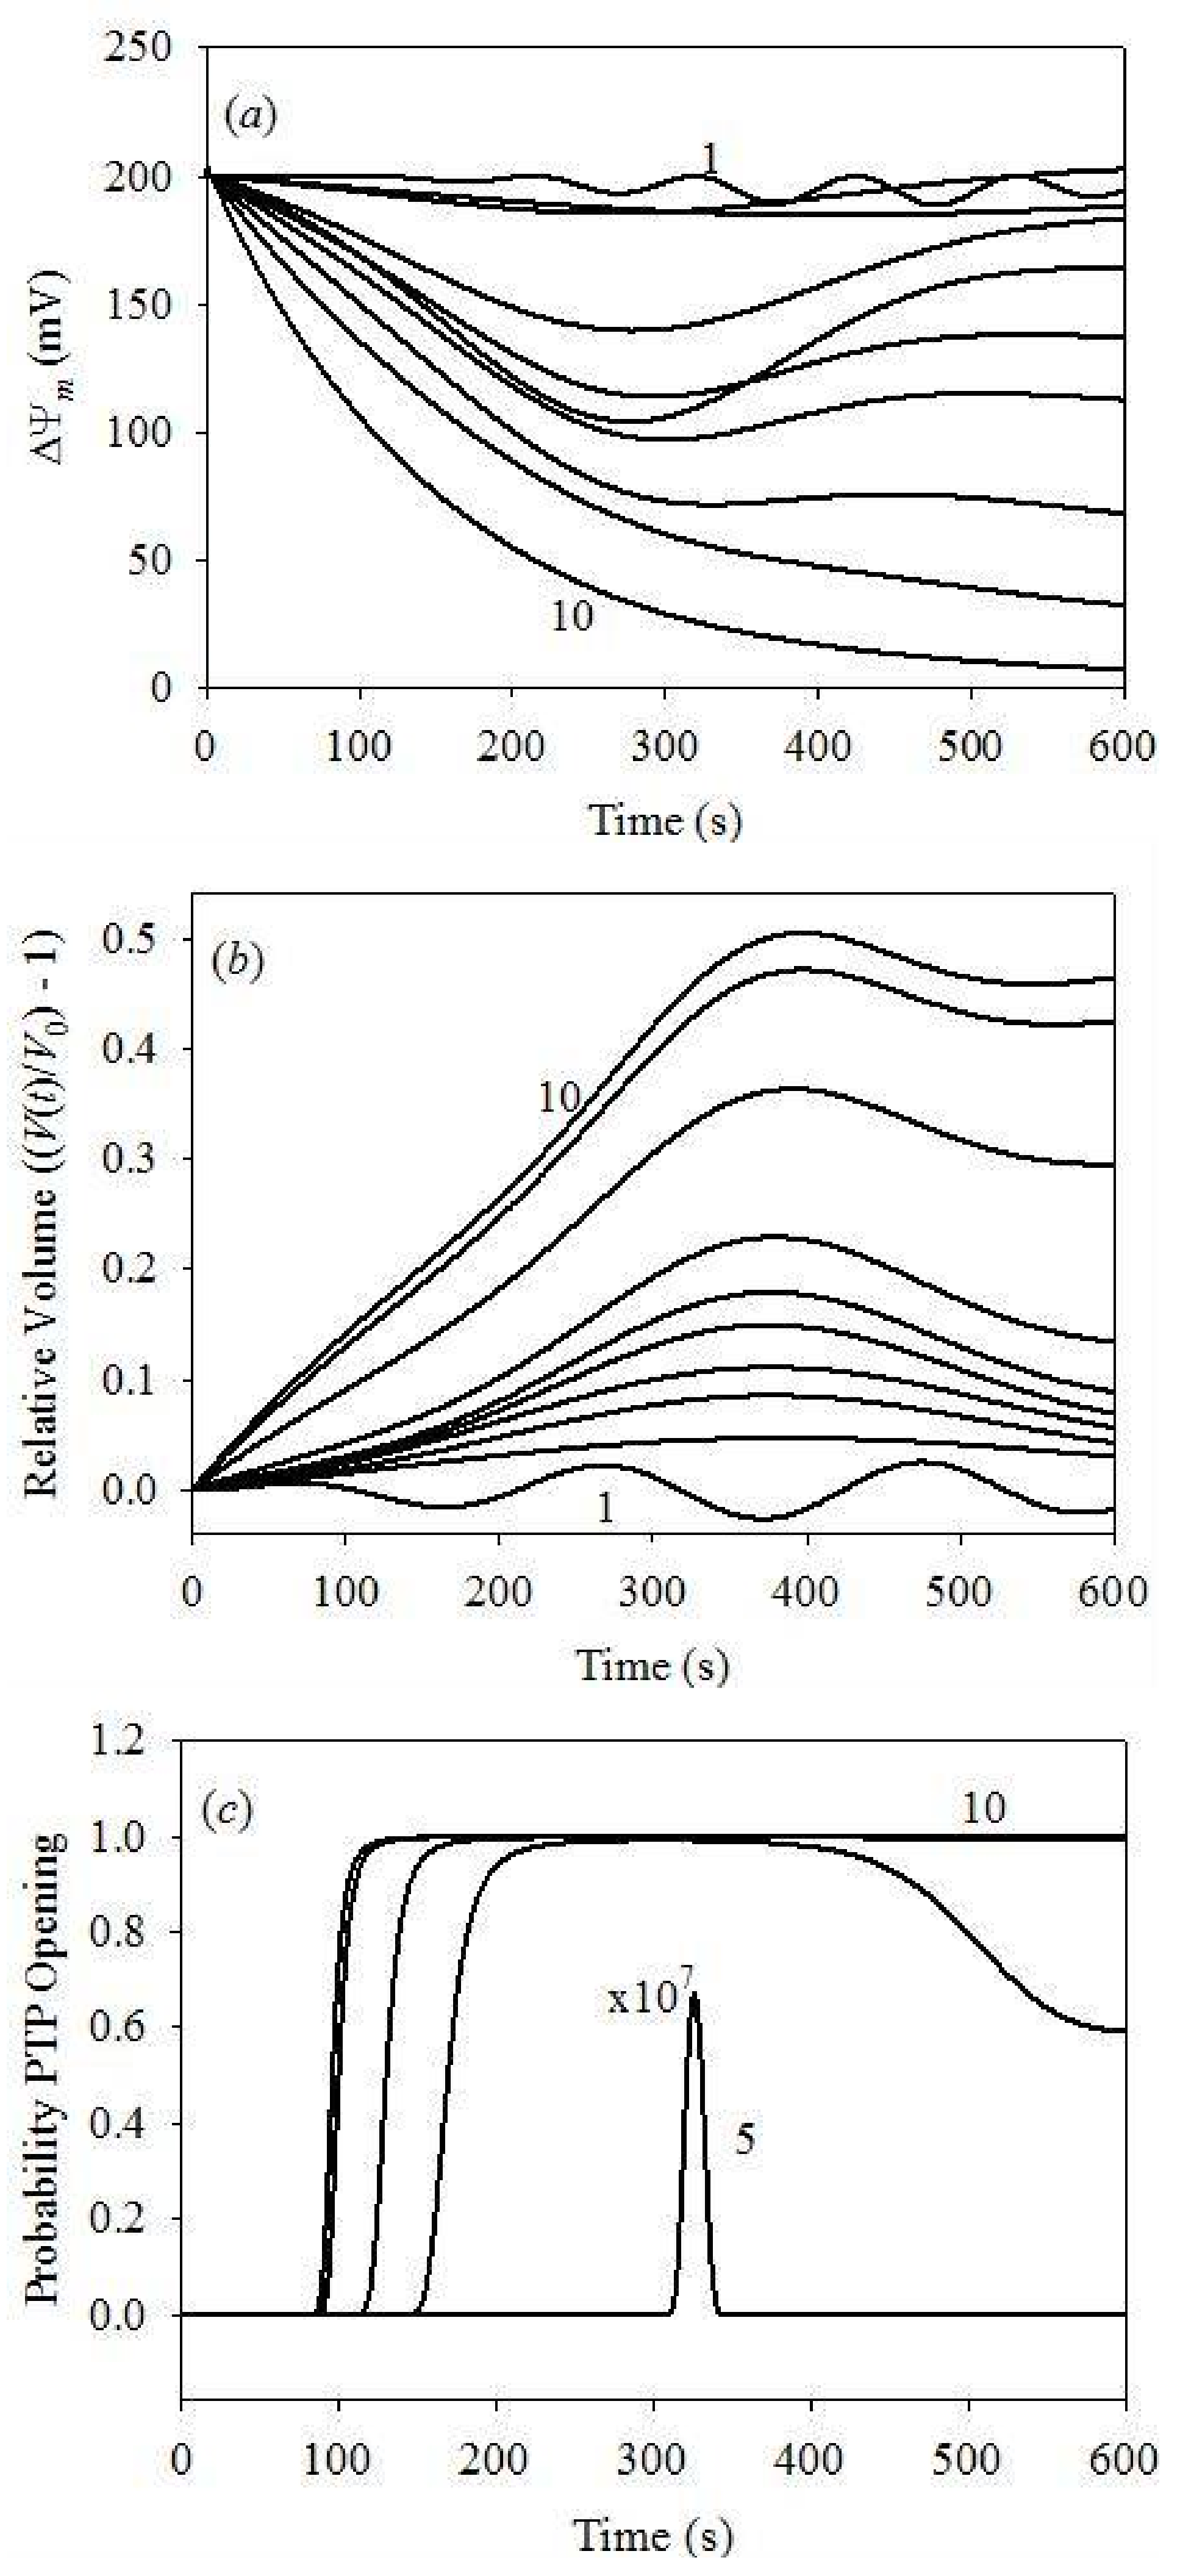
Figure 5 demonstrates time evolution plots of PPTP, ΔΨm and in function of the initial [Ca2+] at a fixed initial cytosolic [K+] of 0.1 μM. Figure 5a plots the probability of PTP opening, showing that PTP begin to open only at the initial cytosolic [Ca2+] exceeding 100 μM. At this Ca2+ concentration, the probability of PTP opening is very small and limited in time. It increases with [Ca2+], reaching unity at 200 μM, although still for a short time only. Complete PTP opening was already observed at 150 s for [Ca2+] = 300 μM, and at 100 s for [Ca2+] ≥ 400 μM. Such PTP opening dynamics coincides with an acceptable level of accuracy with the data reported earlier [38,41].
Figure 5b plots the dynamics of ΔΨm, with weak oscillations at the initial cytosolic [Ca2+] of 1.0 μM. This result agrees with earlier model data [38], reporting weak oscillations of ΔΨm in similar conditions. However, previous studies demonstrated different results reporting deep modulation of ΔΨm, from 0 to 175 mV [46]. We will address these discrepancies in a future publication by the inclusion of the swelling dynamics. It should be noted that our swelling model is quite different, whereas the frequency of oscillation reported in our study is in agreement with the earlier reported model [46]. In conclusion, ΔΨm remains reversible for the initial cytosolic [Ca2+] in 25–200 μM range; however, it becomes irreversible at cytosolic [Ca2+] exceeding 300 μm, and completely depolarized at 500 μM. These results agree with the data reported earlier [26,43,65].
Figure 5c plots the dynamics of the matrix volume as for clarity. Note that the volume oscillations appear already at the lowest cytosolic [Ca2+]. The same results were obtained earlier both in experimental measurements [54] and theoretical modeling analysis [46]. Once again, we found an acceptable agreement between the oscillation periods obtained here and reported earlier [46]. Apparently, reversible volume changes arise at initial cytosolic [Ca2+] < 300 μM, followed by irreversible swelling at high (>300 μM) [Ca2+]. The maximum volume increase of 50% of the initial mitochondrial volume was observed, as expected on the basis of the model parameterization. This volume increase corresponds to vanishing rigidity constant, Equation (28) and the data of Table 2, and, therefore, to the irreversible deformation and mitochondrial death.
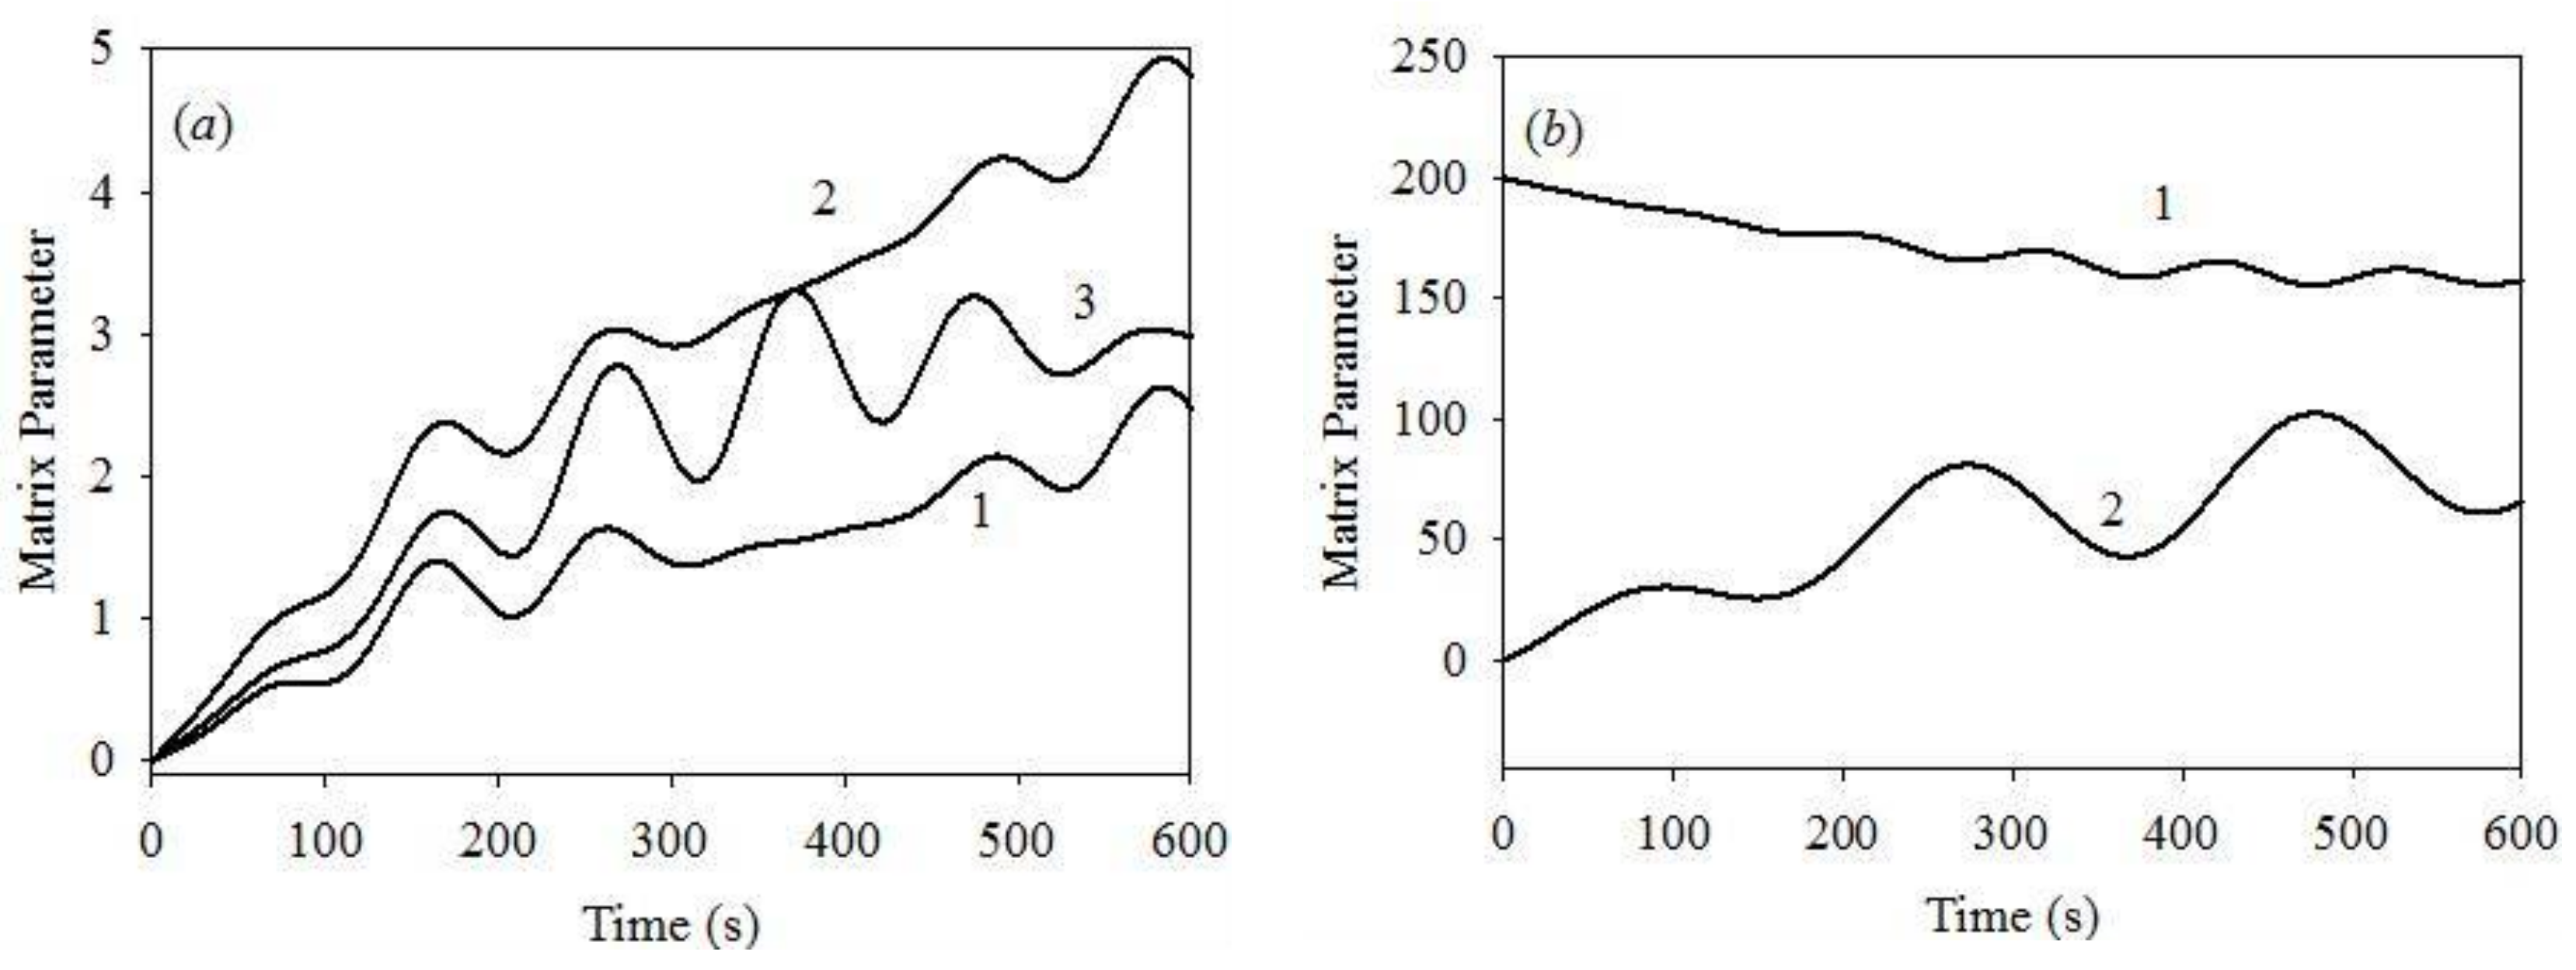
We report significant differences between the results obtained at [K+] of 0.1 and 10.0 μM, and [Ca2+] = 1.0 μM, see the plots of Figure 4a,c,e, Figure 5b and Figure 6, illustrating the dynamics of various system parameters. The results obtained at other [Ca2+] values are similar to those plotted in Figure 4 and Figure 5 at both [K+] values of 0.1 and 10.0 μM. We, therefore, only plot the results obtained for [K+] = 10 μM and [Ca2+] = 1 μM. Figure 6a shows that all of the matrix concentrations reveal weak oscillation dynamics, with periods similar to those obtained for the initial cytosolic [K+] = 0.1 μM. However, the modulation depth at [K+] = 10 μM is smaller than that obtained at the initial cytosolic [K+] = 0.1 μM. The same is apparent for the ΔΨm and mitochondrial volume dynamics. Thus, the changes in the initial cytosolic [K+] produce only minor changes in the dynamics of the key system parameters.
Thus, our numerical model produces results that are different from those obtained in previous studies using a more sophisticated model [46]. The strongest discrepancies in the modulation depth of different model parameters appear at low [Ca2+]. For instance, we report ΔΨm modulation depth of 5–7% of the maximum value, while the previous study [46] reports 100% modulation depth, although still in the reversible mode. Apparently, even complete IMM depolarization does not affect the system dynamics in the respective model. This issue will be addressed in a future study, with the presently proposed swelling mechanism included in a more complex model. The swelling mechanism proposed in the previous report only considers the osmotic pressure, disregarding the interaction between the IMM rigidity and IMM deformation.
5. Conclusions
In the present study, we implemented a simplified model of mitochondrial swelling that includes the contribution of osmosis and the IMM rigidity. This is a novel biophysical approach to mitochondrial swelling dynamics, which we will incorporate into more complex and sophisticated models. The numerical experiments in the framework of the developed model produced reasonable results, which describe the earlier reported experimental data with an acceptable accuracy.
6. Limitations of the Study
The modeling approach explored in the present study is limited by the simplified treatment of the biophysical and chemical processes, including transport of only three ionic species and a simplified respiration mechanism. However, we intentionally focused on the development of a more complex mechanism of mitochondrial swelling, and its usage in the analysis of the more sophisticated modeling approaches reported previously.
Acknowledgments
Research reported in this publication was supported by the National Institute of General Medical Sciences of the National Institutes of Health under Award Number SC1GM128210 (to Sabzali Javadov), and by the Puerto Rico Institute for Functional Nanomaterials (National Science Foundation Grant 1002410) and the National Aeronautics and Space Administration (NASA) Puerto Rico Established Program to Stimulate Competitive Research (EPSCoR) (NASA Cooperative Agreement NNX15AK43A) (to Vladimir Makarov).
Author Contributions
Vladimir Makarov designed and developed the model, performed data analysis, and prepared manuscript draft. Igor Khmelinskii contributed to model design and development and participated in the writing of the manuscript. Sabzali Javadov supervised the project, participated in experimental design, and writing of the manuscript.
Conflicts of Interest
The authors declare no conflicts of interest.
References
- Balaban, R.S.; Nemoto, S.; Finkel, T. Mitochondria, oxidants, and aging. Cell 2005, 120, 483–495. [Google Scholar] [CrossRef] [PubMed]
- O’Rourke, B.; Ramza, B.M.; Marban, E. Oscillations of membrane current and excitability driven by metabolic oscillations in heart cells. Science 1994, 265, 962–966. [Google Scholar] [CrossRef] [PubMed]
- Tan, S.; Sagara, Y.; Liu, Y.; Maher, P.; Schubert, D. The regulation of reactive oxygen species production during programmed cell death. J. Cell Biol. 1998, 141, 1423–1432. [Google Scholar] [CrossRef] [PubMed]
- Halestrap, A.P.; Kerr, P.M.; Javadov, S.; Woodfield, K.Y. Elucidating the molecular mechanism of the permeability transition pore and its role in reperfusion injury of the heart. Biochim. Biophys. Acta 1998, 1366, 79–94. [Google Scholar] [CrossRef]
- Bernardi, P.; Di Lisa, F. The mitochondrial permeability transition pore: Molecular nature and role as a target in cardioprotection. J. Mol. Cell. Cardiol. 2015, 78, 100–106. [Google Scholar] [CrossRef] [PubMed]
- Kwong, J.Q.; Molkentin, J.D. Physiological and pathological roles of the mitochondrial permeability transition pore in the heart. Cell Metab. 2015, 21, 206–214. [Google Scholar] [CrossRef] [PubMed]
- Javadov, S.; Jang, S.; Parodi-Rullan, R.; Khuchua, Z.; Kuznetsov, A.V. Mitochondrial permeability transition in cardiac ischemia-reperfusion: Whether cyclophilin d is a viable target for cardioprotection? Cell. Mol. Life Sci. 2017, 74, 2795–2813. [Google Scholar] [CrossRef] [PubMed]
- Alavian, K.N.; Beutner, G.; Lazrove, E.; Sacchetti, S.; Park, H.A.; Licznerski, P.; Li, H.; Nabili, P.; Hockensmith, K.; Graham, M.; et al. An uncoupling channel within the c-subunit ring of the f1fo atp synthase is the mitochondrial permeability transition pore. Proc. Natl. Acad. Sci. USA 2014, 111, 10580–10585. [Google Scholar] [CrossRef] [PubMed]
- Giorgio, V.; von Stockum, S.; Antoniel, M.; Fabbro, A.; Fogolari, F.; Forte, M.; Glick, G.D.; Petronilli, V.; Zoratti, M.; Szabo, I.; et al. Dimers of mitochondrial atp synthase form the permeability transition pore. Proc. Natl. Acad. Sci. USA 2013, 110, 5887–5892. [Google Scholar] [CrossRef] [PubMed] [Green Version]
- He, J.; Ford, H.C.; Carroll, J.; Ding, S.; Fearnley, I.M.; Walker, J.E. Persistence of the mitochondrial permeability transition in the absence of subunit c of human atp synthase. Proc. Natl. Acad. Sci. USA 2017, 114, 3409–3414. [Google Scholar] [CrossRef] [PubMed]
- He, J.; Carroll, J.; Ding, S.; Fearnley, I.M.; Walker, J.E. Permeability transition in human mitochondria persists in the absence of peripheral stalk subunits of atp synthase. Proc. Natl. Acad. Sci. USA 2017, 114, 9086–9091. [Google Scholar] [CrossRef] [PubMed]
- Brenner, C.; Moulin, M. Physiological roles of the permeability transition pore. Circ. Res. 2012, 111, 1237–1247. [Google Scholar] [CrossRef] [PubMed]
- Hunter, D.R.; Haworth, R.A.; Southard, J.H. Relationship between configuration, function, and permeability in calcium-treated mitochondria. J. Biol. Chem. 1976, 251, 5069–5077. [Google Scholar] [PubMed]
- Ichas, F.; Mazat, J.P. From calcium signaling to cell death: Two conformations for the mitochondrial permeability transition pore. Switching from low- to high-conductance state. Biochim. Biophys. Acta 1998, 1366, 33–50. [Google Scholar] [CrossRef]
- Ichas, F.; Jouaville, L.S.; Mazat, J.P. Mitochondria are excitable organelles capable of generating and conveying electrical and calcium signals. Cell 1997, 89, 1145–1153. [Google Scholar] [CrossRef]
- Tarasov, A.I.; Griffiths, E.J.; Rutter, G.A. Regulation of atp production by mitochondrial Ca(2+). Cell Calcium 2012, 52, 28–35. [Google Scholar] [CrossRef] [PubMed]
- Dedkova, E.N.; Blatter, L.A. Calcium signaling in cardiac mitochondria. J. Mol. Cell. Cardiol. 2013, 58, 125–133. [Google Scholar] [CrossRef] [PubMed]
- Halestrap, A.P. Regulation of mitochondrial metabolism through changes in matrix volume. Biochem. Soc. Trans. 1994, 22, 522–529. [Google Scholar] [CrossRef] [PubMed]
- Bernardi, P. Mitochondrial transport of cations: Channels, exchangers, and permeability transition. Physiol. Rev. 1999, 79, 1127–1155. [Google Scholar] [CrossRef] [PubMed]
- Szabo, I.; Zoratti, M. Mitochondrial channels: Ion fluxes and more. Physiol. Rev. 2014, 94, 519–608. [Google Scholar] [CrossRef] [PubMed]
- Petronilli, V.; Penzo, D.; Scorrano, L.; Bernardi, P.; Di Lisa, F. The mitochondrial permeability transition, release of cytochrome c and cell death. Correlation with the duration of pore openings in situ. J. Biol. Chem. 2001, 276, 12030–12034. [Google Scholar] [CrossRef] [PubMed]
- Petit, P.X.; Goubern, M.; Diolez, P.; Susin, S.A.; Zamzami, N.; Kroemer, G. Disruption of the outer mitochondrial membrane as a result of large amplitude swelling: The impact of irreversible permeability transition. FEBS Lett. 1998, 426, 111–116. [Google Scholar] [CrossRef]
- Saotome, M.; Katoh, H.; Satoh, H.; Nagasaka, S.; Yoshihara, S.; Terada, H.; Hayashi, H. Mitochondrial membrane potential modulates regulation of mitochondrial Ca2+ in rat ventricular myocytes. Am. J. Physiol. Heart Circ. Physiol. 2005, 288, H1820–H1828. [Google Scholar] [CrossRef] [PubMed]
- Kirichok, Y.; Krapivinsky, G.; Clapham, D.E. The mitochondrial calcium uniporter is a highly selective ion channel. Nature 2004, 427, 360–364. [Google Scholar] [CrossRef] [PubMed]
- Griffiths, E.J. Mitochondrial calcium transport in the heart: Physiological and pathological roles. J. Mol. Cell. Cardiol. 2009, 46, 789–803. [Google Scholar] [CrossRef] [PubMed]
- Szabo, I.; Bernardi, P.; Zoratti, M. Modulation of the mitochondrial megachannel by divalent cations and protons. J. Biol. Chem. 1992, 267, 2940–2946. [Google Scholar] [PubMed]
- Hoppe, U.C. Mitochondrial calcium channels. FEBS Lett. 2010, 584, 1975–1981. [Google Scholar] [CrossRef] [PubMed]
- Altschuld, R.A.; Hohl, C.M.; Castillo, L.C.; Garleb, A.A.; Starling, R.C.; Brierley, G.P. Cyclosporin inhibits mitochondrial calcium efflux in isolated adult rat ventricular cardiomyocytes. Am. J. Physiol. 1992, 262, H1699–H1704. [Google Scholar] [CrossRef] [PubMed]
- Halestrap, A.P. Calcium-dependent opening of a non-specific pore in the mitochondrial inner membrane is inhibited at ph values below 7. Implications for the protective effect of low ph against chemical and hypoxic cell damage. Biochem. J. 1991, 278, 715–719. [Google Scholar] [CrossRef] [PubMed]
- Nicolli, A.; Basso, E.; Petronilli, V.; Wenger, R.M.; Bernardi, P. Interactions of cyclophilin with the mitochondrial inner membrane and regulation of the permeability transition pore, and cyclosporin a-sensitive channel. J. Biol. Chem. 1996, 271, 2185–2192. [Google Scholar] [CrossRef] [PubMed]
- Antoniel, M.; Jones, K.; Antonucci, S.; Spolaore, B.; Fogolari, F.; Petronilli, V.; Giorgio, V.; Carraro, M.; Di Lisa, F.; Forte, M.; et al. The unique histidine in oscp subunit of f-atp synthase mediates inhibition of the permeability transition pore by acidic ph. EMBO Rep. 2018, 19, 257–268. [Google Scholar] [CrossRef] [PubMed]
- Kitakaze, M.; Takashima, S.; Funaya, H.; Minamino, T.; Node, K.; Shinozaki, Y.; Mori, H.; Hori, M. Temporary acidosis during reperfusion limits myocardial infarct size in dogs. Am. J. Physiol. 1997, 272, H2071–H2078. [Google Scholar] [CrossRef] [PubMed]
- Javadov, S.; Choi, A.; Rajapurohitam, V.; Zeidan, A.; Basnakian, A.G.; Karmazyn, M. Nhe-1 inhibition-induced cardioprotection against ischaemia/reperfusion is associated with attenuation of the mitochondrial permeability transition. Cardiovasc. Res. 2008, 77, 416–424. [Google Scholar] [CrossRef] [PubMed]
- Zamzami, N.; Marchetti, P.; Castedo, M.; Zanin, C.; Vayssiere, J.L.; Petit, P.X.; Kroemer, G. Reduction in mitochondrial potential constitutes an early irreversible step of programmed lymphocyte death in vivo. J. Exp. Med. 1995, 181, 1661–1672. [Google Scholar] [CrossRef] [PubMed]
- Lartigue, L.; Kushnareva, Y.; Seong, Y.; Lin, H.; Faustin, B.; Newmeyer, D.D. Caspase-independent mitochondrial cell death results from loss of respiration, not cytotoxic protein release. Mol. Biol. Cell 2009, 20, 4871–4884. [Google Scholar] [CrossRef] [PubMed]
- Barreto-Torres, G.; Hernandez, J.S.; Jang, S.; Rodriguez-Munoz, A.R.; Torres-Ramos, C.A.; Basnakian, A.G.; Javadov, S. The beneficial effects of amp kinase activation against oxidative stress are associated with prevention of pparalpha-cyclophilin d interaction in cardiomyocytes. Am. J. Physiol. Heart Circ. Physiol. 2015, 308, H749–H758. [Google Scholar] [CrossRef] [PubMed]
- Chapa-Dubocq, X.; Makarov, V.; Javadov, S. Simple kinetic model of mitochondrial swelling in cardiac cells. J. Cell. Physiol. 2017. [Google Scholar] [CrossRef] [PubMed]
- Selivanov, V.A.; Ichas, F.; Holmuhamedov, E.L.; Jouaville, L.S.; Evtodienko, Y.V.; Mazat, J.P. A model of mitochondrial Ca2+-induced Ca2+ release simulating the Ca2+ oscillations and spikes generated by mitochondria. Biophys. Chem. 1998, 72, 111–121. [Google Scholar] [CrossRef]
- Javadov, S.; Chapa-Dubocq, X.; Makarov, V. Different approaches to modeling analysis of mitochondrial swelling. Mitochondrion 2018, 38, 58–70. [Google Scholar] [CrossRef] [PubMed]
- Veech, R.L.; Kashiwaya, Y.; King, M.T. The resting membrane potential of cells are measures of electrical work, not of ionic currents. Integr. Physiol. Behav. Sci. 1995, 30, 283–307. [Google Scholar] [CrossRef] [PubMed]
- Massari, S. Kinetic analysis of the mitochondrial permeability transition. J. Biol. Chem. 1996, 271, 31942–31948. [Google Scholar]
- Baranov, S.V.; Stavrovskaya, I.G.; Brown, A.M.; Tyryshkin, A.M.; Kristal, B.S. Kinetic model for Ca2+-induced permeability transition in energized liver mitochondria discriminates between inhibitor mechanisms. J. Biol. Chem. 2008, 283, 665–676. [Google Scholar] [CrossRef] [PubMed]
- Bazil, J.N.; Buzzard, G.T.; Rundell, A.E. Modeling mitochondrial bioenergetics with integrated volume dynamics. PLoS Comput. Biol. 2010, 6, e1000632. [Google Scholar] [CrossRef] [PubMed]
- Dash, R.K.; Qi, F.; Beard, D.A. A biophysically based mathematical model for the kinetics of mitochondrial calcium uniporter. Biophys. J. 2009, 96, 1318–1332. [Google Scholar] [CrossRef] [PubMed]
- Eisenhofer, S.; Tookos, F.; Hense, B.A.; Schulz, S.; Filbir, F.; Zischka, H. A mathematical model of mitochondrial swelling. BMC Res. Notes 2010, 3, 67. [Google Scholar] [CrossRef] [PubMed]
- Pokhilko, A.V.; Ataullakhanov, F.I.; Holmuhamedov, E.L. Mathematical model of mitochondrial ionic homeostasis: Three modes of Ca2+ transport. J. Theor. Biol. 2006, 243, 152–169. [Google Scholar] [CrossRef] [PubMed]
- Barr, L. Membrane potential profiles and the goldman equation. J. Theor. Biol. 1965, 9, 351–356. [Google Scholar] [CrossRef]
- Zoratti, M.; Szabo, I. The mitochondrial permeability transition. Biochim. Biophys. Acta 1995, 1241, 139–176. [Google Scholar] [CrossRef]
- Bernardi, P.; Petronilli, V. The permeability transition pore as a mitochondrial calcium release channel: A critical appraisal. J. Bioenerg. Biomembr. 1996, 28, 131–138. [Google Scholar] [CrossRef] [PubMed]
- Kim, Y.V.; Kudzina, L.; Zinchenko, V.P.; Evtodienko, Y.V. Chlortetracycline-mediated continuous Ca2+ oscillations in mitochondria of digitonin-treated tetrahymena pyriformis. Eur. J. Biochem. 1985, 153, 503–507. [Google Scholar] [CrossRef] [PubMed]
- Fuoss, R.M.; Kraus, C.A. Properties of electrolytic solutions. XV. Thermodynamic properties of very weak electrolytes. J. Am. Chem. Soc. 1935, 57, 1–4. [Google Scholar] [CrossRef]
- Naraghi, M. T-jump study of calcium binding kinetics of calcium chelators. Cell Calcium 1997, 22, 255–268. [Google Scholar] [CrossRef]
- Aon, M.A.; Cortassa, S.; O’Rourke, B. Mitochondrial oscillations in physiology and pathophysiology. Adv. Exp. Med. Biol. 2008, 641, 98–117. [Google Scholar] [PubMed]
- Kaasik, A.; Safiulina, D.; Zharkovsky, A.; Veksler, V. Regulation of mitochondrial matrix volume. Am. J. Physiol. Cell Physiol. 2007, 292, C157–C163. [Google Scholar] [CrossRef] [PubMed]
- Yugi, K.; Tomita, M. A general computational model of mitochondrial metabolism in a whole organelle scale. Bioinformatics 2004, 20, 1795–1796. [Google Scholar] [CrossRef]
- Bešter-Rogač, M.; Habe, D. Modern advances in electrical conductivity measurements of solutions. Acta Chim. Slov. 2006, 53, 391–395. [Google Scholar]
- Macey, R.I. Transport of water and urea in red blood cells. Am. J. Physiol. 1984, 246, C195–C203. [Google Scholar] [CrossRef] [PubMed]
- Gerencser, A.A.; Doczi, J.; Torocsik, B.; Bossy-Wetzel, E.; Adam-Vizi, V. Mitochondrial swelling measurement in situ by optimized spatial filtering: Astrocyte-neuron differences. Biophys. J. 2008, 95, 2583–2598. [Google Scholar] [CrossRef] [PubMed]
- Atkins, P.; de Paulo, J. Physical Chemistry, 7th ed.; W.H. Freeman and Company: New York, NY, USA, 2002; pp. 841–853. ISBN 0-7167-3539-3. [Google Scholar]
- Glaser, R. Biophysics; An Introduction; Springer: Berlin/Heidelberg, Germany, 2012; pp. 171–183. ISBN1 13978-3642252112. ISBN2 103642252117. [Google Scholar]
- Song, D.H.; Park, J.; Maurer, L.L.; Lu, W.; Philbert, M.A.; Sastry, A.M. Biophysical significance of the inner mitochondrial membrane structure on the electrochemical potential of mitochondria. Phys. Rev. E Stat. Nonlinear Soft Matter Phys. 2013, 88, 062723. [Google Scholar] [CrossRef] [PubMed]
- Lim, K.H.; Javadov, S.A.; Das, M.; Clarke, S.J.; Suleiman, M.S.; Halestrap, A.P. The effects of ischaemic preconditioning, diazoxide and 5-hydroxydecanoate on rat heart mitochondrial volume and respiration. J. Physiol. 2002, 545, 961–974. [Google Scholar] [CrossRef] [PubMed]
- Santo-Domingo, J.; Demaurex, N. Calcium uptake mechanisms of mitochondria. Biochim. Biophys. Acta 2010, 1797, 907–912. [Google Scholar] [CrossRef] [PubMed]
- Robertson, D.E.; Rottenberg, H. Membrane potential and surface potential in mitochondria. Fluorescence and binding of 1-anilinonaphthalene-8-sulfonate. J. Biol. Chem. 1983, 258, 11039–11048. [Google Scholar] [PubMed]
- De Marchi, U.; Szabo, I.; Cereghetti, G.M.; Hoxha, P.; Craigen, W.J.; Zoratti, M. A maxi-chloride channel in the inner membrane of mammalian mitochondria. Biochim. Biophys. Acta 2008, 1777, 1438–1448. [Google Scholar] [CrossRef] [PubMed]
Sample Availability: Not available. |
Figure 1.
The mechanism of Ca2+-induced swelling of mitochondria. (See text for details.)
Figure 2.
Biophysical approach to modeling mitochondrial swelling.

Figure 3.
PTP opening probability in function of matrix pH, using different parametrizations: (1) α = 105, n = 6; (2) α = 104, n = 5; (3) α = 1.2 × 10³, n = 4; (4) α = 103, n = 4.
Figure 3.
PTP opening probability in function of matrix pH, using different parametrizations: (1) α = 105, n = 6; (2) α = 104, n = 5; (3) α = 1.2 × 10³, n = 4; (4) α = 103, n = 4.

Figure 4.
Time evolution of matrix [Ca2+]: (a) initial [Ca2+]out = 1.0 μM; (b) plots 1 to 9: initial [Ca2+]out = 25, 50, 75, 100, 150, 200, 300, 400, 500 μM; (c,d) evolution of the matrix K+ concentration versus initial cytosolic [Ca2+], for the same initial [Ca2+]out values; (e,f) evolution of the matrix pH versus initial cytosolic [Ca2+], for the same initial [Ca2+]out values. All calculations were carried out for the background [Ca2+]in = 0.5 μM, initial cytosolic [K+] = 0.1 μM, initial matrix pH = 6. The cytosolic pH = 7.0 was kept constant.

Figure 5.
Dynamics of the IMM potential, mitochondrial volume and PTP opening probability for different initial cytosolic [Ca2+] at fixed initial cytosolic [K+] = 0.1 μM. (a) IMM potential dynamics: plots 1–10 for [Ca2+] = 1–500 μM; (b) the V(t)/V0–1 value at different cytosolic [Ca2+]: plots 1–10 for [Ca2+] = 1–500 μM; (c) dynamics of PTP opening probability: plot 5 for [Ca2+] = 100 μM is expanded by 107; plots 6 to 10: [Ca2+] = 150–500 μM, respectively. PPTP = 0 at all times for [Ca2+] = 1, 25, 50 and 75 μM.

Figure 6.
(a) Time evolution of matrix (1) [Ca2+] on the expanded scale , μM; (2) [K+], μM and (3) pH on the expanded scale , obtained for the initial cytosolic [Ca2+] = 1.0 μM and [K+] = 10 μM; at these starting conditions PPTP = 0; (b) (1) ΔΨm, mV; (2) mitochondrial volume V(t) on the expanded scale.


Table 1.
Parameter values used in modeling analysis.
| Parameter | Definition | Value | Refs |
|---|---|---|---|
| pCa,UP | Reduced permeability coefficient of the Ca2+ transport by uniporter | 6.43 × 10⁵, min−1mV−1 (mg protein)−1 (K × esu/erg) | [18,48,49,50] |
| pK,H(0) | Reduced permeability coefficient of the K+/H+ exchange | 3.20 × 10⁵, min−1mV−1 (mg protein)−1 (K × esu/erg) (μMH)−1 | [47] |
| PH,K(0) | Reduced permeability coefficient of the H+/K+ exchange | 3.20 × 10⁵, min−1mV−1(mg protein)−1 (K × esu/erg) (mMK)−1 | [47] |
| pH+,PTP | Reduced permeability coefficient of the H+ transport by PTP | 4.30 × 10⁷, min−1mV−1 (mg protein)−1 (K × esu/erg) | [47] |
| pCa2+,PTP | Reduced permeability coefficient of the Ca2+ transport by PTP | 8.61 × 10⁷, min−1mV−1 (mg protein)−1 (K × esu/erg) | [48] |
| PK+,PTP | Reduced permeability coefficient of the K+ transport by PTP | 4.30 × 10⁷, min−1mV−1 (mg protein)−1 (K × esu/erg) | [51] |
| pA-,PTP | Reduced permeability coefficient of the A− transport by PTP | 6.43 × 10², min−1mV−1 (mg protein)−1 (K × esu/erg) | [48] |
| pA,PTP | Reduced permeability coefficient of the A transport by PTP | 32.1, min−1 (mg protein)−1 | [48] |
| |e| | Absolute value of the electron charge | 4.80286 × 10⁻¹⁰ esu | [52] |
| kB | Boltzmann constant | 1.38044 × 10⁻¹⁶ erg/K | [52] |
| ΔΨm | IMM potential | 200 mV | [44,47,48] |
| VC/Vm(t = 0) | Ratio of adult rat heart cell volume to total volume of all cell mitochondria | 2.86 | [49] |
Table 2.
Values of the input parameters.
| α | 1.2 × 10³ | |||||||||
| n | 4 | |||||||||
| ; μM | 0.10 | 1.2 | 2.3 | 3.4 | 4.5 | 5.6 | 6.7 | 7.8 | 8.9 | 10 |
| ; μM | 1.0 | 25 | 50 | 75 | 100 | 150 | 200 | 300 | 400 | 500 |
| −log() | 7.00 | |||||||||
| −log() | 6.00 | |||||||||
| ; μM | 50 | |||||||||
| δ(ΔΨm); mV | 43.42 | |||||||||
| ; μM | 10 | |||||||||
| kA; min−1 | 1 | |||||||||
| kA,H+; min−1 | 1 | |||||||||
| g00; dyn/nm | 0.017 | |||||||||
| gzz,0; dyn/nm | 0.019 | |||||||||
| β0; nm−n1 | 106 | |||||||||
| βz; nm−n1 | 107 | |||||||||
| n1 | 4 | |||||||||
© 2018 by the authors. Licensee MDPI, Basel, Switzerland. This article is an open access article distributed under the terms and conditions of the Creative Commons Attribution (CC BY) license (http://creativecommons.org/licenses/by/4.0/).
Share and Cite
MDPI and ACS Style
Makarov, V.I.; Khmelinskii, I.; Javadov, S. Computational Modeling of In Vitro Swelling of Mitochondria: A Biophysical Approach. Molecules 2018, 23, 783. https://doi.org/10.3390/molecules23040783
AMA Style
Makarov VI, Khmelinskii I, Javadov S. Computational Modeling of In Vitro Swelling of Mitochondria: A Biophysical Approach. Molecules. 2018; 23(4):783. https://doi.org/10.3390/molecules23040783
Chicago/Turabian StyleMakarov, Vladimir I., Igor Khmelinskii, and Sabzali Javadov. 2018. "Computational Modeling of In Vitro Swelling of Mitochondria: A Biophysical Approach" Molecules 23, no. 4: 783. https://doi.org/10.3390/molecules23040783