Validated 1H and 13C Nuclear Magnetic Resonance Methods for the Quantitative Determination of Glycerol in Drug Injections

Abstract
:
1. Introduction
2. Results and Discussion
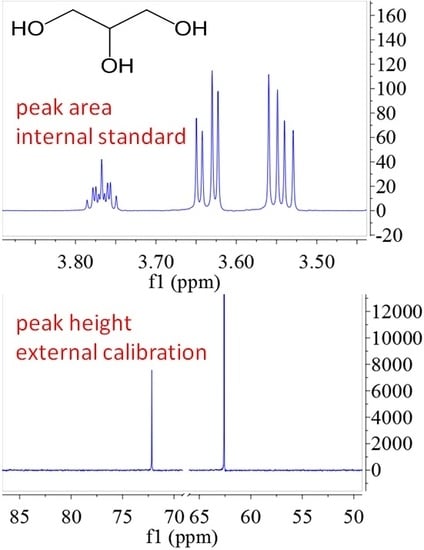
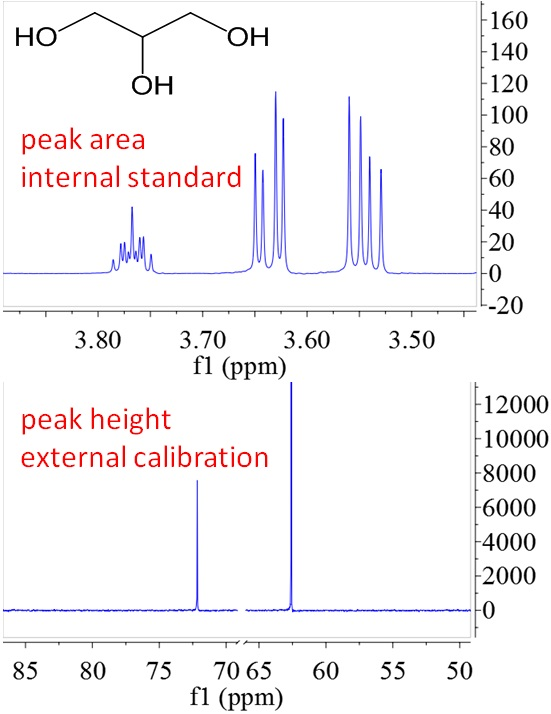
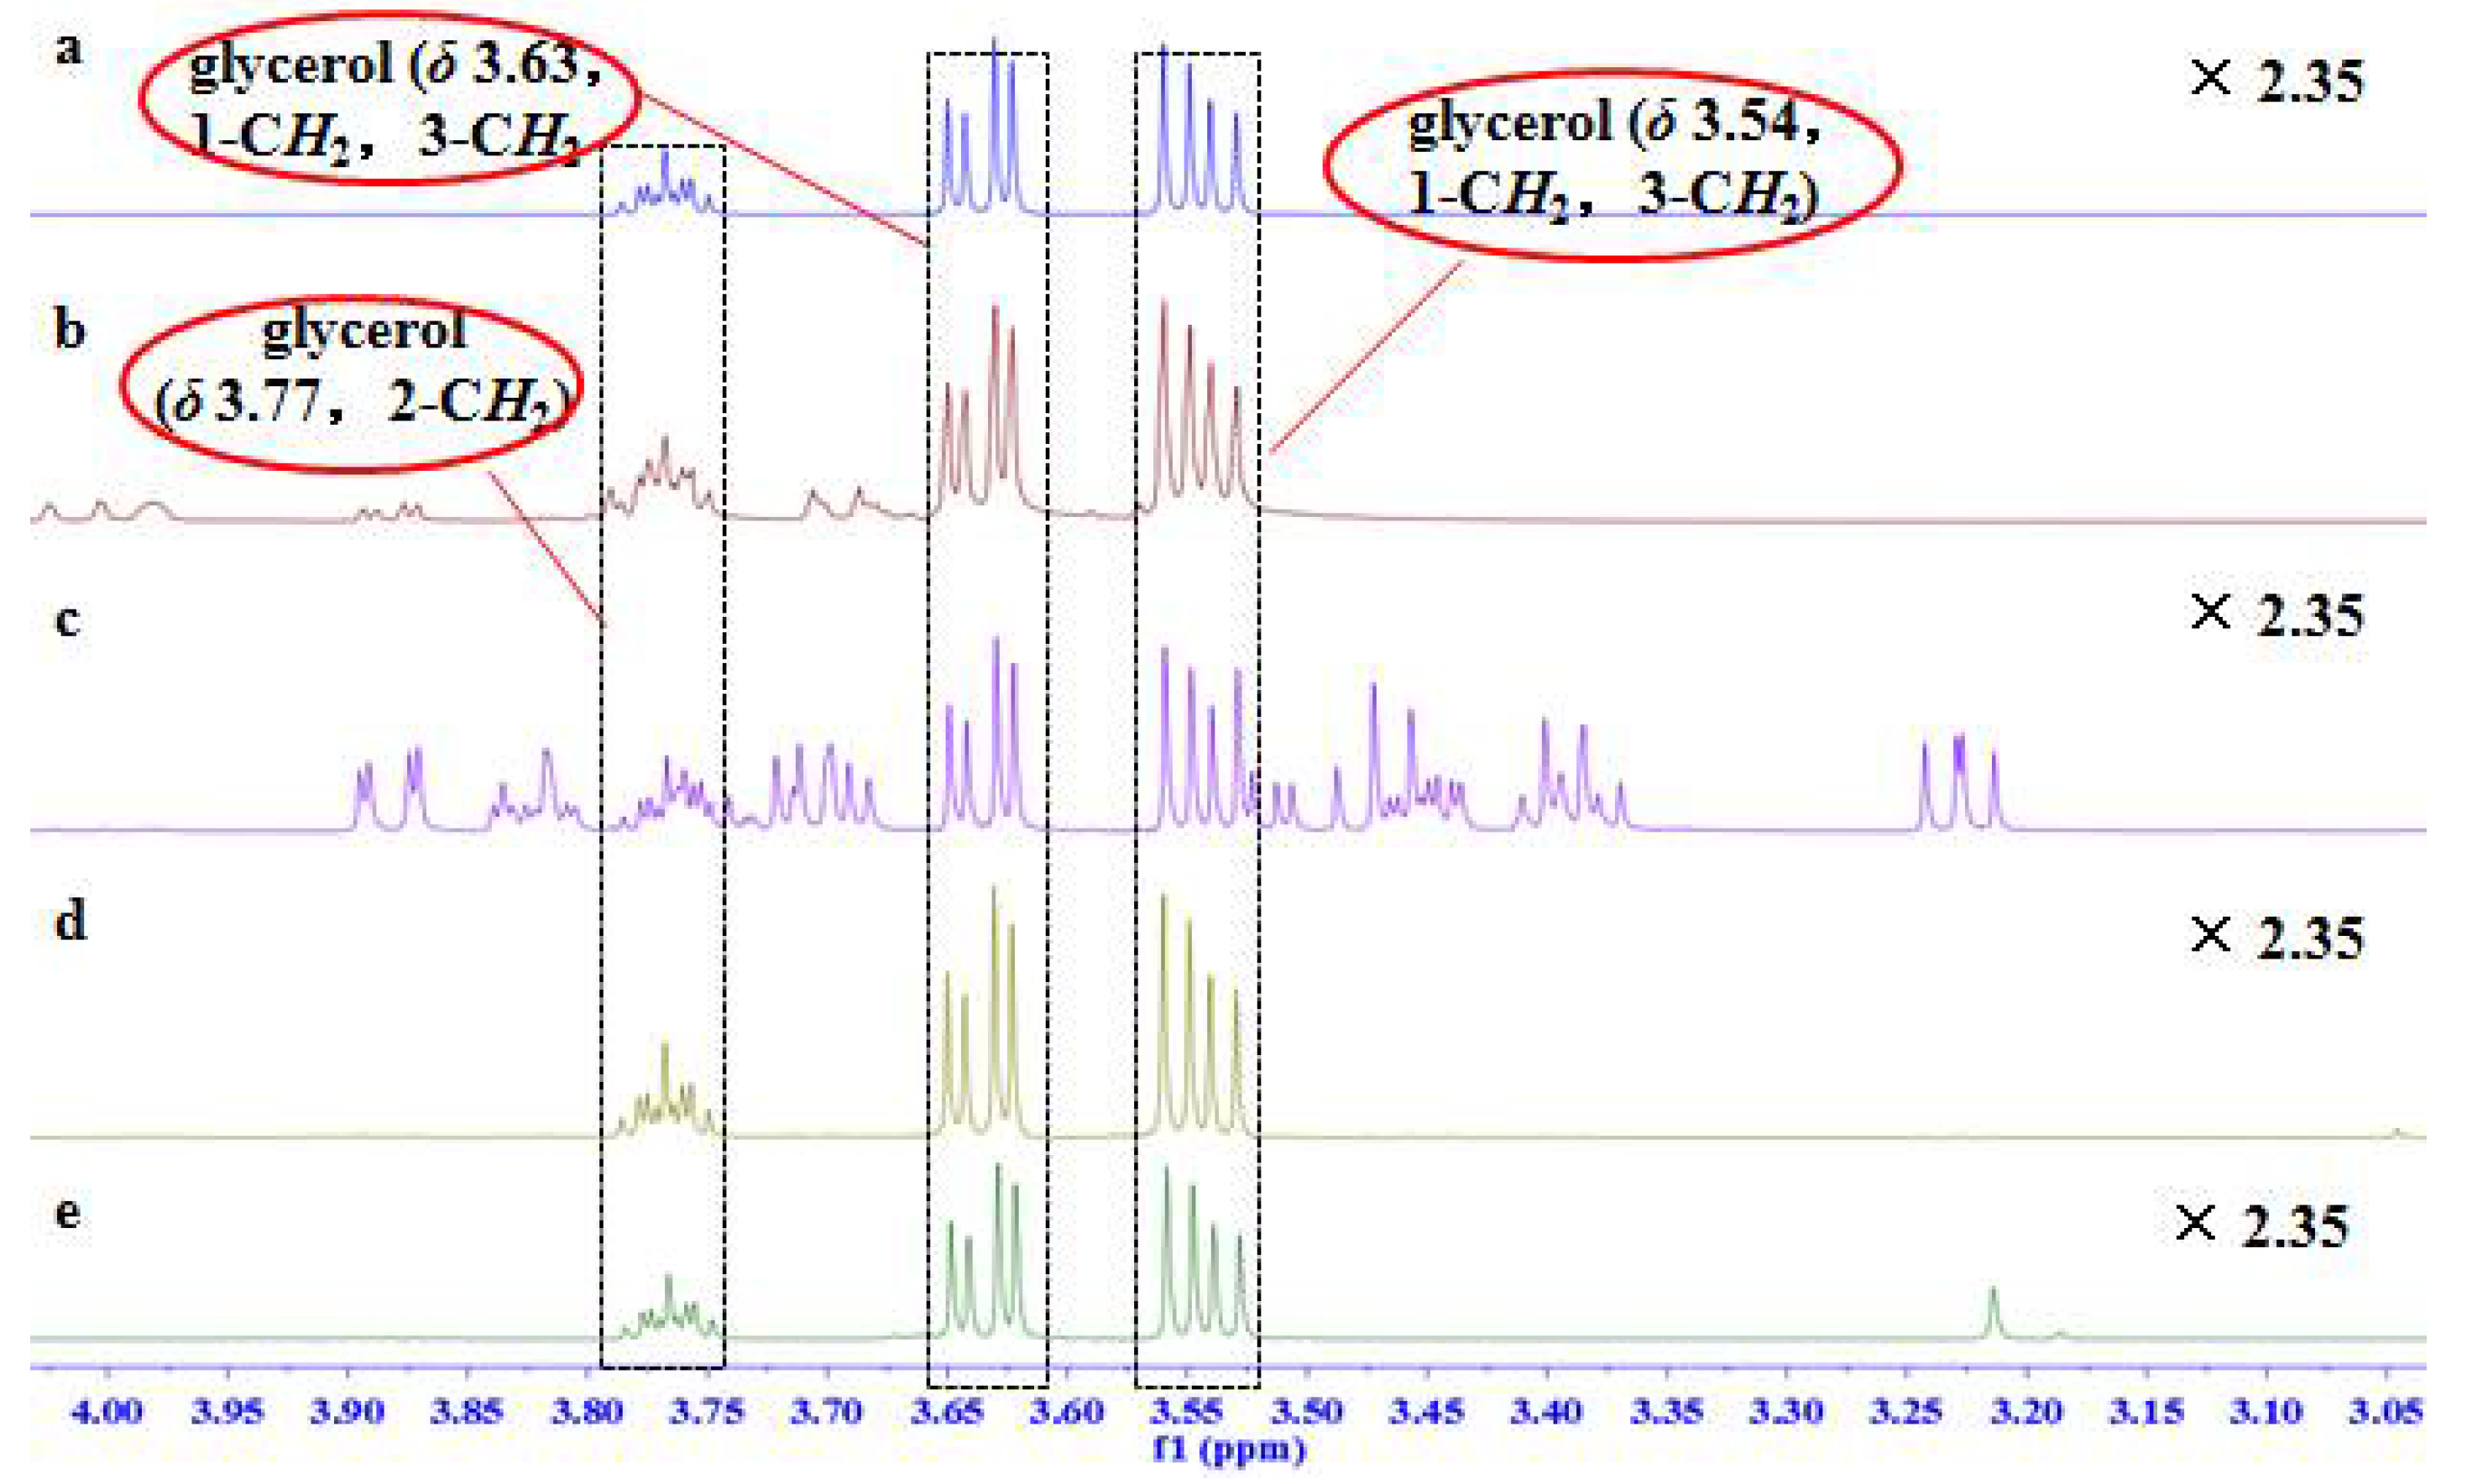
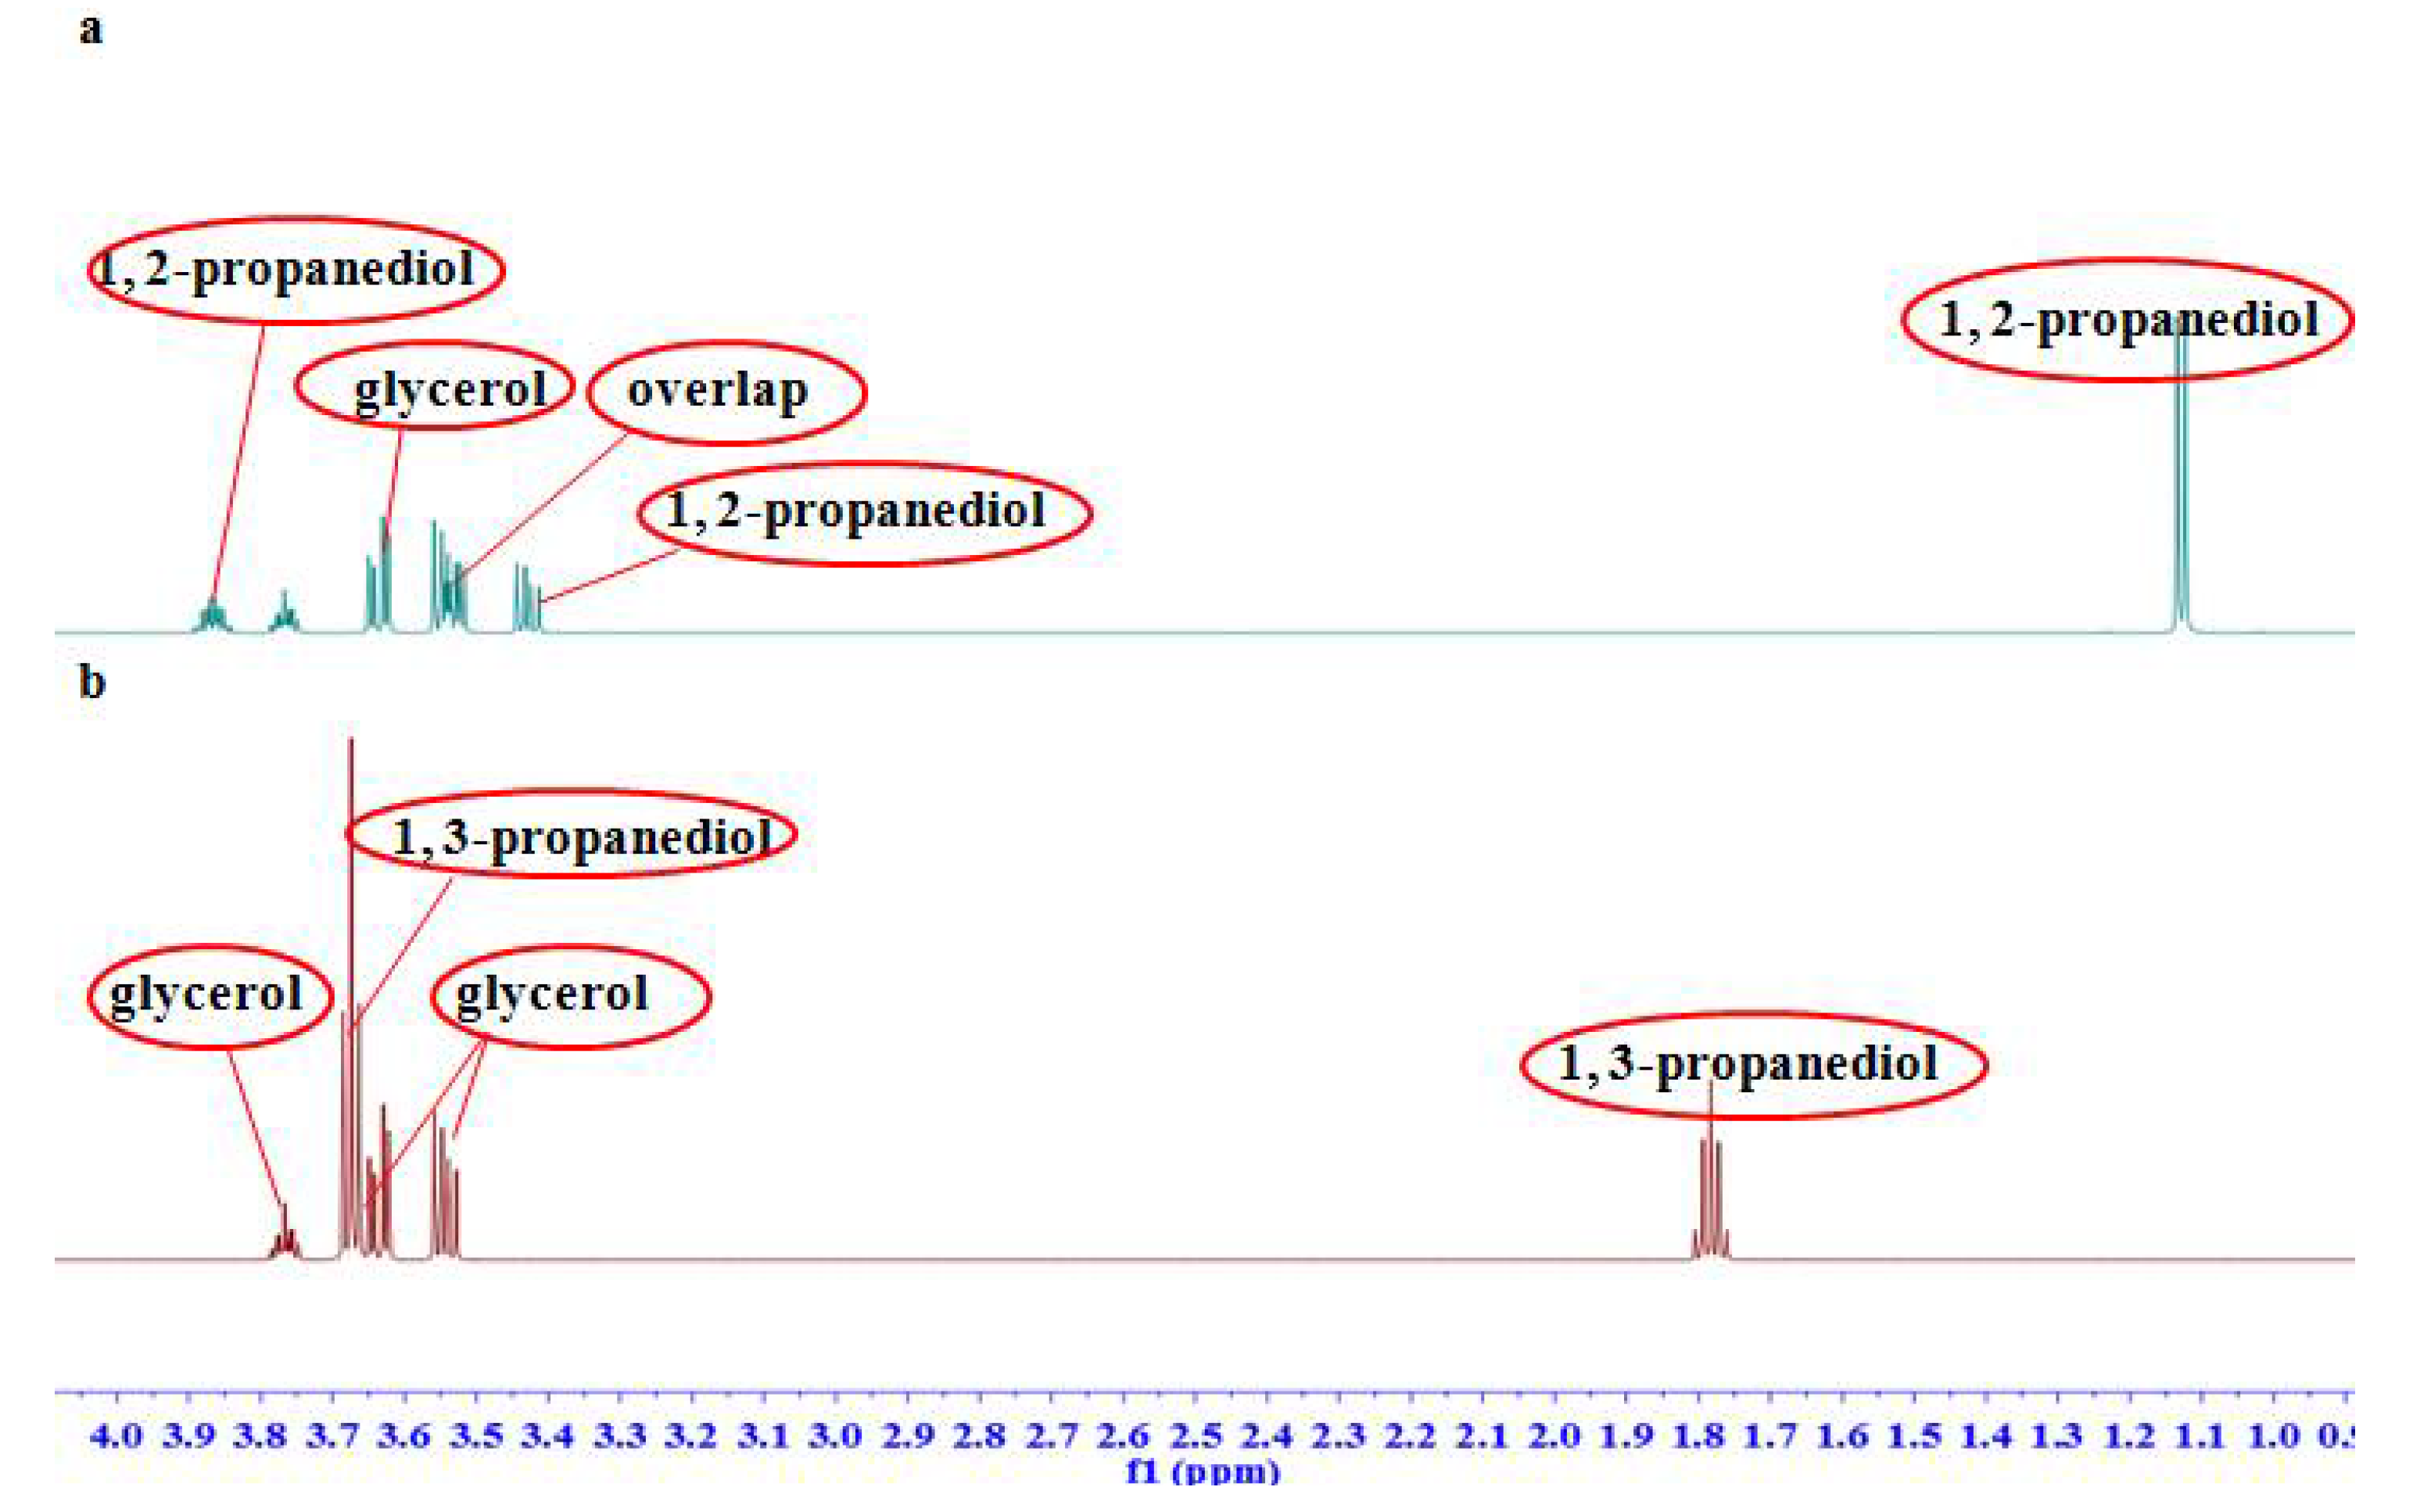
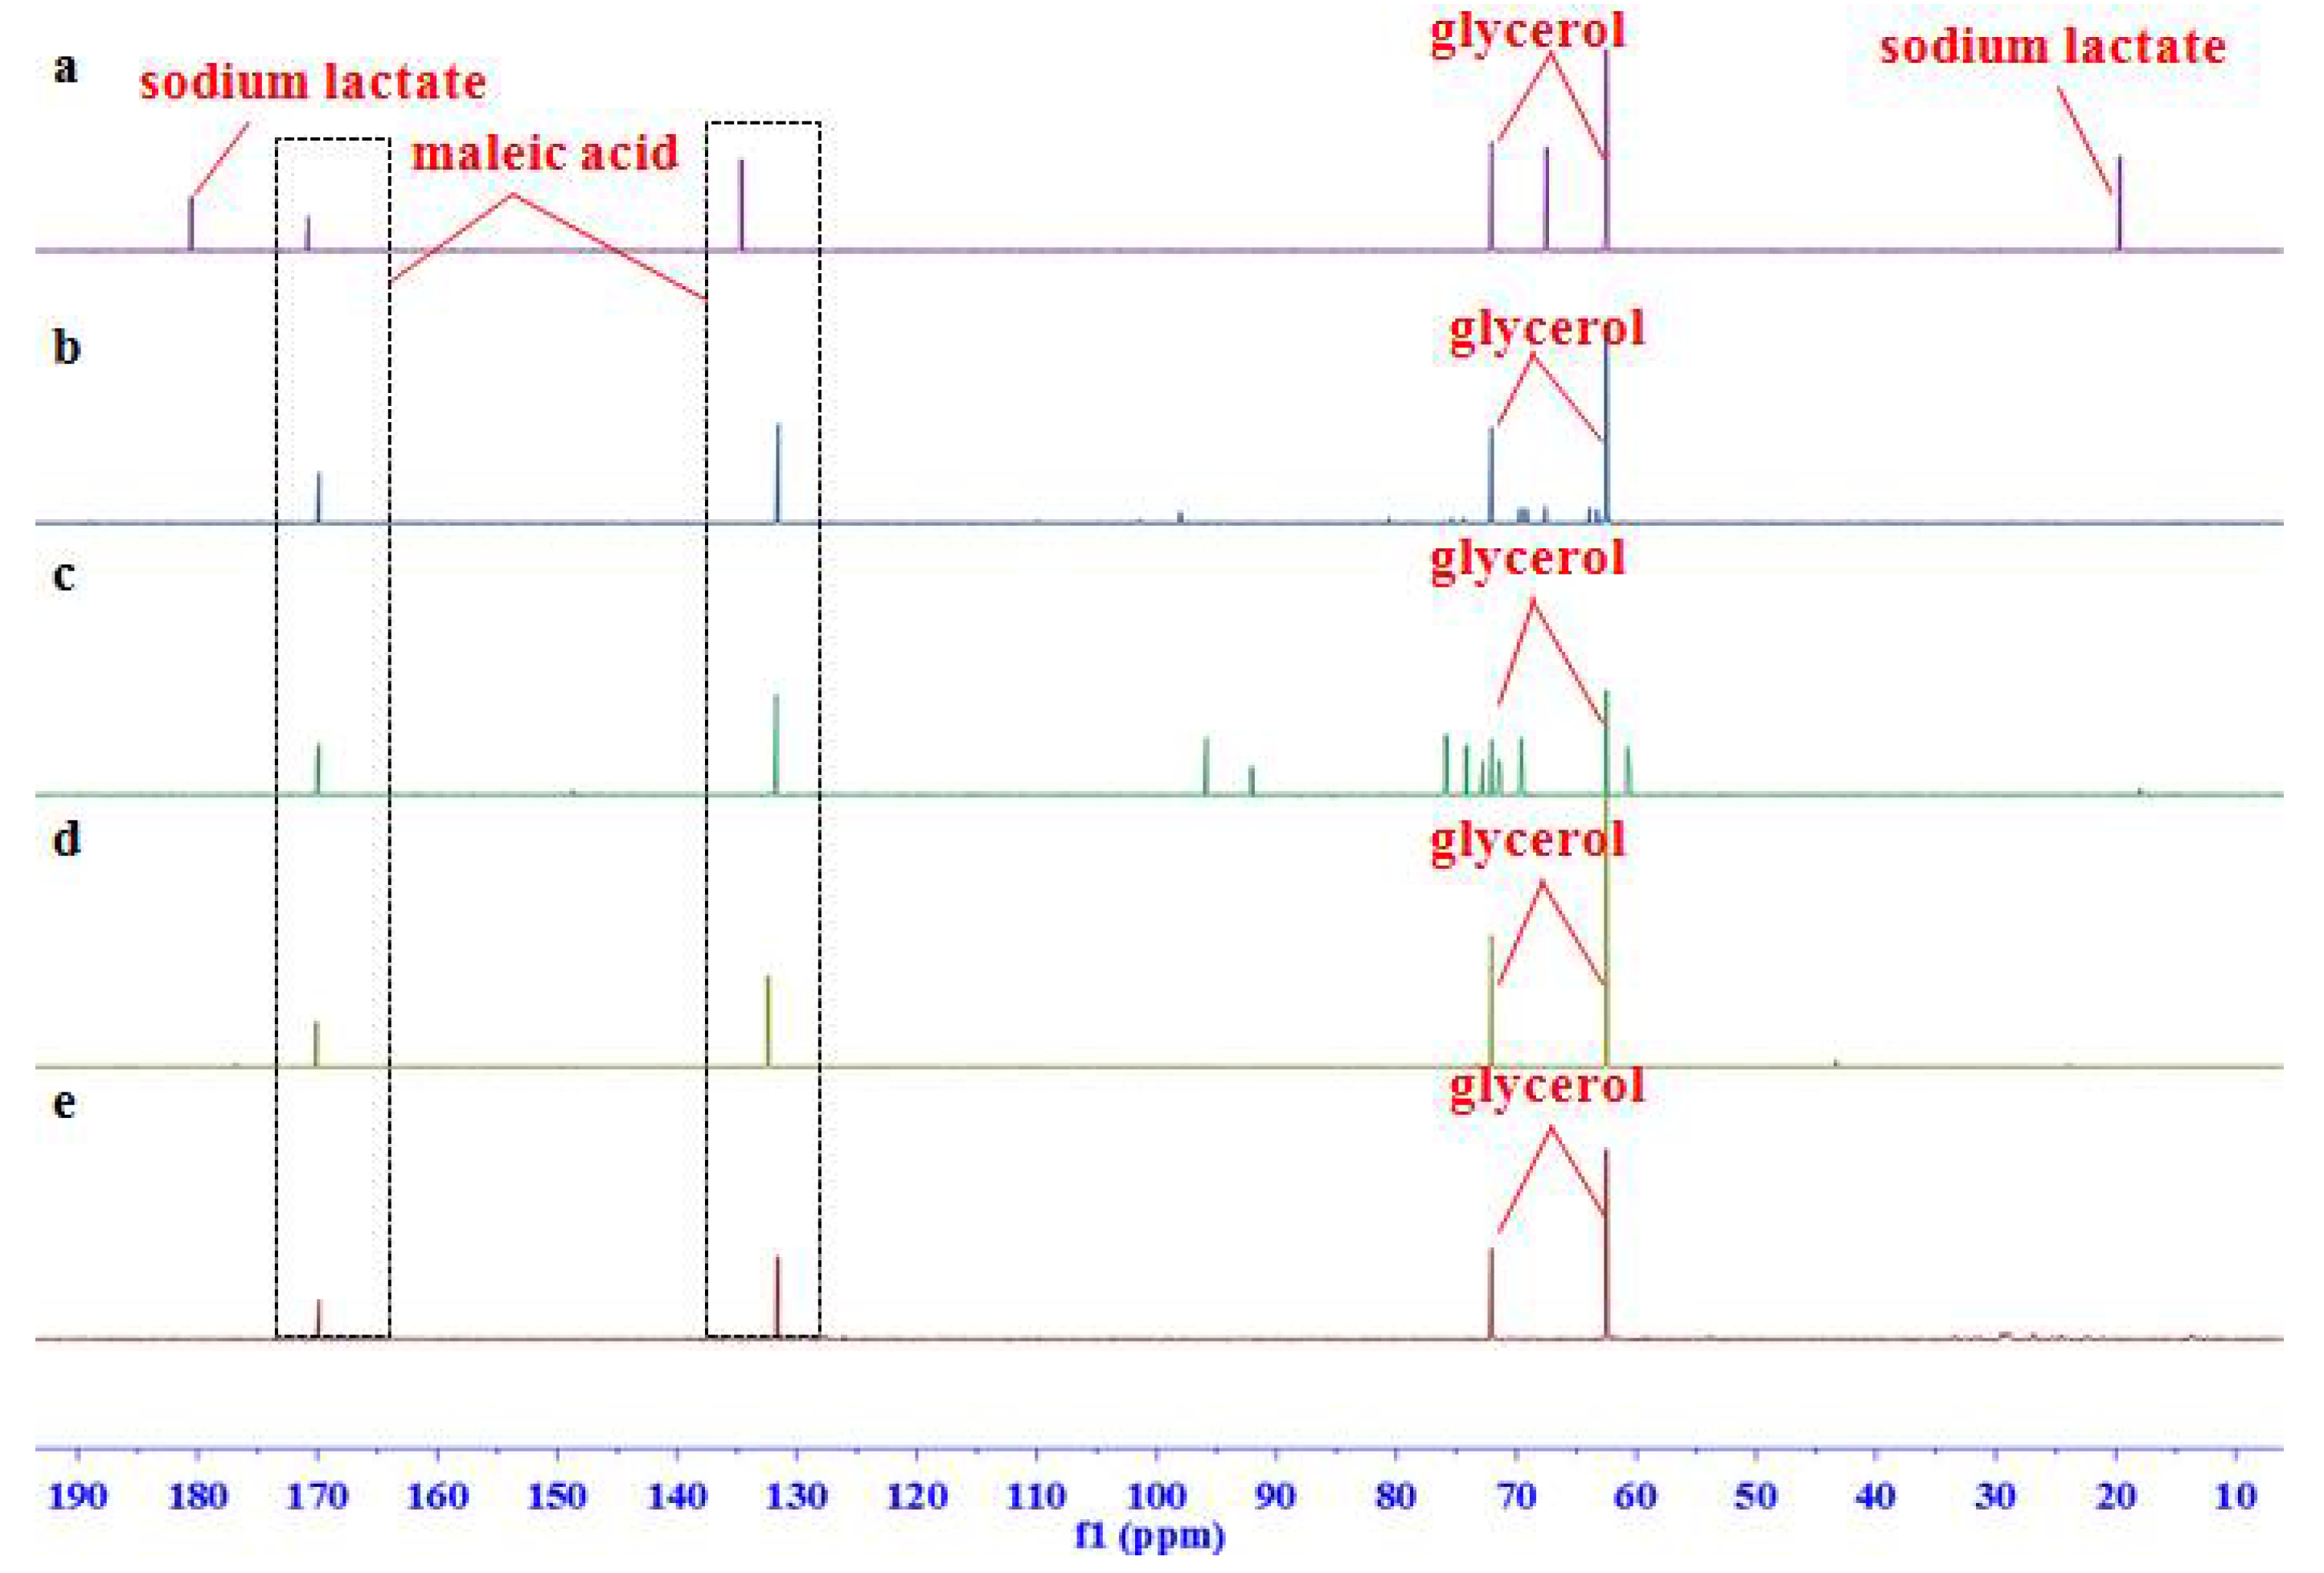
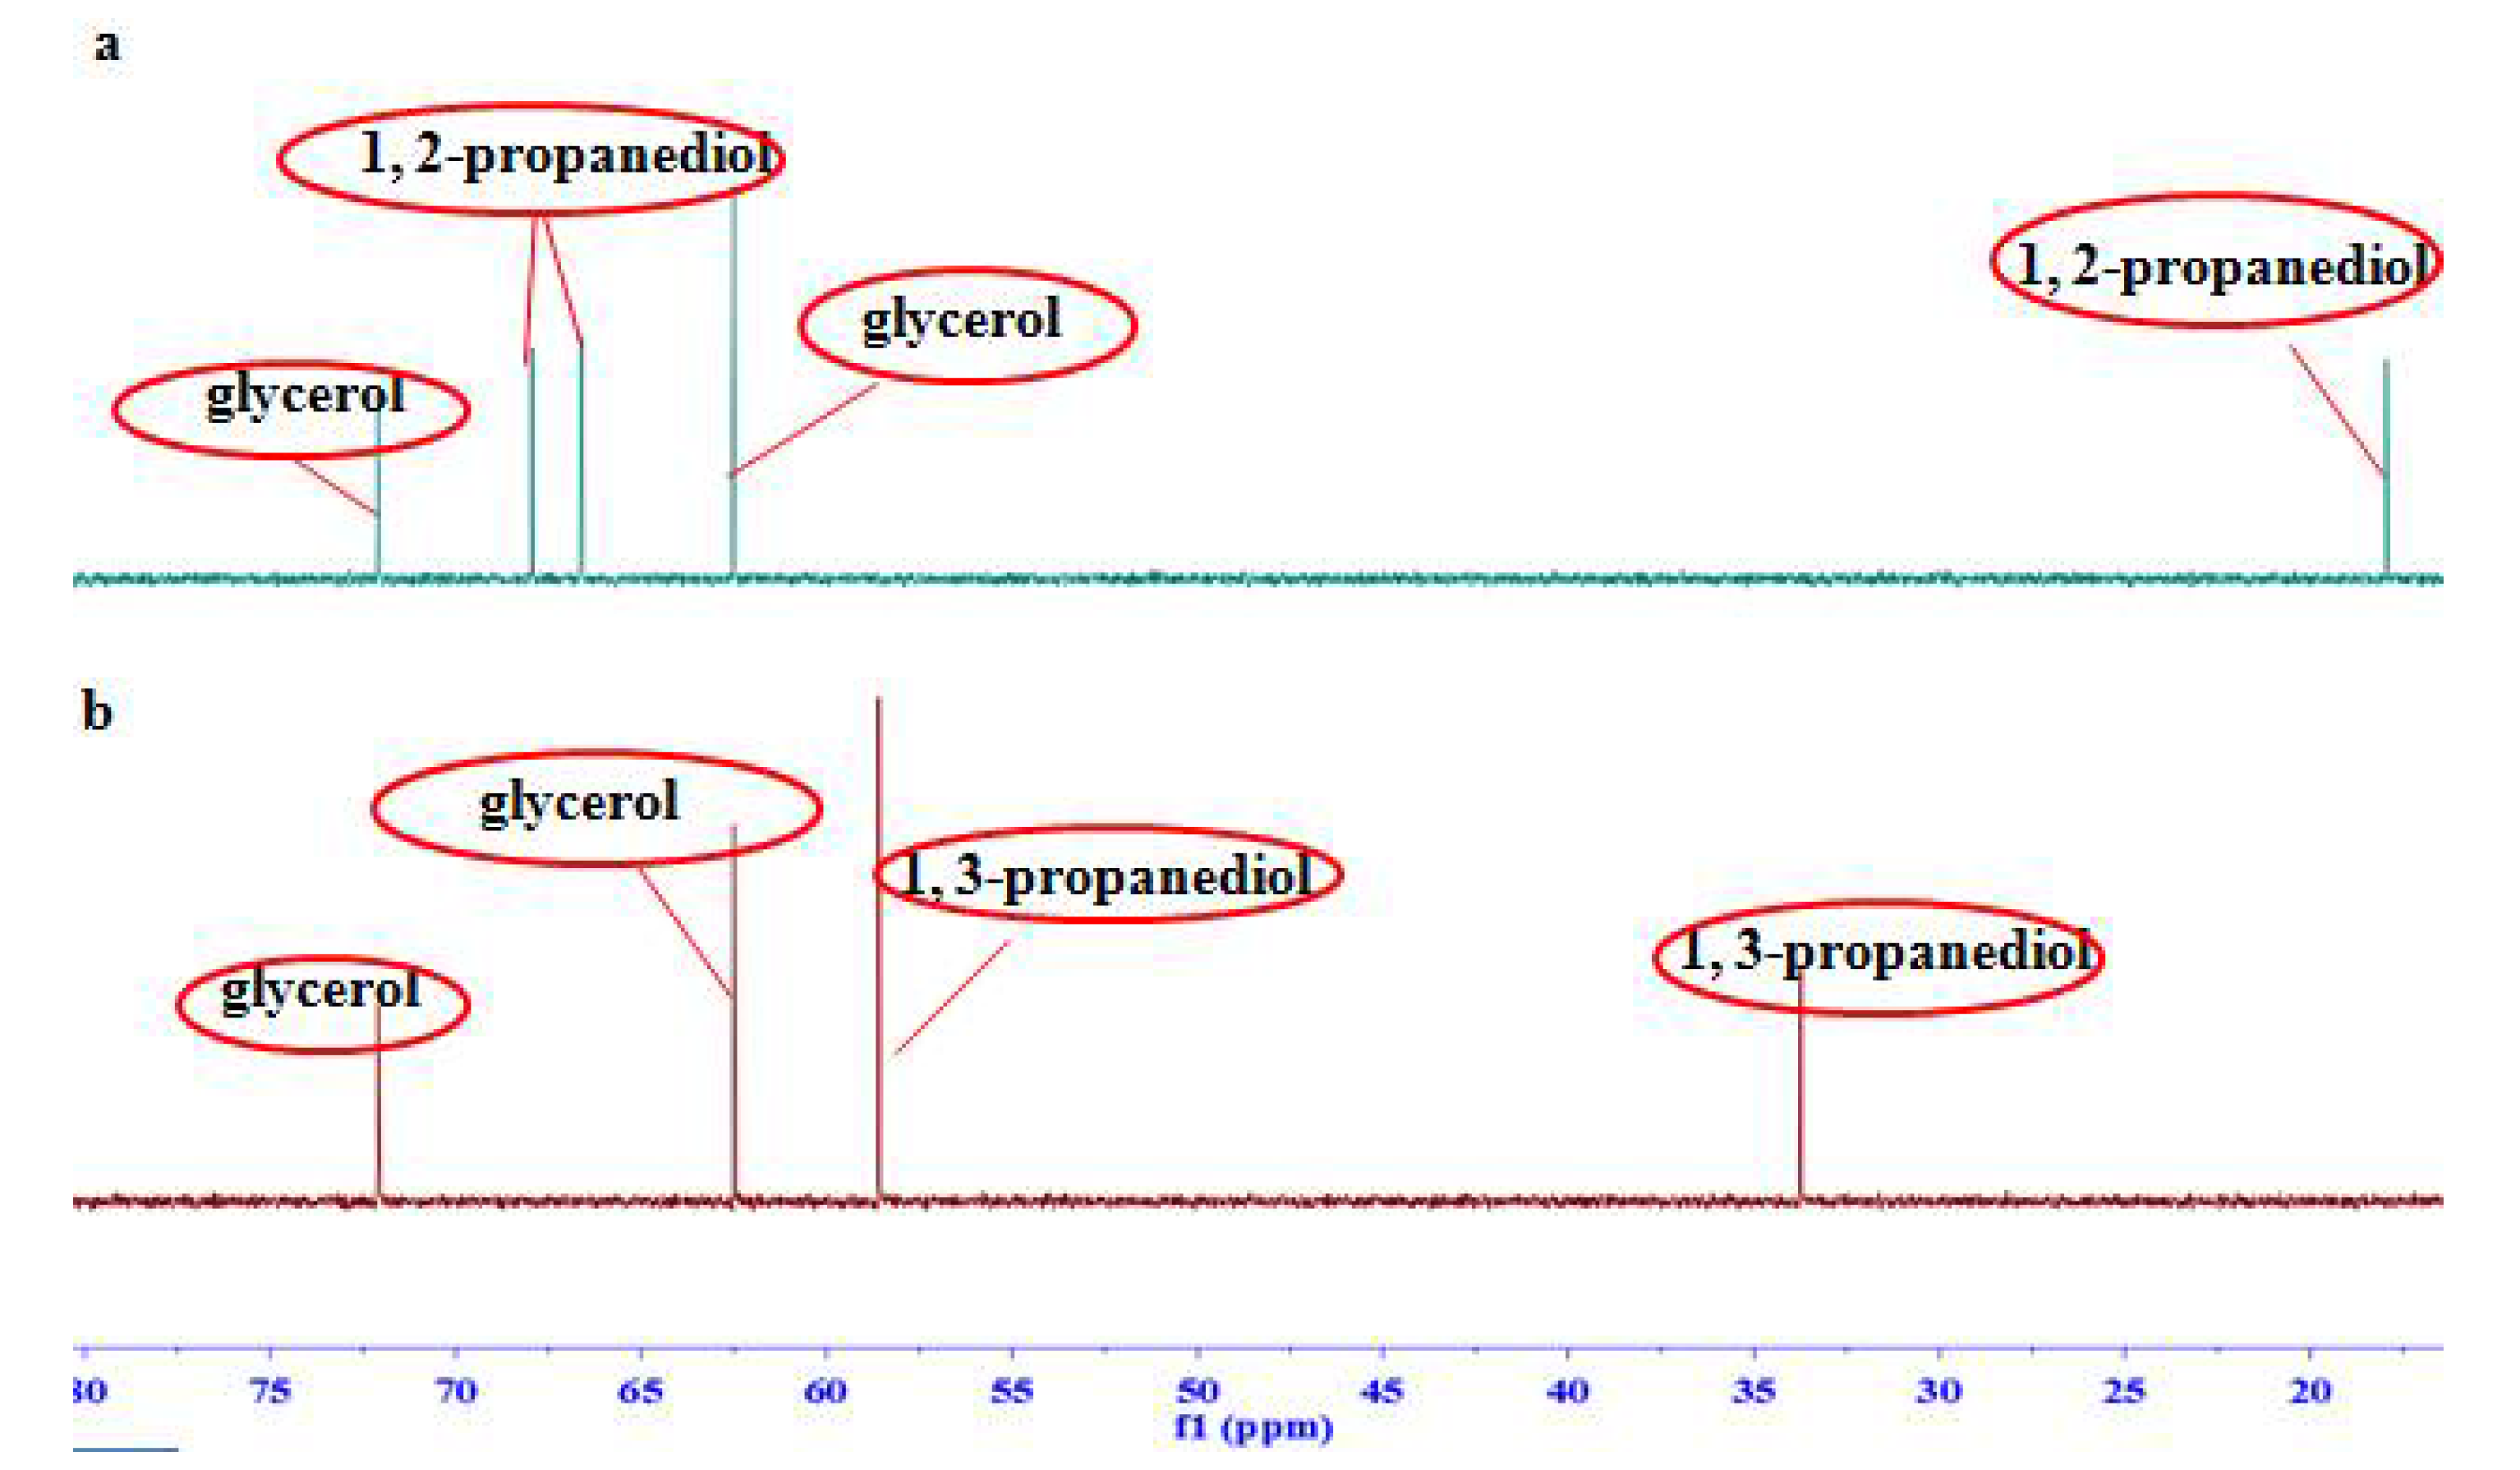
2.1. Signal Assignments and the Specificity
2.2. Options for Pulse Sequences
2.3. Options for Acquisition and Post-Processing Conditions
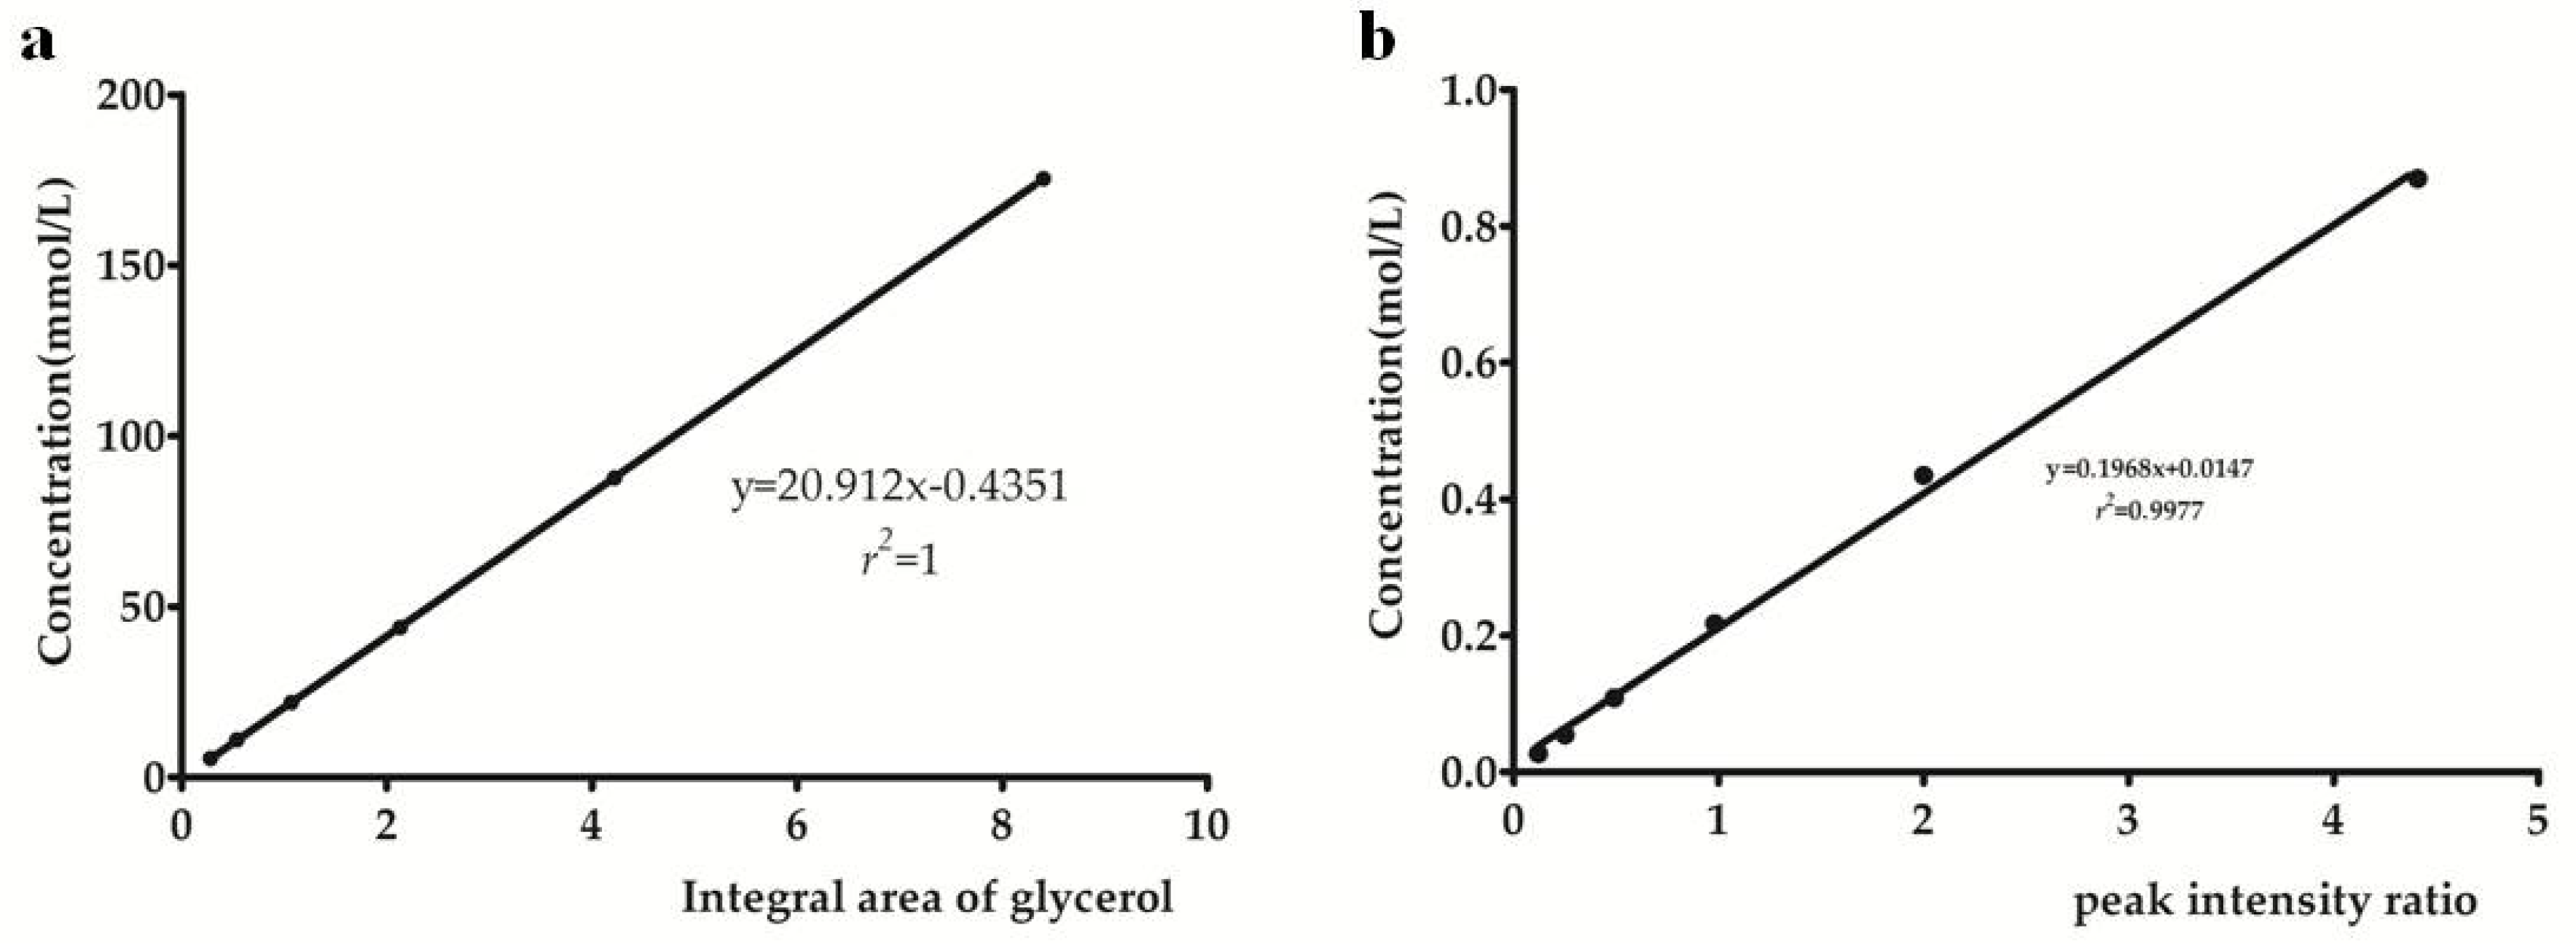
2.4. Method Validation
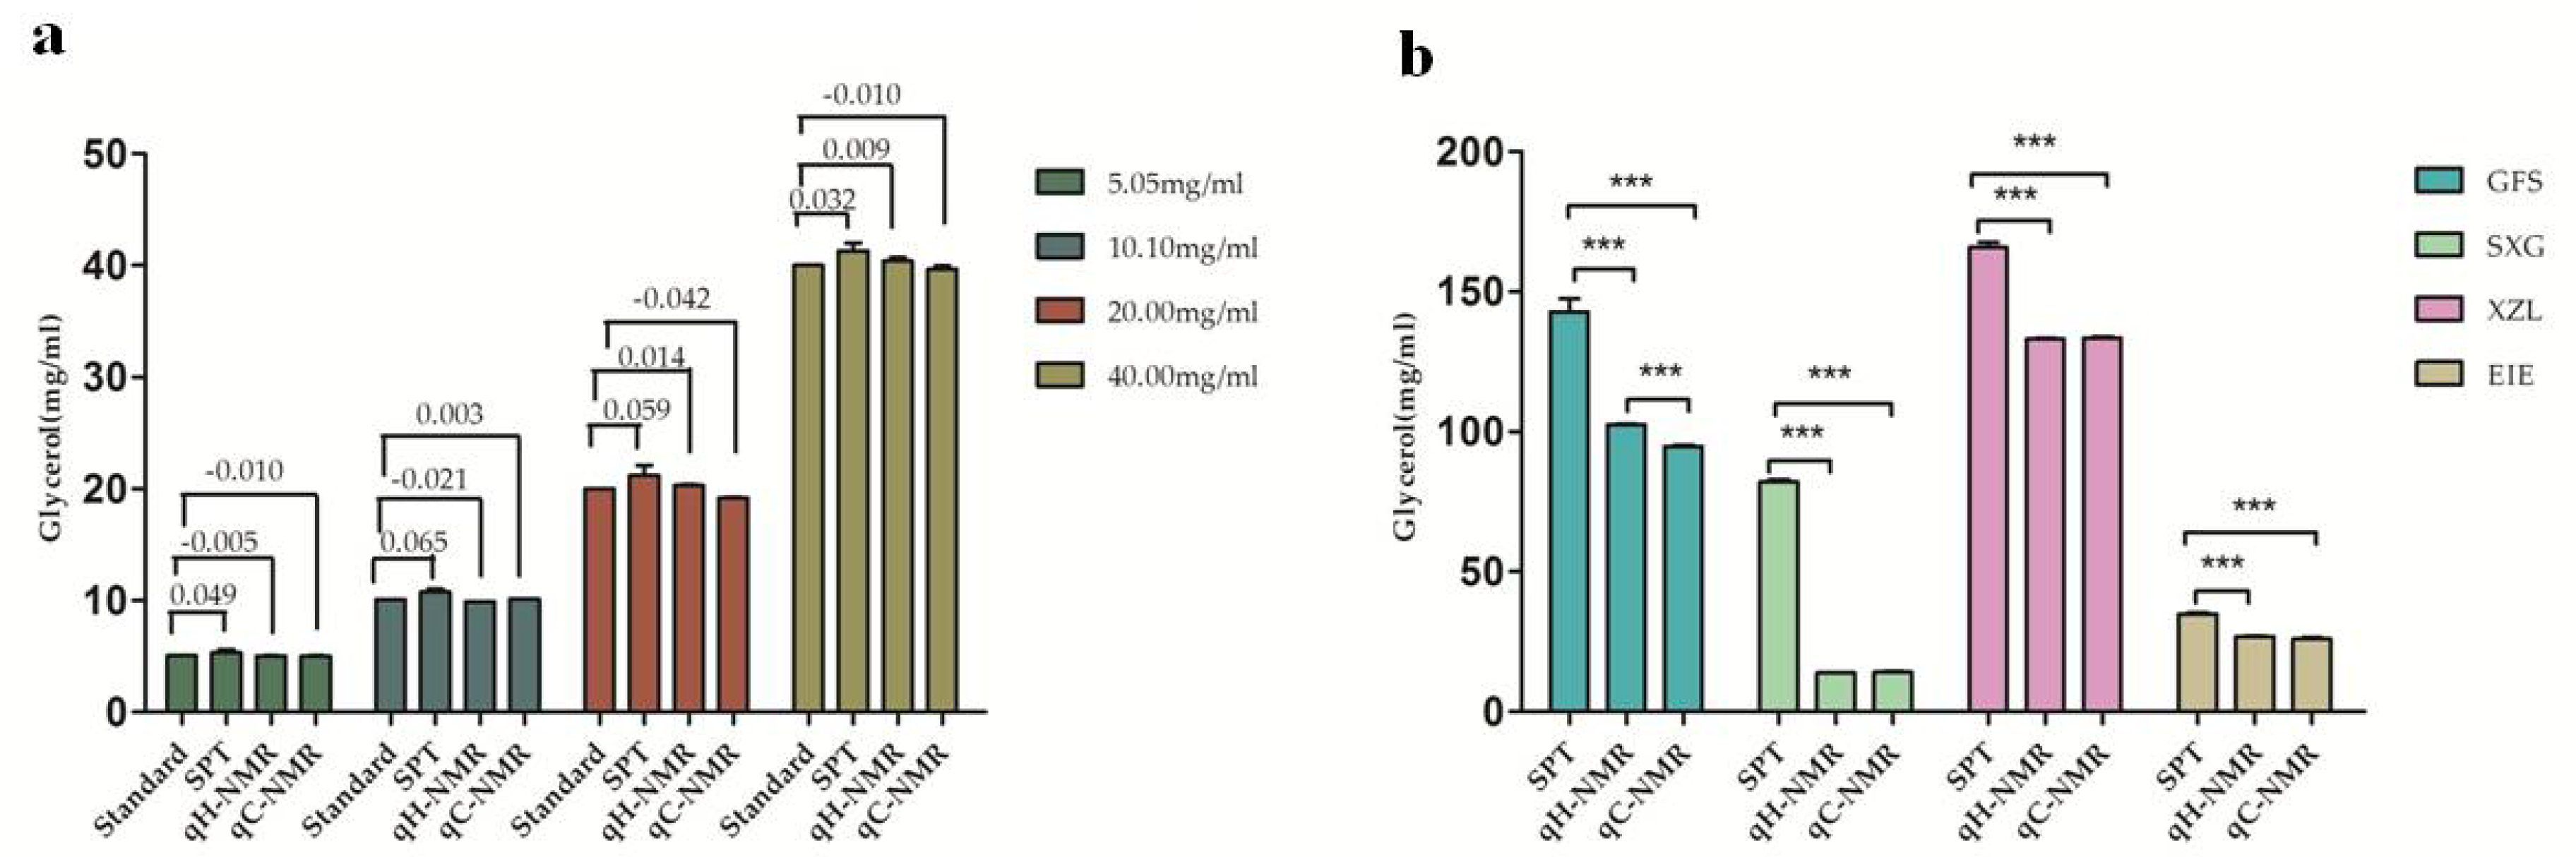
2.5. NMR Quantification for Glycerol in Injection Samples
3. Materials and Methods
3.1. Reagents and Materials
3.2. NMR Measurement
3.3. Quantification
4. Conclusions
Author Contributions
Funding
Conflicts of Interest
References
- Bayer, A.J.; Pathy, M.S.J. Newcombe R Double-blind randomised trial of intravenous glycerol in acute stroke. Lancet 1987, 1, 405–408. [Google Scholar] [CrossRef]
- Yu, Y.L.; Kumana, C.R.; Lauder, I.J.; Cheung, Y.K.; Chan, F.L.; Kou, M.; Fong, K.Y.; Cheung, R.T.; Chang, C.M. Treatment of acute cortical infarct with intravenous glycerol. A double-blind, placebo-controlled randomized trial. Stroke 1993, 24, 1119–1124. [Google Scholar] [PubMed]
- Biestro, A.; Alberti, R.; Galli, R.; Cancela, M.; Soca, A.; Panzardo, H.; Borovich, B. Osmotherapy for increased intracranial pressure: Comparison between mannitol and glycerol. Acta Neurochir. 1997, 139, 725–733. [Google Scholar] [CrossRef] [PubMed]
- Casey, T.A.; Trevor-Roper, P.D. Oral glycerol in glaucoma. Br. Med. J. 1963, 2, 851–852. [Google Scholar] [CrossRef] [PubMed]
- Righetti, E.; Celani, M.G.; Cantisani, T.A.; Sterzi, R.; Boysen, G.; Ricci, S. Glycerol for acute stroke: A Cochrane systematic review. J. Neurol. 2002, 249, 445–451. [Google Scholar] [CrossRef] [PubMed]
- Frank, M.S.; Nahata, M.C.; Hilty, M.D. Glycerol: A review of its pharmacology, pharmacokinetics, adverse reactions, and clinical use. Pharmacotherapy 1981, 1, 147–160. [Google Scholar] [CrossRef] [PubMed]
- Cinar, Y.; Senyol, A.M.; Kosku, N.; Duman, K. Effects of glycerol on metabolism and hemodynamics: A pilot study. Curr. Ther. Res. 1999, 60, 435–445. [Google Scholar] [CrossRef]
- Plank, C.; Lorbeer, E. Simultaneous determination of glycerol, and mono-, di-, and triglycerides in vegetable oil methyl esters by capillary gas chromatography. J. Chromatogr. A 1995, 697, 461–468. [Google Scholar] [CrossRef]
- Reddy, S.R.; Titu, D.; Chadha, A. A novel method for monitoring the transesterification reaction of oil in biodiesel production by estimation of glycerol. J. Am. Oil Chem. Soc. 2010, 87, 747–754. [Google Scholar] [CrossRef]
- Li, R.; Wang, W.; Ma, X.; Chen, B. Determination on content of free glycerol in biodiesel by HPLC-ELSD. J. Instrum. Anal. 2011, 30, 1167–1170. [Google Scholar]
- Holzgrabe, U.; Diehl, B.; Wawer, I. NMR Spectroscopy in Pharmaceutical Analysis, 1st ed.; Elsevier: Amsterdam, The Netherlands, 2008; pp. 233–315. ISBN 978-0-444-53173-5. [Google Scholar]
- Simmler, C.; Napolitano, J.G.; McAlpine, J.B.; Chen, S.N.; Pauli, G.F. Universal quantitative NMR analysis of complex natural samples. Curr. Opin. Biotechnol. 2014, 25, 51–59. [Google Scholar] [CrossRef] [PubMed]
- Hohmann, M.; Koospal, V.; Bauer-Christoph, C.; Christoph, N.; Wachter, H.; Diehl, B.; Holzgrabe, U. Quantitative 1H NMR analysis of egg yolk, alcohol, and total sugar content in egg liqueurs. J. Agric. Food Chem. 2015, 63, 4112–4119. [Google Scholar] [CrossRef] [PubMed]
- Jiang, M.; Wang, C.; Zhang, Y.; Feng, Y.; Wang, Y.; Zhu, Y. Sparse partial-least-squares discriminant analysis for different geographical origins of Salvia miltiorrhiza by 1H NMR-based metabolomics. Phytochem. Anal. 2014, 25, 50–58. [Google Scholar] [CrossRef] [PubMed]
- Mason, S.; Reinecke, C.J.; Solomons, R.; Wevers, R.A.; Engelke, U.F.H. 1H NMR spectral identification of medication in cerebrospinal fluid of pediatric meningitis. J. Pharm. Biomed. Anal. 2017, 143, 56–61. [Google Scholar] [CrossRef] [PubMed]
- Bharti, S.K.; Roy, R. Quantitative 1H NMR spectroscopy. TrAC Trends Anal. Chem. 2012, 35, 5–26. [Google Scholar] [CrossRef]
- Shaykhutdinov, R.A.; MacInnis, G.D.; Dowlatabadi, R.; Weljie, A.M.; Vogel, H.J. Quantitative analysis of metabolite concentrations in human urine samples using 13C{1H} NMR spectroscopy. Metabolomics 2009, 5, 307–317. [Google Scholar] [CrossRef]
- Waugh, J.S. Sensitivity in Fourier transform NMR spectroscopy of slowly relaxing systems. J. Mol. Spectrosc. 1970, 35, 298–305. [Google Scholar] [CrossRef]
Sample Availability: Samples of glycerol and injections are available from the authors. |


| Compound | Structure | Number | 1H | 13C |
|---|---|---|---|---|
| glycerol | 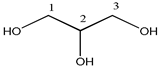 | 1, 3 | 3.63 (2H, dd), 3.54 (2H, dd) | 62.5 |
| 2 | 3.77 (1H, m) | 73.1 | ||
| 1,2-propanediol | 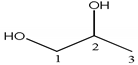 | 1 | 3.52 (1H, dd), 3.44 (1H, dd) | 67.9 |
| 2 | 3.86 (1H, m) | 66.6 | ||
| 3 | 1.13 (3H, d) | 17.9 | ||
| 1,3-propanediol | 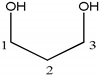 | 1, 3 | 3.67 (4H, t) | 58.6 |
| 2 | 1.78 (2H, m) | 33.7 | ||
| maleic acid | HOOCCH=CHCOOH | –CH=CH– | 6.40 (s) | 132.6 |
| –COOH | 170.8 |
| Compound (Chemical Shift) | T1 (s) | Mean ± SD (s) | RSD (%) |
|---|---|---|---|
| glycerol (δ 3.52) | 2.29 | 2.29 ± 0.00 | 0.22 |
| 2.28 | |||
| 2.29 | |||
| glycerol (δ 3.63) | 2.24 | 2.25 ± 0.00 | 0.42 |
| 2.25 | |||
| 2.26 | |||
| glycerol (δ 3.75) | 4.67 | 4.86 ± 0.17 | 3.56 |
| 4.93 | |||
| 5.00 | |||
| maleic acid (δ 6.40) | 6.77 | 6.78 ± 0.02 | 0.25 |
| 6.78 | |||
| 6.78 |
| Detected Atom | Integral Way | Calculated Method | Actual Mass (mg) | Testing Mass (mg) | Absolute Error | Relative Error |
|---|---|---|---|---|---|---|
| 1H | peak area | internal standard | 0.55 | 0.55 | 0.00 | 0.000 |
| 1.09 | 1.11 | 0.02 | 0.018 | |||
| external calibration | 0.55 | 0.51 | −0.04 | 0.073 | ||
| 1.09 | 1.05 | −0.04 | 0.037 | |||
| 13C | peak area | internal standard | 5.02 | 4.78 | −0.24 | 0.048 |
| 10.04 | 9.81 | −0.23 | 0.023 | |||
| external calibration | 5.02 | 4.56 | −0.46 | 0.092 | ||
| 10.04 | 8.91 | −1.13 | 0.113 | |||
| peak height | internal standard | 5.02 | 4.79 | −0.23 | 0.046 | |
| 10.04 | 10.24 | 0.20 | 0.020 | |||
| external calibration | 5.02 | 5.00 | −0.02 | 0.004 | ||
| 10.04 | 9.90 | −0.14 | 0.014 |
| Detected Atom | 1H | 13C |
|---|---|---|
| integral way | peak area | peak height |
| calculated method | internal standard | external calibration |
| linear regression equation | y = 20.912x − 0.4351 | y = 0.1968x + 0.0147 |
| correlation coefficient (r2) | 1.0000 | 0.9977 |
| standard deviation of y-intercept | 0.094 | 0.087 |
| LOD (mM) | 0.015 | 0.16 |
| LOQ (mM) | 0.045 | 0.48 |
| precision (RSD %) | 0.36 | 0.40 |
| stability (RSD %) | 0.35 | 0.96 |
| repeatability (RSD %) | 0.55 | 1.48 |
| recovery rate (RSD %) | 95.8 (0.68%) | 101.8 (0.98%) |
© 2018 by the authors. Licensee MDPI, Basel, Switzerland. This article is an open access article distributed under the terms and conditions of the Creative Commons Attribution (CC BY) license (http://creativecommons.org/licenses/by/4.0/).
Share and Cite
Lu, J.; Wang, P.; Wang, Q.; Wang, Y.; Jiang, M. Validated 1H and 13C Nuclear Magnetic Resonance Methods for the Quantitative Determination of Glycerol in Drug Injections. Molecules 2018, 23, 1177. https://doi.org/10.3390/molecules23051177
Lu J, Wang P, Wang Q, Wang Y, Jiang M. Validated 1H and 13C Nuclear Magnetic Resonance Methods for the Quantitative Determination of Glycerol in Drug Injections. Molecules. 2018; 23(5):1177. https://doi.org/10.3390/molecules23051177
Chicago/Turabian StyleLu, Jiaxi, Pengli Wang, Qiuying Wang, Yanan Wang, and Miaomiao Jiang. 2018. "Validated 1H and 13C Nuclear Magnetic Resonance Methods for the Quantitative Determination of Glycerol in Drug Injections" Molecules 23, no. 5: 1177. https://doi.org/10.3390/molecules23051177