Review

Probing Protein-Protein Interactions Using Asymmetric Labeling and Carbonyl-Carbon Selective Heteronuclear NMR Spectroscopy

1
Department of Chemistry, University of Minnesota, Minneapolis, MN 55455, USA
2
Department of Biochemistry, Molecular Biology, and Biophysics, University of Minnesota, Minneapolis, MN 55455, USA
3
National Magnetic Resonance Facility at Madison, Madison, WI 53706, USA
4
Department of Biochemistry, University of Wisconsin-Madison, Madison, WI 53706, USA
*
Author to whom correspondence should be addressed.
Molecules 2018, 23(8), 1937; https://doi.org/10.3390/molecules23081937
Submission received: 10 July 2018 / Revised: 23 July 2018 / Accepted: 25 July 2018 / Published: 3 August 2018

Abstract

:
Protein-protein interactions (PPIs) regulate a plethora of cellular processes and NMR spectroscopy has been a leading technique for characterizing them at the atomic resolution. Technically, however, PPIs characterization has been challenging due to multiple samples required to characterize the hot spots at the protein interface. In this paper, we review our recently developed methods that greatly simplify PPI studies, which minimize the number of samples required to fully characterize residues involved in the protein-protein binding interface. This original strategy combines asymmetric labeling of two binding partners and the carbonyl-carbon label selective (CCLS) pulse sequence element implemented into the heteronuclear single quantum correlation (1H-15N HSQC) spectra. The CCLS scheme removes signals of the J-coupled 15N–13C resonances and records simultaneously two individual amide fingerprints for each binding partner. We show the application to the measurements of chemical shift correlations, residual dipolar couplings (RDCs), and paramagnetic relaxation enhancements (PRE). These experiments open an avenue for further modifications of existing experiments facilitating the NMR analysis of PPIs.

Graphical Abstract

1. Introduction

Biological processes rely primarily on protein-protein interactions (PPIs) to mediate a cellular function [1]. Historically biochemical techniques (co-immunoprecipitation, yeast-two hybrid, pull-down assays, etc.) measuring parameters intrinsic to the whole complex have been used to characterize these PPIs [2,3]. Recently, advances in nuclear magnetic resonance (NMR) spectroscopy have provided the means to characterize PPIs at an atomic resolution, which offers fine details of individual macromolecules participating within the complex [4,5,6]. In addition to allowing the characterization of these complexes at an atomic resolution, NMR is well-suited for studying dynamic, transient (~100 μM KD), and low-populated states of complexes [7,8,9].
The mapping of PPIs using several observables such as chemical shift perturbation (CSP), residual dipolar couplings (RDC), intra-molecular and inter-molecular as well as solvent paramagnetic relaxation enhancement (PRE) [10,11,12], cross-saturation (CS), and nuclear Overhauser effects (NOEs) has been well-established [5]. These methods, nevertheless, fall short when studying large complexes due to the inherent attenuation of transverse relaxation times (T2), which results in a reduction of both signal intensity and resolution. Despite methods such as TROSY [13], deuteration [14,15], and selective labeling [16,17] addressing these concerns, multiple samples are still required to distinguish one species from another. Recently, several new NMR experiments based on simultaneous, interleaved detection of up to three NMR active species with distinct isotopic labeling have provided the opportunity to map the effect of PPIs on individual components within a macromolecular complex. While there are outstanding reviews on protein-protein interactions [18,19,20,21,22,23,24], we focus on our recently developed method that exploits the spin-echo filtering-based experiments with strategic protein labeling schemes to characterize protein-protein complexes.

2. Results

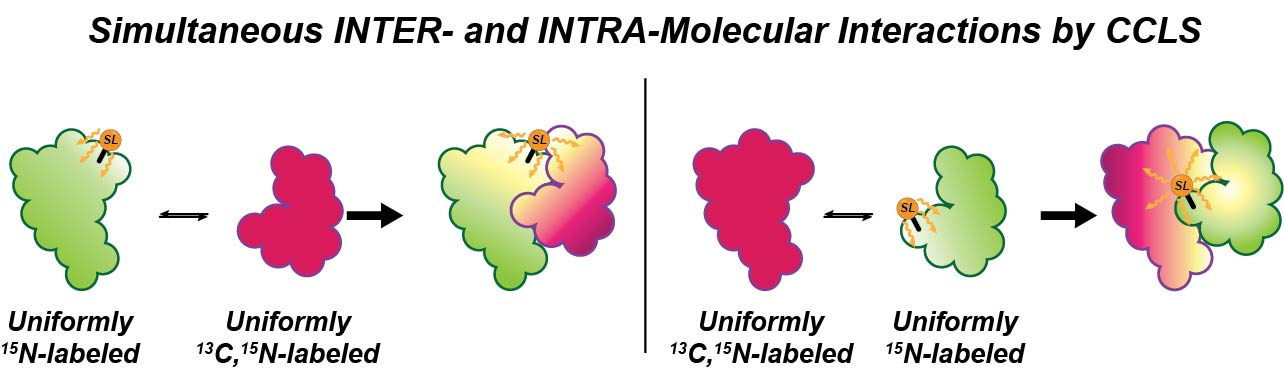
2.1. Mapping Two Binding Partners Fingerprints Simultaneously

Traditional approaches to map PPIs at an atomic level involve repeat experiments with reverse labeling patterns such that the interaction is probed from both binding partners. Prior to the introduction of the spin-echo filtering experiment by Bax et al. [25], three-bond homonuclear 1H-1H J couplings had been used to derive backbone and side-chain conformational restraints [26,27,28,29,30,31]. This new experiment relied on measuring the magnetization loss due to unresolved J coupling and utilized an interleaved detection method where two spectra are recorded simultaneously but differ by 180° pulse positions on the 15N channel. The spin-echo filtered experiment introduced by Bax is the building block for the Carbonyl Carbon Label Selective (CCLS) 1H-15N HSQC pulse sequence [32], which requires specific isotopic labeling to simultaneously map the chemical shift perturbations from two binding partners. The CCLS 1H-15N HSQC pulse sequence utilizes spin-echo filtering with a short magnetization transfer period between 15N and 13C′ in order to detect 1H-15N correlations adjacent to the NMR inactive (12C′) carbonyl groups (Figure 1A). Building on the constant time (CT) HSQC, the CCLS 1H-15N HSQC necessitates the acquisition of two spectra, a reference spectrum, and a suppression spectrum in an interleaved manner. The reference spectrum is acquired using the pulse sequence reported in Figure 1A with the 180° pulse on 13C′ during the 15N CT evolution period applied at position a as proposed by Vuister et al. [25], which allows for the removal of 13C′-15N coupling. The suppression spectrum is acquired with the 180° 13C′ pulse at position b, leaving 13C-15N J coupling active, and converting the transverse in-phase magnetization of 15N spins linked to 13C′ to antiphase magnetization. This antiphase magnetization contains components in both the x-direction and y-direction. The π 1H and 13C pulses applied at the end of the 15N evolution convert the y-component, 4HzNyC′z, to an unobservable multiple quantum coherence, 4HyNzC′y, while the x-component, 4HyNzC’y, is de-phased by the G2 gradient (Figure 1A). As a result, signals from 1H-15N groups coupled to 13C′ are suppressed while signals from 1H-15N groups coupled to 12C′ are unaffected. The suppression spectrum can then be subtracted from the reference spectrum, which leaves the U-15N, 13C species observable (Figure 1B).
We tested the sensitivity of the CCLS method by comparing a reference CCLS-HSQC spectrum and a conventional HNCO spectrum of the 20-kDa protein U-13C, 15N-Ubiquitin at 10 °C, 20 °C, 30 °C, and 40 °C corresponding to average T2 values of 27 ms, 33 ms, 40 ms, and 47 ms, respectively [32]. The slower tumbling rates at lower temperatures lead to longer rotational correlation times (τC) and faster relaxation results in broader linewidths. We found the reference CCLS-HSQC experiment was more sensitive compared to the HNCO experiment for lower temperatures, which demonstrates that the shorter time delay (TNC) allows for increased sensitivity for large proteins or protein-protein complexes. The sensitivity enhancement gained from optimal TNC values compensates for the decrease in S/N observed upon subtraction of the suppression spectrum from the reference spectrum.
Furthermore, we applied this technique to resolve assignment ambiguities on the 41 kDa catalytic subunit of cAMP-dependent protein kinase A (PKA-C) [33,34]. PKA-C is the prototypical Ser/Thr kinase and, until relatively recently, had remained unexplored by NMR due to its size and presence of conformational exchange effects on the μs-ms timescale [35,36,37,38]. Advances in pulse sequence design and sample preparation have since made it possible to investigate this system using NMR [39,40,41,42]. We successfully implemented the CCLS-HSQC pulse sequence to assist in the assignment of multiple catalytically relevant residues of PKA-C. Furthermore, recent work from our group demonstrates the ability of this pulse sequence to simultaneously detect PKA-C in complex with an endogenous inhibitor known as the heat-stable protein kinase A inhibitor (PKIα) [34,43], which gives the possibility to detect the mutual effect of PKA-C and PKIα interaction (Figure 1C—unpublished data). Together, these applications underscore the ability of CCLS to simultaneously detect PPIs and emphasizes the performance of this pulse sequence with high molecular weight systems.

2.2. Fingerprinting Three Binding Partners Using One Sample

Masterson et al. applied the CCLS pulse sequence element to deconvolute PPIs in a ternary mixture simultaneously [45]. The dual carbon label selective (DCLS) 1H-15N HSQC experiment requires three labeled binding partners with the first species U-15N labeled, the second 15N, 13C′ labeled, and the third U-13C, 15N labeled. The deconvolution of these spectra follows the same spin-echo filtering theory as CCLS with additional filtering of Cα coupled spins (Figure 2A). Cα suppression requires a longer TNCα delay due to both inter-residue and intra-residue 1H-13J coupling [46]. Increasing the TNCα delay nullifies protein backbone conformation dependency of 1JNCα and 2JNCα since it completely suppresses the signal from 1JNCα while inverting the residual signal intensities of 2JNCα.
This and the previously introduced pulse sequence rely on selective labeling of individual binding partners. Asymmetric selective labeling schemes to study PPIs in a multiple component sample are increasing in popularity [16,47,48,49] both for solution and solid-state NMR spectroscopy. For instance, Anglister and coworkers have demonstrated the application of asymmetric deuteration in combination with transferred nuclear Overhauser spectroscopy to study intermolecular nuclear Overhauser effects (NOEs) of large, fast exchanging protein complexes [50,51,52]. With respect to CCLS and DCLS, selective labeling of 13C′ can be accomplished in recombinant proteins using either 15N- and 13C′-labeled amino acids or 1-13C pyruvate and 13C-labeled NaHCO3 as the sole carbon sources [53,54,55,56,57]. Selective 13Cα labeling is achieved by using 2-13C glucose as the sole carbon source [54].
The DCLS experiment requires the acquisition of three interleaved experiments in parallel (Figure 2B). A reference data set is collected observing all three species simultaneously, which is followed by the first suppression data set where amide resonances adjacent to 13C′ are undetected. This is identical to the CCLS suppression spectrum. Lastly, a second suppression data set is collected where amide resonances coupled to 13Cα are not detected. Deconvolution of the spectra is obtained by a linear combination of the data set. Subtraction of the second suppression spectrum from the reference spectrum provides a sub-spectrum containing only resonances from the U-13C, 15N labeled species. The subtraction of the first suppression spectrum from the second suppression spectrum provides an additional sub-spectrum containing only resonances from the U-15N, 13C′ labeled species. In this manner, sub-spectra are obtained from a single sample for each individual component of the ternary mixture and all resonances can be resolved. As a proof of concept, Masterson et al. applied this labeling scheme and pulse sequence to three non-interacting proteins, which includes maltose binding protein (MBP), Kemptide, and ubiquitin. By applying DCLS, the authors obtained sub-spectra corresponding to each individual component of the ternary mixture displaying the potential of this approach to study protein-protein interactions with a single sample.

2.3. Measuring Residual Dipolar Coupling (RDC) of Complexes Using One Sample

Residual dipolar coupling (RDC) allows orientation specific data to be derived through dipole-dipole interactions. The orientation restraints provided by RDC have proven useful in protein structure determination, nucleic acid structure, domain orientation, and more recently PPIs [58,59]. We implemented CCLS and DCLS to sensitivity-enhanced TROSY or anti-TROSY spin-state selection to record the simultaneous measurement of RDCs [58,60,61,62,63] for the relative orientations of multiple proteins within a single sample (Figure 3A,B). RDC measurements are susceptible to experimental conditional variations, which alter alignment tensors, making direct correlations of orientational constraints obtained from different samples more difficult. Our approach, together with specific isotopic labeling, eliminates the need for multiple samples and, therefore, removes errors associated with sample inconsistencies [58].
Similar to DCLS (Figure 3C), we applied this pulse sequence to a non-interacting mixture of U-2H, 15N MBP, 15N-Ser5, 13C′-Ala4 Kemptide, and, U-13C, 15N ubiquitin [64]. Following the same linear subtraction scheme reported for DCLS, we were able to measure RDCs for each individual component in a ternary mixture. Furthermore, these RDC values were in agreement with back calculated values determined from already solved crystal structures of MBP [65] and ubiquitin [66], which confirms that the backbone conformational space of these proteins along with their relative alignment tensors were sufficiently defined.

2.4. Measuring Long-Range Distances and Transient Complexes Using CCLS for Paramagnetic Relaxation Enhancements (PRE)

Paramagnetic relaxation enhancements (PRE) have been used extensively to obtain long-distance restraints for structure calculation and to study PPIs for both stable and transient complexes [67,68,69,70,71,72]. In the standard PRE experiment that involves two interacting proteins, the intra-molecular or inter-molecular effects of a paramagnetic center are detected for only one of the binding partners in each independent NMR experiment (Figure 4Ai). To accurately probe these interactions, a minimum of four samples with differing spin label positions as well as reversed labeling schemes are required. Recently, we incorporated the CCLS pulse sequence in the traditional 1HN-Γ2 (1HN-Γ2-CCLS) [69] that, together with an asymmetric labeling scheme, enables the detection of both intra-molecular and inter-molecular paramagnetic relaxation enhancements (PREs) simultaneously using only one sample [10] (Figure 4B). In this newly proposed strategy, one of the two binding partners must be U-15N labeled and the second U-15N, 13C labeled (Figure 4Aii). We also tested the proposed pulse sequence on the non-covalent, transient dimerization of ubiquitin. Specifically, we studied the complex formed between U-15N, 13C wild-type ubiquitin and the U-15N-spin labeled the K48C mutant. We were able to discriminate intra-molecular and inter-molecular interactions detecting the structural and dynamics changes intrinsic to ubiquitin upon dimerization (Figure 4C). The Γ2 rates obtained with the new pulse sequence were confirmed to be identical among standard experiments. This work demonstrates that the Γ2-CCLS PRE experiment is suitable for identifying structural changes occurring in both binding partners upon formation of transient and permanent interactions using a reduced number of samples.

2.5. Improving Sensitivity with the G5 Pulse

Advances in NMR methodology (TROSY, deuteration, selective labeling) have allowed for studies of protein-protein complexes approaching 1 MDa [73,74]. However, these studies lack the ability to distinguish one species from another without the preparation of multiple samples. A recent technological advance that can improve nearly any pulse sequence is the universal triply compensated π pulses for high field spectrometers [75,76], which we have incorporated into the CCLS pulse sequence (Figure 5). All inversion and refocusing pulses in the 1H and 15N channel were replaced with G5 pulses except the 15N refocusing pulse in the middle of 3-9-19 water suppression. We were able to improve the signal intensity from 6% to 23% compared to the regular CCLS version. These experiments were performed on the Bruker 900 MHz AVIII spectrometer at 298 K and this enhancement will only be more significant in GHz spectrometers.

3. Conclusions and Perspectives

In this paper, we demonstrate that the CCLS/DCLS pulse sequences enable the study of PPIs through simultaneous inter-leaved detection of all components in a single sample. As we have illustrated, the CCLS and DCLS pulse sequence blocks can be applied to a multitude of well-established experiments (RDC and PRE). Extrapolating from this integration into existing NMR experiments, could NOESY be the next step? The possibility of observing multiple species in a single sample for NOESY experimentation is viable since Anglister et al. [50] has reviewed different spectroscopy and its application to 2D NOESY experiments. However, the pulse sequences are, therefore, limiting sensitivity, which the CCLS/DCLS pulse blocks show promise toward combating. Therefore, reflecting upon the versatility of the CCLS/DCLS pulse block and the associated advantages afforded, we envisage the insertion into other existing NMR experiments to study a wide range of multicomponent systems.

Funding

This research was funded by the Foundation for the National Institutes of Health grant numbers GM100310 and P41 GM103399.

Acknowledgments

NMR experiments were carried out at the National Magnetic Resonance Facility at Madison and the Minnesota Nuclear Magnetic Resonance Center.

Conflicts of Interest

The authors declare no conflict of interest. The founding sponsors had no role in the design of the study; in the collection, analyses, or interpretation of data; in the writing of the manuscript, and in the decision to publish the results.

References

  1. Marintchev, A.; Frueh, D.; Wagner, G. NMR methods for studying protein–protein interactions involved in translation initiation. In Methods in Enzymology; Lorsch, J., Ed.; Academic Press: Cambridge, MA, USA, 2007; pp. 283–331. [Google Scholar]
  2. Tord, B.; Sara, L.; Peter, J. Methods for the detection and analysis of protein–protein interactions. Proteomics 2007, 7, 2833–2842. [Google Scholar]
  3. Ngounou Wetie, A.G.; Izabela, S.; Alisa, G.W.; Urmi, R.; Joseph, A.L.; Costel, C.D. Investigation of stable and transient protein-protein interactions: Past, present and future. Proteomics 2013, 13, 538–557. [Google Scholar] [CrossRef] [PubMed]
  4. Barile, E.; Pellecchia, M. NMR-Based Approaches for the Identification and Optimization of Inhibitors of Protein–Protein Interactions. Chem. Rev. 2014, 114, 4749–4763. [Google Scholar] [CrossRef] [PubMed]
  5. Zuiderweg, E.R.P. Mapping protein−protein interactions in solution by NMR Spectroscopy. Biochemistry 2002, 41, 1–7. [Google Scholar] [CrossRef] [PubMed]
  6. Nishida, N.; Shimada, I. An NMR Method to study protein–protein interactions. In Integrin and Cell. Adhesion Molecules: Methods and Protocols; Shimaoka, M., Ed.; Humana Press: Totowa, NJ, USA, 2012; pp. 129–137. [Google Scholar]
  7. Ishima, R.; Torchia, D.A. Protein dynamics from NMR. Nat. Struct. Biol. 2000, 7, 740. [Google Scholar] [CrossRef] [PubMed]
  8. Kay, L.E. Protein dynamics from NMR. Biochem. Cell Biol. 1998, 76, 145–152. [Google Scholar] [CrossRef] [PubMed]
  9. Kempf, J.G.; Loria, J.P. Protein dynamics from solution NMR. Cell Biochem. Biophys. 2002, 37, 187–211. [Google Scholar] [CrossRef]
  10. Olivieri, C. Simultaneous detection of intra- and inter-molecular paramagnetic relaxation enhancements in protein complexes. J. Biomol. NMR 2018, 70, 133–140. [Google Scholar] [CrossRef] [PubMed]
  11. Park, S.H.; Wang, V.S.; Radoicic, J.; De Angelis, A.A.; Berkamp, S.; Opella, S.J. Paramagnetic relaxation enhancement of membrane proteins by incorporation of the metal-chelating unnatural amino acid 2-amino-3-(8-hydroxyquinolin-3-yl)propanoic acid (HQA). J. Biomol. NMR 2015, 61, 185–196. [Google Scholar] [CrossRef] [PubMed]
  12. Gong, Z.; Schwieters, C.D.; Tang, C. Theory and practice of using solvent paramagnetic relaxation enhancement to characterize protein conformational dynamics. Methods 2018. [Google Scholar] [CrossRef] [PubMed]
  13. Pervushin, K.; Riek, R.; Wider, G.; Wüthrich, K. Transverse Relaxation-Optimized Spectroscopy (TROSY) for NMR Studies of Aromatic Spin Systems in 13C-Labeled Proteins. J. Am. Chem. Soc. 1998, 120, 6394–6400. [Google Scholar] [CrossRef]
  14. Tugarinov, V.; Hwang, P.M.; Kay, L.E. Nuclear magnetic resonance spectroscopy of high.-molecular-weight proteins. Annu. Rev. Biochem. 2004, 73, 107–146. [Google Scholar] [CrossRef] [PubMed]
  15. Gardner, K.H.; Zhang, X.; Gehring, K.; Kay, L.E. Solution NMR studies of a 42 kda escherichia coli maltose binding protein/β-cyclodextrin complex.:  Chemical shift assignments and analysis. J. Am. Chem. Soc. 1998, 120, 11738–11748. [Google Scholar] [CrossRef]
  16. Walters, K.J.; Ferentz, A.E.; Hare, B.J.; Hidalgo, P.; Jasanoff, A.; Matsuo, H.; Wagner, G. Characterizing protein-protein complexes and oligomers by nuclear magnetic resonance spectroscopy. In Methods in Enzymology; James, T.L., Dötsch, V., Schmitz, U., Eds.; Academic Press: Cambridge, MA, USA, 2001; pp. 238–258. [Google Scholar]
  17. Göbl, C.; Madl, T.; Simon, B.; Sattler, M. NMR approaches for structural analysis of multidomain proteins and complexes in solution. Prog. Nuclear Mag. Res. Spect. 2014, 80, 26–63. [Google Scholar] [CrossRef] [PubMed]
  18. Keskin, O.; Tuncbag, N.; Gursoy, A. Predicting Protein-Protein Interactions from the Molecular to the Proteome Level. Chem. Rev. 2016, 116, 4884–4909. [Google Scholar] [CrossRef] [PubMed]
  19. Jones, S.; Thornton, J.M. Principles of protein-protein interactions. Proc. Natl. Acad. Sci. USA 1996, 93, 13–20. [Google Scholar] [CrossRef] [PubMed]
  20. Zhang, X.; Wang, Y.; Wang, J.; Sun, F. Protein-protein interactions among signaling pathways may become new therapeutic targets in liver cancer. Oncol. Rep. 2016, 35, 625–638. [Google Scholar] [CrossRef] [PubMed]
  21. Braun, P.; Gingras, A.C. History of protein-protein interactions: From egg-white to complex networks. Proteomics 2012, 12, 1478–1498. [Google Scholar] [CrossRef] [PubMed]
  22. Andreani, J.; Guerois, R. Evolution of protein interactions: From interactomes to interfaces. Arch. Biochem. Biophys. 2014, 554, 65–75. [Google Scholar] [CrossRef] [PubMed]
  23. Lage, K. Protein-protein interactions and genetic diseases: The interactome. Biochim. Biophys. Acta 2014, 1842, 1971–1980. [Google Scholar] [CrossRef] [PubMed]
  24. Bhattacharya, A.; Kim, Y.C.; Mittal, J. Protein-protein interactions in a crowded environment. Biophys. Rev. 2013, 5, 99–108. [Google Scholar] [CrossRef] [PubMed]
  25. Vuister, G.W.; Wang, A.C.; Bax, A. Measurement of three-bond nitrogen-carbon J. couplings in proteins uniformly enriched in nitrogen-15 and carbon-13. J. Am. Chem. Soc. 1993, 115, 5334–5335. [Google Scholar] [CrossRef]
  26. Montelione, G.T.; Winkler, M.E.; Rauenbuehler, P.; Wagner, G. Accurate measurements of long-range heteronuclear coupling constants from homonuclear 2D NMR spectra of isotope-enriched proteins. J. Magn. Reson. 1989, 82, 198–204. [Google Scholar] [CrossRef]
  27. Wider, G.; Neri, D.; Otting, G.; Wüjthrich, K. A heteronuclear three-dimensional NMR experiment for measurements of small heteronuclear coupling constants in biological macromolecules. J. Magn. Reson. 1989, 85, 426–431. [Google Scholar] [CrossRef]
  28. Kurz, M.; Schmieder, P.; Kessler, H. HETLOC, an efficient method for determining heteronuclear long-range couplings with heteronuclei in natural abundance. Angew. Chem. Int. Ed. 1991, 30, 1329–1331. [Google Scholar] [CrossRef]
  29. Edison, A.S.; Westler, W.M.; Markley, J.L. Elucidation of amino acid spin systems in proteins and determination of heteronuclear coupling constants by carbon-proton-proton three-dimensional NMR. J. Magn. Reson. 1991, 92, 434–438. [Google Scholar] [CrossRef]
  30. Xu, R.X.; Olejniczak, E.T.; Fesik, S.W. Stereospecific assignments and χ1 rotamers for FKBP when bound to ascomycin from 3JHα,Hβ and 3JN,Hβ coupling constants. FEBS Lett. 1992, 305, 137–143. [Google Scholar] [CrossRef]
  31. Sattler, M.; Schwalbe, H.; Griesinger, C. Stereospecific assignment of leucine methyl groups with carbon-13 in natural abundance or with random 13C labeling. J. Am. Chem. Soc. 1992, 114, 1126–1127. [Google Scholar] [CrossRef]
  32. Tonelli, M.; Masterson, L.R.; Hallenga, K.; Veglia, G.; Markley, J.L. Carbonyl carbon label selective (CCLS) (1)H–(15)N HSQC experiment for improved detection of backbone (13)C–(15)N cross peaks in larger proteins. J. Biomol. NMR 2007, 39, 177–185. [Google Scholar] [CrossRef] [PubMed]
  33. Taylor, S.S.; Yang, J.; Wu, J.; Haste, N.M.; Radzio-Andzelm, E.; Anand, G. PKA: A portrait of protein kinase dynamics. BBA 2004, 1697, 259–269. [Google Scholar] [CrossRef] [PubMed]
  34. Taylor, S.S.; Kim, C.; Vigil, D.; Haste, N.M.; Yang, J.; Wu, J.; Anand, G.S. Dynamics of signaling by PKA. BBA 2005, 1754, 25–37. [Google Scholar] [CrossRef] [PubMed]
  35. Langer, T.; Vogtherr, M.; Elshorst, B.; Betz, M.; Schieborr, U.; Saxena, K.; Schwalbe, H. NMR backbone assignment of a protein kinase catalytic domain by a combination of several approaches: Application to the catalytic subunit of camp-dependent protein kinase. ChemBioChem 2004, 5, 1508–1516. [Google Scholar] [CrossRef] [PubMed]
  36. Langer, T.; Sreeramulu, S.; Vogtherr, M.; Elshorst, B.; Betz, M.; Schieborr, U.; Schwalbe, H. Folding and activity of cAMP-dependent protein kinase mutants. FEBS Lett. 2005, 579, 4049–4054. [Google Scholar] [CrossRef] [PubMed] [Green Version]
  37. Vogtherr, M.; Saxena, K.; Grimme, S.; Betz, M.; Schieborr, U.; Pescatore, B.; Schwalbe, H. NMR backbone assignment of the mitogen-activated protein (MAP) kinase p38. J. Biomol. NMR 2005, 32, 175. [Google Scholar] [CrossRef] [PubMed]
  38. Vogtherr, M.; Saxena, K.; Hoelder, S.; Grimme, S.; Betz, M.; Schieborr, U.; Wendt, K.U. NMR Characterization of Kinase p38 Dynamics in Free and Ligand-Bound Forms. Angew. Chem. Int. Ed. 2006, 45, 993–997. [Google Scholar] [CrossRef] [PubMed]
  39. Masterson, L.R.; Shi, L.; Tonelli, M.; Mascioni, A.; Mueller, M.M.; Veglia, G. Backbone NMR resonance assignment of the catalytic subunit of cAMP-dependent protein kinase A in complex with AMP-PNP. Biomol. NMR Assign. 2009, 3, 115–117. [Google Scholar] [CrossRef] [PubMed] [Green Version]
  40. Masterson, L.R.; Shi, L.; Metcalfe, E.; Gao, J.; Taylor, S.S.; Veglia, G. Dynamically committed, uncommitted, and quenched states encoded in protein kinase A revealed by NMR spectroscopy. Proc. Natl. Acad. Sci. USA 2011, 108, 6969–6974. [Google Scholar] [CrossRef] [PubMed] [Green Version]
  41. Srivastava, A.K.; McDonald, L.R.; Cembran, A.; Kim, J.; Masterson, L.R.; McClendon, C.L.; Veglia, G. Synchronous opening and closing motions are essential for camp-dependent protein kinase a signaling. Structure 2014, 22, 1735–1743. [Google Scholar] [CrossRef] [PubMed]
  42. Kim, J.; Ahuja, L.G.; Chao, F.A.; Xia, Y.; McClendon, C.L.; Kornev, A.P.; Veglia, G. A dynamic hydrophobic core orchestrates allostery in protein kinases. Sci. Adv. 2017, 3, e1600663. [Google Scholar] [CrossRef] [PubMed] [Green Version]
  43. Dalton, G.D.; Dewey, W.L. Protein kinase inhibitor peptide (PKI): A family of endogenous neuropeptides that modulate neuronal cAMP-dependent protein kinase function. Neuropeptides 2006, 40, 23–34. [Google Scholar] [CrossRef] [PubMed]
  44. Mori, S.; Abeygunawardana, C.; Johnson, M.O.; Vanzijl, P.C.M. Improved Sensitivity of HSQC Spectra of Exchanging Protons at Short Interscan Delays Using a New Fast HSQC (FHSQC) Detection Scheme That Avoids Water Saturation. J. Magn. Reson. Ser. B 1995, 108, 94–98. [Google Scholar] [CrossRef]
  45. Masterson, L.R.; Tonelli, M.; Markley, J.L.; Veglia, G. Simultaneous detection and deconvolution of congested NMR spectra containing three isotopically labeled species. J. Am. Chem. Soc. 2008, 130, 7818–7819. [Google Scholar] [CrossRef] [PubMed]
  46. Wirmer, J.; Schwalbe, H. Angular dependence of 1J(Ni,Cαi) and 2J(Ni,Cαi−1) coupling constants measured in J-modulated HSQCs. J. Biomol. NMR 2002, 23, 47–55. [Google Scholar] [CrossRef] [PubMed]
  47. Traaseth, N.J.; Verardi, R.; Veglia, G. Asymmetric methyl group labeling as a probe of membrane protein homo-oligomers by NMR spectroscopy. J. Am. Chem. Soc. 2008, 130, 2400–2401. [Google Scholar] [CrossRef] [PubMed]
  48. Verardi, R.; Traaseth, N.J.; Masterson, L.R.; Vostrikov, V.V.; Veglia, G. Isotope labeling for solution and solid-state NMR spectroscopy of membrane proteins. Adv. Exp. Med. Biol. 2012, 992, 35–62. [Google Scholar] [PubMed]
  49. Atreya, H.S. Isotope Labeling in Biomolecular NMR; Springer: Dordrecht, The Netherlands; New York, NY, USA, 2012; p. 219. [Google Scholar]
  50. Anglister, J.; Srivastava, G.; Naider, F. Detection of intermolecular NOE interactions in large protein complexes. Prog. Nucl. Magn. Reson. Spectrosc. 2016, 97, 40–56. [Google Scholar] [CrossRef] [PubMed]
  51. Anglister, J.; Levy, R.; Scherf, T. Interactions of antibody aromatic residues with a peptide of cholera toxin observed by two-dimensional transferred nuclear Overhauser effect difference spectroscopy. Biochemistry 1989, 28, 3360–3365. [Google Scholar] [CrossRef] [PubMed]
  52. Scherf, T.; Anglister, J. A T1 rho-filtered two-dimensional transferred NOE spectrum for studying antibody interactions with peptide antigens. Biophys. J. 1993, 64, 754–761. [Google Scholar] [CrossRef] [Green Version]
  53. Hansen, D.F.; Vallurupalli, P.; Lundström, P.; Neudecker, P.; Kay, L.E. Probing chemical shifts of invisible states of proteins with relaxation dispersion NMR spectroscopy: How well can we do? J. Am. Chem. Soc. 2008, 130, 2667–2675. [Google Scholar] [CrossRef] [PubMed]
  54. Lundström, P.; Teilum, K.; Carstensen, T.; Bezsonova, I.; Wiesner, S.; Hansen, D.F.; Tomasz, L.R.; Mikael, A.; Kay, L. EFractional 13C enrichment of isolated carbons using [1-13C]- or [2-13C]-glucose facilitates the accurate measurement of dynamics at backbone Cα and side-chain methyl positions in proteins. J. Biomol. NMR 2007, 38, 199–212. [Google Scholar] [CrossRef] [PubMed]
  55. LeMaster, D.M.; Kushlan, D.M. Dynamical mapping of E. coli thioredoxin via 13C NMR relaxation analysis. J. Am. Chem. Soc. 1996, 118, 9255–9264. [Google Scholar] [CrossRef]
  56. Takeuchi, K.; Ng, E.; Malia, T.J.; Wagner, G. 1-13C amino acid selective labeling in a 2H15N background for NMR studies of large proteins. J. Biomol. NMR 2007, 38, 89–98. [Google Scholar] [CrossRef] [PubMed]
  57. Takeuchi, K.; Sun, Z.-Y.J.; Wagner, G. Alternate 13C-12C labeling for complete mainchain resonance assignments using Cα direct-detection with applicability toward fast relaxing protein systems. J. Am. Chem. Soc. 2008, 130, 17210–17211. [Google Scholar] [CrossRef] [PubMed]
  58. Prestegard, J.H.; Bougault, C.M.; Kishore, A.I. Residual dipolar couplings in structure determination of biomolecules. Chem. Rev. 2004, 104, 3519–3540. [Google Scholar] [CrossRef] [PubMed]
  59. Lipsitz, R.S.; Tjandra, N. Residual dipolar couplings in NMR structure analysis. Annu. Rev. Biophys. Biomol. Struct. 2004, 33, 387–413. [Google Scholar] [CrossRef] [PubMed]
  60. Bax, A.; Grishaev, A. Weak alignment NMR: A hawk-eyed view of biomolecular structure. Curr. Opin. Struct. Biol. 2005, 15, 563–570. [Google Scholar] [CrossRef] [PubMed]
  61. Tolman, J.R.; Ruan, K. NMR residual dipolar couplings as probes of biomolecular dynamics. Chem. Rev. 2006, 106, 1720–1736. [Google Scholar] [CrossRef] [PubMed]
  62. Ottiger, M.; Delaglio, F.; Bax, A. Measurement of J and dipolar couplings from simplified two-dimensional NMR spectra. J. Magn. Reson. 1998, 131, 373–378. [Google Scholar] [CrossRef] [PubMed]
  63. Ding, K.; Gronenborn, A.M. Sensitivity-enhanced 2D IPAP, TROSY-anti-TROSY, and E.COSY experiments: Alternatives for measuring dipolar 15N–1HN couplings. J. Magn. Reson. 2003, 163, 208–214. [Google Scholar] [CrossRef]
  64. Tonelli, M.; Masterson, L.R.; Cornilescu, G.; Markley, J.L.; Veglia, G. One-sample approach to determine the relative orientations of proteins in ternary and binary complexes from residual dipolar coupling measurements. J. Am. Chem. Soc. 2009, 131, 14138–14139. [Google Scholar] [CrossRef] [PubMed]
  65. Sharff, A.J.; Rodseth, L.E.; Spurlino, J.C.; Quiocho, F.A. Crystallographic evidence of a large ligand-induced hinge-twist motion between the two domains of the maltodextrin binding protein involved in active transport and chemotaxis. Biochemistry 1992, 31, 10657–10663. [Google Scholar] [CrossRef] [PubMed]
  66. Vijay-Kumar, S.; Bugg, C.E.; Cook, W.J. Structure of ubiquitin refined at 1.8 Åresolution. J. Mol. Biol. 1987, 194, 531–544. [Google Scholar] [CrossRef]
  67. Clore, G.M.; Iwahara, J. Theory, practice, and applications of paramagnetic relaxation enhancement for the characterization of transient low-population states of biological macromolecules and their complexes. Chem. Rev. 2009, 109, 4108–4139. [Google Scholar] [CrossRef] [PubMed]
  68. Solomon, I. Relaxation processes in a system of two spins. Phys. Rev. 1955, 99, 559–565. [Google Scholar] [CrossRef]
  69. Iwahara, J.; Tang, C.; Clore, G.M. Practical aspects of (1)h transverse paramagnetic relaxation enhancement measurements on macromolecules. J. Magn. Reson. 2007, 184, 185–195. [Google Scholar] [CrossRef] [PubMed]
  70. Janowska, M.K.; Baum, J. Intermolecular paramagnetic relaxation enhancement (pre) studies of transient complexes in intrinsically disordered proteins. Methods Mol. Biol. 2016, 1345, 45–53. [Google Scholar] [PubMed]
  71. Newby, F.N.; De Simone, A.; Yagi-Utsumi, M.; Salvatella, X.; Dobson, C.M.; Vendruscolo, M. Structure-free validation of residual dipolar coupling and paramagnetic relaxation enhancement measurements of disordered proteins. Biochemistry 2015, 54, 6876–6886. [Google Scholar] [CrossRef] [PubMed]
  72. Eliezer, D. Distance information for disordered proteins from NMR and ESR measurements using paramagnetic spin labels. Methods Mol. Biol. 2012, 895, 127–138. [Google Scholar] [PubMed]
  73. Mainz, A.; Religa, T.L.; Sprangers, R.; Linser, R.; Kay, L.E.; Reif, B. NMR spectroscopy of soluble protein complexes at one mega-dalton and beyond. Angew. Chem. Int. Ed. 2013, 52, 8746–8751. [Google Scholar] [CrossRef] [PubMed]
  74. Tzakos, A.G.; Grace, C.R.; Lukavsky, P.J.; Riek, R. NMR techniques for very large proteins and rnas in solution. Annu. Rev. Biophys. Biomol. Struct. 2006, 35, 319–342. [Google Scholar] [CrossRef] [PubMed]
  75. Manu, V.S.; Veglia, G. Genetic algorithm optimized triply compensated pulses in NMR spectroscopy. J. Magn. Reson. 2015, 260, 136–143. [Google Scholar] [CrossRef] [PubMed] [Green Version]
  76. Xia, Y.; Rossi, P.; Subrahmanian, M.V.; Huang, C.; Saleh, T.; Olivieri, C.; Veglia, G. Enhancing the sensitivity of multidimensional NMR experiments by using triply-compensated pi pulses. J. Biomol. NMR 2017, 69, 237–243. [Google Scholar] [CrossRef] [PubMed]
Figure 1. CCLS pulse sequence. (A) Schematic of the CCLS-HSQC pulse sequence. It can be assumed, unless otherwise indicated, that all rectangular pulses are applied along the x-axis. 90° and 180° flip angles are represented by narrow bars and wide bars, respectively. The carrier frequency for 1H is set on resonance with water at 4.77 ppm. The carrier frequency for 15N is set in the center of the amide region at 121.8 ppm. The 13C offset is set to 174.8 for the C′ region. The reference spectrum is recorded with the shaped pulse for 13C′ (open rectangle) at the position while the suppression spectrum is recorded with this pulse in position b. A 3-9-19 Watergate pulse scheme is used in the reverse INEPT transfer. GARP1 decoupling with a field strength of 1 kHz is used during the acquisition of 15N. Delay durations: Δ = 2.4 ms, δ = 0.11 ms, TNC′ = 16.5 ms. Phase cycling: φ1 = x, −x, φ2 = x, x, −x, −x, φrec = x, −x. A second FID is acquired for each increment by changing the φ1 phase to y, −y in order to accomplish States quadrature detection for the 15N indirect dimension. The φ1 and φrec phases are also incremented by 180° every other 15N increment for States-TPPI acquisition. The gradients use the Wurst shaped z-axis gradients of 1 ms. Gradient strengths (G/cm): G1: 5, G2: 7, G3: 17. The CCLS-HSQC pulse sequence is based on the fast HSQC experiment [44] to preserve water magnetization. (B) Example spectra representing the reference spectrum, the suppression spectrum, and the resulting subtraction spectrum followed by insets from the PKA-C/PKIα complex displaying the separation of resonances from each species. The blue and red species are present in the reference CCLS-HSQC while the suppression spectrum contains only blue species. Subtraction of the suppression from the reference spectrum results in a third spectrum containing only the red species. (C) CCLS-HSQC experiment on the 50 kDa PKA-C/PKIα complex. The reference spectrum (left, purple) displays resonances from both U-15N labeled PKA-C as well as U-15N, 13C labeled PKIα (S/N = 40). The suppression spectrum (middle, blue) suppresses a signal from the 13C′ labeled PKIα, which shows only peaks from 12C′ labeled PKA-C (S/N = 50). Upon subtraction of the suppression spectrum from the reference spectrum, a sub-spectrum is obtained containing only peaks from the PKIα (right, red) (S/N = 15). (All figures were cited with permission of Springer Nature).
Molecules 23 01937 g001
Figure 2. DCLS Pulsepulse sequence. (A) Schematic of the DCLS-HSQC pulse sequence. It can be assumed, unless otherwise indicated, that all pulses are applied along the x-axis. 90° and 180° flip angles are represented by narrow bars and wide bars, respectively. The reference spectrum is recorded with the shaped pulse for 13C (open rectangle) at position a while the 13C′ suppression spectrum is recorded with this pulse in position b and the 13Cα suppression spectrum is recorded with the 13Cα shaped pulse in position c. A 3-9-19 water-gate pulse scheme is used in the reverse INEPT transfer. GARP1 decoupling with a field strength of 1 kHz is used during the acquisition of 15N. The carrier frequency for 1H is set on the resonance with water at 4.7 ppm. The carrier frequency for 15N is set in the center of the amide region at 120 ppm and the 13C offset is set to 56 ppm. Selective 13C′ (13Cα) sine shaped pulses are centered at 174 (56 ppm) and a null 113 ppm away. Delay durations: Δ = 2.4 ms, δ = 0.11 ms, TNC′ = 16.4 ms, and TNCα = 24.5 ms. Phase cycling: φ1 = x, −x, φ2 = x, x, −x, −x, φrec = x, −x. A second FID is acquired for each increment by changing the φ1 phase to y, −y in order to accomplish states quadrature detection for the 15N indirect dimension. The φ1 and φrec phases are also incremented by 180° every other 15N increment for States-TPPI acquisition. The gradients use the Wurst shaped z-axis gradients of 1 ms. Gradient strengths (G/cm): G1: 5, G2: 7, G3: 17. (B) Example spectra representing the reference spectrum, the two suppression spectra, and the resulting subtraction spectra. The red, green, and blue species are present in the reference of DCLS-HSQC (a) while the first suppression spectrum (b) contains resonances from the blue species and the second suppression spectrum (c) contains resonances from the blue and green species. Subtracting spectrum c from a results in only resonances from the red species and subtracting spectrum c from b yields only resonances from the green species. This linear subtraction scheme results in spectra with each component in the mixture isolated. (All figures were cited with permission of American Chemical Society).
Molecules 23 01937 g002
Figure 3. CCLS/DCLS RDC. (A,B) Schematic of the gradient-selected TROSY-based pulse sequence for binary (A) or ternary (B) mixtures of proteins. It can be assumed, unless otherwise indicated, that all pulses are applied along the x-axis. 90° and 180° flip angles are represented by narrow bars and wide bars respectfully. The reference spectrum is recorded with the shaped pulse for 13C (open rectangle) at position a while the 13C′ suppression spectrum is recorded with this pulse in position b and the 13Cα suppression spectrum is recorded with the 13Cα shaped pulse in position c. The carrier frequency for 1H is set on resonance with water at 4.77 ppm, the carrier frequency for 15N is set in the center of the amide region at 121.8 ppm, and the 13C offset is set to 56 ppm. Selective 13C′ (13Cα) sine shaped pulses are centered at 174.8 ppm (56 ppm). Delay durations: Δ = 2.4 ms, δ1 = 1.5 s, TNC′ = 16.5 ms, and TNCα = 23.5 ms. Phase cycling: φ1 = x, −x, φ2 = −x, φ3 = −y, φrec = x, −x. Gradient strengths must be adjusted following the relationship G2 = G1·(γNH) where γN and γH are the gyromagnetic ratios of 15N and 1H, respectively. A second FID is collected for each increment by changing the φ2 and φ3 to x and y, respectively, and by inverting the sign of the G2 gradient in order to accomplish states quadrature detection for the 15N indirect dimension. The φ1 and φrec phases are also incremented by 180° with every other 15N increment for states-TPPI acquisition. The gradients use the Wurst shaped z-axis gradients of 1 ms. Gradient strengths (G/cm): G3: 3, G4: 13, G5: 4, G6: 5. To measure 1JHN coupling and NH RDC (in aligned media), which is a second spectrum, featuring the anti-TROSY component is acquired by changing the φ3 phase to y. (C) Example spectra representing the reference spectrum, the suppression spectrum, and the resulting subtraction spectrum. The blue and red species are present in the reference CCLS-HSQC while the suppression spectrum contains only blue species. Subtraction of the suppression from the reference spectrum results in a third spectrum containing only the red species. (D) Example spectra representing the reference spectrum, the two suppression spectra, and the resulting subtraction spectra. The red, green, and blue species are present in the reference DCLS-HSQC (a) while the first suppression spectrum (b) contains resonances from the blue species and the second suppression spectrum (c) contains resonances from the blue and green species. Subtracting spectrum c from results in only resonances from the red species and subtracting spectrum c from b yields only resonances from the green species. This linear subtraction scheme results in spectra with each component in the mixture isolated. (All figures were cited with permission of American Chemical Society).
Molecules 23 01937 g003
Figure 4. CCLS-PRE. (A) Schematic of the standard experiment for the detection of intra-molecular and inter-molecular PRE. In this case, four different samples are needed. The first sample for the intra-molecular PRE is prepared with an asymmetric labeling scheme using the first binding partner uniformly 15N labeled with a conjugated spin label (SL) and the second is NMR silent (unlabeled). A sample with a reversed labeling scheme is necessary to detect the intra-molecular PRE for the second binding partner (top panel A). For the inter-molecular PRE, two additional samples are required: one NMR silent with the conjugated SL and a second NMR active (e.g., 15N or 13C labeled) (lower panel A). Simultaneous detection of inter-molecular and intra-molecular PRE using 1HN-Γ2-CCLS experiment. One species is uniformly 15N labeled while the other is 13C and 15N labeled (b) allowing for the simultaneous detection of intra-molecular and inter-molecular PREs. As reported before, reverse positioning of the SL is required for obtaining a complete characterization of the complex. (B) The 1H-Γ2-CCLS pulse sequence for PRE Γ2 measurements. The narrow and wide bars represent 90° and 180° hard pulses, respectively. The three 13C 180° shaped pulses are 256 μs long Q3 pulse, the first two and the last one shaped pulses are applied to 13C′ and 13Cα, respectively. The 13C′ 180° shaped pulse may be at either position a or b. When it is at position a, the 1JNC′ is decoupled and reference spectra are acquired. When it is at position b, the 1JNC′ is present and 13C′-suppressed spectra are acquired. The flipping angles and phases of the pulses in 3919 are 20.8°x, 62.2°x, 131.6°x, 131.6°−x, 62.2°−x, and 20.8°−x, respectively, and the interval between pulses is 188 μs (=1/d, d is the distance in Hz between center and next null). T = 16.5 ms, Δ = 2.6 ms, G1 = (1 ms, 25.0 G/cm), G2 = (0.3 ms, 5.0 G/cm), G3 = (0.3 ms, 8.0 G/cm), G4 = (1 ms, 15.0 G/cm), and G5 = (1 ms, 10.0 G/cm). The phase cycling scheme is φ1 = (x, −x), φ2 = (x, x, −x, −x), φ3 = 4(x), 4(−x), φrec = (x, −x, x, −x, −x, x, −x, x). The quadrature detections in t1 dimension are acquired via States-TPPI of φ1. Constant time mode is used to measure Γ2, which is Γ 2 = Ln ( S 1 / S 2 ) / ( τ 2 τ 1 ) , where S 1 and S 2 are signal intensities of a peak measured with τ = τ 1 and τ = τ 2 , respectively. 2 × 2 spectra are acquired in an interleave mode via changing relaxation delay τ (minimum 2 ms) and changing the 13C′ 180° shaped pulse from position a to b, respectively. (C) Intra-molecular and inter-molecular PRE measurements of 15N-UbiK48C obtained with the 1H-Γ2-CCLS experiment. The 1HN-Γ2 rate plot calculated for K48C mutant conjugate with MTSL in presence of UbiWT (upper panel C). The 1HN-Γ2 rate plot calculated for WT ubiquitin in the presence of UbiK48C-MTSL (lower panel C). (All figures were cited with permission of Springer Nature).
Molecules 23 01937 g004
Figure 5. CCLS G5 pulse implementation. (A) CCLS 1H–15N HSQC reference spectrum of 15N, 13C UbiWT, and U-15N UbiK48C mutant. (B) Overlay spectra of the UbiWT alanine 46 peak demonstrating a 23% signal intensity improvement with the G5 pulse. (C) Overlay spectra of the UbiK48C alanine 46 peak demonstrating an 18% signal intensity improvement with the G5 pulse. (D) Overlay spectra of the glycine 75 peak demonstrating a 6% improvement with the G5 pulse. (All figures were cited with permission of Springer Nature).
Molecules 23 01937 g005

