Article

Equilibrium and Kinetic Study of Lead and Copper Ion Adsorption on Chitosan-Grafted-Polyacrylic Acid Synthesized by Surface Initiated Atomic Transfer Polymerization

by
Carlos David Grande-Tovar
1,
William Vallejo
1,* and
Fabio Zuluaga
2
1
Grupo de Fotoquímica y Fotobiología, Universidad del Atlántico, Puerto Colombia 81007, Colombia
2
Departamento de Química, Universidad del Valle, Santiago de Cali 760032, Colombia
*
Author to whom correspondence should be addressed.
Molecules 2018, 23(9), 2218; https://doi.org/10.3390/molecules23092218
Submission received: 15 June 2018 / Revised: 12 August 2018 / Accepted: 13 August 2018 / Published: 1 September 2018
(This article belongs to the Section Physical Chemistry)

Abstract

:
In this work, we synthesized chitosan grafted-polyacrylic acid (CS-g-PA) through surface-initiated atom transfer radical polymerization (SI-ATRP). We also studied the adsorption process of copper and lead ions onto the CS-g-PA surface. Adsorption equilibrium studies indicated that pH 4.0 was the best pH for the adsorption process and the maximum adsorption capacity over CS-g-PA for Pb2+ ions was 98 mg·g−1 and for Cu2+ it was 164 mg·g−1, while for chitosan alone (CS), the Pb2+ adsorption capacity was only 14.8 mg·g−1 and for Cu2+ it was 140 mg·g−1. Furthermore, the adsorption studies indicated that Langmuir model describes all the experimental data and besides, pseudo-second-order model was suitable to describe kinetic results for the adsorption process, demonstrating a larger kinetic constant of the process was larger for Pb2+ than Cu2+. Compared to other adsorbents reported, CS-g-PA had comparable or even superior adsorbent capacity and besides, all these results suggest that the new CS-g-PA polymers had potential as an adsorbent for hazardous and toxic metal ions produced by different industries.

1. Introduction

High content of metals (e.g., lead, cadmium, chromium, copper, nickel, arsenic, etc.) in water is dangerous to human health; currently, environmental research is directed to develop efficient methods for metal removal without causing additional subsequent contamination problems and besides, an important environmental concern [1]. Primarily, both lead and copper are reported among the most toxic metals to the environment; these metals have drawn much attention owing to its impact on the public health and toxicity, and for that reason, the United States Environmental Protection Agency (EPA), has classified some heavy metal ions as priority pollutants due to their high degree of toxicity and hazard when they are present in water and recently has published “Use of Lead Free Pipes, Fittings, Fixtures, Solder and Flux for Drinking Water” [2]. The main sources of lead and copper are wastewater discharge, mining activities, phosphate fertilizers, the textile and leather industries, plumbing manufacturing, electric wires, pigments, electroplating, municipal waste, sewage waste, welding, and galvanized steel, among others [3]. Lead, for example, represents a serious hazard because of its accumulation capacity and ability to damage the central nervous system. This metal, commonly found in minerals such as galena and cerussite, is used for the manufacture of batteries, welding, paints, pyrotechnics, pottery, glassware and mining. According to the WHO, the maximum level of lead in blood should be 0.015 mg/L [4]. Copper is a metal used in electrical, electronics and metal materials, due to its high electrical conductivity, ductility and malleability. It is also necessary for some biological processes (i.e., myelin formation of hemoglobin and excessive blood clotting prevention acting as a coenzyme of the immune system and regulating the production of melanin [5]), however, high concentrations of this element in the human body can affect health, causing headaches, vomiting, liver, blood, vessels and kidney damage; furthermore, exposure to copper for a long time can irritate the nose, mouth, eyes and respiratory system; the permitted level given by the WHO for Cu (II) into drinking water is 1.3 mg/L [6,7]. Different approaches have been employed to solve the growing need for lead and copper ion removal from water, including chemical precipitation and coagulation, membrane separation, ion exchange, and adsorption [7,8]. These methods each have distinct limitations and disadvantages when heavy metals are removed from groundwater. However, during the last years, adsorption processes have been shown to be effective and economical treatment processes, making them the most promising methodology. Table 1 lists some properties of the main technologies applied to metal removal [9].
Generally, materials that are able to remove lead and copper ions bear nitrogen, oxygen, and sulfur functional groups as the binding sites. Therefore, natural adsorbents, agricultural waste, and biopolymers have attracted considerable attention to remove heavy metal ions from wastewater due to their low cost and abundance in Nature and high efficiency [17]. Chitosan is a biopolymer of high interest because of its biocompatibility and antimicrobial effects against different microorganisms, currently obtained from the partial deacetylation of chitin, a polysaccharide obtained from the exoskeleton of crustaceans and the mycelium of some fungi [18]. Chitosan can form films and has several cross-linking points, such as nitrogen atoms, that also have chelating properties, and for this reason it has been used in different preparations (beads, nanobeads, nanoparticles, etc.) to remove heavy metal from different sources [19]. Chitosan beads, for example, have been used to remove effectively lead and copper [20,21,22]. Wan and Fatinathan have reported removal efficiencies greater than 60% for Pb(II) and Cu(II) by using chitosan beads, chitosan—GLA and chitosan-alginate beads [15,16]; Laus and Fávare reported removal of Cu(II) and Cd(II) by using chitosan crosslinked with epichlorohydrin–triphosphate; they reported % removal between (50–90%) for Cu(II) [23] and besides, Futalan et al. studied competitive adsorption of Cu(II), Pb(II), and Ni(II) by using chitosan immobilized on bentonite; they reported 80% to Pb(II) and 50% to Cu(II) removal [24]. All these reports indicate that chitosan has good adsorption capability, however, due to its weak mechanical properties, chemical and physical modifications must be carried out to improve its physicochemical and mechanical properties [16].
Surface-initiated polymerization has emerged as one of the most important techniques to modify the surface properties of materials, with important applications in the fields of optoelectronics, biosciences, and engineering [25]. Surface-initiated atomic radical polymerization, SI-ATRP, is a versatile method for the preparation of different hybrid materials, with a particular control over molecular weight and polydispersity, allowing control over molecular architectures [26]. SI-ATRP does not require stringent experimental conditions like other ionic living polymerization techniques having a high versatility for the polymerization of different monomers. Polymethacrylic acid brushes, for example, have been prepared by SI-ATRP using a two step procedure with protective groups to avoid catalyst poisoning [27,28]. However, the use of protecting groups in some cases could be more expensive and tiresome process. Water treatment with surface modified adsorbents such as polyacrylic acid could be interesting to improve the adsorption properties, resulting from the insolubility, higher adsorption capacities and ease of the purification process (a simple filtration at the end) to remove pollutants.
In this work, we report the surface modification of chitosan by surface-initiated ATRP with poly- (sodium acrylate), in order to obtain directly a chitosan-based material with an increased ability to remove heavy metals such as lead and copper, without the need of extra steps.

2. Results and Discussion
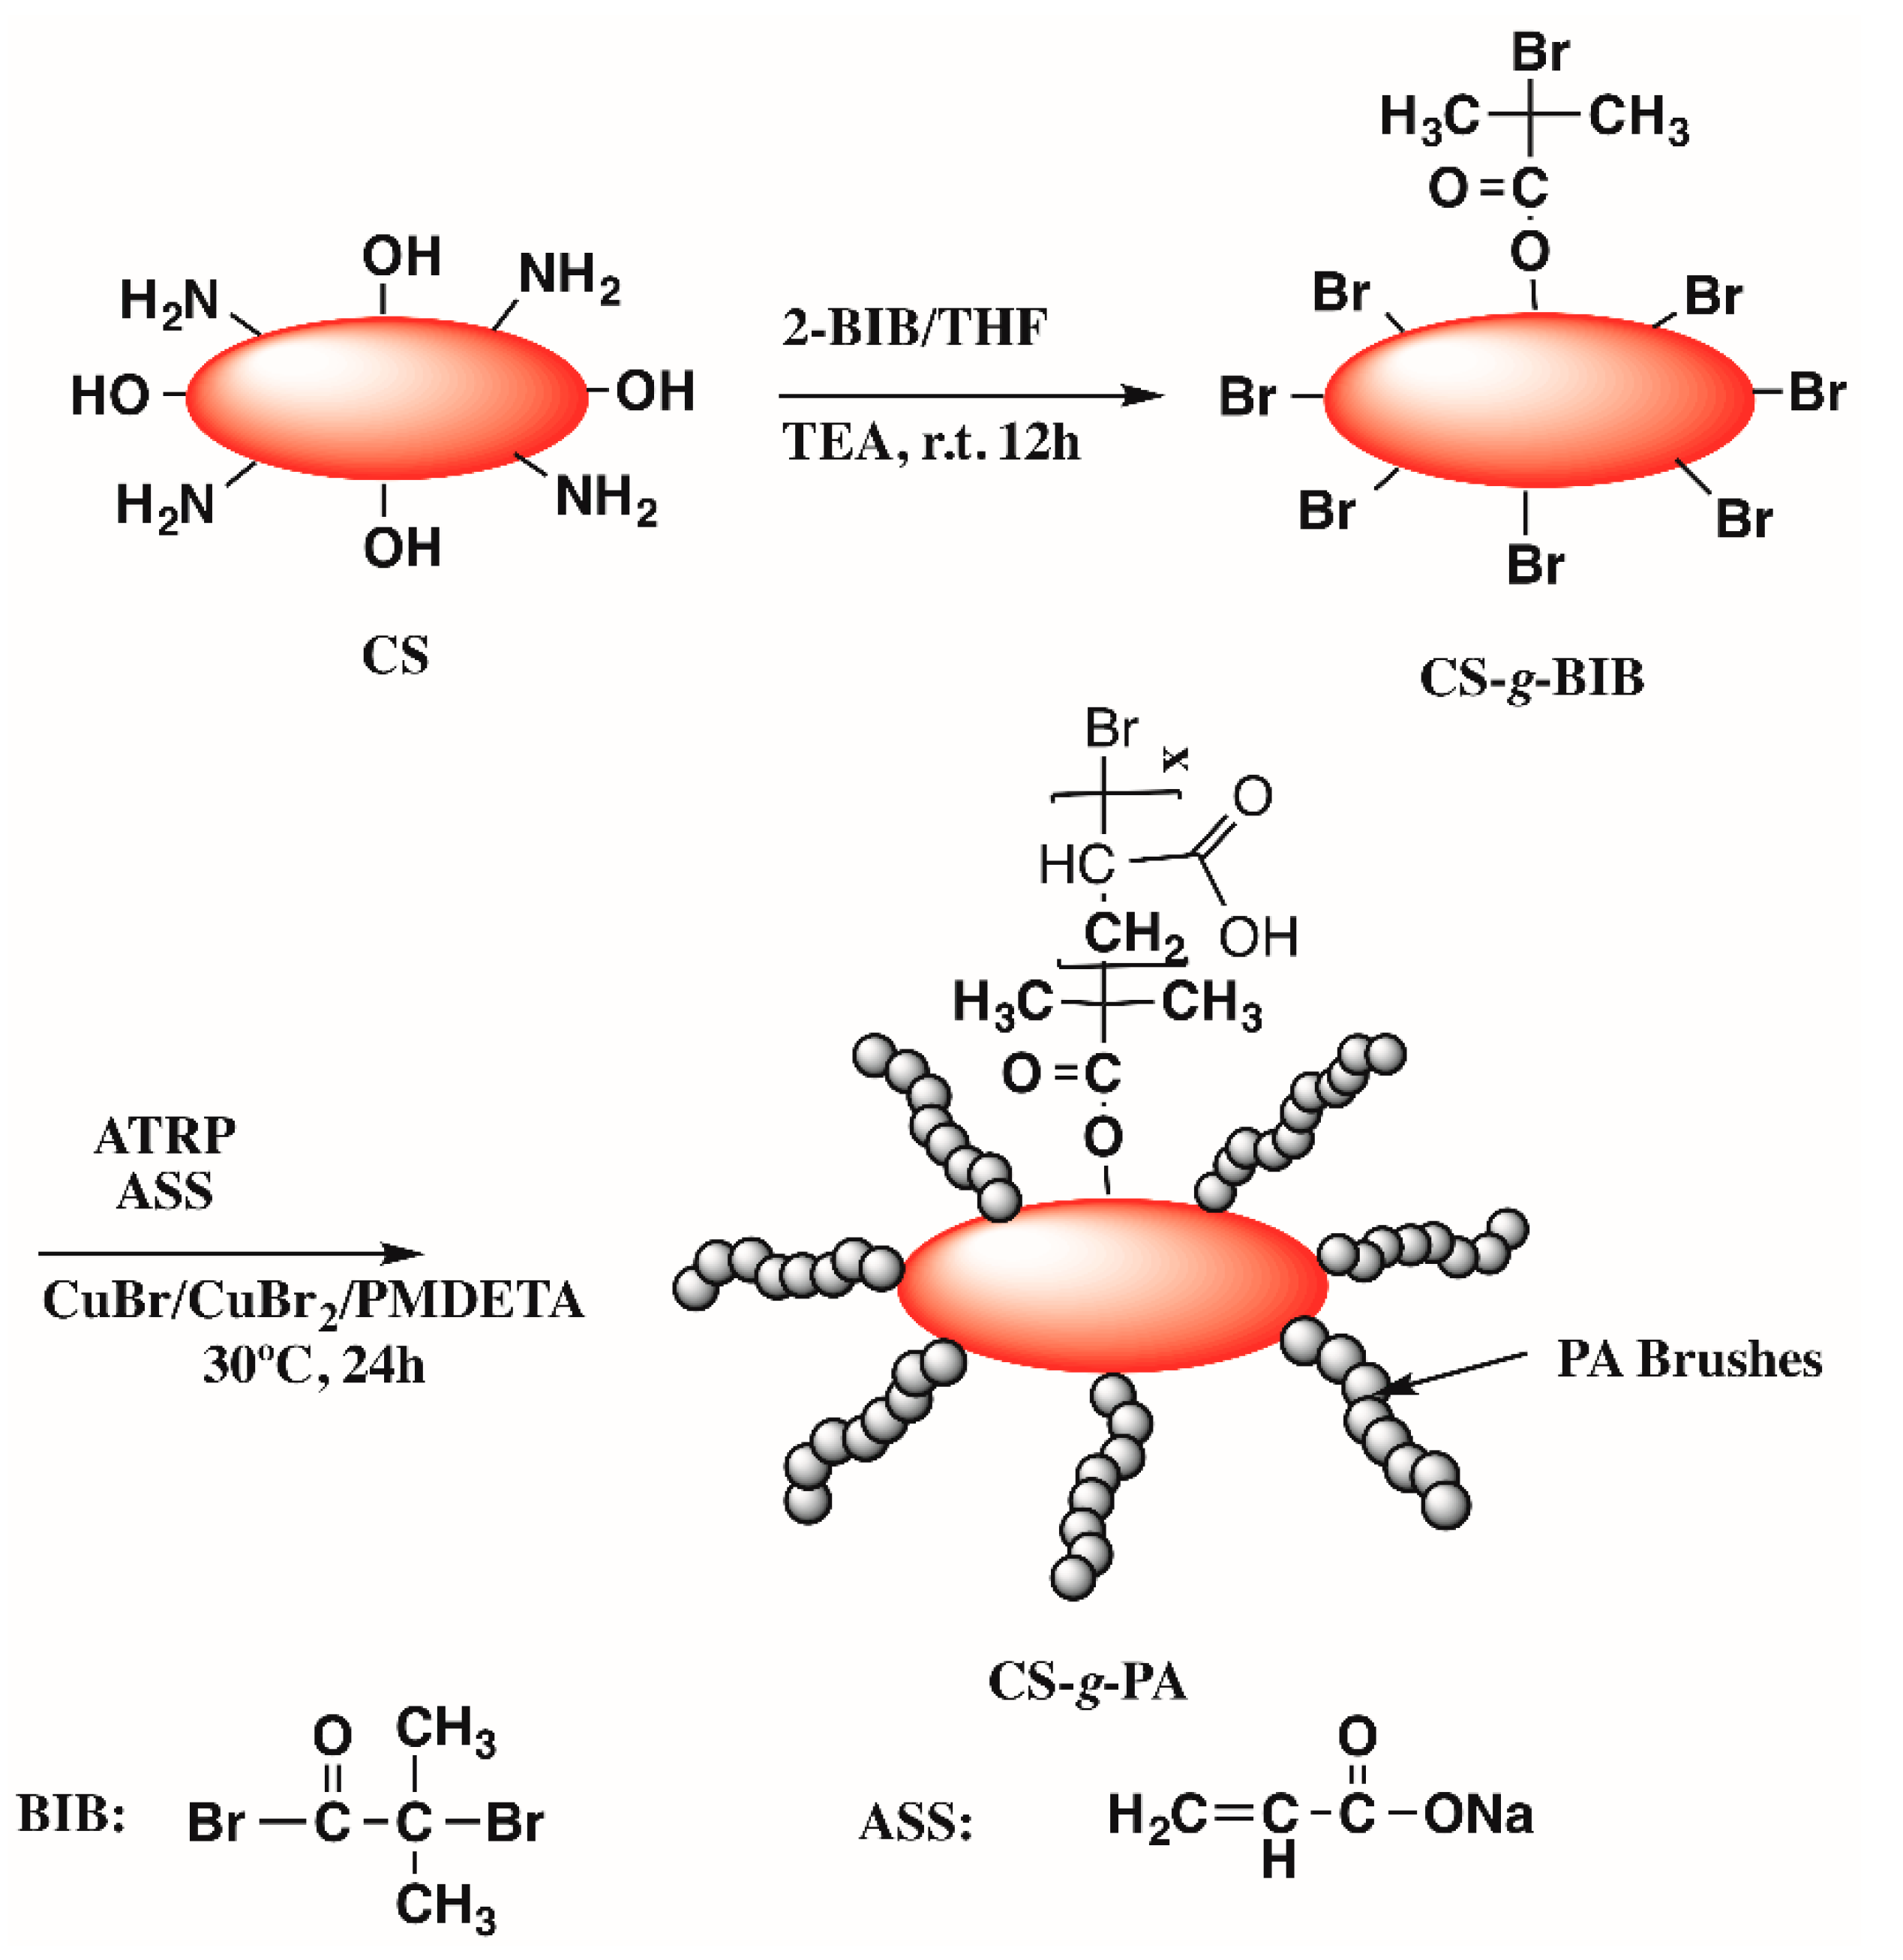
2.1. Synthesis

Direct ATRP polymerization of acid monomers can be affected by the reaction of the monomer with metal ions to form complexes that are catalytically ineffective [29]. Several authors have synthesized polymer brushes such as polymethacrylic acid and polyacrylic acid using tert-butyl acrylate and tert-butyl methacrylate via ATRP, using pyrolysis or hydrolysis of the tert-butyl ester protective group [30]. However, this methodology introduces additional steps and results in the loss of some polymer chains from the surface; it is clear that direct insertion of the acidic polymer chains by ATRP is a challenge. One possibility is to use a previously reported procedure that uses sodium salts of the acids and later acidification [29]. The SI-ATRP modification of chitosan particles was previously published by our group, but it is briefly discussed here. As we published earlier, the polymerization reaction of sodium acrylate was first conducted on silicon wafer surfaces modified by spin-coated chitosan. The polymerization conditions were: 100:2:0.4:5:1400 for NaAA:CuBr:CuBr2:PMDETA in a mixture of water/methanol (1:1). However, with an increasing of the molar ratio to 300:2:0.4:1400 for NaAA:CuBr:CuBr2:PMDETA and a decrease in the temperature of the system from 60 °C to 25 °C, the thickness of the system is increased as a result of a decreasing of the hydrolysis chain from the silicon surfaces. Details of characterization are reported in previous work by Grande et al. [31].

2.2. Chitosan Characterization

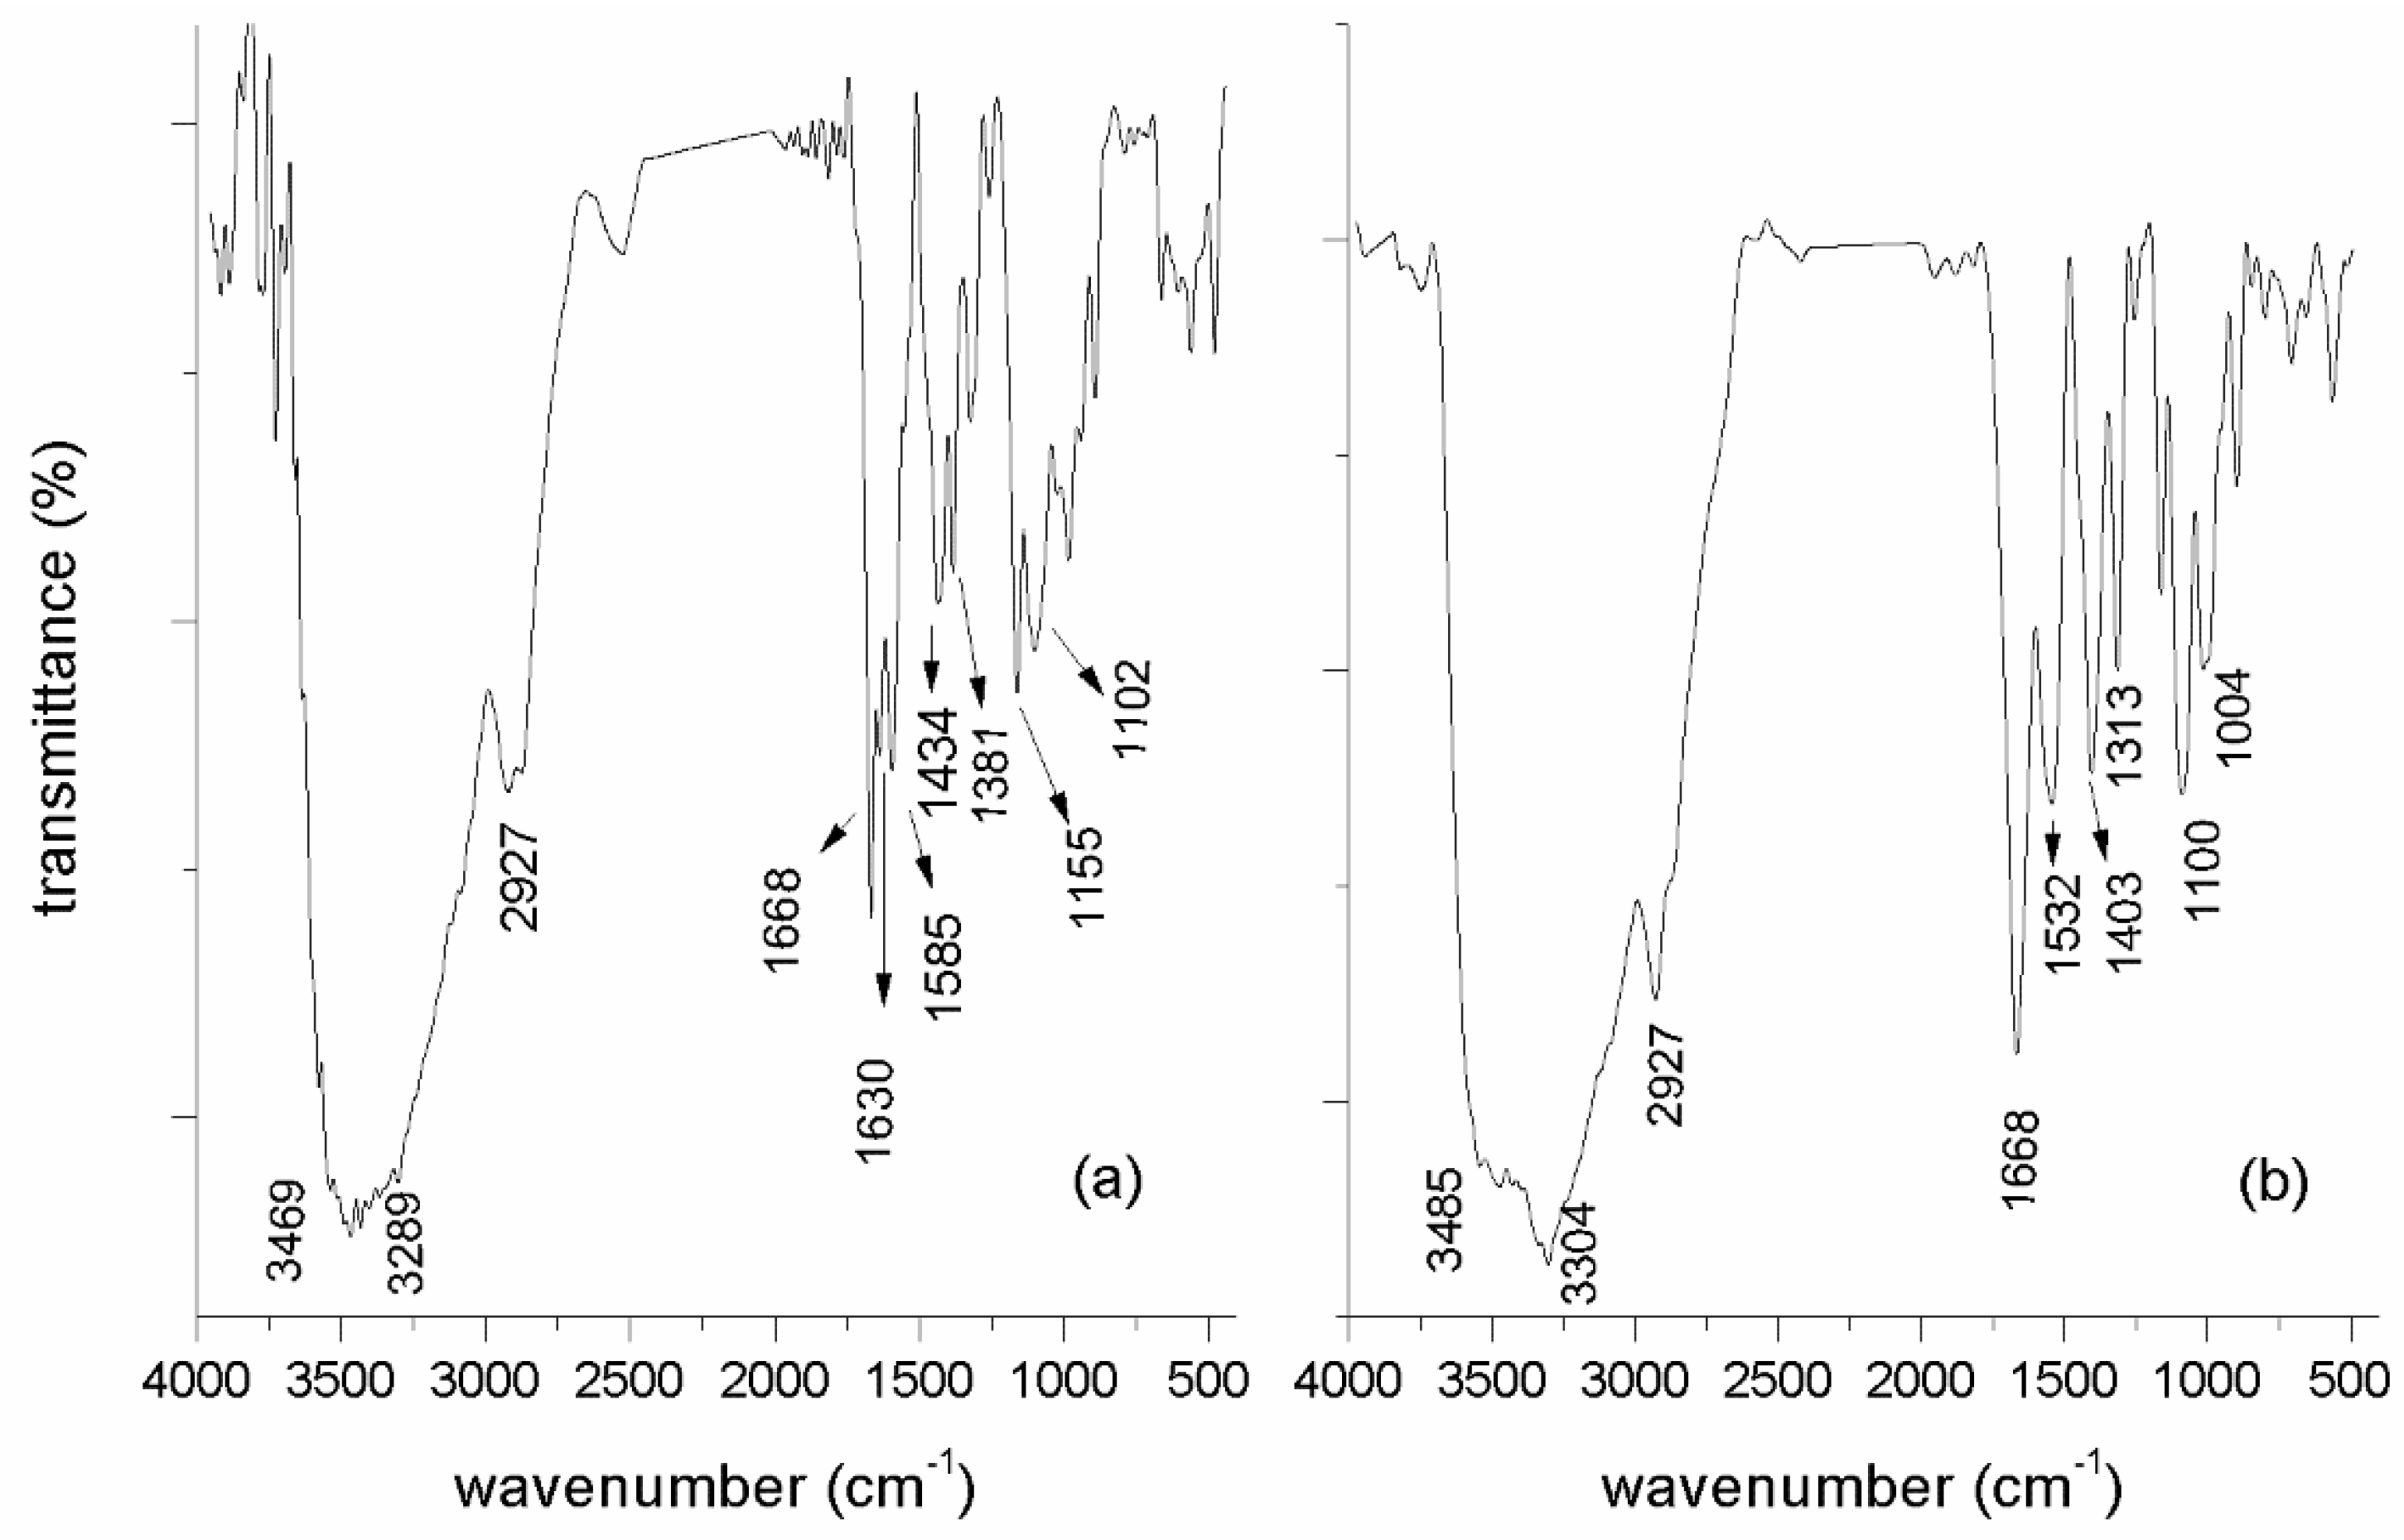
2.2.1. FT-IR Characterization

Surface modification of CS with 2-BIB was probed by FTIR (Figure 1a). The spectrum of the modified chitosan in solution shows the characteristic band at 1667 cm−1 of the stretching vibration of the C=O groups of amides, after functionalizing the chitosan, which overlaps with the N−H deformation. At 3400 cm−1 a wide strong band is observed, due to the stretch of the −OH typical of alcohols that overlaps the typical N−H stretch of amides. Between 2927 and 2864 cm−1 the stretching is observed due to the aliphatic tension vibration −CH; at 1719 cm−1, a band due to the stretching vibration of the C=O moieties of esters is observed, which confirms the reaction of the −OH groups of the chitosan with the ATRP initiator. Between 1620 and 1590 cm−1, two strong bands characteristic of primary amides are observed due to the deformation of the N−H bonds; between 1442 and 1323 cm−1, the deformation vibration of −O−H is apparent; between 1158 and 1100 cm−1, the typical CO stretch of esters can be observed, with bands of moderate intensity that could be overlapped with the stretching vibration of the CN bond, typical of amines (due to the amino groups that did not react with the ATRP initiator) [32]. In Figure 1b, two fundamental facts attributable to the polymerization of acrylic acid can be observed. Firstly, the widening of the band due to the vibration of the −OH and N−H bonds of amides, indicating the presence of more −OH groups typical of carboxylic acids. On the other hand, the presence of more carbon atoms on the surface of the chitosan from PA grafted causes an increase in the band due to the stretching of aliphatic −CH, present in the acrylic acid. A new wide band present at 1545 cm−1 is due to carboxylic acid anions (which is the state of the pH of the polymer reaction) as a consequence of the immobilization of PA on the surface of chitosan. Between 1083 and 1008 cm−1, two bands can be seen that can be assigned to the C-O stretching vibrations of the carboxylic acids, suggesting the effective immobilization of the PA through the ATRP polymerization reaction. The band from the primary amino groups of amines at 1158 cm−1 is reduced, which is attributed to the effective formation of the graft copolymer on the surface of the chitosan. These results suggest that the formation of modified chitosan with poly (acrylic acid) was carried out successfully, as observed in Figure 1 [31].

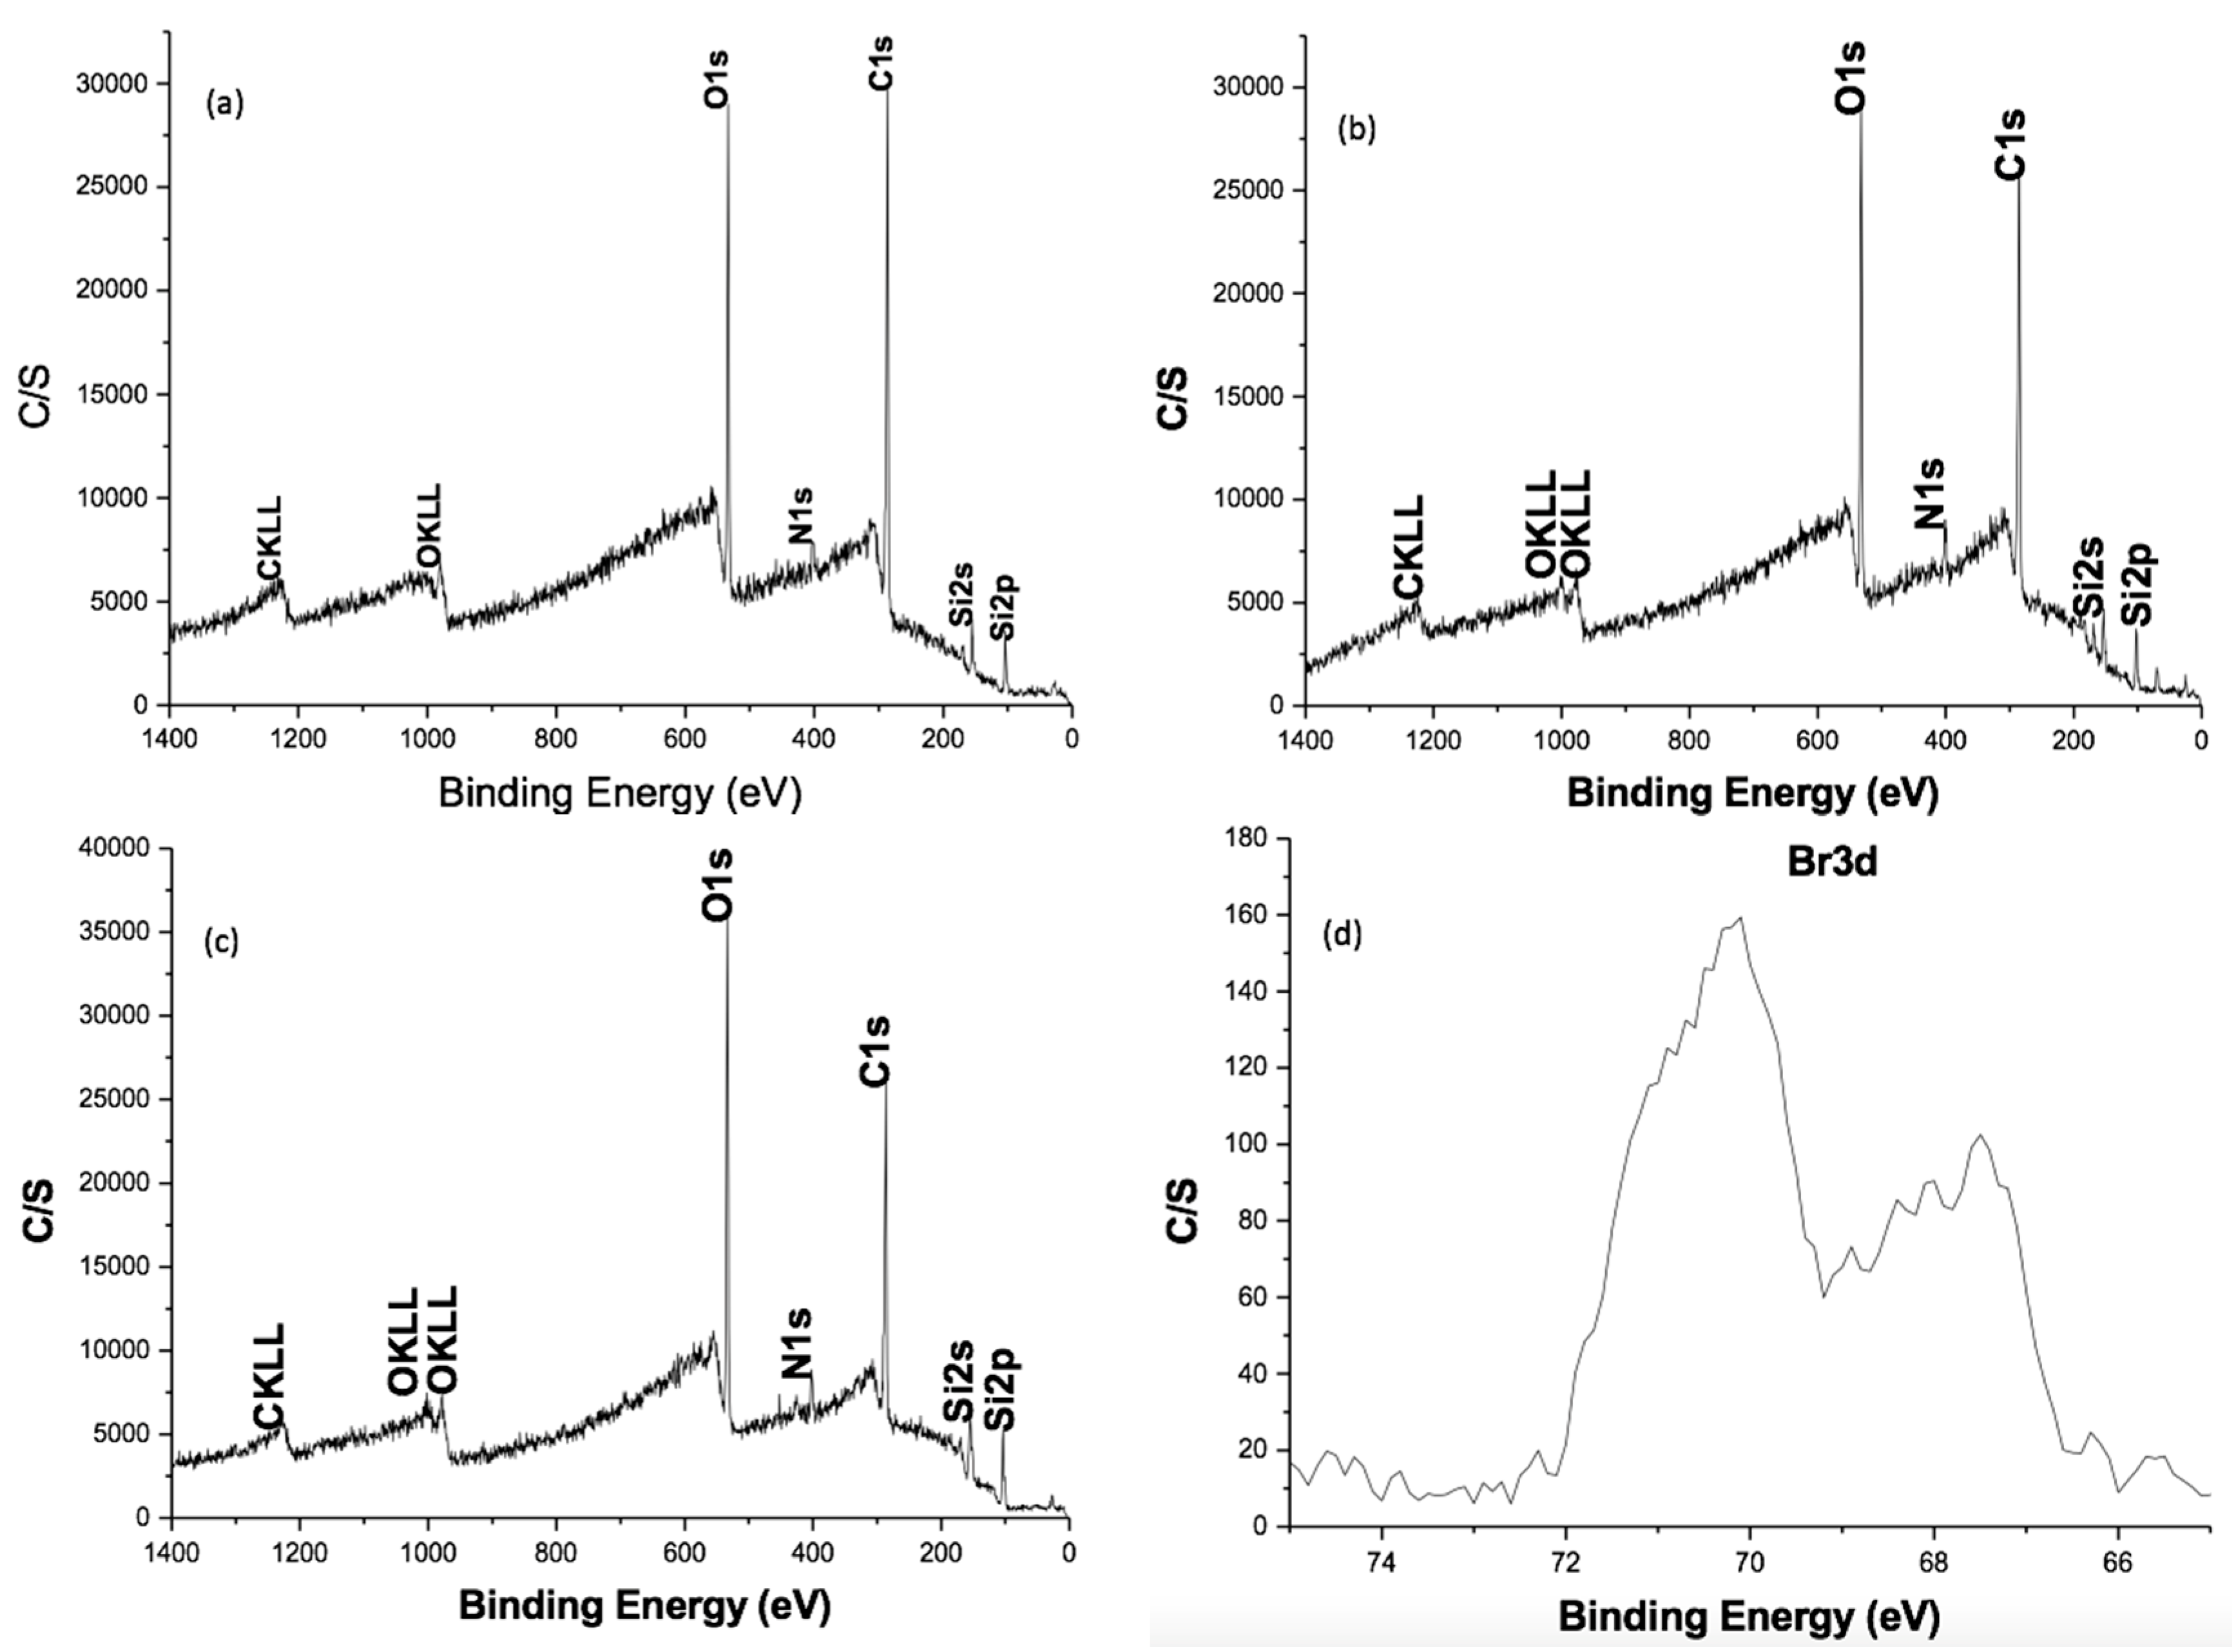
2.2.2. XPS Characterization

The XPS technique was also used to characterize the surface modification process via ATRP with polyacrylic acid. In this case, a solution of chitosan (1 mg/mL) was deposited onto a silica wafer surface using spin-coating technique and evaporated by rotating at 2300 rpm for 30 s. The resulting silica surface was used to carry out the modification process with the ATRP initiator, as described in the experimental part, and subsequently, the polymerization was conducted similarly for the chitosan particles. Figure 2 shows a typical wide-scan spectrum. Typical binding energy peaks for chitosan at 286.1 eV for C1s (69.13%), 534 eV for O 1s (24.66%), and 399 eV for N 1s (4.96%) (Figure 2a), the peak at 70 eV for Br 3d (1.25%) is observed after 2-BIB reaction, confirming the immobilization with the ATRP initiator (Figure 2b), high-resolution analysis of peak Br 3d is shown in Figure 2d [33,34]. However, after PA polymerization, the peak for bromine is absent, accompanied of an increment in the peak, due to O1s increased up to 33.89%, a consequence of the immobilization of poly (acrylic acid), while that the peak of C1s decreased to 56.26% (Figure 2c). The predicted percentage composition of a surface modified with chitosan would show that for carbon, would be around 54.53% and for oxygen 36.32%, very close to the values obtained for CS-g-PA, while it differs considerably from pristine CS. The absence of Br 3d in xps analysis (Figure 2c) still in the high-resolution analysis, shows that polymerization was carried out effectively [30]. Moreover, in an attempt to confirm the above, the CS was modified with PMMA, using the same procedure that for PA, and the surface was analyzed by XPS. Composition gave for the C1s 66.07%, N1s 4.33%, and for O1s 29.60%, very close to the predictions of a surface modified with PMMA that would give for carbon 58.80%, and 31.33% for oxygen, theoretically. These results agree with the findings by IR spectroscopy, confirming the immobilization of the polymer on the surface of the chitosan powder.

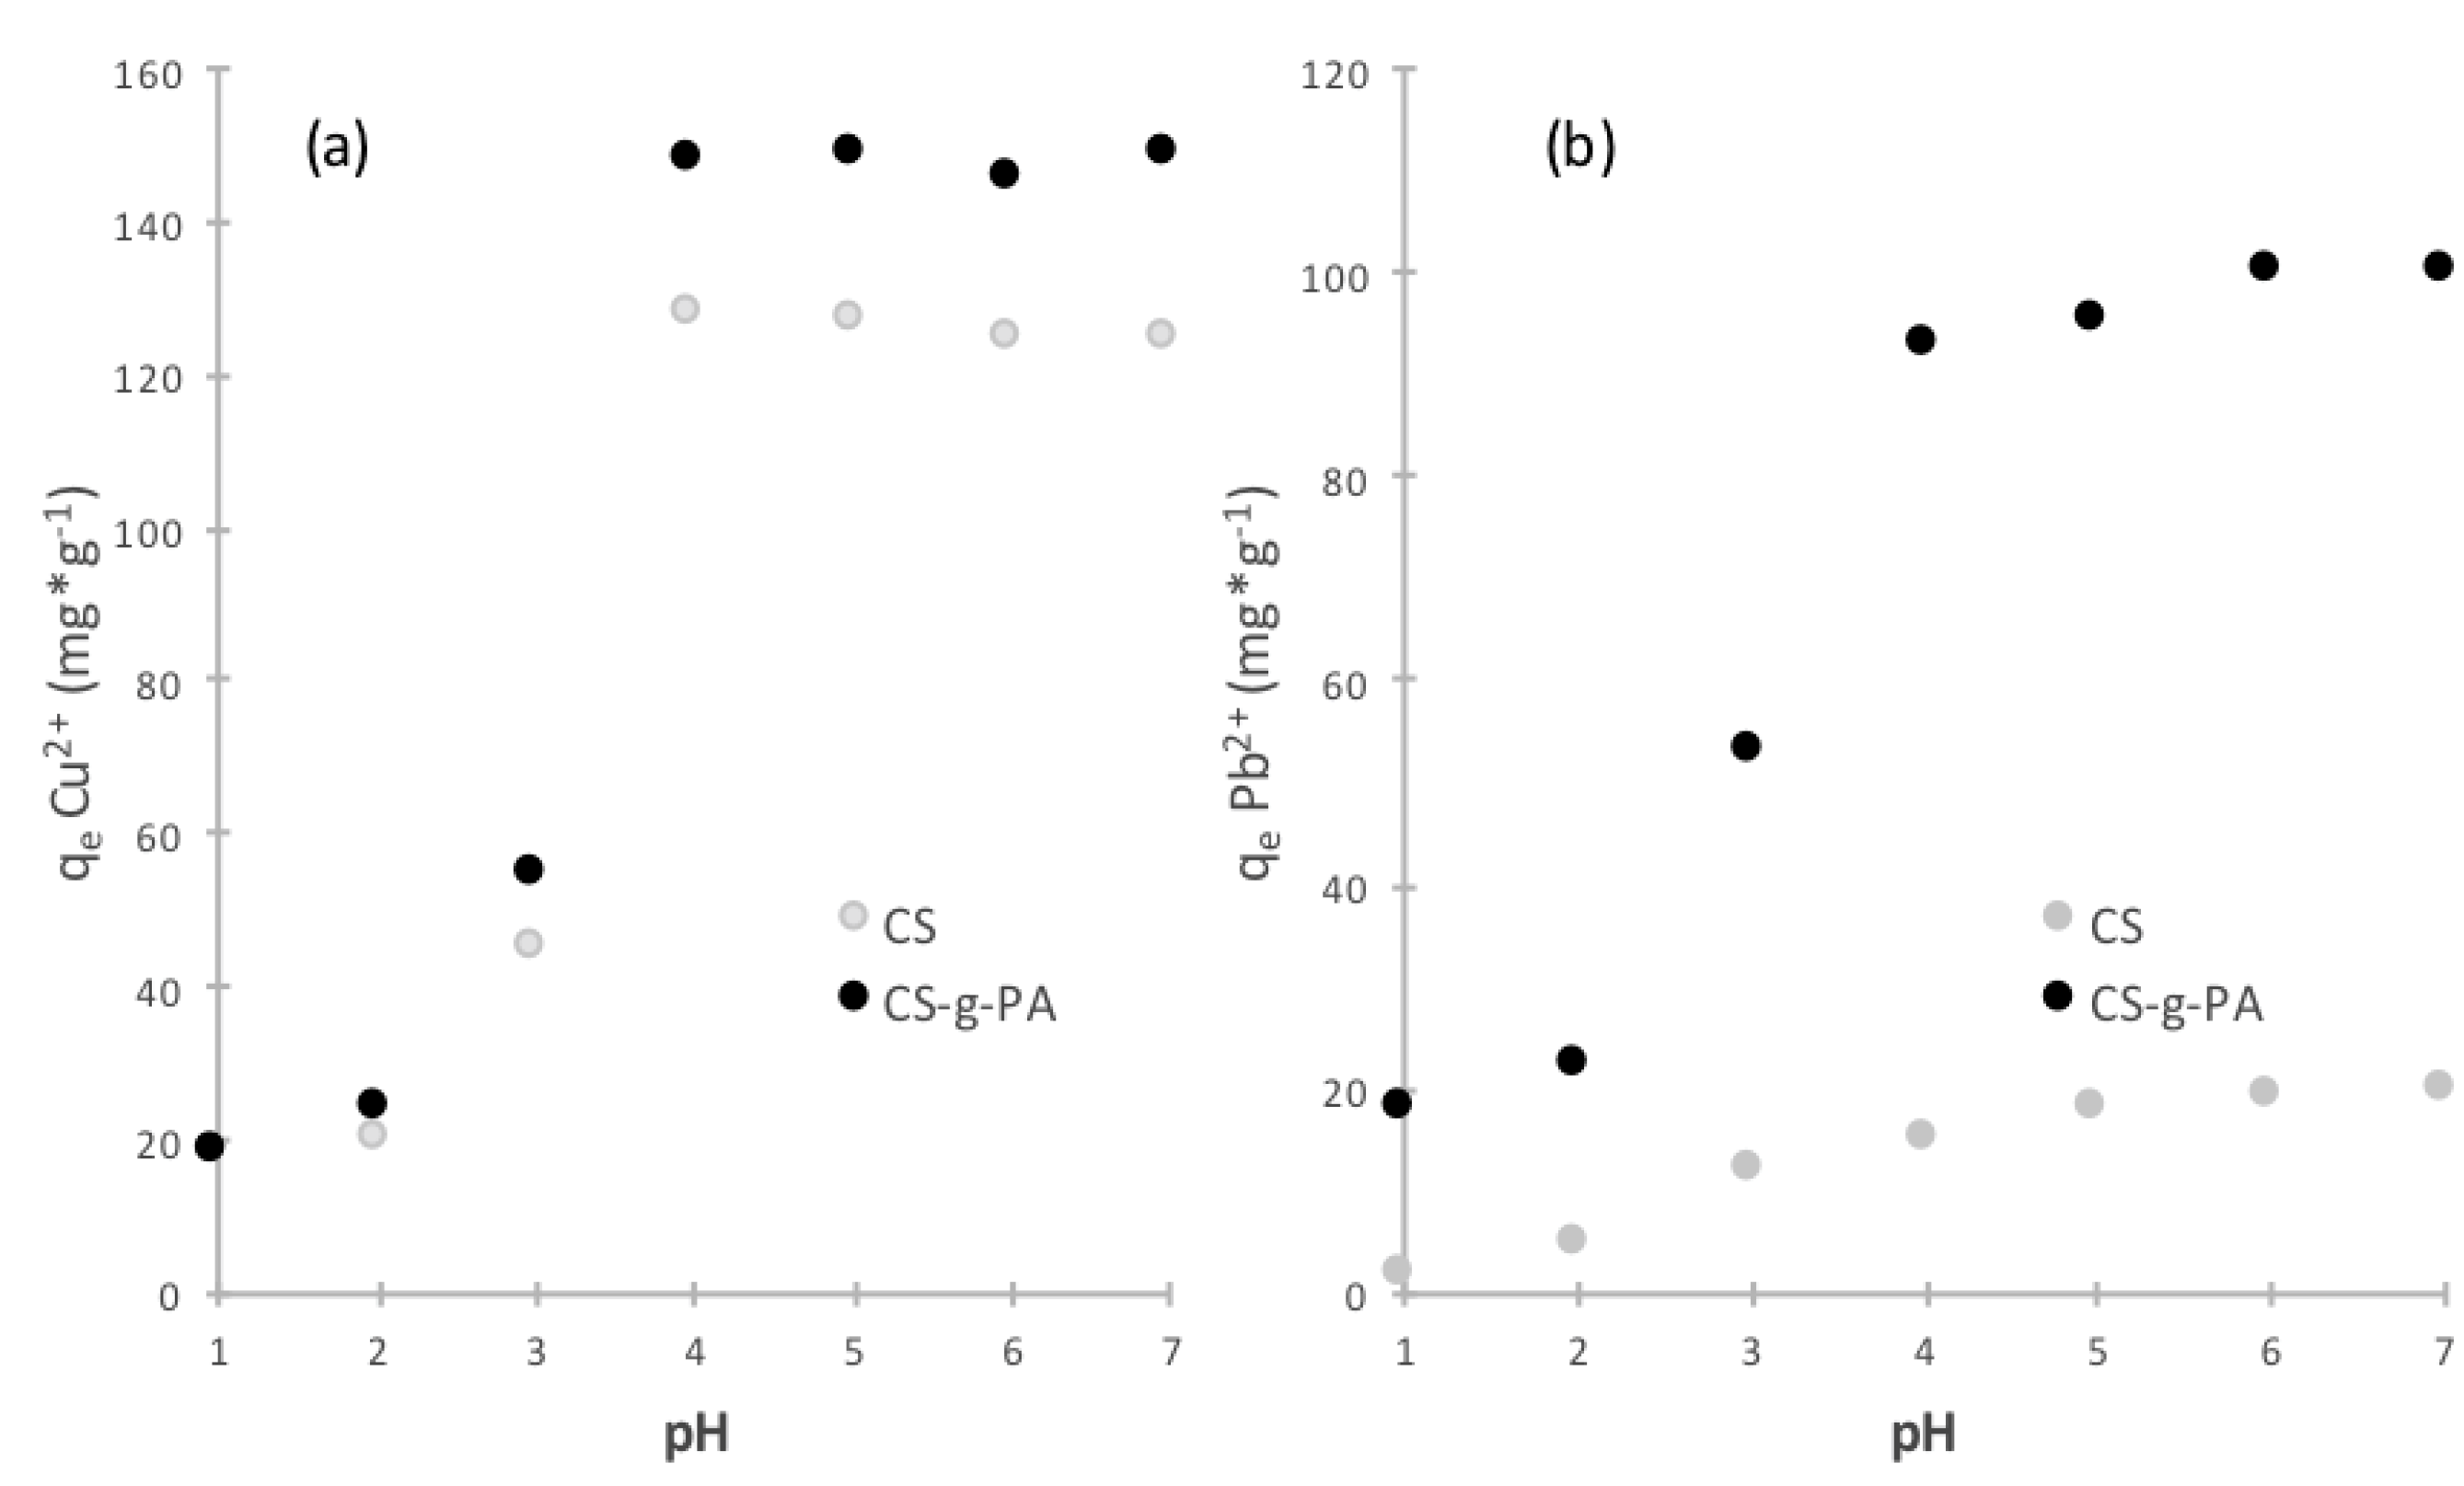
2.3. Initial pH Effect on Adsorption Process

The amount of ions adsorbed on adsorbent’s surface is normally described by the following mass balance equation:
q t i   = i = 1 n ( C t i 1 C t i ) V t i 1 m  
where C t i 1   is the initial concentration of the ion, C t i   is the concentration of the ion at time t, V t i 1   is the initial volume of the solution and m is the mass of the adsorbent. We studied the adsorption capacity (Figure 3) as a function of pH of lead and copper using chitosan (CS) and chitosan grafted-poly acrylic acid (CS-g-PA) prepared by SI-ATRP. Figure 3 illustrates two important aspects: first, an increase in the initial pH of the solution increases the maximum adsorption capacity for both, CS and CS-g-PA; however, adsorption capacity is much higher CS-g-PA than for CS. From pH 1 to 2, CS-g-PA had a slightly greater adsorption, possibly because the chitosan is unstable and tends to solubilize and the acrylate groups are protonated, exhibiting inefficiency to form complexes with ions. However, with the increase of the pH from 4.0–7.0, a dramatic increase occurs in the adsorption capacity of copper ions of CS and CS-g-PA, from 45.72 to 127.65 and 53.06 mg/g to 147.65 mg/g, while for the lead, an increase from 10.56 to 13.24 and 53.06 to 93.04 occurred. Above pH 4.0 it becomes apparent that more carboxylate groups are ionized resulting in an increase in the affinity for cations by electrostatic interactions [35].
Different reports have suggested that the mechanism for lead and copper complexation by chitosan/PVA and chitosan/cellulose hydrogels could be the result of a combination of chemical complexation, ion-exchange, and non-specific electrostatic interaction, depending on the solution pH [36]. Furthermore, several authors have reported that chitosan and chitosan beads have positive z potentials in acidic solutions and negative z potentials in basic solutions, with a point of zero z potential at about pH 6.6 close to the pKa values of 6.3–6.7 for the amino group in chitosan reported [37,38]. Hence, the z potentials of CS and CS-g-PA result from the protonation/deprotonation of the amine groups on the chitosan [39]. For the other side, it may be expected that lead and copper ion adsorptions on both CS and CS-g-PA can be enhanced with the increase of solution pH values, but CS-g-PA would show better adsorption performance for lead and copper ions than CS, due to the more attractive electrostatic interactions between CS-g-PA and the metal ions [40].

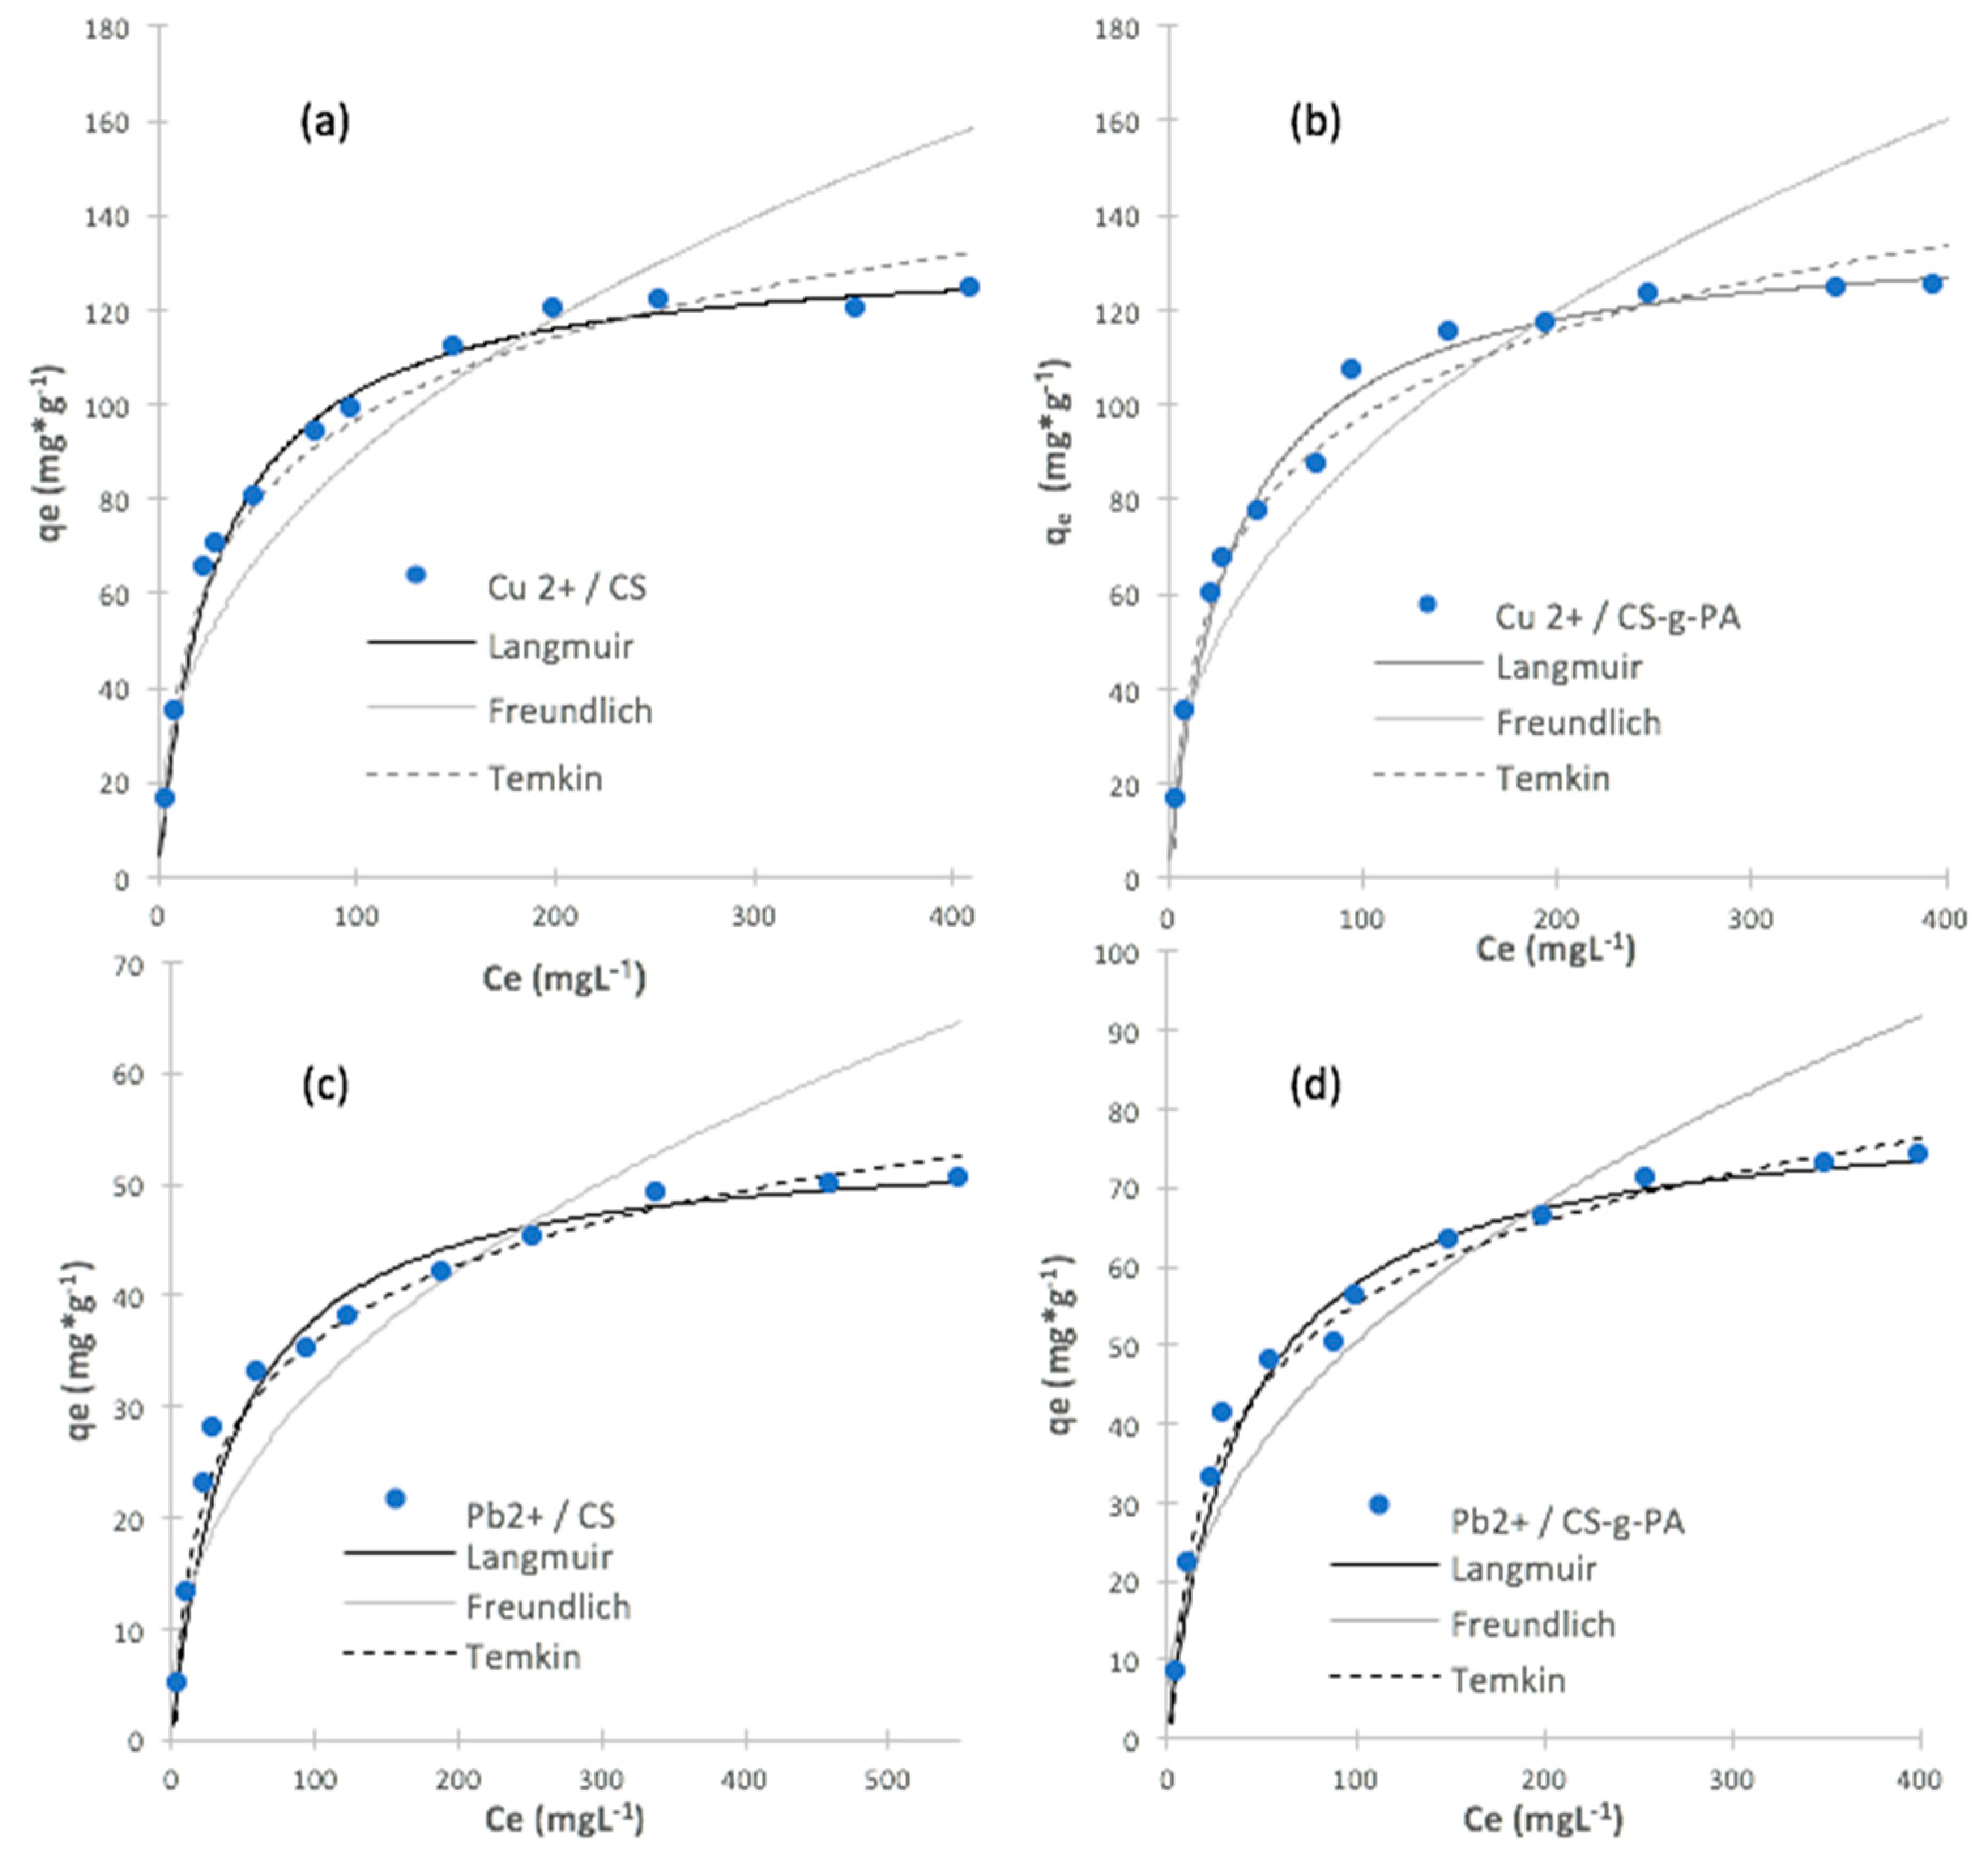
2.4. Adsorption Isotherms

Adsorption isotherms describe how the species in solution interact with the adsorbent and also the maximum sorption capacity of the chemical species in solution. Different sorption models are used to fit the experimental data. In this study, Langmuir, Freundlich and Temkin isotherms were employed to describe the lead and copper adsorption equilibrium. In the Langmuir isotherm model, the adsorption process is considered that the adsorbent surface can be covered uniformly with a monolayer of adsorbate; this model assumes a surface with homogeneous binding sites, equivalent sorption energies, and no interactions between adsorbed species; the isotherm is expressed by Equation (2) [41]:
  q e = q m K L C e   1 + K L C e  
where Ce is the equilibrium concentration of the adsorbate, qe is the equilibrium amount of adsorbate per gram of absorbent and qm is the maximum amount of adsorbate per gram of absorbent; KL is the Langmuir constant (represents kinetic coefficients of adsorption and desorption); KL is related to the adsorption rate. On the other hand, Freundlich isotherm is an empirical model that describes the process as a multilayer absorption, where the isotherm is expressed by Equation (3):
  q e = k F C e 1 n    
where kF is the Freundlich constant (an indicator of adsorption capacity, the greater the maximum capacity, the greater is k value); furthermore, the ratio 1/n is a measure of the intensity of the adsorption [42]. The n and kF values are empirical constants and they are specific to the system adsorbent/adsorbate.
The Temkin isotherm fits the follow mathematic expression:
  q e = R T   b ln ( A C e )  
where Ce is the equilibrium concentration of the adsorbate, qe is the equilibrium amount of adsorbate per gram of absorbent; A is the Temkin isotherm constant and b is the Temkin related to the heat of adsorption; T is the absolute temperature, R is the gas constant. The Temkin isotherm assumes that the heat of adsorption of all molecules would decrease linearly rather than logarithmic with coverage by ignoring extremely low and very high values of concentration and besides, it assumes a uniform distribution of bounding energy up to some maximum bonding energy [43,44].
Figure 4 shows the sorption equilibrium of lead and copper ions on CS and CS-g-PA surfaces. Fitting results are shown for the three theoretical adsorption models, and Table 2 lists the fitting parameters for the three models (information about the Freundlich and Temkin models can be found in the Supporting Information).
Although the correlation coefficient (R2) is commonly used for determination of the best isotherm fit, this indicator is limited to solving isotherm models that present linear plots. We used the average relative error (ARE) function to determine the isotherm model most suitable for representing the experimental data; this error function attempts to minimize the fractional error distribution across the entire concentration range, ARE function is described by [45,46,47]:
  A R E = 100   n i = 1 n | q e , c a l q e , m e a s | q e , m e a s  
where, qe,cal is the calculated value, qe,meas is measured value and n is the number of data points. This model to error analyses were applied by other authors in order to verify which model presented better isotherm adjustment for chitosan and rice husk ash dye adsorptions [46,47]. Figure 4 and Table 2 show that for both metal ions, the Langmuir model fits the experimental results better the than the Freundlich and Temkin models, (largest R2 and fewer ARE values); furthermore, Figure 4 shows that the maximum Pb2+ adsorption capacity (qm) increased from qm = 54 mg/g to 81 mg/g after the grafting process. For Cu2+, adsorption capacity (qm) showed a little improvement from qm = 133 mg/g to 136 mg/g, after the grafting process. Our results indicate the grafting process improves the maximum capacity for Pb2+ and Cu2+ ions (additional information can be found in supporting information).
These results indicate that the surface of the adsorbent is quite uniform with many equivalent sorption sites, as a result of the grafting process. It is possible that the sorption process occurs through the same mechanism with a monolayer formed through the surface of adsorbate without deposited molecules upon others already adsorbed. For both metal, adsorption increased proportionally with concentration, suggesting that the active sites of the adsorbent where available for the ions present in the solution, but after a concentration of 200 ppm (for copper) and 300 ppm (for lead), the adsorption value becomes constant, because of the saturation of the active sites of the adsorbent. The adsorption on CS-g-PA surface in both cases was higher than CS, indicating that acrylate grafting on chitosan surface improved ion adsorption capacity as compare to chitosan without modifications. From the results, it is possible to observe that in the adsorption of Pb2+ and Cu2+, the adsorption capacity of CS-g-PA is higher compared to CS. However, for the Cu2+ species, the effect could be much more limited in the CS-g-PA compared with the unmodified CS, because the nitrogens of the −NH2 groups, could have a greater affinity for the SO42− groups, a greater charge and bond compensation, generating complexes between several copper ions and a greater capacity of aggregation, compared with the modified chitosan, which does not have much nitrogen available after the modification. On the other hand, carboxylate groups at higher pH do not have too much affinity compared to the previous case. Another possible explanation, could be that in the case of Pb2+ the compound that forms at high pH, which is Pb(OH)2, is insoluble at pH higher than 8, while in the case of copper, the compound Cu(OH)2 begins becomes very insoluble at a pH greater than 6, affecting its adsorption capacity because an increased repulsion with the carboxylate groups [48,49].
Table 1 shows that some adsorbents, such as activated carbon and chitosan, have been used for the removal of Pb(II) and Cu(II) with removal efficiencies of up to 85%, at pH 6.0 and 4.5, respectively, exhibiting an economic, fast and efficient method for the recovery of metals, after the treatment [14,15,16]. On the other hand, different sources from biomass (i.e., wheat bran) have been used to removal of Cu(II), with a removal qm ranging from 17.4 mg·g−1 to 51.5 mg·g−1, depending whether they are dehydrated or not [50,51]. Fruit peels such as orange (qm = 50.94 mg·g−1; [52]) and mango (qm = 46.09 mg·g−1; [53]) and tea tree residues (qm = 8.64 mg·g−1; [54]), biomass sources from microorganisms have also been used such as: (a) the bacterium Pseudomonas putida (qm = 89.60 mg·g−1; [55]); (b) Streptomyces coelicolor (qm = 66.7 mg·g−1; [56]); (c) fungi as Aspergillus niger (qm = 26 mg·g−1; [57]); (d) algae as Sargassum sp. (qm = 87.1 mg·g−1; [58]) and Spyrogyra (qm = 133.3 mg·g−1, [59]). In our study, for CS the qm = 133 mg·g−1 and for the CS-g-PA it was qm = 136 mg·g−1, respectively, demonstrating that CS and CS-g-PA are suitable for copper removal.
For the removal of Pb (II) different adsorbents from biomass have been reported, such as: (a) wheat (qm = 87.0 mg·g−1; [60]); (b) rice husk ash (qm = 91.74 mg·g−1; [61]); (c) banana peel (qm = 2.18 mg·g−1; [62]); (d) microbial biomass from bacteria, such as Pseudomonas putida (qm = 270.4 mg·g−1; [63]); (e) Streptomyces rimosus, (qm = 135 mg·g−1; [64]); (f) fungi, such as Sacharomyces cerevisiae from beer production residues, (qm = 15.4 mg·g−1, [65]); (g) Penicillium chrysogenum (qm = 55 mg·g−1; [66]); (h) Penicillium oxalycum, from fermentation industry residues (qm = 47.4 mg·g−1; [67]); (i) algae such as Sargassum sp. (qm = 266 mg·g−1; [68]) and Spirogyra (qm = 140 mg·g−1; [69]). I our study, the CS had qm = 54 mg·g−1 and the CS-g-PA had qm = 80.6 mg·g−1, proving to be comparable or superior to many other systems used for this purpose.
All these results confirm the importance of the grafting reaction on the chitosan surface for improvement of the maximum adsorption capacity and the rate of the adsorption process, shaping as a potential useful adsorbent to removal Pb2+ and Cu2+ ions.

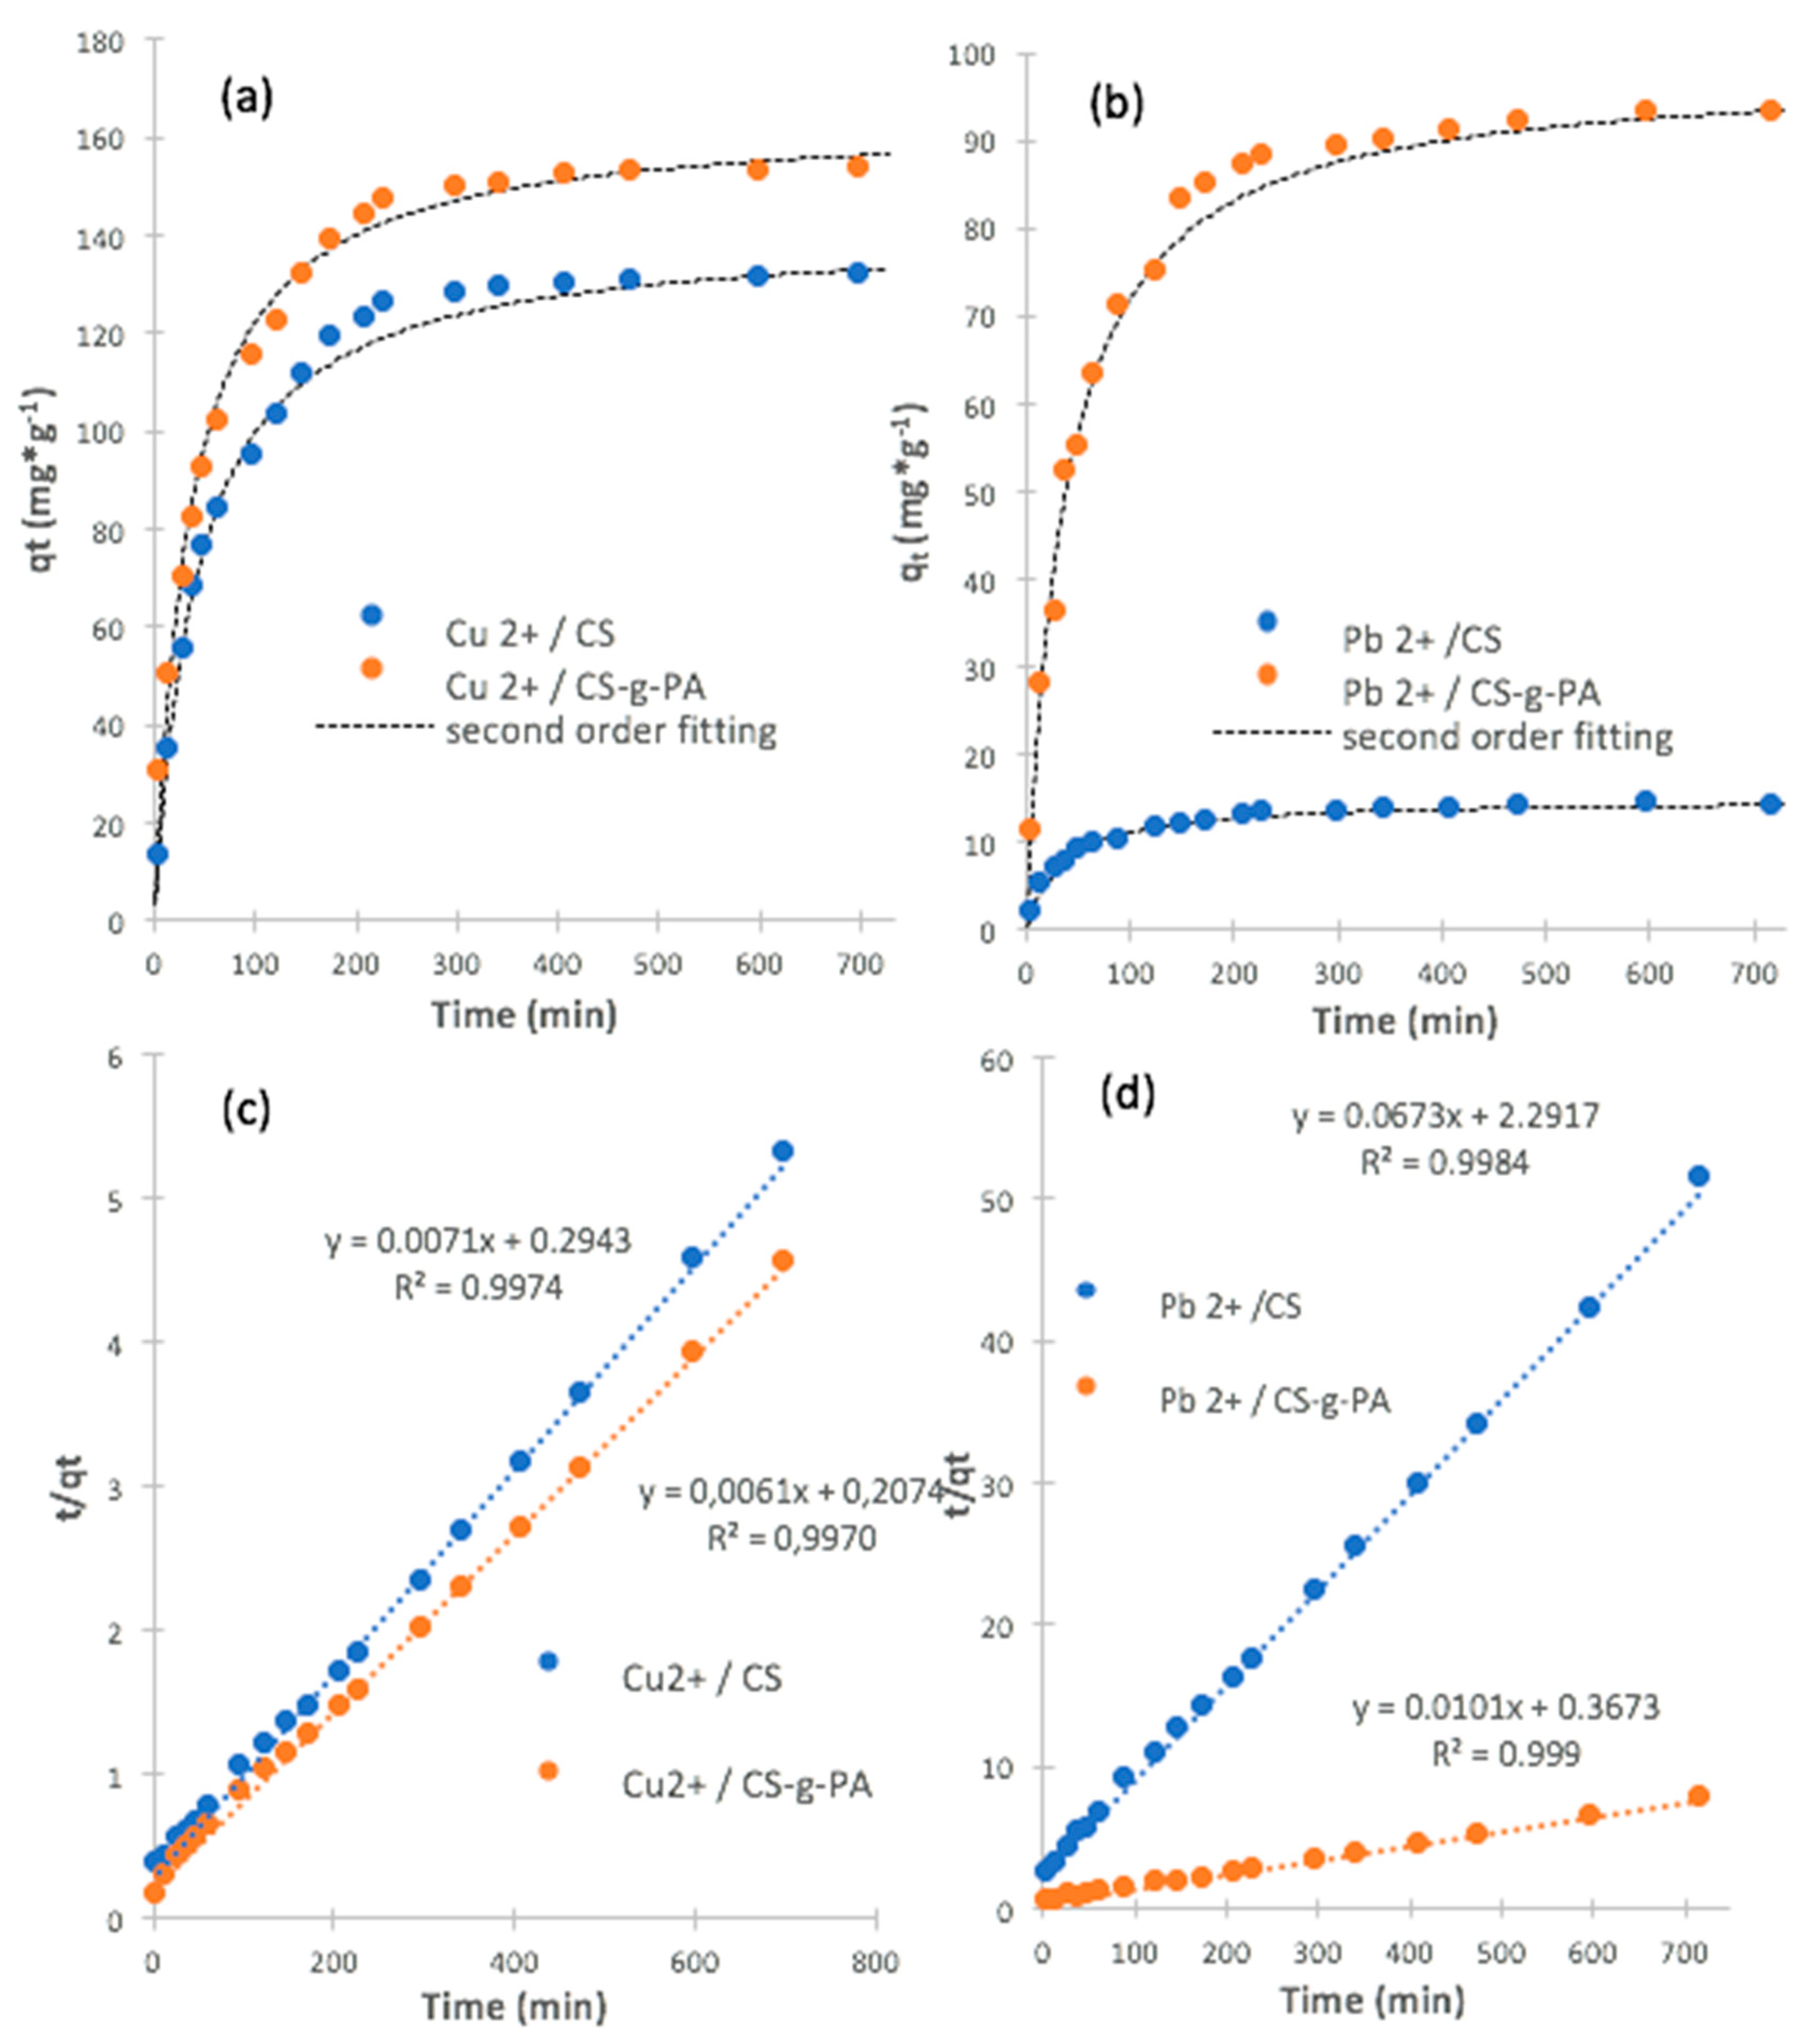
2.5. Adsorption Kinetics for Copper and Lead Ions

The study of adsorption kinetics is important to provide some information about the rate and mechanism of adsorption [70]. Figure 5 shows the variation in the adsorbed ions amount (qt) as a function of time. The rate of adsorption, for both ions, is high at initial times of adsorption. For both metals, most of the adsorption takes place within the first 100 min, using CS or CS-g-PA; however, after this time, we obtained near of 97% of the maximum adsorption. The sorption process is dependent on the sorbent characteristics such as the number of functional groups, porosity and amount of available sorption sites [71]. The pseudo-second order model is used to study the adsorption data; this model follows Equation (6) [72]:
  t q t     = 1 k 2 q e 2 + t q e
where qt (mg/g) is the adsorption amount at time t (min), k2 (g/mg·min) is the rate constant of the pseudo-second-order kinetic adsorption. The values of k2 and qe are obtained from the intercept and regression coefficient of the experimental t/qt versus t data; Figure 5 shows pseudo-second model fitting and Table 3 lists kinetic parameters obtained from the fitting. Kinetic results revealed that the pseudo-second-order model has a suitable agreement with the experimental data. In this model, the rate-limiting step is the surface adsorption that involves chemisorption, where the removal from a solution is due to physicochemical interactions between the two phases [72,73]. Adsorption of Cu2+ on CS and CS-g-PA did not show appreciable differences in k2, however, qe was higher for CS-g-PA than CS. This result suggests that the grafting process increased chitosan surface affinity to Cu2+ ion. For Pb2+ removal, again qe was higher for CS-g-PA than CS. In this case, the qe was 6.6 times higher for CS-g-PA than CS. However, k2 was 7 times higher for CS than for CS-g-PA; it is well known that the chelation process of cationic ions on aminated surfaces is much lower rate than complexation with carboxylic group-bearing surfaces, which is mainly an electrostatic interaction process; despite k2 reduces for CS-g-PA adsorbent, final amount of Pb2+ removal increased in a factor of 6, which indicates that the process is slower than CS, but CS-g-PA removes six times more Pb2+.
Lead and copper ions are known to exist in different forms in aqueous solutions at different pH values. At pH values below 6, Pb2+ is the major species, and with the increase of pH from 6 to 9, PbOH+ and Pb(OH)2 dominate [74]. Hence, by increasing pH over 6.0, the adsorption of lead and copper ions on chitosan may be enhanced, due to the attractive electrostatic interaction between chitosan and lead or lead hydroxide species. However, lead and copper attachment to chitosan can be reduced at pH lower than 6.0, as a consequence of repulsive electrostatic interactions. This phenomenon can be attributed at higher pH, to the presence of Pb2+ and Cu2+ hydroxide species (PbOH+, Pb(OH)2 and Cu(OH)2, respectively, which diffuse at a slower rate from the bulk of the solution to the surface of chitosan and requires a larger surface area for their attachment because of their larger size [49]. The carboxyl groups grafted from PA on CS-g-PA causes that adsorbent have greater negative zeta potentials, and therefore, CS-g-PA became more effective than CS for lead and copper ion adsorption during the equilibrium. However, the presence of –COOH groups cause that the diffusion of Pb2+ and PbOH+ to be slower than in the pristine chitosan, especially at higher pH (from 6.0), furthermore, also increase sites available for the ions attachment, a process that could be easier and faster for pristine chitosan and Pb2+; finally, at higher pH values lead and copper is removed from the solution by precipitation in form of Pb(OH)2 and Cu(OH)2.

3. Experimental

3.1. Materials

Chemical reagents were purchased from Aldrich (Palo Alto, CA, USA) and used without further purification unless otherwise stated. Chitosan was purchased from KOYO Chemical Co. (Osaka, Japan), Mw = 233 KDa, Mn = 105 KDa, PDI = 2.2, determined by GPC). Silicon substrates (silica wafers: SiO2 layers of 200 nm, doped with boron; face 100, p-type) were purchased from World KST Co. (Fukui, Japan), and were cut in the size convenient (typically 4 cm2) immersed in a mixture of sulfuric acid and hydrogen peroxide [piranha solution (3:1)] for a 10-min washing and then washed with deionized water (18.2 milliohms cm). 2-bromoisobutyryl bromide (2-BIB, 97%) was obtained from Alfa Aesar (Haverhill, MA, USA). CuBr, CuBr2, N,N,N′,N″,N″-pentamethyldiethylenetriamine (PMDETA), and triethylamine (99.5%) were purchased from Sigma-Aldrich (Palo Alto, CA, USA) and used as received. The standard solutions of Lead (II) and copper (II) of 1000 mg/L were purchased from Merck (Kenilworth, NJ, USA). Other chemicals were purchased from Sigma-Aldrich and used as received.

3.2. Synthesis

The ATRP initiator was grafted on the surface of chitosan (Scheme 1) using a modified reported procedure [75]: Five g of chitosan (deacetylation degree of 85%, medium molecular weight, Sigma-Aldrich) were added to a schlenk tube containing a solution of 25 mL of Tetrahydrofuran anhydrous (Sigma-Aldrich,) and 0.5 mL of triethylamine (99%, Aldrich). The tube was immersed in an ice bath and sealed using a septum. The content was gently stirred using a magnetic bar and purged with N2 during 30 min after what, 0.5 mL of 2-bromoisobutyryl bromide (2-BIB) (Sigma-Aldrich) was added under nitrogen dropwise placed in an ice bath. The reaction was removed from the ice bath and allowed to warm to room temperature and react overnight. Chitosan grafted BIB (CS-g-BIB) was filtered and washed extensively with THF, methanol and deionized water (DI), and allowed to dry in a vacuum oven at 40 °C for 48 h. 0.5 g of CS-g-BIB was carefully added to another schlenk tube with 21.51 mg (150 μmol) of CuBr (Sigma-Aldrich) and 3.35 mg (15 μmol) of CuBr2 (Sigma-Aldrich), sealed with a septum and flushed with N2 for 40 min. In a second Schlenk tube, 1.0 g (10.63 mmol) of sodium acrylate (Sigma-Aldrich) was added to a mixture of 111 μL (0.530 mmol) of N,N,N′,N″,N″-pentamethyldiethylenetriamine (PMDETA) and 17.5 mL of DI/methanol (1:1). The contents were gently stirred and degassed with nitrogen for 40 min and transferred using a cannula to the first tube. The polymerization proceeded for 24 h. CS-g-PA was washed with DI water in an ultrasonic bath, centrifuged and dried after water discard. The resultant chitosan was washed with large amounts of deionized water and followed was immersed in an acidic solution (0.1 M HCl) to remove any physically adsorbed reactant and to protonate the acrylic acid groups (ion exchange between Na+ to H+). Finally, the CS-g-PA obtained was dried in a vacuum oven at 40 °C for 48 h and stored in a desiccator for subsequent use [31].

3.3. Characterization

FT-IR spectra was analyzed with an Affinity FTIR spectrophotometer (Shimadzu, Columbia, MD, USA) equipped with a HgCdTe detector from 400 to 4000 cm−1, the percentage composition of chitosan was obtained with a FlashEA 1112 Series elemental analyzer (Thermo Electron, Waltham, MA, USA) Surface chitosan analysis, was performed using X-ray photoelectron spectroscopy, on a 5700 instrument (Physical Electronics, Chanhassen, MN, USA) using photoelectrons generated by the non-monochromatic Al KR irradiation (1486.6 eV). Photoelectrons were collected at a takeoff angle of 45° using a hemispherical analyzer operated in the fixed retard ratio mode with an energy resolution setting of 11.75 eV. The binding energy scale was calibrated prior to analysis using the Cu 2p3/2 and Ag 3d5/2 lines. Charge neutralization was ensured through bombardment of the irradiated area with an electron beam and the use of the non-monochromatic Al KR source. This placed the adventitious C 1s peak at a binding energy of 284.6 ± 0.2 eV.

3.4. Adsorption Assay

The study of initial pH effect on adsorption experiments were carried out by using 25 mg of the adsorbent (CS or CS-g-PA) in 50 mL of the initial metal solution at different pH (between 1.0–4.0) using an initial concentration of the metal of 200 ppm for 24 h at 25 °C under stirring. After the pH study, the adsorption experiments were carried out by using 25 mg of the adsorbent in 50 mL of the initial metal solution; for 24 h at 25 °C, at pH 4.0 under stirring; the solution concentrations were 100, 200, 300, 400 and 500 ppm; adsorption tests were carried out in duplicate. Metal concentration was determined by atomic absorption spectrophotometry for using calibration curves; Atomic absorption measurements were performed on a 200 Analyst system (Perkin Elmer, Waltham, MA, USA) using the flame method to determining the concentration of metal ion remaining in solution. NIST Lead and Copper standards (lead nitrate, Pb(NO3)2 and copper(II) sulfate, CuSO4 analytical grade were used to prepare calibration curves, with 1000 mg/L as stock solution and dilutions with concentrations of 1.0037, 1.9975, 3.0012, 3.995 and 4.9987 ppm, for copper and 1.000, 2.000, 3.000, 4.000 and 5.000 ppm for lead, with hollow cathode lamps at 324 nm for copper and 217 nm for lead determination. Finally, the studies of metal adsorption kinetics were carried out using at pH 4.0 for using 200 ppm as the initial concentration of the metal ion at a temperature of 25 °C and 25 mg of adsorbent under stirring.

4. Conclusions

In this work, we studied the implementation of chitosan grafted-polyacrylic acid as an absorbent to remove lead and copper from water. The kinetic experiments showed that CS-g-PA system had higher adsorption capacity for both metal ions and data were described by the pseudo-second-order kinetic model according to the R values. The maximum adsorption capacities obtained from the kinetic model were close to those from the Langmuir fitting model, except for lead CS adsorption, confirming chemical interactions between adsorbate and adsorbent species. We determined that a pH of 4.0 was the best pH for all the experiments according to the results. For the isotherm experiments, the Langmuir model was the best model describing the adsorption equilibrium process according to the linear regression and ARE values. The maximum adsorption capacity for Pb2+ ions was 98 mg·g−1 and for Cu2+ was 164 mg·g−1 over CS-g-PA. Finally, the results of this study confirm that chitosan-grafted polyacrylic acid can be used as a potential adsorbent to remove Pb2+ and Cu2+ ions from wastewaters, with reasonable amounts of adsorbent and consuming short periods of time.

Supplementary Materials

The following are available online, Table S1: Theoretical Isothermal fitting experimental results.

Author Contributions

Conceptualization, C.D.G.-T. and F.Z.; Formal analysis, C.D.G.-T., W.V., Methodology, C.D.G.-T., F.Z.; Software, C.D.G.-T., W.V.; Validation, C.D.G.-T.; Formal Analysis, C.D.G.-T., W.V., F.Z.; Investigation, C.D.G.-T.; Resources, C.D.G.-T., F.Z.; Writing-Original Draft Preparation, C.D.G.-T., W.V., F.Z.; Writing-Review & Editing, C.D.G.-T., W.V., F.Z.; Visualization, C.D.G.-T., W.V.

Funding

This research received no external funding

Conflicts of Interest

The authors declare no conflict of interest.

References

  1. Lee, C.-G.; Jeon, J.-W.; Hwang, M.-J.; Ahn, K.-H.; Park, C.; Choi, J.-W.; Lee, S.-H. Lead and copper removal from aqueous solutions using carbon foam derived from phenol resin. Chemosphere 2015, 130, 59–65. [Google Scholar] [CrossRef] [PubMed]
  2. Environmental Protection Agency (EPA). Use of Lead Free Pipes, Fittings, Fixtures, Solder and Flux for Drinking Water; Extension of Comment Period; Environmental Protection Agency: Washington, WA, USA, 2017. [Google Scholar]
  3. Saleh, T.A.; Gupta, V.K. Column with CNT/magnesium oxide composite for lead(II) removal from water. Environ. Sci. Pollut. Res. 2012, 19, 1224–1228. [Google Scholar] [CrossRef] [PubMed]
  4. Xiao, B.; Thomas, K.M. Competitive Adsorption of Aqueous Metal Ions on an Oxidized Nanoporous Activated Carbon. Langmuir 2004, 20, 4566–4578. [Google Scholar] [CrossRef] [PubMed]
  5. Demiral, H.; Güngör, C. Adsorption of copper(II) from aqueous solutions on activated carbon prepared from grape bagasse. J. Clean. Prod. 2016, 124, 103–113. [Google Scholar] [CrossRef]
  6. World Health Organization (WHO). Copper in Drinking-Water Background Document for Development of WHO Guidelines for Drinking-Water Quality; World Health Organization: Geneva, Switzerland, 2004. [Google Scholar]
  7. Hua, M.; Zhang, S.; Pan, B.; Zhang, W.; Lv, L.; Zhang, Q. Heavy metal removal from water/wastewater by nanosized metal oxides: A review. J. Hazard. Mater. 2012, 211–212, 317–331. [Google Scholar] [CrossRef] [PubMed]
  8. Karami, H. Heavy metal removal from water by magnetite nanorods. Chem. Eng. J. 2013, 219, 209–216. [Google Scholar] [CrossRef]
  9. Fu, F.; Wang, Q. Removal of heavy metal ions from wastewaters: A review. J. Environ. Manag. 2011, 92, 407–418. [Google Scholar] [CrossRef] [PubMed]
  10. Ku, Y.; Jung, I.L. Photocatalytic reduction of Cr(VI) in aqueous solutions by UV irradiation with the presence of titanium dioxide. Water Res. 2001, 35, 135–142. [Google Scholar] [CrossRef]
  11. Alvarez, M.T.; Crespo, C.; Mattiasson, B. Precipitation of Zn(II), Cu(II) and Pb(II) at bench-scale using biogenic hydrogen sulfide from the utilization of volatile fatty acids. Chemosphere 2007, 66, 1677–1683. [Google Scholar] [CrossRef] [PubMed]
  12. Lv, L.; Wu, J.; Zhang, W.; Li, H.; Hen, Y.C.; Pan, B. Selective Removal of Cu(II) Ions by Using Cation-exchange Resin-Supported Polyethyleneimine (PEI) Nanoclusters. Environ. Sci. Technol. 2010, 44, 3508–3513. [Google Scholar] [CrossRef]
  13. Dermentzis, K.; Davidis, A.; Papadopoulou, D.; Christoforidis, A.; Ouzounis, K. Copper removal from industrial wastewaters by means of electrostatic shielding driven electrodeionization. J. Eng. Sci. Technol. Rev. 2009, 2, 131–136. [Google Scholar] [CrossRef]
  14. Mouni, L.; Merabet, D.; Bouzaza, A.; Belkhiri, L. Adsorption of Pb(II) from aqueous solutions using activated carbon developed from Apricot stone. Desalination 2011, 276, 148–153. [Google Scholar] [CrossRef]
  15. Ngah, W.S.W.; Fatinathan, S. Pb(II) biosorption using chitosan and chitosan derivatives beads: Equilibrium, ion exchange and mechanism studies. J. Environ. Sci. 2010, 22, 338–346. [Google Scholar] [CrossRef]
  16. Ngah, W.S.W.; Fatinathan, S. Adsorption of Cu(II) ions in aqueous solution using chitosan beads, chitosan-GLA beads and chitosan-alginate beads. Chem. Eng. J. 2008, 143, 62–72. [Google Scholar] [CrossRef]
  17. Kumar Gupta, V.; Nayak, A.; Agarwal, S. Bioadsorbents for remediation of heavy metals: Current status and their future prospects. Environ. Eng. Res. 2015, 20, 1–18. [Google Scholar] [CrossRef]
  18. Elieh-Ali-Komi, D.; Hamblin, M.R. Chitin and Chitosan: Production and Application of Versatile Biomedical Nanomaterials HHS Public Access. Int. J. Adv. Res. 2016, 4, 411–427. [Google Scholar]
  19. Zhang, L.; Zeng, Y.; Cheng, Z. Removal of heavy metal ions using chitosan and modified chitosan: A review. J. Mol. Liq. 2016, 214, 175–191. [Google Scholar] [CrossRef]
  20. Aliabadi, M.; Irani, M.; Ismaeili, J.; Najafzadeh, S. Design and evaluation of chitosan/hydroxyapatite composite nanofiber membrane for the removal of heavy metal ions from aqueous solution. J. Taiwan Inst. Chem. Eng. 2014, 45, 518–526. [Google Scholar] [CrossRef]
  21. Karthik, R.; Meenakshi, S. Synthesis, characterization and Cr(VI) uptake study of polyaniline coated chitin. Int. J. Biol. Macromol. 2015, 72, 235–242. [Google Scholar] [CrossRef] [PubMed]
  22. Maleki, A.; Pajootan, E.; Hayati, B. Ethyl acrylate grafted chitosan for heavy metal removal from wastewater: Equilibrium, kinetic and thermodynamic studies. J. Taiwan Inst. Chem. Eng. 2015, 51, 127–134. [Google Scholar] [CrossRef]
  23. Laus, R.; Tadeu De Fávere, V. Competitive adsorption of Cu(II) and Cd(II) ions by chitosan crosslinked with epichlorohydrin-triphosphate. Bioresour. Technol. 2011, 102, 8769–8776. [Google Scholar] [CrossRef] [PubMed]
  24. Morales Futalan, C.; Kan, C.-C.; Lourdes Dalida, M.; Hsien, K.-J.; Pascua, C.; Wan, M.-W. Comparative and competitive adsorption of copper, lead, and nickel using chitosan immobilized on bentonite. Carbohydr. Polym. 2010, 83, 528–536. [Google Scholar] [CrossRef]
  25. Zoppe, J.O.; Ataman, N.C.; Mocny, P.; Wang, J.; Moraes, J.; Klok, H.-A. Surface-Initiated Controlled Radical Polymerization: State-of-the-Art, Opportunities, and Challenges in Surface and Interface Engineering with Polymer Brushes. Chem. Rev. 2017, 117, 1105–1318. [Google Scholar] [CrossRef] [PubMed]
  26. Park, D.; Yun, Y.-S.; Cho, H.Y.; Park, J.M. Chromium Biosorption by Thermally Treated Biomass of the Brown Seaweed, Ecklonia sp. Ind. Eng. Chem. Res. 2004, 43, 8226–8232. [Google Scholar] [CrossRef]
  27. Tugulu, S.; Barbey, R.; Harms, M.; Fricke, M.; Volkmer, D.; Rossi, A.A.; Klok, H.-A. Synthesis of Poly(methacrylic acid) Brushes via Surface-Initiated Atom Transfer Radical Polymerization of Sodium Methacrylate and Their Use as Substrates for the Mineralization of Calcium Carbonate. Macromolecules 2006, 40, 168–177. [Google Scholar] [CrossRef]
  28. Stephen, G.B.; Akgun, B.; William, J.B.; Foster, M.D. Synthesis, Characterization, and Properties of Polyelectrolyte Block Copolymer Brushes Prepared by Atom Transfer Radical Polymerization and Their Use in the Synthesis of Metal Nanoparticles. Macromolecules 2003, 36, 9539–9548. [Google Scholar] [CrossRef]
  29. Sheng, P.X.; Ting, Y.-P.; Chen, J.P.; Hong, L. Sorption of lead, copper, cadmium, zinc, and nickel by marine algal biomass: Characterization of biosorptive capacity and investigation of mechanisms. J. Colloid Interface Sci. 2004, 275, 131–141. [Google Scholar] [CrossRef] [PubMed]
  30. Colombani, O.; Ruppel, M.; Schubert, F.; Zettl, H.; Dmitry, V.P.; Axel, H.E.M. Synthesis of Poly(n-butyl acrylate)-block-poly(acrylic acid) Diblock Copolymers by ATRP and Their Micellization in Water. Macromolecules 2007, 40, 4338–4350. [Google Scholar] [CrossRef]
  31. Grande, C.D.; Alí, F.; Zuluaga, F. Síntesis de quitosano modificado con poli (ácido acrílico) vía polimerización por transferencia atómica iniciada desde la superficie (SIP-ATRP). Iberoam. Polím. 2010, 11, 505–519. [Google Scholar]
  32. Nalwa, H.S. Handbook of Organic Conductive Molecules and Polymers, 3rd ed.; John Wiley & Sons: New York, NY, USA, 1997; Volume 3, ISBN 9780471965954. [Google Scholar]
  33. Beamson, G.; Briggs, D. High resolution XPS of organic polymers: The Scienta ESCA 300 database. In Surface and Interface Analysis; Wiley-Blackwell: New York, NY, USA, 1992; ISBN 0471 935921. [Google Scholar]
  34. Save, M.; Granvorka, G.; Bernard, J.; Charleux, B.; Boissière, C.; Grosso, D.; Sanchez, C. Atom Transfer Radical Polymerization of Styrene and Methyl Methacrylate from Mesoporous Ordered Silica Particles. Macromol. Rapid Commun. 2006, 27, 393–398. [Google Scholar] [CrossRef]
  35. Wang, X.; Kim, Y.-G.; Drew, C.; Ku, B.-C.; Kumar, J.; Samuelson, L.A. Electrostatic Assembly of Conjugated Polymer Thin Layers on Electrospun Nanofibrous Membranes for Biosensors. Nano Lett. 2004, 4, 331–334. [Google Scholar] [CrossRef]
  36. Xu, C.; Wang, J.; Yang, T.; Chen, X.; Liu, X.; Ding, X. Adsorption of uranium by amidoximated chitosan-grafted polyacrylonitrile, using response surface methodology. Carbohydr. Polym. 2015, 121, 79–85. [Google Scholar] [CrossRef] [PubMed]
  37. Yan, W.L.; Bai, R. Adsorption of lead and humic acid on chitosan hydrogel beads. Water Res. 2005, 39, 688–698. [Google Scholar] [CrossRef] [PubMed]
  38. Claesson, P.M.; Ninham, B.W. pH-dependent interactions between adsorbed chitosan layers. Langmuir 1992, 8, 1406–1412. [Google Scholar] [CrossRef]
  39. Zhang, X.; Bai, R. Mechanisms and kinetics of humic acid adsorption onto chitosan-coated granules. J. Colloid Interface Sci. 2003, 264, 30–38. [Google Scholar] [CrossRef]
  40. And, N.L.; Bai, R. Highly Enhanced Adsorption of Lead Ions on Chitosan Granules Functionalized with Poly(acrylic acid). Ind. Eng. Chem. Res. 2006, 45, 7897–7904. [Google Scholar] [CrossRef]
  41. Langmuir, I. The Constitution and Fundamental Properties of Solids and Liquids. Part I. Solids. J. Am. Chem. Soc. 1916, 38, 2221–2295. [Google Scholar] [CrossRef]
  42. James, E.H. Principles of Chemical Kinetics, 2nd ed.; Academic Press: Suite 400, Burlington, MA, USA, 2007; ISBN 978-0-12-356787-1. [Google Scholar]
  43. Inyinbor, A.A.; Adekola, F.A.; Olatunji, G.A. Kinetics, isotherms and thermodynamic modeling of liquid phase adsorption of Rhodamine B dye onto Raphia hookerie fruit epicarp. Water Resour. Ind. 2016, 15, 14–27. [Google Scholar] [CrossRef]
  44. Saha, P.; Chowdhury, S.; Gupta, S.; Kumar, I. Insight into adsorption equilibrium, kinetics and thermodynamics of Malachite Green onto clayey soil of Indian origin. Chem. Eng. J. 2010, 165, 874–882. [Google Scholar] [CrossRef]
  45. Kapoor, A.; Yang, R.T. Surface diffusion on energetically heterogeneous surfaces. AIChE J. 1989, 35, 1735–1738. [Google Scholar] [CrossRef]
  46. Piccin, J.S.; Dotto, G.L.; Pinto, L.A.A. Adsorption Isotherms and Thermochemical data of FD&C RED N° 40 Binding by Qhitosan. Braz. J. Chem. Eng. 2011, 28, 295–304. [Google Scholar] [CrossRef]
  47. Wong, Y.C.; Szeto, Y.S.; Cheung, W.H.; Mckay, G. Adsorption of acid dyes on chitosan-equilibrium isotherm analyses. Process Biochem. 2004, 39, 693–702. [Google Scholar] [CrossRef]
  48. Darder, M.; Montserrat Colilla, A.; Ruiz-Hitzky, E. Biopolymer−Clay Nanocomposites Based on Chitosan Intercalated in Montmorillonite. Chem. Mater. 2003, 15, 3774–3780. [Google Scholar] [CrossRef]
  49. Wan, M.-W.; Kan, C.-C.; Rogel, B.D.; Lourdes, M.; Dalida, P. Adsorption of copper (II) and lead (II) ions from aqueous solution on chitosan-coated sand. Carbohydr. Polym. 2010, 80, 891–899. [Google Scholar] [CrossRef]
  50. Aydın, H.; Bulut, Y.; Yerlikaya, Ç. Removal of copper (II) from aqueous solution by adsorption onto low-cost adsorbents. J. Environ. Manag. 2008, 87, 37–45. [Google Scholar] [CrossRef] [PubMed]
  51. Özer, A.; Özer, D.; Özer, A. The adsorption of copper(II) ions on to dehydrated wheat bran (DWB): Determination of the equilibrium and thermodynamic parameters. Process Biochem. 2004, 39, 2183–2191. [Google Scholar] [CrossRef]
  52. Liang, S.; Guo, X.; Feng, N.; Tian, Q. Adsorption of Cu2+ and Cd2+ from aqueous solution by mercapto-acetic acid modified orange peel. Colloids Surf. B Biointerfaces 2009, 73, 10–14. [Google Scholar] [CrossRef] [PubMed]
  53. Iqbal, M.; Saeed, A.; Kalim, I. Characterization of Adsorptive Capacity and Investigation of Mechanism of Cu2+, Ni2+ and Zn2+ Adsorption on Mango Peel Waste from Constituted Metal Solution and Genuine Electroplating Effluent. Sep. Sci. Technol. 2009, 44, 3770–3791. [Google Scholar] [CrossRef]
  54. Çay, S.; Uyanık, A.; Özaşık, A. Single and binary component adsorption of copper(II) and cadmium(II) from aqueous solutions using tea-industry waste. Sep. Purif. Technol. 2004, 38, 273–280. [Google Scholar] [CrossRef]
  55. Zheng, G.H.; Wang, L.; Zhou, Q.; Li, F.T. Optimisation of cell surface and structural components for improving adsorption capacity of Pseudomonas putida 5-x to Cu2+. Int. J. Environ. Pollut. 2008, 34, 285. [Google Scholar] [CrossRef]
  56. Öztürk, A.; Artan, T.; Ayar, A. Biosorption of nickel(II) and copper(II) ions from aqueous solution by Streptomyces coelicolor A3(2). Colloids Surf. B Biointerfaces 2004, 34, 105–111. [Google Scholar] [CrossRef] [PubMed]
  57. Mukhopadhyay, M.; Noronha, S.B.; Suraishkumar, G.K. Kinetic modeling for the biosorption of copper by pretreated Aspergillus niger biomass. Bioresour. Technol. 2006. [Google Scholar] [CrossRef] [PubMed]
  58. Chen, J.P.; Yang, L. Chemical Modification of Sargassum sp. for Prevention of Organic Leaching and Enhancement of Uptake during Metal Biosorption. Ind. Eng. Chem. Res. 2005, 44, 9931–9942. [Google Scholar] [CrossRef]
  59. Gupta, V.K.; Rastogi, A.; Saini, V.K.; Jain, N. Biosorption of copper(II) from aqueous solutions by Spirogyra species. J. Colloid Interface Sci. 2006, 296, 59–63. [Google Scholar] [CrossRef] [PubMed]
  60. Bulut, Y.; Baysal, Z. Removal of Pb(II) from wastewater using wheat bran. J. Environ. Manag. 2006, 78, 107–113. [Google Scholar] [CrossRef] [PubMed]
  61. Naiya, T.K.; Bhattacharya, A.K.; Mandal, S.; Das, S.K. The sorption of lead(II) ions on rice husk ash. J. Hazard. Mater. 2009, 163, 1254–1264. [Google Scholar] [CrossRef] [PubMed]
  62. Anwar, J.; Shafique, U. Waheed-uz-Zaman; Salman, M.; Dar, A.; Anwar, S. Removal of Pb(II) and Cd(II) from water by adsorption on peels of banana. Bioresour. Technol. 2010, 101, 1752–1755. [Google Scholar] [CrossRef] [PubMed]
  63. Uslu, G.; Tanyol, M. Equilibrium and thermodynamic parameters of single and binary mixture biosorption of lead (II) and copper (II) ions onto Pseudomonas putida: Effect of temperature. J. Hazard. Mater. 2006, 135, 87–93. [Google Scholar] [CrossRef] [PubMed]
  64. Selatnia, A.; Bakhti, M.Z.; Madani, A.; Kertous, L.; Mansouri, Y. Biosorption of Cd2+ from aqueous solution by a NaOH-treated bacterial dead Streptomyces rimosus biomass. Hydrometallurgy 2004, 75, 11–24. [Google Scholar] [CrossRef]
  65. Chen, C.; Wang, J. Influence of metal ionic characteristics on their biosorption capacity by Saccharomyces cerevisiae. Appl. Microbiol. Biotechnol. 2007, 74, 911–917. [Google Scholar] [CrossRef] [PubMed]
  66. Deng, S.; Ting, Y.-P. Characterization of PEI-modified biomass and biosorption of Cu(II), Pb(II) and Ni(II). Water Res. 2005, 39, 2167–2177. [Google Scholar] [CrossRef] [PubMed]
  67. Tan, T.; Cheng, P. Biosorption of Metal Ions with Penicillium chrysogenum. Appl. Biochem. Biotechnol. 2003, 104, 119–128. [Google Scholar] [CrossRef]
  68. Martins, B.L.; Cruz, C.C.V.; Luna, A.S.; Henriques, C.A. Sorption and desorption of Pb2+ ions by dead Sargassum sp. biomass. Biochem. Eng. J. 2006, 27, 310–314. [Google Scholar] [CrossRef]
  69. Gupta, V.K.; Rastogi, A. Biosorption of lead from aqueous solutions by green algae Spirogyra species: Kinetics and equilibrium studies. J. Hazard. Mater. 2008, 152, 407–414. [Google Scholar] [CrossRef] [PubMed]
  70. Aljeboree, A.M.; Alshirifi, A.N.; Alkaim, A.F. Kinetics and equilibrium study for the adsorption of textile dyes on coconut shell activated carbon. Arab. J. Chem. 2017, 10, S3381–S3393. [Google Scholar] [CrossRef]
  71. Annadurai, G.; Juang, R.S.; Lee, D.J. Adsorption of heavy metals from water using banana and orange peels. Water Sci. Technol. 2003, 47, 185–190. [Google Scholar] [CrossRef]
  72. Robati, D. Pseudo-second-order kinetic equations for modeling adsorption systems for removal of lead ions using multi-walled carbon nanotube. J. Nanostruct. Chem. 2013, 3, 55. [Google Scholar] [CrossRef]
  73. Wang, H.; Zhou, A.; Peng, F.; Yu, H.; Yang, J. Mechanism study on adsorption of acidified multiwalled carbon nanotubes to Pb(II). J. Colloid Interface Sci. 2007, 316, 277–283. [Google Scholar] [CrossRef] [PubMed]
  74. Kovačevic, D.; Pohlmeier, A.; Özbas, G.; Narres, H.-D.; Kallay, M.J.N. The adsorption of lead species on goethite. Colloids Surf. A Physicochem. Eng. Asp. 2000, 166, 225–233. [Google Scholar] [CrossRef]
  75. Li, N.; Bai, R.; Liu, C. Enhanced and Selective Adsorption of Mercury Ions on Chitosan Beads Grafted with Polyacrylamide via Surface-Initiated Atom Transfer Radical Polymerization. Langmuir 2005, 21, 11780–11787. [Google Scholar] [CrossRef] [PubMed]
Sample Availability: Samples of the compounds are not available.
Figure 1. FTIR spectrum in KBr of (a) CS-g-BIB, and (b) CT-g-PA.
Molecules 23 02218 g001
Figure 2. Wide scan photoelectron spectrum of the (a) CS, (b) CS-BIB initiator (c) CS-g-PA and (d) high resolution spectrum of the Br in the CS-BIB initiator.
Molecules 23 02218 g002
Figure 3. The Effect of initial pH on the adsorption of (a) Cu2+ and (b) Pb2+ on CS and CS-g-PA (adsorption time: 24 h; Initial amount of adsorbent: 25 mg, initial volume of samples: 50 mL, at 25 °C).
Molecules 23 02218 g003
Figure 4. Non-linear theoretical model fitting for copper adsorption on (a) CS; (b) CS-g-TA; and theoretical model fitting for lead adsorption on (c) CS and (d) CS-g-TA. (pH: 4.0; adsorption time: 24 h; initial adsorbent quantity: 25 mg; initial volume: 50 mL; temperature: 25 °C).
Molecules 23 02218 g004
Figure 5. (a) Kinetic adsorption plots for Cu2+ on CS and CS-g-PA; (b) Kinetic adsorption plots for Pb2+ on CS and CS-g-PA; (c) linear fitting for Cu2+ on CS and CS-g-PA; (d) linear fitting for Pb2+ on CS and CS-g-PA; (initial concentration of Pb (II) and Cu (II) = 200 mg/L; pH = 4.0; adsorbent = 25 mg; volume of solution = 50 mL; temperature = 25 °C).
Molecules 23 02218 g005
Scheme 1. Schematic diagram for the synthesis of chitosan grafted polyacrylate from chitosan.
Molecules 23 02218 sch001
Table 1. Some methodologies for removal of Pb2+ and Cu2+ from water.
IonsMethodOperation ConditionRemoval EfficiencyAdvantages/Disadvantages
Cu2+, Pb2+, Zn2+Chemical precipitationCu2+ = 0.018 mM, Pb2+ = 2.3 mM, Zn2+ = 1.34 mM; precipitant, H2S; pH = 3.0Cu2+ (100%), Pb2+ = (92%), Zn2+ = (94%)Most widely used process in industry; it is relatively simple and inexpensive/it generates large volumes of relatively low density sludge; sulfide precipitants can result in the evolution of H2S [10,11].
Cu2+, Cr3+, Pb2+, Zn2+[metal] = 100 mg·L−1 precipitant, CaO; pH = 3.0>99%
Cu2+Ion exchangeCu2+ = 100 mg·L−1;
Resin-supported polyethyleneimine; pH = 5.0
>99%High treatment capacity, high removal efficiency and fast kinetics/leaching during operation, highest costs for synthetic resins [9,11,12]
Pb2+; Cu2+Cu2+ = 25 mg·L−1;
Resin-THQSA; pH = 4.5
60–90%
Cu2membrane separation—ElectrodyalisisCu2+ = 100 mg·L−1; membrane: packed beds of graphite powder; flow 1.29 × 10⁻⁴ Ls−1; current density 2 mAcm2; pH = 3.0>99%It has high efficiency, it requires little space, it is not selective and is easy to operate/it generates a large amount of metal-containing sludge [13].
Pb2+AdsorptionPb2+ = 50 mg·L−1; adsorbent: active carbon; pH = 6.0>85%Effective and economic method; it is flexible in design and operation and besides it can produce high-quality treated effluent; easy metal recovery [14,15,16]
Pb2+Pb2+ = 50 mg·L−1; adsorbent: chitosan; pH = 4.5>60%
Cu2+Pb2+ = 10 mg·L−1; adsorbent: chitosan; pH = 4.5>80%
Table 2. Theoretical Isothermal fitting experimental results.
Isothermal ModelAdsorbentMetal IonParameter (Unit)Value
LangmuirCSCu2+qm (mg·g−1)133
kL (L·g−1)29.8
1 R20.998
ARE3.30%
Pb2+qm (mg·g−1)54
K (L·g−1)42.6
R20.998
ARE4.50%
CS-g-TACu2+qm (mg·g−1)136
K(L·g−1)32.3
R20.998
ARE4.20%
Pb2+qm (mg·g−1)80.6
K (L/g)39.6
R20.997
ARE3.50%
1 fitting coefficient.
Table 3. Model kinetic parameters for removal Pb2+ and Cu2+ by CS and CS-g-PA.
AdsorbentMetal Ion1k2 (g·mg−1·min−1) × 10−4qe (mg·g−1)R2
CSCu2+1.71400.997
Pb2+19.814.80.998
CS-g-PACu2+1.81640.997
Pb2+2.898.00.999
1 rate constant of the pseudo-second-order kinetic adsorption.

