Article

Novel Phenolic Constituents of Pulmonaria officinalis L. LC-MS/MS Comparison of Spring and Autumn Metabolite Profiles

by
Justyna Krzyżanowska-Kowalczyk
1,*,
Łukasz Pecio
1,
Jarosław Mołdoch
1,
Agnieszka Ludwiczuk
2 and
Mariusz Kowalczyk
1
1
Department of Biochemistry and Crop Quality, Institute of Soil Science and Plant Cultivation—State Research Institute, Czartoryskich 8, 24-100 Puławy, Poland
2
Department of Pharmacognosy with Medicinal Plant Unit, Medical University of Lublin, Chodzki Str.1, 20-093 Lublin, Poland
*
Author to whom correspondence should be addressed.
Molecules 2018, 23(9), 2277; https://doi.org/10.3390/molecules23092277
Submission received: 30 July 2018 / Revised: 25 August 2018 / Accepted: 4 September 2018 / Published: 6 September 2018

Abstract

:
Lungwort (Pulmonaria officinalis L., Boraginaceae) is considered to possess therapeutic properties and it has been traditionally used as a remedy against various lung disorders in many countries. Nevertheless, very few data concerning its phytochemical composition are available. This research aims to provide a detailed description of specialized metabolites from the aerial parts of lungwort. Nine previously undescribed and 36 known phenolic compounds were detected in the 50% methanolic extract. Following multistep preparative procedures, structures of newly discovered compounds were determined using one- and two-dimensional techniques of NMR spectroscopy. Among the identified compounds were caffeic acid esters with aliphatic hydroxycarboxylic acids, conjugates of dicaffeic acid with rosmarinic acid, and previously unknown isomers of isosalvianolic acid A and yunnaneic acid E, as well as other lignans. Concentrations of all identified phenolic derivatives in the investigated herbal material were estimated using a method based on liquid chromatography with high-resolution mass spectrometry detection. Seasonal changes in the concentration of metabolites were also investigated using targeted and untargeted metabolomics techniques.

Graphical Abstract

1. Introduction

Pulmonaria officinalis L (lungwort), belonging to the Boraginaceae family, is a herbaceous perennial plant, widely spread in Europe and western Asia. It has a long tradition of use in folk medicine of many countries as a remedy against various respiratory diseases including asthma, chronic bronchitis, tuberculosis, laryngitis, and coughs. It also has expectorant, antitussive, and diaphoretic properties [1,2,3,4,5,6]. Other ethnomedicinal sources indicate that infusions or decoctions of P. officinalis are administrated as astringent, anticoagulant, anti-microbial, and anti-inflammatory herbs, as well as a remedy for urinary disorders, cystitis, moreover, it shows diuretic and anti-lithiasis activities [2,7,8]. Applied externally, it can be very beneficial in the treatment of burns, wounds, cuts, and eczema [1,2]. P. officinalis extract was tested as a component of bioactive hydrogels, which can be used in the treatment of wounds with heavy and medium exudates [9]. Aerial parts of P. officinalis, commercially available as Pulmonariae Herba, in combination with Tussilago farfara (coltsfoot), are often used to treat chronic cough, including whooping cough [1]. Pulmonariae Herba is also an ingredient of various herbal mixtures or dietary supplements. Astringent, emollient, and skin conditioning properties allow for the use of P. officinalis extract in cosmetology [10,11]. Furthermore, P. officinalis and P. obscura are also known as wild food plants [12,13] and honey plants [14,15]. Various Pulmonaria species are also used as ornamental plants.
Very few pharmacological studies confirming the effects of the traditional use of P. officinalis and P. obscura are available. Also, only fragmentary research has been done regarding the chemical constituents of Pulmonaria species. Consequently, the phytochemical profile of P. officinalis remains mostly unknown, particularly regarding phenolic compounds, for which only a very few publications are available. Brantner and Karting, based on thin layer chromatography (TLC) identification, reported on the presence of quercetin and kaempferol glycosides [16]. A fingerprint of methanol extract of P. officinalis obtained using micro-two-dimensional TLC, indicated the presence of chlorogenic acid, myricetin, acacetin, glycosides of apigenin, quercetin (rutin and hyperoside), hesperetin (hesperidin), and naringenin (naringin) [1]. Furthermore, based on HPLC analysis, Neagu et al. reported that rosmarinic acid was the main constituent of both aqueous and ethanolic extracts obtained from P. officinalis, moreover small amounts of rutin, hyperoside, chlorogenic, and caffeic acids were also detected [17]. Our research revealed that P. officinalis extract contains yunnaneic acid B—a unique molecule that has been isolated so far only from Salvia yunnanensis, and also confirmed the presence of large amounts of rosmarinic acid [18].
Nevertheless, all of these reports provide an incomplete view of the phytochemicals that are present in lungwort. Thus, the primary goal of this research was systematic detection, isolation, and NMR-based identification of metabolites from the extract of Pulmonaria officinalis for dereplication purposes. Secondly, the obtained reference substances were used to investigate the distribution of identified metabolites in P. officinalis. Thirdly, we investigated changes in the phytochemical composition of P. officinalis at two phenological stages. This experiment was carried out using both targeted and untargeted metabolomics approaches, to discover components and potential biomarkers associated with each stage.

2. Results and Discussion

2.1. Identification of Metabolites in P. offcinalis Extract

Preliminary chromatographic analyses of the extract from aerial parts of P. officinalis L. indicated the presence of several peaks tentatively identified as phenolic derivatives (Figure 1 and Table 1, peak numbers assigned by retention time). A multistep preparation procedure led to the isolation of 45 compounds which were further analyzed using high-resolution mass spectrometry, as well as one-dimensional 1H and 13C-NMR spectroscopy. Based on these results, we identified nine new and 36 already described in the literature metabolites.
Among the known compounds were mainly conjugates of danshensu ((2R)-(3,4-dihydroxyphenyl)-2-hydroxypropanoic acid) (1), with caffeic acid (8), such as shimobashiric (26), rosmarinic (27), monardic (29), lithospermic (31,34), salvianolic (33), and yunnaneic acids (22,36). Also present were several conjugates of phenolic acids with quinic acid, such as three isomers of chlorogenic acid (6,9,13) and two isomers of coumaroylquinic acid (16,17). Additionally, also detected were esters of caffeic acid with threonic and glyceric acid (4,11,12), lignans such as globoidnans A and B (37,18), a megastigmane glucoside (7), a few flavonol glycosides (kaempferol (20,24,25), or quercetin (19,21) derivatives), which were also present in malonylated forms (23,28), as well as a nitrile glucoside menisdaurin (2), and tryptophan derivative lycoperodine-1 (5).

2.2. Structural Characterization of the New Compounds

Complete structures of the nine newly discovered metabolites (3,10,14,30,32,35,38,39,41, shown in Figure 2) were elucidated by one-dimensional as well as two dimensional 1H and 13C-NMR spectroscopy.
The 13C-NMR of compound 3 showed 13 signals that were classified as one CH2, 7 CH, and 5 quaternary carbon atoms (Table 2). The aromatic region of the 1H and COSY (correlation spectroscopy) spectra of 3 exhibited the presence of set of protons characteristic for the α,β-unsaturated aromatic acid derivative, while the aliphatic alcohols region indicated the presence of another set of protons. The first set corresponded to a tri-substituted aromatic group at δH 7.04 (d, J = 2.1 Hz, H-2′), 6.94 (dd, J = 8.2, 2.1 Hz, H-6′), and 6.77 (d, J = 8.2 Hz, H-5′), in accordance with the AMX spin system, and coupled doublets, H-α and H-β, at δH 6.26 and 7.59, corresponding to E-(Jα,β = 15.9 Hz) olefinic moiety. The set of aliphatic protons corresponded to a tri-hydroxylated group at δH 5.34 (ddd, J = 6.8, 6.3, 2.5 Hz, H-3), 4.47 (d, J = 2.5 Hz, H-2), and H-4 at δH 3.81 (dd, J = 11.2, 6.9 Hz)/3.75 (dd, J = 11.2, 6.3 Hz), in accordance with the ABMX spin system. The assignments of all carbons of the aromatic and aliphatic moiety were accomplished by interpretation of the HSQC (heteronuclear single quantum correlation), H2BC (heteronuclear 2-bond correlation), and HMBC (heteronuclear multiple bond coherence) spectra, and indicated that compound 3 contained a trans-caffeic acid derivative connected through an ester bond with tri-hydroxylated sugar acid, namely threonic acid. It was supported by the 3J correlation between H-3 and C-9′ (δC 168.3), and a weak 4J correlation between H-α and C-3 (δC 75.8), observed in the HMBC spectrum, and suggested that 3 was 3-O-(E)-caffeoyl-threonic acid. Similar compounds: (−)-2-O-(E)-caffeoyl-l-threonic acid (4) and (−)-4-O-(E)-caffeoyl-l-threonic acid (12) were also found in Crataegus extract [19], leaves of Dactylis glomerata [20], leaves of Cornus controversa [21], and aerial parts of Chelidonium majus [22]. Therefore, compound 3 was elucidated as 3-O-(E)-caffeoyl-threonic acid.
The 13C-NMR of compound 14 showed 12 signals that were classified as one CH2, six CH, and five quaternary carbon atoms (Table 2). The aromatic region of the 1H and COSY spectra of 14, similarly to 3, exhibited the presence of set of protons, characteristic for the α,β-unsaturated aromatic acid derivative, while the aliphatic alcohols region showed the presence of a second set of protons. One set corresponded to a tri-substituted aromatic group at δH 7.04 (d, J = 2.1 Hz, H-2′), 6.94 (dd, J = 8.2, 2.1 Hz, H-6′), and 6.78 (d, J = 8.2 Hz, H-5′), in accordance with the AMX spin system, and coupled doublets, H-α and H-β, at δH 6.27 and 7.58, corresponding to E-(Jα,β = 15.9 Hz) olefinic moiety, typical of a trans-caffeoyl residue. The set of aliphatic protons corresponded to a di-hydroxylated group at δH 4.44 (br d, J = 6.0 Hz, H-2), and H-3 at δH 4.46 (m)/4.38 (m), which were correlated in the HSQC spectrum with their carbon atoms at δC 70.3 and 66.9 ppm, respectively. Protons H-2/H-3 correlated in the HMBC spectrum, with carbons C-1 (δC 174.8) and C-9′ (δC 168.9), thus revealing that the aliphatic portion of 14 was glyceric acid attached to caffeoyl moiety through an ester bond, forming a 3-O-caffeoyl-glyceric acid. The other structural isomer of caffeoyl-glyceric acid, found in the investigated plant, was (−)-2-O-(E)-caffeoyl-d-glyceric acid [22]. Thus 14 was identified as 3-O-(E)-caffeoyl- glyceric acid.
The 13C-NMR (DEPTQ-135) (distorsionless enhancement by polarization transfer including the detection of quaternary nuclei) spectrum of 38 contained 28 signals, sorted by HSQC and HMBC spectra, as one CH3, two CH2, 11 CH, and 14 quaternary carbon atoms (Table 3). The high-field shifted resonances at δC 174.5, 172.7, and 164.2 suggested the presence of three carboxyl groups (C-9, C-9′, and C-9′′, respectively). The aromatic region of the 1H and COSY spectra of 38 revealed the presence of three aromatic rings in the structure. Two of them were 1,3,4-trisubstituted benzene rings—first at δH 6.98 (br s, H-2), 6.84 (dd, J = 8.1, 2.1 Hz, H-6), 6.67 (d, J = 8.1 Hz, H-5) and second at δH 7.40 (d, J = 2.1 Hz, H-2″), 7.16 (dd, J = 8.3, 2.1 Hz, H-6″), 6.79 (d, J = 8.3 Hz, H-5″)—both in accordance with the AMX spin system. The third represented a 1,3,4,5-tetrasubstituted benzene ring and showed meta-coupled resonances at δH 6.52 (d, J = 1.9 Hz, H-2′) and 6.72 (br s, H-6′). The signals of the two downfield shifted aliphatic protons at δH 5.23 (dd, J = 11.4, 1.6 Hz, H-8′) and 4.83 (t, J = 8.2 Hz, H-8), after selective irradiation in 1D-TOCSY (total correlation spectroscopy) experiments, showed correlation with the CH2 groups at δH 3.15 (dd, J = 14.2, 1.8 Hz, H-7′)/2.98 (dd, J = 14.2, 11.4 Hz, H-7′), and 2.99 (dd, J = 15.4, 8.5 Hz, H-7)/2.96 (dd, J = 15.4, 7.6 Hz, H-7), forming AMX and ABX spin systems, respectively. Proton H-8′ correlated in the HSQC spectrum with a carbon at δC 75.3, while proton H-8 correlated with a carbon at δC 39.3, suggesting that the first one was an oxygenated methine. The 1H-NMR spectrum also revealed two sharp singlets, at δ 7.13 (H-7″) and 3.54 (9-OMe), correlating in the HSQC spectrum with carbons at δ 127.0 and 52.1 (respectively), suggesting the presence of a tri-substituted (Z)-double bond [23] and a methyl ester function. This evidence suggested that 38 was a dicaffeic acid-(3,4-dihydroxyphenyl lactic acid) conjugate. The long-range correlations visible in the HMBC spectrum between H-7″and C-8″(δC 140.2)/C-9″and H-8′ and C-9′′/C-9′ suggested that the core structure of 38 was rosmarinic acid (27). Furthermore, the long-range correlations observed in the HMBC spectrum between H-8 and carbons C-1, C-5′ (δC 132.8), and C-9 unambiguously proved the presence of a dihydrocaffeic acid methyl ester attached to C-5′ and C-8″of the rosmarinic acid, forming a 14-carbon close-ring structure (Figure 3). It was further supported by the NOE effect observed in the NOESY (nuclear Overhauser effect spectroscopy) spectrum between protons H-2 and H-6′, and substantial broadening of their signals, as it suggested the presence of steric hindrance to free rotation, and their close vicinity. Compound 38 was named pulmitric acid A.
The 13C-NMR (DEPTQ-135) spectrum of 39 contained 27 signals, sorted by HSQC and HMBC spectra, as one CH2, 12 CH, and 14 quaternary carbon atoms (Table 3). The NMR spectra suggested the presence of three phenylpropanoid moieties, similarly to 38, with rosmarinic acid being the core structure. One ABX spin system at δH 7.37 (dd, J = 8.3, 2.1 Hz, H-6), 7.35 (d, J = 2.1, H-2), and 6.99 (d, J = 8.3 Hz, H-5), and one AMX proton set at δH 6.73 (d, J = 2.1 Hz, H-2′), 6.68 (d, J = 8.1 Hz, H-5′), and 6.60 (dd, J = 8.1, 2.1 Hz, H-6′); together with two (E)-olefinic protons at δH 7.59 (d, J = 15.9 Hz, H-7), and 6.36 (d, J = 15.9 Hz, H-8) appeared in the aromatic part of the COSY spectrum. The 13C-NMR spectrum also showed two aliphatic carbons at δC 74.7 (C-8′), 37.9 (C-7′) and three carboxyl groups at δC 173.4 (C-9′), 168.1 (C-9) and up-field shifted one at 160.2 (C-9″). Additionally, the 1H-NMR spectrum contained three sharp singlets at δH 7.03 (H-7″), 6.81 (H-6″) and 6.79 (H-3″). Altogether, compound 39 seemed to possess a structure similar to that of lycopic acid, but with 3,4,5-trihydroxycinnamic instead of caffeic acid [24]. The proton H-7″showed a correlation in the NOESY spectrum with H-6′′, but quite surprisingly also with H-2, confirming the (E)-stereochemistry of the double bond and the site of conjugation with a rosmarinic acid moiety. It was further supported by the substantial downfield shift of C-2 (Δδ + 6.3) and C-4 (Δδ + 2.7), and the upfield shift of C-3 (Δδ − 2.7), when compared to that of rosmarinic acid (see Supplementary Materials Figure S48). Compound 39 was named pulmitric acid B.
Compounds 40 and 41 were isolated as separated chromatographic peaks using preparative HPLC. However, they presented a set of identical 1H and 13C-NMR resonances, in agreement with the structure of isosalvianolic acid A, found in Mentha species [25,26]. Compound 40 was recognized as isosalvianolic acid A (7R,8′′R), from the value of its optical rotation ( [ α ] D 23 = +39.7°), similar to that of rosmarinic acid. To investigate that in more detail CD (circular dichroism) spectra of 40 were recorded. As the C-8″chiral center and its environment are identical to that of rosmarinic acid, one would expect a similar CD spectrum if the configuration around C-8″is the same as in 27. In fact, the CD spectra were only quantitatively different (see Supplementary Materials Figure S48 and S96). The values of the chemical shifts of compounds 40 and 41 were identical with the literature data [27]. On the other hand, optical rotation ( [ α ] D 23 = +18.5°) and the negative Cotton effect observed in the CD spectrum at 240–270 nm, suggested that the absolute stereochemistry of C-7 in 41 was (S). Therefore, compound 41 was named isosalvianolic acid A-1.
The 13C-NMR of compound 18 showed 27 signals that were classified as one CH2, 12 CH, and 14 quaternary carbon atoms (Table 4). The UV and MS spectral properties, as well as the 1H and 13C-NMR chemical shifts, were almost superimposable with that of salvianolic acid R (note the different enumeration of carbons) in [28]. However, the chemical structure of 18 was in agreement with globoidnan B, as presented in [29]. The structures differed in the location of a 3,4-dihydroxyphenyllactic moiety, connected with the core moiety of epiphyllic acid through an ester bond, either with C-9 or C-10 [30]. Our findings suggest that NMR chemical shifts are in agreement with globoidnan B, and are based on the careful study of both HMBC correlations and the analysis of 1,1-ADEQUATE (adequate double-quantum transfer experiment) spectrum and unambiguously identify the site of esterification (Figure 4). Additionally, we presented the optical rotation and CD spectra of this compound.
The 13C-NMR of compound 32 showed 47 signals that were classified as three CH3, three CH2, 26 CH, and 15 quaternary carbon atoms (Table 4). The aromatic region of the 1H and COSY spectra of 32 exhibited the presence of two sets of aromatic protons, in accordance with AMX spin systems, at δH 7.18 (d, J = 8.4 Hz, H-5′′″), 7.07 (d, J = 2.1 Hz, H-2′′″), 7.01 (dd, J = 8.4, 2.1 Hz, H-6′′″), and at δH 6.90 (d, J = 8.1 Hz, H-5′), 6.87 (d, J = 2.0 Hz, H-2′), 6.81 (dd, J = 8.1, 2.0 Hz, H-6′). The first one was part of the caffeoyl moiety, with (E)-oriented double bond with protons resonating at δH 7.47 (d, J = 15.9 Hz, H-7′′″), 6.21 (d, J = 15.9 Hz, H-8′′″), and correlated in the HMBC spectrum with the carbonyl group at δC (168.9, C-9′′″), which suggested the possible site of esterification. The other set was evidenced as part of an 1,2-dihydronaphtalene moiety—similarly to 18, additionally methylated in positions C-6 (δC 147.7) and C-3′ (δC 149.0), which was further supported by the HMBC correlations and the NOE effects visible in the TROESY (transverse rotating-frame Overhauser enhancement spectroscopy) spectra between 6-OMe (δH 3.79, s) and H-5 (δH 6.73, s), and between 3′-OMe (δH 3.84, s), and H-2′ (Figure 5). This part of the molecule can also be recognized as the 8,8′-diferulic acid, in its aryltetralin form, often present in the plant cell-walls [31]. However, the relative configuration of H-1/H-2 must be different when compared to globoidnan B (gauche). This assumption was based on the large (J = 15.3 Hz) coupling constant between H-1 (δ 4.34, dd, J = 15.3, 1.0 Hz, 1H) and H-2 (δ 4.21, dd, J = 15.3, 2.5 Hz, 1H), and allylic coupling (4J) between H-2 and H-4 (δ 7.39, d, J = 2.5 Hz, 1H), suggesting that orientation of C-2–H-2 is probably quasi-axial [32]. Additionally, the NOE effect observed in the TROESY spectrum between protons H-8 (δ 6.11, s)/H-2′ and H-8/H-6′ indicated that the orientation of C-1–H-1 is quasi-axial too and therefore the relative configuration of H-1/H-2 is anti [32]. Moreover, two anomeric proton signals at δH 5.50 (d, J = 1.8 Hz, H-1′′′″) and 5.35 (d, J = 3.6 Hz, H-1′″) were observed, indicating the presence of two sugar units. Based on the values of coupling constants, and the analysis of 1D TOCSY and 1D TROESY, COSY, HSQC, H2BC, HSQC-TOCSY, F2-coupled HSQC [33], and HMBC data, the two sugar units were elucidated as α-rhamnopyranoside δH/C 5.50 (H-1′′′″)/100.7 (C-1′′′″), and α-glucopyranoside δH/C 5.35 (H-1′″)/94.4 (C-1′″) (Table 4). The α orientation of anomeric protons was supported by their 1JCH coupling constants, with values of ~172 and ~169 Hz [34], respectively, measured in the F2-coupled HSQC experiment. Additionally, the 3J correlations observed in the HMBC spectrum between the anomeric proton of the Glc (H-1′″) and C-2″of a β-fructofuranose unit (δC 110.1) indicated the presence of interglycosidic linkage between these sugar units (1→2), forming a sucrose unit. This was further supported by the NOE effect detected in the TROESY spectrum between H-1′″and CH2-1″(δH 3.90, d, J= 12.4 Hz/3.72, d, J = 12.4 Hz). Careful examination of correlations visible in the HMBC spectrum allowed to assign connectivities between the glycosidic and aromatic parts of 32 unambiguously. Therefore, the correlation between H-1′′′″and C-4′′″(δC 147.9) of caffeoyl moiety proved a Rha unit to be the last part of the glycosidic chain. It was further supported by the NOE effect in the TROESY spectrum between H-1′′′″and H-5′′′′. Next, geminal protons of CH2-6′″group of Glc (δH 4.48, dd, J = 12.0, 2.3 Hz/4.16, dd, J = 12.0, 6.5 Hz) gave a 3J correlation in the HMBC spectrum with C-9′′″of Caf moiety. Finally, the geminal protons of Fru of CH2-6″group (δH 4.71, dd, J = 12.4, 2.4 Hz/4.08, d, J = 12.4 Hz) gave a 3J correlation in the HMBC spectrum with C-9 (δC 168.1), while the proton H-3″(δH 4.63) showed correlation to C-10 (δC 176.4) of the core moiety (8,8′-diferulic acid). Hence, the structure of 32 was elucidated, and we propose its trivial name to be pulmonarioside A.
The 1H and 13C-NMR spectra of compound 35 showed an almost identical set of atoms, with only one additional CH3 group located at C-3′′″(δC 152.0), when compared to 32 (Table 4). In a chain of glycosidation, type of sugar units was precisely the same (with 8,8′-diferulic acid as the core of the molecule), the only difference was the presence of the (E)-ferulic acid instead of caffeoyl moiety. This was supported by the long-range correlation that was visible in the HMBC spectrum of 35 between 3′′″-OMe (δH 3.92, s) and C-3′′′′, and the NOE effect was visible in the TROESY spectrum between proton mentioned above and H-2′′″(δH 7.26, d, J = 2.0 Hz). Hence, the structure of 35 was elucidated, and we proposed its trivial name to be pulmonarioside B.
The 13C-NMR of compound 10 showed 22 signals that were classified as one CH3, three CH2, 13 CH, and five quaternary carbon atoms (Table 5). The aromatic region of the 1H and COSY spectra of 10 exhibited the presence of aromatic protons, in accordance with the AMX spin system, at δH 7.23 (d, J = 2.0 Hz, H-2″), 7.14 (dd, J = 8.3, 2.0 Hz, H-6″), 6.81 (d, J = 8.3 Hz, H-5″), and α/β-unsaturated side chain with (E)-stereochemistry (3JHH coupling constant of 15.9 Hz). Additionally, the NOE effect observed in the TROESY spectrum between H-2″and 3″-OMe (δH 3.91, s) and the 3J correlation that was visible in the HMBC spectrum between 3″-OMe and C-3″(δC 149.4) confirmed the presence of the (E)-ferulic acid as part of 10. It was connected through the ester bond with the disaccharide unit, identified as digobiose [35]. This was supported by the HMBC correlation between H-3′ (δH 5.46, d = 7.9 Hz) and C-9″(168.3). The interglycosidic linkage between sugar moieties was established as 1→2, from the 3J correlation that was visible in the HMBC spectrum (H-1 at δH 5.44 to C-2′ at δC 104.8). The α-orientation of the glucopyranose moiety was based on the small vicinal coupling constant of H-1 (3JHH = 3.7 Hz), with H-2 (δH 3.43, dd, J = 9.8, 3.7) and 1JCH coupling constant between an anomeric pair of resonances H/C (~169 Hz). The α orientation of the sorbopyranose unit was based on the NOE effect between H-3′ and both H-5′/CH2-1′ at δH 3.93 (ddd, J = 7.9, 5.6, 3.5 Hz)/(3.66, d, J = 12.2 Hz and 3.59, d, J = 12.2 Hz), respectively, and comparison of chemical shifts and coupling constants with the literature data. Therefore, the structure of 10 was established as 3′-O-(E)-feruloyl-α-sorbopyranosyl-(2′→1)-α-glucopyranoside.
Compound 30 was isolated as the minor constituent of P. officinalis, and its 13C-NMR showed 26 signals that were classified as three CH2, 10 CH, and 13 quaternary carbon atoms (Table 5). The spectral features of this compound suggested that it possessed both 3,4-dihydroxyphenyllactic acid and 4-biphenylpropionic acid moieties conjugated through an ester linkage. It was evidenced by the presence of three sets of aromatic protons in the 1H and COSY NMR spectra. The one was in accordance with the ABX spin system at δH 6.73 (d, J = 2.1 Hz, H-2″), 6.70 (d, J = 8.1 Hz, H-5″), 6.59 (dd, J = 8.1, 2.1 Hz, H-6″), consistent with a 1,3,4-trisubstituted aromatic ring. The other two sets were in accordance with the AMX spin systems at δH 7.87 (d, J = 2.0 Hz, H-2), 7.67 (dd, J = 8.0, 2.0, H-6), 7.19 (d, J = 8.0 Hz, H-5), and at δH 7.04 (d, J = 2.2 Hz, H-2′), 6.94 (dd, J = 8.2, 2.2 Hz, H-6′), 6.85 (d, J = 8.2 Hz, H-5′), consistent with a 3,3′,4′-trisubstituted 4-biphenylpropionic acid unit. It was further supported by the long-range correlations visible in the HMBC spectrum between H-8″(δH 5.10, dd, J = 8.9, 4.0 Hz) and C-9 (δC 173.8) presenting the ester linkage, and H-6 to C-1′ (δC 132.4) with H-2′/H-6′ to C-1 (δC 141.2). It was consistent with the NOE correlations that were visible in the TROESY spectrum between pairs H-2/H-6 and H-2′/H-6′, confirming the presence of the biphenyl moiety. One ambiguity arose during the elucidation of the structure of 30—the 13C-NMR spectrum showed the presence of resonances at δC 167.8 and 192.0. The latter was attributable to the oxo- group in the C-10 position from the long-range correlation visible in the HMBC spectrum between H-2 and C-10. However, there was no visible correlation to the resonance at 167.8 ppm, and no aldehyde-type proton that was visible in the 1H-NMR spectrum, but the chemical formula established through HR-MS required the presence of 26 carbons. Therefore, we suggest that the α-oxoacid moiety is present in the structure of 30, located in the carbons C-10 and C-11. This compound showed several similarities to the already known compound—yunnaneic acid E [36], and we proposed its trivial name to be yunnaneic acid E-1.

2.3. The Main Phytochemical Constituents of P. officinalis

For quantitative analysis of P. officinalis extracts, we employed a method based on liquid chromatography with high resolution mass spectrometric detection. Metabolites isolated for structure determination and confirmation were used as reference standards, and digoxin was used as the internal standard. Results of these measurements are shown in Table 6.
Rosmarinic acid (27)—a depside composed of (2R)-3-(3,4-dihydroxyphenyl)-lactic and caffeic acid residues, was confirmed as the chief constituent of examined extracts. Although the observed content of rosmarinic acid was relatively high, ranging from 7 to 12 mg/g of dry weight (DW), we previously observed much higher levels (approaching 60 mg/g DW) in similar samples [18]. Reasons for such a broad diversity in the concentration of this compound are unclear. However, comparable levels were reported from other species [37,38]. Rosmarinic acid exerts a variety of well-documented pharmacological properties, such as antioxidant, anti-inflammatory, antibacterial, anti-angiogenic, anti-mutagenic, antidepressant, and neuroprotective, as well as antiallergenic [39,40,41,42,43]. Due to a high content of rosmarinic acid, such properties can also be attributed to whole extracts or tinctures of lungwort. Investigated samples also contained small amounts of methyl rosmarinate (43) [44].
Shimobashiric acid C (26) was another phenolic acid derivative that was abundantly present in the P. officinalis extract (1.2–1.8 mg/g DW). It is a dimer of rosmarinic acid containing cyclobutane scaffold (truxillic acid) formed presumably by a [2 + 2] photocycloaddition of two olefinic moieties [45]. Shimobashiric acid C was isolated from Keiskea japonica [46], and recently from Plectranthus amboinicus [45]. However, its activity has been poorly studied. It can act as a hyaluronidase inhibitor [46] and also possesses anti-inflammatory properties. Chen et al. confirmed that this molecule inhibited the binding of the AP-1 transcription factor to its consensus DNA sequence, and showed TNF-α inhibitory activity as well [45].
Another significant phenolic derivative observed in extracts of Pulmonaria was lithospermic acid A (31, approximately 0.6 mg/g DW). Identified by the presence of dihydrobenzofuran moiety with (7S,8S) configuration [47], lithospermic acid A is one of the major constituents of Chinese medicinal plant Salvia miltiorrhiza Bge., although it was observed in several other plants [44,48,49,50,51,52,53,54]. It has substantial therapeutic potential indicated during in vitro tests [52,55,56,57,58,59]. Extracts from Pulmonaria species also contained slightly higher levels (0.8–0.97 mg/g DW) of monardic acid A (29), an isomer of lithospermic acid A possessing (7R,8R) configuration [60,61]. Lithospermic acid B (34), a minor component of the extract possessing various biological activities [57,62,63], was also detected but not quantified due to an insufficient amount of suitable reference standard. Pulmonaria also contains yunnaneic acid B (36, 0.2–1.8 mg/g DW) [44,50,64], and yunnaneic acid E (22, 0.1–0.2 mg/g DW) in smaller quantities, [36,44]. Although yunnaneic acid B was isolated and characterized in the mid-90s, there is no available data on its activity and occurrence in plants. Our recent study revealed its ability to reduce oxidative damage to blood plasma proteins and lipids, and to enhance the non-enzymatic antioxidant capacity of blood plasma in vitro [18].
Salvianolic acid H (33, 3′-O-(8″-Z-caffeoyl) rosmarinic acid) and its methyl ester (44) were also detected at low levels (0.03–0.26 and 0.006–0.03 mg/g DW, respectively). However, their presence can be, at least partially, attributed to the transformation of another compound, lycopic acid C (45), during the extraction and isolation processes [24]. Treatment of lycopic acid C with water for three days was reported to produce 3-O-(caffeoyl) rosmarinic acid [65], and similar treatment with methanol produced its methyl ester. Nevertheless, the presence of salvianolic acid H was confirmed in some species from genus Salvia, such as Salvia cavaleriei [51], and Salvia miltiorrhiza [48,50].
In addition to rosmarinic acid derivatives, Pulmonaria also appears to have an ability to synthesize chlorogenic acids, as evidenced by the presence of chlorogenic (6, 0.2–0.3 mg/g DW), crypto-chlorogenic (9, 0.005–0.03 mg/g DW), and neo-chlorogenic (13) acid (0.02–0.03 mg/g DW) in the investigated extracts. All these compounds showed the same ion [M − H] at m/z 353. Compound 6 was identified as 3-O-caffeoylquinic acid, whereas compound 9 was identified as 4-O-caffeoylquinic acid, by comparisons of MS/MS fragmentation patterns and retention times with that of authentic standards. The last isomer was only tentatively identified as a 5-O-caffeoylquinic acid (13) by its fragmentation pattern alone [66,67].
3-O-p-coumaroylquinic acid (15), preliminarily identified using HR-QTOF-MS/MS (high resolution quadrupole-time of flight tandem mass spectrometry) and subsequently isolated and confirmed using NMR techniques, was detected at levels (0.1–0.36 mg/g DW) that were comparable to that of its sister molecule, chlorogenic acid. Isomeric 4-O-p-coumaroylquinic (16) and 5-O-p-coumaroylquinic (17) acids, tentatively identified by the MS/MS fragmentation patterns [66], also occur in Pulmonaria, although the former is a relatively minor component, detected only in samples collected in autumn.
Free danshensu (1) [44] and caffeic acid (8) [44] were also present in low quantities (0.02–0.06 and 0.02–0.1 mg/g DW, respectively). Both of these compounds showed diverse and significant bioactivities in previous studies [68].
Lignans were abundantly represented by globoidnan B (18, 3.8–6.8 mg/g DW), and a few other components detected at trace levels. That latter group, included also newly discovered pulmonariosides A and B, as well as globoidnan A (0.02 mg/g DW). Nothing is known about biological activities of globoidnan B. However, globoidnan A was previously isolated from Eucalyptus globoidea [69], Origanum minutiflorum [70], and Thymus praecox [71] and extensively investigated. It is known to inhibit the action of HIV integrase, an enzyme which is responsible for the introduction of HIV viral DNA into a host′s cellular DNA [69]. Moreover, it revealed anti-proliferative activity against HeLa (human cervix carcinoma) or C6 (rat brain tumor) cell lines [71].
Lungwort also contains a relatively limited number of flavonol glycosides. Tentative identifications of these compounds by HR-MS (high m-resolution ass spectrometry) were confirmed by full characterization using NMR techniques. Malonylated glucosides of quercetin (23, 0.9–1.6 mg/g DW) and kaempferol (28, 0.7–1.6 mg/g DW) were the most abundant among the detected flavonol glycosides. Rutin (19, (quercetin-3-O-rutinoside)) was also present in moderate quantities (0.05–0.36 mg/g DW). The other flavonol-derived glycosides (21,24,25) were detected at slightly lower levels, although some significant seasonal changes in their concentrations were observed. Although rutin, isoquercitin (quercetin-3-O-β-glucoside), and astragalin were described before in the aerial parts of P. officinalis [16], and the presence of their malonyl derivatives was previously not discovered. However, in contrast to Bratner′s research, we did not detect quercitrin (quercetin-3-O-rhamnoside). Also, we cannot confirm the presence of myricetin, acacetin, glycosides of apigenin, quercetin (hyperoside), hesperetin (hesperidin), or naringenin (naringin) found in P. officinalis extract by Hawrył and Waksmundzka-Hajnos [1].
The presence of menisdaurin (2), a nitrile glucoside, was confirmed by extensive spectroscopic HR-MS and NMR analyses and comparison with literature data [72]. The occurrence of this compound in Pulmonaria officinalis was so far unknown. Menisdaurin was detected in a moderate amount, approximately 0.1 mg/g DW, exclusively in the samples collected during spring. Very few members of Boraginaceae family are known to contain nitrile glucosides. Compounds structurally related to menisdaurin glucosides containing cyclohexenylcyanomethylene aglycones, such as lithospermoside (griffonin) and ehretiosides, were reported from various species of Lithospermum and Ehretia. Menisdaurin itself was also reported from genus Tiquilia. However, these plants are only distantly related to Pulmonaria. Although generally considered to be non-cyanogenic, menisdaurin gave positive results for HCN release in the tests carried out by Siegler et al. [72]. Menisdaurin elicits moderate anti-hepatitis B virus activity by inhibiting HBV DNA replication [73,74]. Its anti-tumor [75], as well as anti-inflammatory [75] activity were also reported.
Similarly to menisdaurin, tryptophan-derived tetrahydro-β-carboline alkaloid, lycoperodine-1 (1,2,3,4-tetrahydro-β-carboline-3-carboxylic acid, [76] was also present only in the spring samples, albeit at a much lower concentration (approximately 0.01 mg/g DW). Compounds similar to lycoperodine-1 are known to exhibit a variety of biological activities [77]. However, at the observed concentration, lycoperodine-1 is unlikely to contribute to the therapeutic properties of P. officinalis.
The lungwort extract also contained a small amount of megastigmane glucoside, actinidioionoside [78,79] (7, 0.02–0.4 mg/g DW), previously isolated from several plants, including distantly related to P. officinalis borage (Borago officinalis L.) [80].

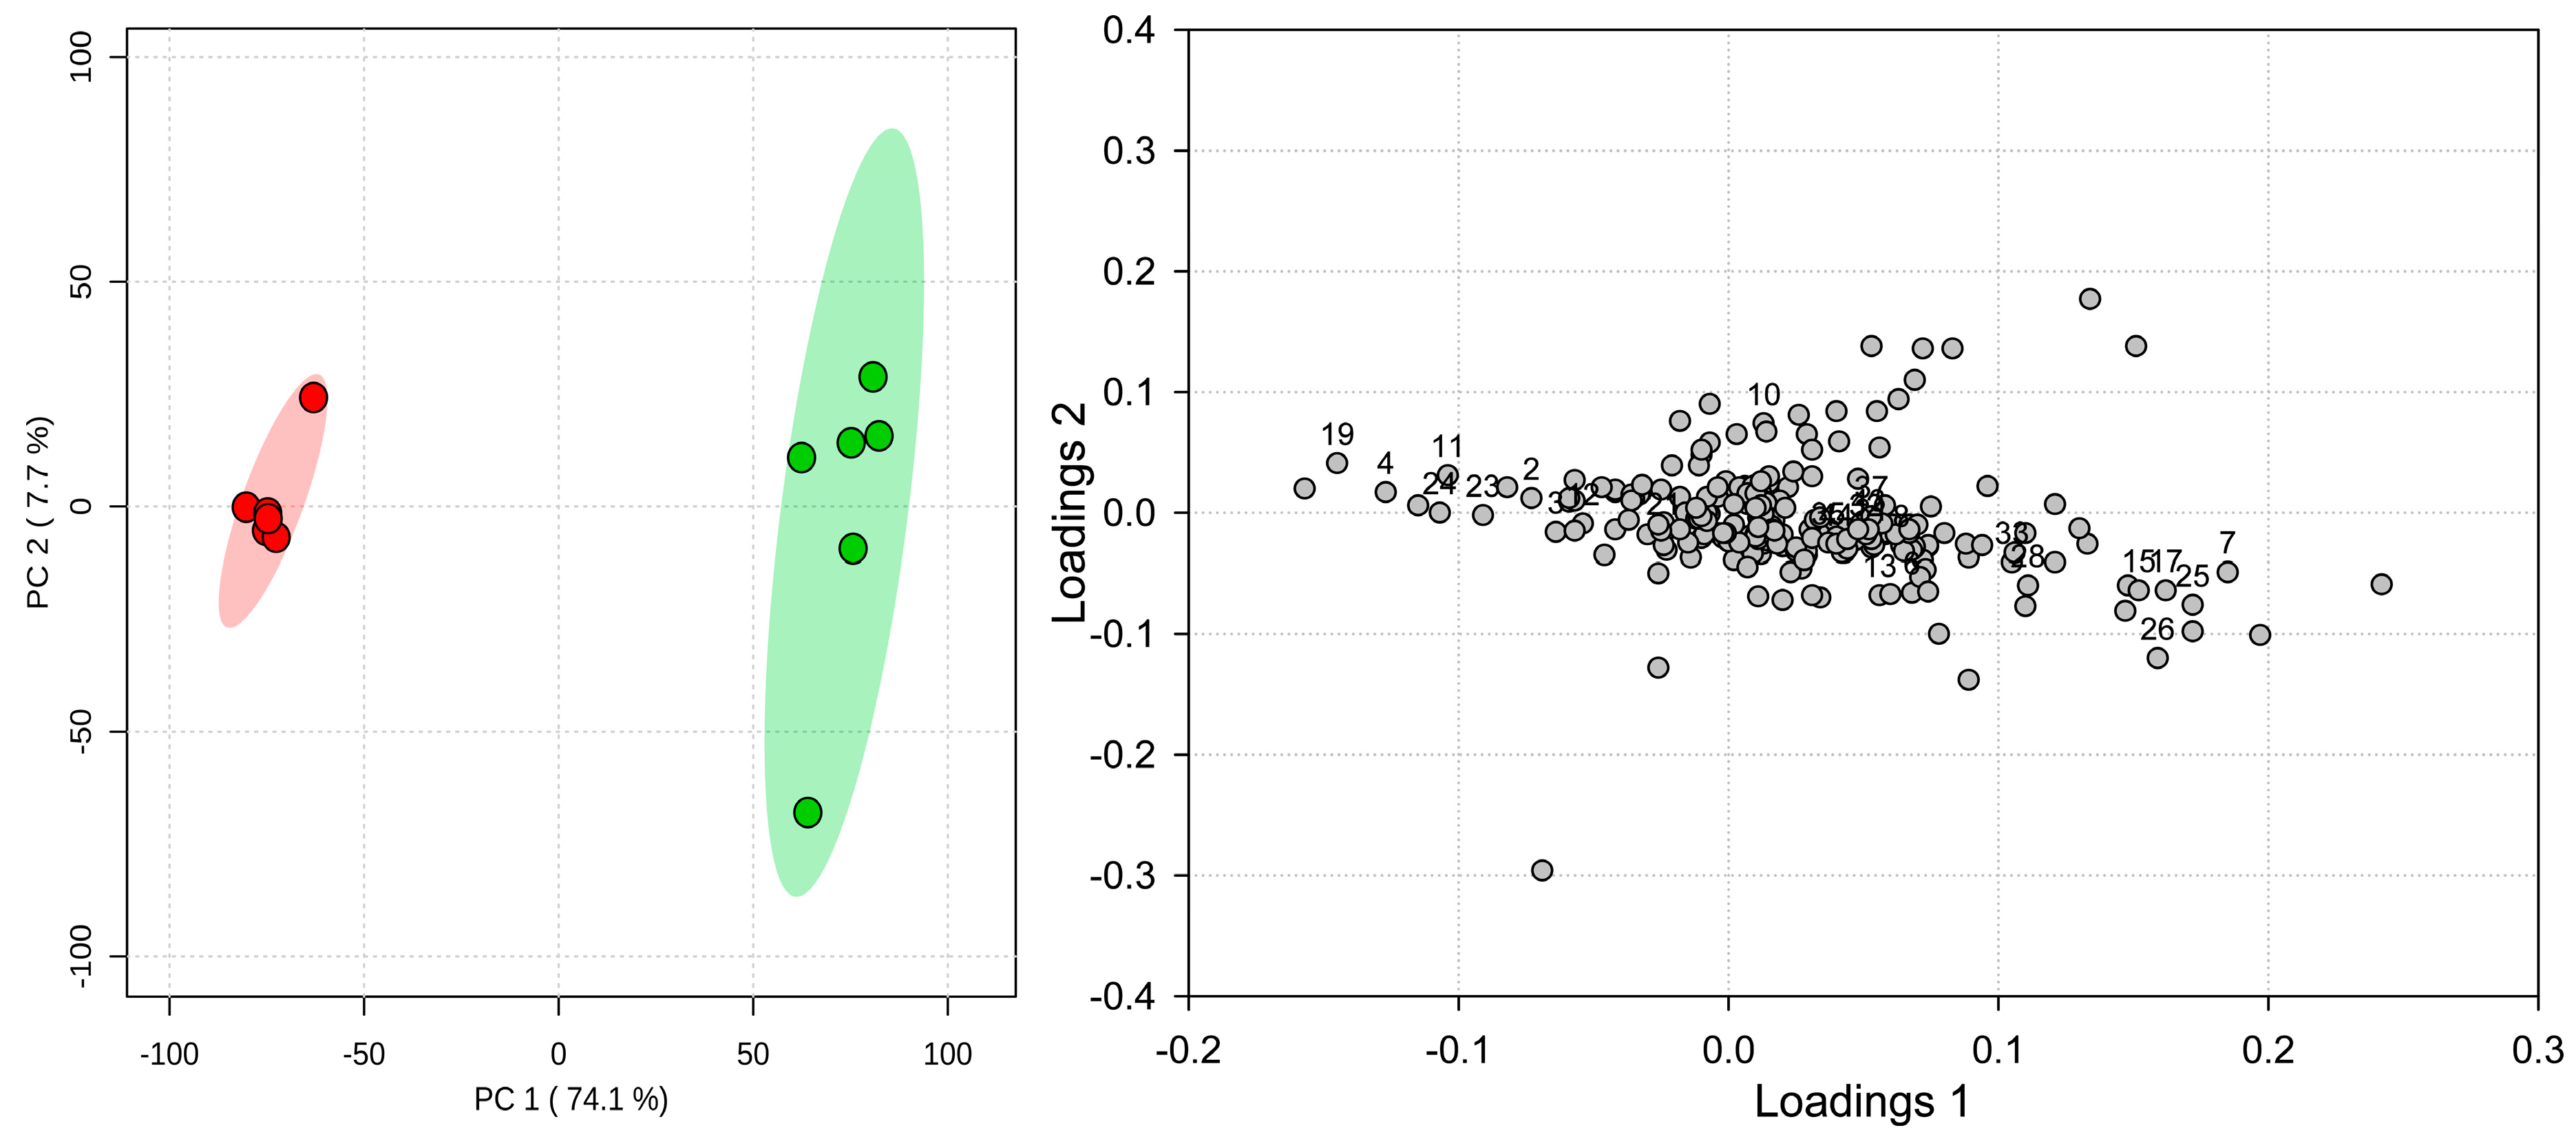
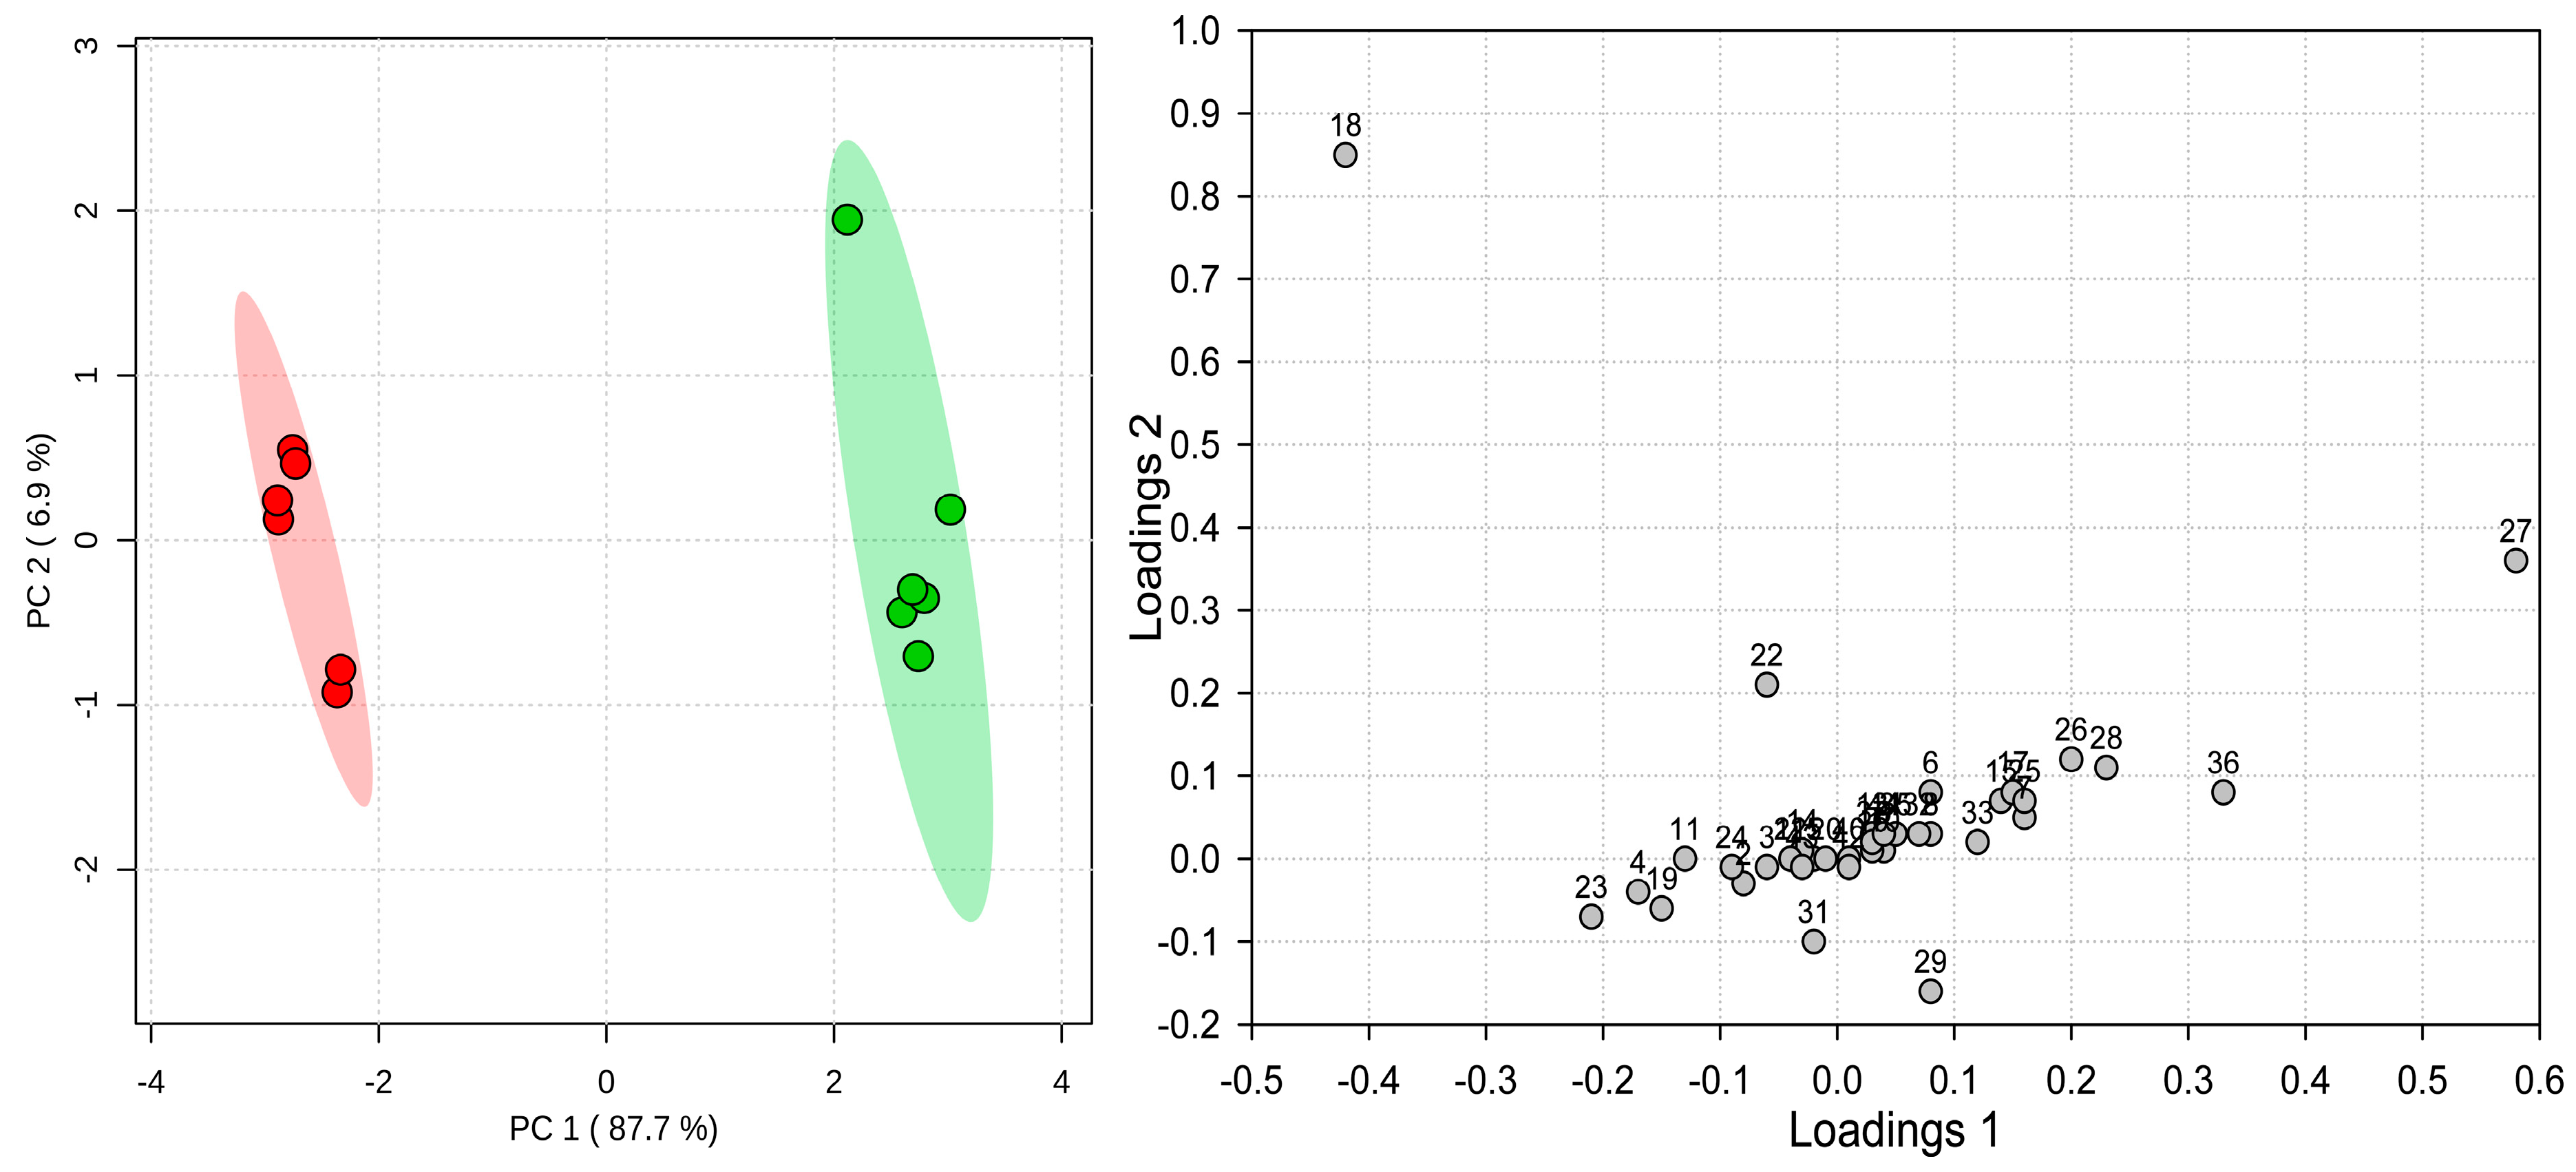
2.4. Seasonal Fluctuation in Phytochemical Composition of P. officinalis

Numerous reports describe seasonal changes in the contents of flavonoid and phenolic acid derivatives in various plant species [81,82,83,84,85]. Although a variety of different accumulation patterns were observed, it is often stated in the literature that seasonal changes in phenolic acids contents follow a trend that is frequently the opposite to the direction of changes in flavonoid glycosides concentration. To investigate the seasonal variability of flavonoids and phenolic acids in P. officinalis, we first applied the untargeted metabolomics approach.
Univariate volcano plot analysis, combining t-tests and fold change examination, determined several features as linked with spring and autumn stages of Pulmonaria life cycle. As shown in Figure 6, the features on the right side of the volcano plot were the most significant for the spring samples, whereas the elements on the left side are connected with the autumn samples. Among the features characteristic for spring samples, a few compounds isolated and characterized in this study were identified. Chief among them is menisdaurin (2), which nearly completely disappeared in the autumn samples. Similarly, spring samples could be described by high levels of rutin (19), nicotiflorin (24) as well as 3-O-caffeoyl-threonic acid (3). Presence of the latter compound can have some ecological significance, as this type of hydroxycinnamic acid derivative is known as oviposition stimulant for Papilio sp. butterflies [86]. On the other hand, high levels of several other compounds, but mainly salvianolic acid H (33), actinidioionoside (7), three isomers of coumaroylquinic acid (15,16,17), as well as pulmonarioside B (35), were linked to the autumn samples.
Unsupervised principal component analysis (PCA) indicated a clear separation of samples according to their phenological stage along the first component, encompassing 74.2% of the dataset variability (Figure 7). Investigation of PCA loadings (Figure 7) revealed that the variables responsible for grouping spring samples were, in large part, virtually the same as these indicated by univariate analyses: rutin (19), menisdaurin (2), O-caffeoyl-l-threonic acids (3,4), and nicotiflorin (24). Additionally, O-caffeoyl glyceric acid (11) and malonyl glucoside of quercetin (23) were also indicated as being characteristic for spring samples. Similarly, autumn samples were again characterized by high amounts of salvianolic acid H, actinidioionoside, and coumaroylquinic acids, but also globoidnan B (18) astragalin (25), shimobashiric acid C (26), and malonyl glucoside of kaempferol (28).
Multivariate analyses carried out on the dataset derived from targeted measurements of selected 39 metabolites produced very similar results (Figure 8). Again, clear separation of the two groups of samples can be observed along the first principal component (87.7% variability). Likewise, loadings still indicated nearly the same set of metabolites as responsible for grouping spring and autumn samples (Figure 8). However, one notable exception is rosmarinic acid (27), which in the untargeted analysis, was characteristic for the spring samples. In the targeted study, it conversely appeared to be marker for autumn samples. The reason for this discrepancy underlays a problem with metabolomics based on peak intensities. Both spring and autumn samples were so abundant in rosmarinic acid that its signal during MS analyses was overloaded. Thus, in both cases, registered intensities of the m/z 359.07 ion had similarly high levels, and even slight variabilities of the signal produces differences that may seem relevant. However, as clearly seen in the volcano plot (Figure 6), where the point representing rosmarinic acid is located in the lower central part, these changes were lesser in the level and have higher p-value. A signal overload can be easily corrected using appropriate dilutions; however, high dilutions generate a risk of loss from the analysis of some other less abundant but also essential components of the sample. The trade-off dilution that we applied—10-fold, was unfortunately not sufficient enough to include the rosmarinic acid in the multivariate PCA model in the untargeted analysis. On the other hand, the targeted analysis was based on a series of three dilutions (2, 10, and 50 times), to allow for proper quantitation of the analyzed compounds within the range of the calibration curves.
With the results of the targeted analysis, it was clear that phenolic acids and flavonoids accumulation patterns during the life cycle of Pulmonaria were quite multifaceted (Table 6, heat map in Figure 9). Flavonol glycosides in other species are known to be at their highest levels during spring, then their concentrations decline, reaching a minimum at the end of the phenological cycle. Such a pattern was observed for unidentified flavonoids in Rosmarinus officinalis, although rutin displayed the opposite trend, accumulating in the highest amount at the vegetative stage of the life cycle [81]. Similarly, analyses of flavonoids in Hypericum perforatum also showed the accumulation of hyperoside and apigenin glucoside in the pre-flowering and flowering stages, followed by a decline during mature fruiting, and a slight increase in the late vegetative stage. Again, rutin accumulated only during the vegetative stage [82]. The opposite trend for rutin was, however, observed in the case of Melittis melissophyllum, where it accumulated in leaves in May, and sharply declined in the same tissues in September [85]. This pattern is mostly the same as observed in the current study for rutin, nicotiflorin, and to a slightly lesser extent, also for malonyl glucoside, as well as for glucosides of quercetin. On the other hand, both malonyl glucoside and a glucoside of kaempferol seemed to accumulate during the vegetative stage. Considering that P. officinalis is one of the early-spring plants that flowers before tree-canopy leaves develop, increased levels of quercetin derivatives (19,21,23) are probably a reflection of high light irradiance that up-regulates their biosynthesis [87,88]. On the contrary, higher levels of kaempferol derivatives at the end of the vegetative cycle, when Pulmonaria plants usually live under dense tree canopies, may reflect an association of these derivatives with shaded growth conditions [88]. However, flavonoid glycosides with B-ring diols, such as quercetin derivatives, were hypothesized to prevent high-intensity light damage by scavenging reactive oxygen species (ROS). UV-induced ROS generation can also be inhibited by compounds that merely absorb relevant light wavelengths, and phenolic acids appear to be much more suitable for this function than flavonoids [89]. This can be a potential function of several caffeic acid derivatives with high concentrations in spring samples that decline in levels during life cycle progression. In particular, O-caffeoyl threonic and glyceric acids, and globoidnan B may serve UV-B protective functions during the spring development of Pulmonaria. Nonetheless, numerous other phenolic acids derivatives, including the main metabolite—rosmarinic acid, appear to accumulate in aerial parts in autumn. An increase in the levels of simple compounds such as caffeic acid (8) and danshensu (1), can be a result of the turnover and degradation of other derived composite metabolites. However, yunnaneic acid B, a relatively complex molecule, also accumulates nearly 9-fold compared to spring samples. The role of these metabolites at the vegetative stage of Pulmonaria life cycle is yet to be explained.
There is still need to explore the usefulness of many of traditionally used herbs for modern therapy, pharmacy, pharmacology, or medicine. Presented research explores the phytochemical composition of commonly occurring and well known medicinal plant that nowadays is not intensively used for therapeutic purposes. For the first time, specialized metabolites of Pulmonaria, especially phenolic compounds, were thoroughly investigated by a combination of NMR, HR-MS, and other spectral techniques, providing full-scale qualitative and quantitative information. The results of this study will contribute to qualitative and quantitative method development and quality control or standardization purposes.

3. Materials and Methods

3.1. Chemicals and Reagents

Acetonitrile and methanol, LC-MS grade and HPLC grade respectively, were purchased from Merck (Darmstadt, Germany). MS-grade formic acid was purchased from Sigma Aldrich (Steinheim, Germany). Ultrapure water was prepared using a Milli-Q water purification system (Millipore, Milford, MA, USA).

3.2. Plant Material

Dried aerial parts of P. officinalis used for compound isolation were purchased from a local herb supplier (Kania, Czestochowa, Poland). The voucher sample (POFF./EXTR/2013/1) has been deposited at the Department of Biochemistry and Crop Quality of the Institute. Quantitative analyses of isolated compounds during the growing season have been carried out for P. officinalis L., and rhizomes were donated from The Botanical Garden of Maria Curie-Skłodowska University in Lublin. Rhizomes were planted at the experimental plots of the Institute of Soil Science and Plant Cultivation, Puławy, Poland (N51°24.767′ E021°57.924′). The aerial parts of lungwort were collected from early spring to late autumn at weekly intervals. The meteorological conditions for April and September are presented in Table 7. The voucher samples have also been deposited at the Department of Biochemistry and Crop Quality of the Institute.

3.3. Extraction and Isolation

Aerial parts of P. officinalis were finely powdered with an electric grinder and sieved through a 0.5 mm sieve. Plant material was defatted with chloroform in a Soxhlet apparatus. Afterward, it was extracted twice with 80% methanol (v/v) using ultrasonic bath, at room temperature for 24 h. The obtained extract was filtered through filter paper (Whatmann No.1), concentrated under reduced pressure/vacuum, and freeze-dried. The yield of the extraction was 24.4%.
The crude methanol extract was then purified in a stepwise manner by different chromatographic methods. First, the extract was applied to a preconditioned RP-C18 column (80 × 100 mm, Cosmosil 140C18-PREP, 140 µm; Nacalai Tesque, INC., Kyoto, Japan), followed by removal of polar constituents (1% MeOH v/v), while phenolic-rich fraction was eluted with 50% methanol. Collected fractions were monitored using thin layer chromatography (TLC) techniques. TLC was performed on silica gel plates with a solvent system consisting of MeCN:H2O:CHCl3:HCOOH (100:10:10:5) as a mobile phase. The plates were visualized under UV light at 254/360 nm, and then sprayed with a methanol/sulfuric acid reagent and heated on a hot plate. The 50% methanol fraction (32.8 g) was further purified by low-pressure chromatography on Sephadex LH-20 (Sigma-Aldrich, Steinheim, Germany) column (48 × 400 mm) and eluted with a gradient of MeOH (5–100%, v/v). As a result of this separation, 10 fractions (Fr 0–9) were collected. Due to the high similarity of their composition, fractions 4 and 5, as well as 6 and 7, were combined with each other. The fractions were subsequently subjected to a reversed phase column (32 × 300 mm, Cosmosil 40C18-PREP, 40 µm; Nacalai Tesque, INC., Kyoto, Japan), which yielded several sub-fractions. The compositions of the fraction and sub-fractions were monitored by LC-MS technique as described below. Individual compounds were further purified by a semi-preparative HPLC chromatographic system.
It should be noted that rosmarinic acid was a dominant compound of the whole 50% MeOH fraction, constituting 24% of the fraction. Moreover, this compound constituted 23% of Fr. 3, 73% of combined fractions 4 + 5, 63% of fractions 6 + 7, and 45% of fraction 8 respectively. Chromatographic separation of Fr. 0 (4.05 g) yielded compound 22 (7.8 mg). Fr. 1 (11.37 g) yield compounds: 1 (4.2 mg), 2 (393 mg), 7 (4 mg), 36 (98 mg). Fr. 2 (9.53 g), which was divided into 12 subfractions, produced compounds: 3 (7 mg), 4 (5.5 mg), 5 (3.5 mg), 6 (15 mg), 9 (5.5 mg), 10 (4 mg), 11 (5.5 mg), 12 (5.5 mg), 14 (13 mg), 15 (22 mg), 18 (279 mg), 26 (45 mg), 28 (6 mg), 29 (22 mg), 30 (4 mg), 31 (27 mg). Fr. 3 (1.49 g) yielded molecules 23 (9.5 mg), 33 (291 mg) and 34 (3.14 mg). Combined Fr. 4 + 5 (2.09 g) yield compounds 35 (32 mg), and 27 (1289 mg). Fr. 6 + 7 (1.11 g) gave molecules: 8 (5.5 mg), 19 (2.0 mg), 21 (28.7 mg), 32 (14.8 mg), 24 (1.93 mg), 25 (16 mg). Fr. 8 (3.07 g) gave compounds: 37 (27.5 mg), 38 (3 mg), 39 (2.9 mg), 40 (2.69 mg), 41 (1.64 mg), 43 (3.75 mg), and 44 (49.5 mg). Fr. 9 (0.04 g) was not further purified. Tentative identification based on HR-LC-QTOF-MS/MS analysis, fragmentation patterns, and comparison with literature data, as well as its similarity to isolated compounds concerns following compounds: 13 (neochlorogenic acid), 16 (4-O-p-coumaroylquinic acid), 17 (5-O-p-coumaroylquinic acid), 20 (nicotiflorin isomer), 42 (isosalvianolic acid A isomer), and 45 (lycopic acid C). Some of these compounds were, however, included in quantitative analyzes of spring and autumn Pulmonaria extracts (Table 6).

3.4. Instruments

3.4.1. Semi-Preparative HPLC

The final purification steps utilized the semi-preparative HPLC Gilson chromatographic system (Gilson Inc., Middleton, WI, USA), equipped with an evaporative light scattering detector (ESLD, Gilson PrepELS II). The drift tube of the ELSD detector was maintained at 65 °C, and the pressure of the nebulizer gas (nitrogen) was 47 psi. Sub-fractions obtained from low-pressure reversed phase liquid chromatography were further purified on a variety of columns: Atlantis T3 Prep OBD (10 × 250 mm, 5 µm, Waters, Milford, MA, USA), COSMOSIL π-NAP (10 × 250 mm, 5 µm, Nacalai Tesque, INC., Kyoto, Japan) or RP-18 Kromasil (10 × 250mm, 5 µm, AkzoNobel, Bohus, Sweden). The conditions of chromatographic separation were individually optimized for each fraction. Separations were carried out in isocratic or in gradient mode, using aqueous acetonitrile or methanol solutions, containing 0.1% formic acid. The mobile phase flow rate was from 3 to 4 mL/min, and the column was held between 35 and 55 °C. The effluent from the HPLC system was diverted through a passive splitter to ELSD with a split ratio of 1:100.

3.4.2. High-Resolution LC-MS and Qualitative Analysis

For quantitative analyses, harvested plants were freeze-dried, finely powdered, and used for extraction with an automated accelerated solvent extractor, ASE 200 (Dionex, Sunnyvale, CA, USA). One hundred milligrams of each sample was extracted three times with 80% aqueous MeOH (three static cycles, 5 min each), at 1500 psi (10.3 MPa) solvent pressure, 100 °C temperature of extraction cells, flush 150%. Obtained crude extracts were evaporated to dryness, dissolved in 1 mL of Milli-Q water (Millipore Corp., Billerica, MA, USA), containing 25 µg/mL of digoxin (internal standard, IS) and purified by solid phase extraction (SPE) using Oasis HLB columns (500 mg, Waters Corp., Milford, MA, USA). The extracts were loaded on preconditioned cartridges, which were washed with 0.5% MeOH to remove unbound material, and then with 85% MeOH to elute specialized metabolites. These fractions were evaporated and dissolved in 1 mL of 85% MeOH acidified with 0.1% HCOOH. All analyses were performed in triplicate and samples were stored in a freezer at −20 °C before analysis. Before spectrometric analyses samples were centrifuged (15 min, 23,000× g) and appropriately diluted with distilled water.
High-resolution LC-MS analyses, e.g.,: exact masses, MS/MS fragmentation patterns, molecular formulae, as well as quantitative determinations, were performed on a Thermo Scientific Ultimate 3000 RS chromatographic system coupled/hyphenated with a Bruker Impact II HD (Bruker, Billerica, MA, USA) quadrupole time-of-flight (Q-TOF) mass spectrometer.
Chromatographic separations were carried out on a Waters CORTECS T3 column (2.1 × 150 mm, 2.7 µm, Milford, MA USA) equipped with pre-column. The mobile phase A was 0.1% (v/v) formic acid, and the mobile phase B was acetonitrile containing 0.1% (v/v) of formic acid. A concave-shaped gradient (Dionex gradient curve nr. 6) from 5% to 60% of phase B over 25 min was used for separation. The flow rate was 0.6 mL/min, and the column was held at 35 °C. Between the injections column was equilibrated with 10 volumes of 5% phase B. Injection volume was 5 µL.
Analyses were carried out in both positive and negative ion mode with electrospray ionization. Measurements in the negative ion mode were accompanied with detection based on charged aerosol (CAD). A flow splitter was used to divert the column effluent in 1:3 proportion between Q-TOF MS and charged aerosol detector connected in parallel. CAD acquisition frequency was 10 Hz. Analyses in the positive ion mode employed additional UV absorbance detection in the 200–600 nm wavelength range with 5 nm bandwidth and 10 Hz acquisition frequency.
Linear (centroid) mass spectra were acquired over a mass range from m/z 50 to m/z 2000 with the following parameters of mass spectrometer: positive ion capillary voltage 4.5 kV; negative ion capillary voltage 3.0 kV, dry gas flow 6 L/min; dry gas temperature 200 °C; nebulizer pressure 0.7 bar; collision RF 700.0 V; transfer time 90 μs; prepulse storage 7.0 μs. Two precursor ions with intensities over 2000 counts were fragmented in each scan. The collision energy and the ion isolation width were set automatically depending on the m/z of the fragmented ion, in the range of 5 to 100 eV and from 3 to 8 mass units, respectively. The acquired data were calibrated internally with sodium formate introduced to the ion source via a 20 µL loop at the beginning of each separation.
Calibration curves in the range from 0.05 to 50 µg/mL were prepared from the 1 mg/mL methanolic stock solutions of investigated compounds and analyzed in the conditions specified above. Extracted ion chromatograms were made from full scan data with a 0.005 Da width. Smoothing using the Savitzky-Golay algorithm (window width 5 points, one iteration) was applied and peaks corresponding to deprotonated molecules (or, in the case of compounds 2,7 and the internal standard, deprotonated formic acid adducts) were integrated. Ratios between the analyte peak area and the IS peak area were used for calculations. Details of calibrations are shown in Table S1 (see Supplementary Materials). Data processing was performed using Bruker DataAnalysis 4.4 SR1 software. All quantitative results were calculated per dry weight (DW).

3.4.3. Untargeted Metabolomics Analyses.

For untargeted metabolomic analyses, data obtained from LC-QTOF-MS/MS runs were processed using Find Molecular Features function of Bruker DataAnalysis ver. 4.4 SR1 software. The following parameters were used: a signal-to-noise threshold of 9, correlation coefficient threshold of 0.7, and the minimum compound length of seven spectra. For each detected compound, in addition to the deprotonated ion, all typical adduct and composite ions were grouped into a single feature. Next, features from the entire dataset were subjected to advanced bucket generation with Bruker ProfileAnalysis ver. 2.3 software, using retention time range 1.2–22.0 min and m/z range 50–1500. Time alignment was also applied. Resulting data matrix, consisting of intensity values for 283 peaks indexed by feature parameters (m/z, retention time) and sample name (12 samples), was exported and uploaded to MetaboAnalyst [90]. Data were normalized using internal standard (by the peak intensity of a feature containing m/z 825.428, corresponding to [M + HCOOH-H] ion of digoxin at RT 17.48 min). At this stage of data processing, standard t-test and fold-change analyses were carried out to provide a preliminary overview of features potentially characteristic for the two phenological stages under study. Next, all missing intensity values and intensities that were equal to zero in the data matrix were replaced by the half of the minimum positive value that was found within the data, and multivariate PCA was applied to investigate systematic variation in the data matrix and to identify potential groups in an unsupervised manner.
The bias related to instrumental drift was minimized by randomization of the sample list injection order. It was achieved using an in-house-developed VBA (Visual Basic for Applications) script in Microsoft Excel.
The performance of the LC-MS and the data processing systems were monitored with two types of quality control (QC) samples. Class-specific QC samples (eight in total, four for each group) were prepared by mixing 10 µL aliquots of each sample within the group and diluting them 10 times, just like normal samples. Class QC samples were analyzed after every six analyses of normal samples. During data processing, features detected in less than 75% of class-specific QC samples were removed from the dataset. The frequency distribution of the relative standard deviation for the peak intensities and peak numbers in the QC samples are given in Figure S107 (see Supplementary Materials). The general QC sample consisted of a 8 µg/mL mixture of each of the 38 compounds from P. officinalis that had been isolated in the course of this study, and 25 µg/mL of the internal standard. This QC sample was used to monitor the quality and stability of the data acquisition and was analyzed in replicate after each block of 20 analyses.

3.4.4. NMR Spectroscopy

The 1D and 2D NMR spectra (1H, 13C DEPTQ, 1H–13C HSQC, 1H–13C H2BC, 1H–13C HMBC, 1H–13C F2-coupled perfect-CLIP HSQC, 1H–13C HSQC-TOCSY, 1H–1H COSY DQF, 1H–1H TOCSY, 1H–1H NOESY, 1H–1H TROESY, 1D–TOCSY, 1D-TROESY, CSSF-1D-NOESY, and CSSF-1D-TOCSY [91] were performed using an Avance III HD 500 MHz spectrometer (Bruker BioSpin, Rheinstetten, Germany), in MeOH-d4 or MeOH-d4 with 0.1% TFA. The only exception was shimobashiric acid C, where DMSO-d6 was applied.

3.4.5. Optical Rotation [α]

The optical rotation of isolated compounds was measured on an automatic polarimeter (P-2000, JASCO, Tokyo, Japan).

3.4.6. Circular Dichroism Spectroscopy

Circular dichroism measurements of optically active compounds were carried out on a J-815 circular dichroism spectrometer (JASCO, Tokyo, Japan), using a quartz cell of 1 cm path length. Spectra of analyzed molecules were recorded at 21 °C from 220 to 400 nm at a 0.2 nm resolution, with a scan rate of 50 nm/min. Raw data were smoothed using the Savitzky-Golay method with a window of 11 data points. CD spectra are presented in the Supplementary Materials.

3.4.7. Characteristic Data of Lungwort Compounds

HR-QTOF-MS/MS data in negative ion mode for all compounds has been shown in Table 1.
Danshensu (3,4-dihydroxyphenyl) lactic acid (1); white amorphous powder; UV (PDA, MeCN/H2O) λmax (nm) 280; HR-QTOF-MS (neg.) m/z 197.0455 [M − H] (calc. for C9H10O5 197.0455).
Menisdaurin (2); light brownish amorphous powder; UV (PDA, MeCN/H2O) λmax (nm) 260; HR-QTOF-MS (neg.) m/z 312.1086 [M − H] (calc. for C14H19NO7 312.1089).
3-O-(E)-Caffeoyl-threonic acid (3); white amorphous powder; UV (PDA, MeCN/H2O) λmax (nm) 325; [ α ] D 21 = +67.53 (c 0.73, MeOH); CD (5 × 10⁻⁵ M, MeOH): [Θ]228 − 3330, [Θ]252 − 32, [Θ]259 − 170, [Θ]297 + 2385, [Θ]306 + 2250, [Θ]315 + 1877, [Θ]322 + 2185, [Θ]325 + 2034, [Θ]333 + 2338, [Θ]342 + 1962, [Θ]347 + 2091, [Θ]372 + 284, [Θ]377 + 340; HR-QTOF-MS (neg.) m/z 297.0619 [M − H] (calc. for C13H14O8 297.0616). 1H and 13C-NMR spectroscopic data (Table 2).
2-O-(E)-Caffeoyl-l-threonic acid (4); white amorphous powder; UV (PDA, MeCN/H2O) λmax (nm) 325; [ α ] D 21 = −2.52 (c 0.52, MeOH); CD (5 × 10⁻⁵ M, MeOH) [Θ]237 + 1647, [Θ]338 − 1574; HR-QTOF-MS (neg.) m/z 297.0611 [M − H] (calc. for C13H14O8 297.0616).
Lycoperodine-1 (5); white amorphous powder; UV (PDA, MeCN/H2O) λmax (nm) 275; HR-QTOF-MS (neg.) m/z 215.0825 [M − H] (calc. for C12H11N2O2 215.0826).
Chlorogenic acid (6); white amorphous powder; UV (PDA, MeCN/H2O) λmax (nm) 325; HR-QTOF-MS (neg.) m/z 353.0882 [M − H] (calc. for C16H18O9 353.0878).
Actinidioionoside (7); white amorphous powder; UV (PDA, MeCN/H2O) λmax (nm) 325; HR-QTOF-MS (neg.) m/z 405.2126 [M − H] (calc. for C19H34O9 405.2130).
Caffeic acid (8); white amorphous powder; UV (PDA, MeCN/H2O) λmax (nm) 325; HR-QTOF-MS (neg.) m/z 179.0262 [M − H] (calc. for C9H8O4 179.0349).
Cryptochlorogenic acid (9); white amorphous powder; UV (PDA, MeCN/H2O) λmax (nm) 325; HR-QTOF-MS (neg.) m/z 353.0882 [M − H] (calc. for C16H18O9 353.0878).
3′-O-(E)-Feruloyl-α-sorbopyranosyl-(2′→1)-α-glucopyranoside (10); white amorphous powder; UV (PDA, MeCN/H2O) λmax (nm) 325; [ α ] D 21 = +2.79 (c 0.19, MeOH); HR-QTOF-MS (neg.) m/z 517.1572 [M − H] (calc. for C22H30O14 517.1563). 1H and 13C-NMR spectroscopic data (Table 5).
2-O-(E)-Caffeoyl-d-glyceric acid (11); white amorphous powder; UV (PDA, MeCN/H2O) λmax (nm) 325; [ α ] D 21 = -44.18 (c 0.55, MeOH); CD (5 × 10⁻⁵ M, MeOH) [Θ]265 − 144, [Θ]317 − 5806, [Θ]380 + 296; HR-QTOF-MS (neg.) m/z 267.0508 [M − H] (calc. for C12H12O7 267.0510).
4-O-(E)-Caffeoyl-l-threonic acid (12); white amorphous powder; UV (PDA, MeCN/H2O) λmax (nm) 215, 325; [ α ] D 21 = −16.41 (c 0.15, MeOH); CD (5 × 10⁻⁵ M, MeOH) [Θ]261−169, [Θ]283 − 593, [Θ]300 − 509, [Θ]325 − 1349, [Θ]384 + 80, [Θ]380 + 296; HR-QTOF-MS (neg.) m/z 297.0616 [M − H] (calc. for C13H14O8 297.0616).
Neochlorogenic acid (13); tentative identification; UV (PDA, MeCN/H2O) λmax (nm) 325; HR-QTOF-MS (neg.) m/z 353.0878 [M − H] (calc. for C16H18O9 353.0878).
3-O-(E)-Caffeoyl- glyceric acid (14); white amorphous powder; UV (PDA, MeCN/H2O) λmax (nm) 215, 325; [ α ] D 21 = +7.49 (c 0.21, MeOH); CD (5 × 10⁻⁵ M, MeOH) [Θ]231 − 1125, [Θ]253 − 207, [Θ]273 − 277, [Θ]293 + 208, [Θ]305 + 429, [Θ]324 + 1234, [Θ]343 + 76, [Θ]358 − 204, [Θ]373 − 286; HR-QTOF-MS (neg.) m/z 267.0509 [M − H] (calc. for C12H12O7 267.0510).1H and 13C-NMR spectroscopic data (Table 2).
3-O-p-Coumaroylquinic acid (15); white amorphous powder; UV (PDA, MeCN/H2O) λmax (nm) 225, 310; [ α ] D 21 = −28.45 (c 0.19, MeOH); HR-QTOF-MS (neg.) m/z 337.0924 [M − H] (calc. for C16H18O8 337.0929).
4-O-p-Coumaroylquinic acid (16); tentative identification; UV (PDA, MeCN/H2O) λmax (nm) 225, 310; HR-QTOF-MS (neg.) m/z 337.0926 [M − H] (calc. for C16H18O8 337.0929).
5-O-p-Coumaroylquinic acid (17); tentative identification; UV (PDA, MeCN/H2O) λmax (nm) 225, 310; HR-QTOF-MS (neg.) m/z 337.0924 [M − H] (calc. for C16H18O8 337.0929).
Globoidnan B (18); white amorphous powder; UV (PDA, MeCN/H2O) λmax (nm) 255, 345; [ α ] D 21 = +114.9 (c 0.25, MeOH); CD (5 × 10⁻⁵ M, MeOH) [Θ]254 − 14186, [Θ]292 + 3337, [Θ]313 − 4443, [Θ]351 + 12263; HR-QTOF-MS (neg.) m/z 537.1034 [M − H] (calc. for C27H21O12 537.1039). 1H and 13C-NMR spectroscopic data (Table 4).
Rutin (19) yellow amorphous powder; UV (PDA, MeCN/H2O) λmax (nm) 255, 355; HR-QTOF-MS (neg.) m/z 609.1464 [M − H] (calc. for C27H30O16 609.1461).
Nicotiflorin isomer (20); tentative identification; UV (PDA, MeCN/H2O) λmax (nm) 345; HR-QTOF-MS (neg.) m/z 593.1501 [M − H] (calc. for C27H30O15 593.1512).
Quercetin 3-O-β-glucoside (21); yellow amorphous powder; UV (PDA, MeCN/H2O) λmax (nm) 255, 355; HR-QTOF-MS (neg.) m/z 463.0892 [M − H] (calc. for C21H20O12 463.0882).
Yunnaneic acid E (22); white amorphous powder; UV (PDA, MeCN/H2O) λmax (nm) 265; [ α ] D 21 = +19.43 (c 0.43, MeOH); HR-QTOF-MS (neg.) m/z 571.1092 [M − H] (calc. for C27H23O14 571.1093).
Quercetin 3-O-(6″-O-malonyl)-β-glucoside (23); yellow amorphous powder; UV (PDA, MeCN/H2O) λmax (nm) 255, 355; HR-QTOF-MS (neg.) m/z 549.0876 [M − H] (calc. for C24H22O15 549.0886).
Nicotiflorin (24); yellow amorphous powder; UV (PDA, MeCN/H2O) λmax (nm) 265, 345; HR-QTOF-MS (neg.) m/z 593.1503 [M − H] (calc. for C27H30O15 593.1512).
Astragalin (25); yellow amorphous powder; UV (PDA, MeCN/H2O) λmax (nm) 265, 345; HR-QTOF-MS (neg.) m/z 447.0940 [M − H] (calc. for C21H20O11 447.0933).
Shimobashiric acid C (26); light cream amorphous powder; UV (PDA, MeCN/H2O) λmax (nm) 285; HR-QTOF-MS (neg.) m/z 719.1607 [M − H] (calc. for C36H32O16 719.1618).
Rosmarinic acid (27); light yellowish amorphous powder; UV (PDA, MeCN/H2O) λmax (nm) 220, 330; CD (1 × 10⁻⁴ M, MeOH) [Θ]232 − 9423, [Θ]254 − 1004, [Θ]275 − 3233, [Θ]302 + 7406, [Θ]313 + 6634, [Θ]326 + 7255; HR-QTOF-MS (neg.) m/z 359.0773 [M − H] (calc. for C18H16O8 359.0772).
Kaempferol 3-O-(6″-O-malonyl)-β-glucoside (28); yellow amorphous powder; UV (PDA, MeCN/H2O) λmax (nm) 265, 345; HR-QTOF-MS (neg.) m/z 533.0940 [M − H] (calc. for C24H22O14 533.0937).
Monardic acid A (29); white amorphous powder; UV (PDA, MeCN/H2O) λmax (nm) 310; [ α ] D 21 = −120.93 (c 0.78, MeOH); CD (5 × 10⁻⁵ M, MeOH) [Θ]253 − 70887, [Θ]290 + 6650, [Θ]332 − 7130, [Θ]386 + 290; HR-QTOF-MS (neg.) m/z 537.1035 [M − H] (calc. for C27H22O12 537.1039).
Yunnaneic acid E-1, (R)-2-((3-(3-(carboxycarbonyl)-3′,4′-dihydroxy-[1,1′-biphenyl]-4-yl) propanoyl)oxy)-3-(3,4-dihydroxyphenyl)propanoic acid (30); white amorphous powder; UV (PDA, MeCN/H2O) λmax (nm) 265; HR-QTOF-MS (neg.) m/z 509.1094 [M − H] (calc. for C26H22O11 509.1089). 1H and 13C-NMR spectroscopic data (Table 5).
Lithospermic acid A (31); white amorphous powder; UV (PDA, MeCN/H2O) λmax (nm) 310; [ α ] D 21 = +154.88 (c 0.90, MeOH); CD (5 × 10⁻⁵ M, MeOH) [Θ]253 + 28451, [Θ]281 − 3444, [Θ]330 + 8800; HR-QTOF-MS (neg.) m/z 537.1054 [M − H] (calc. for C27H22O12 537.1039).
Pulmonarioside A (32); white amorphous powder; UV (PDA, MeCN/H2O) λmax (nm) 325; [ α ] D 21 = −73.85 (c 1.44, MeOH); CD (5 × 10⁻⁵ M, MeOH) [Θ]237 + 16506, [Θ]246 + 15155, [Θ]253 + 15786, [Θ]247 − 4592, [Θ]294 + 15809, [Θ]341 − 47198; HR-QTOF-MS (neg.) m/z 999.2766 [M − H] (calc. for C47H52O24 999.2776). 1H and 13C-NMR spectroscopic data (Table 3).
Salvianolic acid H, (3′-O-(8″-Z-caffeoyl) rosmarinic acid) (33); white amorphous powder; UV (PDA, MeCN/H2O) λmax (nm) 325; [ α ] D 21 = +30.07 (c 1.13, MeOH); HR-QTOF-MS (neg.) m/z 537.1034 [M − H] (calc. for C27H22O12 537.1039).
Lithospermic acid B (34); white amorphous powder; UV (PDA, MeCN/H2O) λmax (nm) 250; 288; 330; [ α ] D 21 = +82.18 (c 0.10, MeOH); CD (5 × 10⁻⁵ M, MeOH) [Θ]235 + 14042, [Θ]255 + 25042, [Θ]280 − 2869; [Θ]303 + 9014, [Θ]334 + 11379; HR-QTOF-MS (neg.) m/z 717.1444 [M − H] (calc. for C36H30O16 717.1461).
Pulmonarioside B (35); white amorphous powder; UV (PDA, MeCN/H2O) λmax (nm) 325; [ α ] D 21 = −68.43 (c 1.55, MeOH); CD (5 × 10⁻⁵ M, MeOH) [Θ]253 + 32447, [Θ]274 − 4384, [Θ]296 + 20685, [Θ]340 − 56660; HR-QTOF-MS (neg.) m/z 1013.2946 [M − H] (calc. for C48H54O24 1013.2932). 1H and 13C-NMR spectroscopic data (Table 3).
Yunnaneic acid B (36); white amorphous powder; UV (PDA, MeCN/H2O) λmax (nm) 280; [ α ] D 21 = +92.69 (c 1.22, MeOH); CD (2.5 × 10⁻⁵ M, MeOH) [Θ]231 − 13436, [Θ]252 − 9737, [Θ]269 − 11309, [Θ]300 + 41370; HR-QTOF-MS (neg.) m/z 1093.2255 [M − H] (calc. for C54H46O25 1093.2255).
Globoidnan A (37); white amorphous powder; UV (PDA, MeCN/H2O) λmax (nm) 260, 320; [ α ] D 21 = +77.63 (c 0.42, MeOH); HR-QTOF-MS (neg.) m/z 491.0979 [M − H] (calc. for C26H20O10 491.0984).
Pulmitric acid A (38); white amorphous powder; UV (PDA, MeCN/H2O) λmax (nm) 325; [ α ] D 21 = −116.91 (c 0.24, MeOH); CD (5 × 10⁻⁵ M, MeOH) [Θ]246 + 10304, [Θ]284 − 24134, [Θ]324 + 26434; HR-QTOF-MS (neg.) m/z 551.1190 [M − H] (calc. for C28H24O12 551.1195).1H and 13C-NMR spectroscopic data (Table 2).
Pulmitric acid B (39); white amorphous powder; UV (PDA, MeCN/H2O) λmax (nm) 320; [ α ] D 21 = −5.15 (c 0.31, MeOH); HR-QTOF-MS (neg.) m/z 535.0885 [M − H] (calc. for C27H20O12 535.0882); 1H and 13C-NMR spectroscopic data (Table 2).
Isosalvianolic acid A (40); white amorphous powder; UV (PDA, MeCN/H2O) λmax (nm) 320; [ α ] D 21 = +39.74 (c 0.18, MeOH); CD (5 × 10⁻⁵ M , MeOH) [Θ]230 − 7505, [Θ]255 + 5772, [Θ]276 − 1307, [Θ]305 + 15195; HR-QTOF-MS (neg.) m/z 493.1134 [M − H] (calc. for C26H22O10 493.1140); 1H and 13C-NMR spectroscopic data (Table 3).
Isosalvianolic acid A-1 (41); white amorphous powder; UV (PDA, MeCN/H2O) λmax (nm) 320; [ α ] D 21 = +18.49 (c 0.08, MeOH); CD (5 × 10⁻⁵ M, MeOH) [Θ]248 − 6367, [Θ]305 + 3958; HR-QTOF-MS (neg.) m/z 493.1134 [M − H] (calc. for C26H22O10 493.1140); 1H and 13C-NMR spectroscopic data (Table 3).
Isosalvianolic acid A isomer (42); tentative identification; UV (PDA, MeCN/H2O) λmax (nm) 320; HR-QTOF-MS (neg.) m/z 493.1133 [M − H] (calc. for C26H22O10 493.1081).
Rosmarinic acid methyl ester (43); white amorphous powder; UV (PDA, MeCN/H2O) λmax (nm) 330; [ α ] D 21 = +26.55 (c 0.25, MeOH); HR-QTOF-MS (neg.) m/z 373.0932 [M − H] (calc. for C19H18O8 373.0929).
Salvianolic acid H-9″-methylester (3′-O-(8″-Z-caffeoyl)rosmarinic acid-9″-methylester) (44); white amorphous powder; UV (PDA, MeCN/H2O) λmax (nm) 325; HR-QTOF-MS (neg.) m/z 551.1189 [M − H] (calc. for C28H24O12 551.1195).
Lycopic acid C (45) tentative identification; UV (PDA, MeCN/H2O) λmax (nm) 220; HR-QTOF-MS (neg.) m/z 519.0926 [M − H] (calc. for C27H19O11 519.0933).

4. Conclusions

To the best of our knowledge, this is the first comprehensive study of specialized metabolites in the aerial parts of Pulmonaria officinalis. The presented research may provide insights for the potential applications of lungwort as a dietary supplement or a nutraceutical, and may it also contribute to the broader application of Pulmonariae Herba. Extracts of P. officinalis may serve as a prominent supply of rosmarinic acid and related compounds, as well as a source of several others metabolites. Among the 45 identified metabolites, we found many compounds with well-established therapeutic properties, although none of them alone can be directly associated with the ethnomedicinal use of lungwort. Our results also show progressive changes in the phytochemical composition of P. officinalis during the phenological cycle, presumably reflecting both changes in the physiological state of plants, as well as varying intensity of different abiotic factors.

Supplementary Materials

The Supplementary Materials are available online.

Author Contributions

J.K.-K. conceived and designed the research. J.K.-K., Ł.P., M.K. participated in laboratory analysis, data acquisition and interpretation, structural elucidation, and wrote the manuscript. J.K.-K. performed the extraction, semi-preparative HPLC separation, purified the compounds, and participated in structure elucidation and qualitative and quantitative analysis. Ł.P. participated in semi-preparative HPLC separation, carried out NMR analyses, and elucidated the structures of the isolated compounds. M.K. performed HR-LC-QTOF-MS analyses, participated in structure elucidation, qualitative and quantitative analysis, and in multivariate analyses. J.M. participated in semi-preparative HPLC separation. A.L. performed the CD analyses of the chiral compounds. All authors gave their final approval for the publication of the study.

Funding

This work has been supported by a grant of the National Science Centre, Poland (No. 2013/11/D/NZ9/02771).

Acknowledgments

The authors would like to thank Grażyna Szymczak and Dorota Misiurek (The Botanical Garden of Maria Curie-Skłodowska University in Lublin, Poland) for the donation of rhizomes of Pulmonaria officinalis, which enabled the performance of quantitative analysis during the growing season. The authors would like to thank Bartłomiej Furman (Institute of Organic Chemistry PAS, Warsaw, Poland) for granting access to the digital polarimeter, and Jerzy Żuchowski, Solomiia Kozachok and Barbara Moniuszko-Szajwaj for recording the optical rotation spectra. The authors are grateful to Tomasz Jóźwicki (Department of Agrometeorology and Applied Informatics, Institute of Soil Science and Plant Cultivation—National Research Institute, Puławy, Poland) for providing metrological data, and Barbara Ciarkowska for technical assistance.

Conflicts of Interest

The authors declare no conflict of interest.

References

  1. Hawrył, M.A.; Waksmundzka-Hajnos, M. Micro 2D-TLC of selected plant extracts in screening of their composition and antioxidative properties. Chromatographia 2013, 76, 1347–1352. [Google Scholar] [CrossRef] [PubMed]
  2. Akram, M.; Rashid, A. Anti-coagulant activity of plants: Mini review. J. Thromb. Thrombolysis 2017, 44, 406–411. [Google Scholar] [CrossRef] [PubMed]
  3. Ivanova, D.; Gerova, D.; Chervenkov, T.; Yankova, T. Polyphenols and antioxidant capacity of Bulgarian medicinal plants. J. Ethnopharmacol. 2005, 96, 145–150. [Google Scholar] [CrossRef] [PubMed]
  4. Newton, S.M.; Lau, C.; Gurcha, S.S.; Besra, G.S.; Wright, C.W. The evaluation of forty-three plant species for in vitro antimycobacterial activities; isolation of active constituents from Psoralea corylifolia and Sanguinaria canadensis. J. Ethnopharmacol. 2002, 79, 57–67. [Google Scholar] [CrossRef]
  5. Neves, J.M.; Matos, C.; Moutinho, C.; Queiroz, G.; Gomes, L.R. Ethnopharmacological notes about ancient uses of medicinal plants in Trás-os-Montes (northern of Portugal). J. Ethnopharmacol. 2009, 124, 270–283. [Google Scholar] [CrossRef] [PubMed]
  6. Šarić-Kundalić, B.; Dobeš, C.; Klatte-Asselmeyer, V.; Saukel, J. Ethnobotanical study on medicinal use of wild and cultivated plants in middle, south and west Bosnia and Herzegovina. J. Ethnopharmacol. 2010, 131, 33–55. [Google Scholar] [CrossRef] [PubMed]
  7. Leporatti, M.L.; Ivancheva, S. Preliminary comparative analysis of medicinal plants used in the traditional medicine of Bulgaria and Italy. J. Ethnopharmacol. 2003, 87, 123–142. [Google Scholar] [CrossRef]
  8. Tiţǎ, I.; Mogoşanu, G.D.; Tiţǎ, M.G. Ethnobotanical inventory of medicinal plants from the South-West of Romania. Farmacia 2009, 57, 141–156. [Google Scholar]
  9. Pielesz, A.; Paluch, J. Opatrunki aktywne—Biomateriały w badaniach glikacji kolagenu Therapeutically active dressings—Biomaterials in a study of collagen glycation. Polim. Med. 2012, 115–120. [Google Scholar] [CrossRef]
  10. Malinowska, P. Effect of flavonoids content on antioxidant activity of commercial cosmetic plant extracts. Herba Pol. 2013, 59. [Google Scholar] [CrossRef]
  11. Dweck, A.C. The function and substantiation of same natural plant materials. Herb. Arch. Lect. Soc. Cosmet. Sci. 1992, 1–43. Available online: http://www.dweckdata.com/Lectures/scs_nov_1992.pdf (accessed on 27 July 2018).
  12. Łuczaj, Ł.; Szymański, W.M. Wild vascular plants gathered for consumption in the Polish countryside: A review. J. Ethnobiol. Ethnomed. 2007, 3, 1–22. [Google Scholar] [CrossRef] [PubMed]
  13. Dreon, A.L.; Paoletti, M.G. The wild food (plants and insects) in Western Friuli local knowledge (Friuli-Venezia Giulia, North Eastern Italy). Contrib. Nat. Hist. 2009, 12, 461–488. [Google Scholar]
  14. Puusepp, L.; Koff, T. Pollen analysis of honey from the Baltic region, Estonia. Grana 2014, 53, 54–61. [Google Scholar] [CrossRef]
  15. Affek, A.N. Indicators of ecosystem potential for pollination and honey production. Ecol. Indic. 2016. [Google Scholar] [CrossRef]
  16. Brantner, A.; Kartnig, T. Flavonoid glycosides from aerial parts of Pulmonaria officinalis. Planta Med. 1995, 61, 582. [Google Scholar] [CrossRef] [PubMed]
  17. Neagu, E.; Radu, G.L.; Albu, C.; Paun, G. Antioxidant activity, acetylcholinesterase and tyrosinase inhibitory potential of Pulmonaria officinalis and Centarium umbellatum extracts. Saudi J. Biol. Sci. 2015, 578–585. [Google Scholar] [CrossRef] [PubMed]
  18. Krzyzanowska-Kowalczyk, J.; Kolodziejczyk-Czepas, J.; Kowalczyk, M.; Pecio, Ł.; Nowak, P.; Stochmal, A. Yunnaneic acid B, a component of Pulmonaria officinalis extract, prevents peroxynitrite-induced oxidative stress in vitro. J. Agric. Food Chem. 2017, 65, 3827–3834. [Google Scholar] [CrossRef] [PubMed]
  19. Kuczkowiak, U.; Petereit, F.; Nahrstedt, A. Hydroxycinnamic acid derivatives obtained from a commercial Crataegus extract and from authentic Crataegus spp. Sci. Pharm. 2014, 82, 835–846. [Google Scholar] [CrossRef] [PubMed]
  20. Parveen, I.; Winters, A.; Threadgill, M.D.; Hauck, B.; Morris, P. Extraction, structural characterisation and evaluation of hydroxycinnamate esters of orchard grass (Dactylis glomerata) as substrates for polyphenol oxidase. Phytochemistry 2008, 69, 2799–2806. [Google Scholar] [CrossRef] [PubMed]
  21. Lee, D.; Kang, S.-J.; Lee, S.-H.; Ro, J.; Lee, K.; Kinghorn, A.D. Phenolic compounds from the leaves of Cornus controversa. Phytochemistry 2000, 53, 405–407. [Google Scholar] [CrossRef]
  22. Hahn, R.; Nahrstedt, A. Hydroxycinnamic acid derivatives, caffeoylmalic and new caffeoylaldonic acid esters, from Chelidonium majus. Planta Med. 1993, 59, 71–75. [Google Scholar] [CrossRef] [PubMed]
  23. Agata, I.; Kusakabe, H.; Hatano, T.; Nishibe, S.; Ookuda, T. Melitric acids A and B, new trimeric caffeic acid derivatives from Melissa officinalis. Chem. Pharm. Bull. 1993, 41, 1608–1611. [Google Scholar] [CrossRef]
  24. Murata, T.; Watahiki, M.; Tanaka, Y.; Miyase, T.; Yoshizaki, F. Hyaluronidase inhibitors from Takuran, Lycopus lucidus. Chem. Pharm. Bull. 2010, 58, 394–397. [Google Scholar] [CrossRef] [PubMed]
  25. Ruan, M.; Li, Y.; Li, X.; Luo, J.; Kong, L. Qualitative and quantitative analysis of the major constituents in Chinese medicinal preparation Guan-Xin-Ning injection by HPLC–DAD–ESI-MSn. J. Pharm. Biomed. Anal. 2012, 59, 184–189. [Google Scholar] [CrossRef] [PubMed]
  26. Miguel, M.; Barros, L.; Pereira, C.; Calhelha, R.C.; Garcia, P.A.; Castro, M.Á.; Santos-Buelga, C.; Ferreira, I.C.F.R. Chemical characterization and bioactive properties of two aromatic plants: Calendula officinalis L. (flowers) and Mentha cervina L. (leaves). Food Funct. 2016, 7, 2223–2232. [Google Scholar] [CrossRef] [PubMed]
  27. Lee, H.J.; Cho, J.Y.; Moon, J.H. Chemical conversions of salvianolic acid B by decoction in aqueous solution. Fitoterapia 2012, 83, 1196–1204. [Google Scholar] [CrossRef] [PubMed]
  28. Exarchou, V.; Takis, P.G.; Malouta, M.; Vervoort, J.; Karali, E.; Troganis, A.N. Four new depsides in Origanum dictamnus methanol extract. Phytochem. Lett. 2013, 6, 46–52. [Google Scholar] [CrossRef]
  29. Basli, A.; Delaunay, J.-C.; Pedrot, E.; Bernillon, S.; Madani, K.; Monti, J.-P.; Mérillon, J.M.; Chibane, M.; Richard, T. New cyclolignans from Origanum glandulosum active against β-amyloid aggregation. Rec. Nat. Prod. 2014, 8, 208–216. [Google Scholar]
  30. Scher, J.M.; Zapp, J.; Becker, H. Lignan derivatives from the liverwort Bazzania trilobata. Phytochemistry 2003, 62, 769–777. [Google Scholar] [CrossRef]
  31. Parker, C.C.; Parker, M.L.; Smith, A.C.; Waldron, K.W. Thermal stability of texture in Chinese water chestnut may be dependent on 8,8′-diferulic acid (aryltetralyn form). J. Agric. Food Chem. 2003, 51, 2034–2039. [Google Scholar] [CrossRef] [PubMed]
  32. Agata, I.; Hatano, T.; Nishibe, S.; Okuda, T. Rabdosiin, a new rosmarinic acid dimer with a lignan skeleton, from Rabdosia japonica. Chem. Pharm. Bull. 1988, 36, 3223–3225. [Google Scholar] [CrossRef]
  33. Castañar, L.; Sistaré, E.; Virgili, A.; Williamson, R.T.; Parella, T. Suppression of phase and amplitude J(HH) modulations in HSQC experiments. Magn. Reson. Chem. 2015, 53, 115–119. [Google Scholar] [CrossRef] [PubMed]
  34. Yu, B.; van Ingen, H.; Vivekanandan, S.; Rademacher, C.; Norris, S.E.; Freedberg, D.I. More accurate 1JCH coupling measurement in the presence of 3JHH strong coupling in natural abundance. J. Magn. Reson. 2012, 215, 10–22. [Google Scholar] [CrossRef] [PubMed]
  35. Qiu, M.H.; Gao, J.M.; Liu, H.Q.; Fu, J.X. A new disaccharide from the fern Macrothelypteris digophlebia. Chin. Chem. Lett. 2000, 11, 1063–1064. [Google Scholar]
  36. Tanaka, T.; Nishimura, A.; Kouno, I.; Nonaka, G.I.; Yang, C.R. Four new caffeic acid metabolites, yunnaneic acids E-H, from Salvia yunnanensis. Chem. Pharm. Bull. 1997, 45, 1596–1600. [Google Scholar] [CrossRef]
  37. Janicsak, G.; Mathe, I.; Miklossy-Vari, V.; Blunden, G. Comparative studies of the rosmarinic and caffeic acid contents of Lamiaceae species. Biochem. Syst. Ekol. 1999, 27, 733–738. [Google Scholar] [CrossRef]
  38. Shekarchi, M.; Hajimehdipoor, H.; Saeidnia, S.; Gohari, A.; Hamedani, M. Comparative study of rosmarinic acid content in some plants of Labiatae family. Pharmacogn. Mag. 2012, 8, 37. [Google Scholar] [CrossRef] [PubMed] [Green Version]
  39. Bulgakov, V.P.; Inyushkina, Y.V.; Fedoreyev, S.A. Rosmarinic acid and its derivatives: Biotechnology and applications. Crit. Rev. Biotechnol. 2012, 32, 203–217. [Google Scholar] [CrossRef] [PubMed]
  40. Friedman, T. The effect of rosmarinic acid on immunological and neurological systems: A basic science and clinical review. J. Restor. Med. 2015, 4, 50–59. [Google Scholar] [CrossRef]
  41. Kim, G.-D.; Park, Y.S.; Jin, Y.-H.; Park, C.-S. Production and applications of rosmarinic acid and structurally related compounds. Appl. Microbiol. Biotechnol. 2015, 99, 2083–2092. [Google Scholar] [CrossRef] [PubMed]
  42. Nunes, S.; Madureira, A.R.; Campos, D.; Sarmento, B.; Gomes, A.M.; Pintado, M.; Reis, F. Therapeutic and nutraceutical potential of rosmarinic acid—Cytoprotective properties and pharmacokinetic profile. Crit. Rev. Food Sci. Nutr. 2017, 57, 1799–1806. [Google Scholar] [CrossRef] [PubMed]
  43. Alagawany, M.; Abd El-Hack, M.E.; Farag, M.R.; Gopi, M.; Karthik, K.; Malik, Y.S.; Dhama, K. Rosmarinic acid: Modes of action, medicinal values and health benefits. Anim. Heal. Res. Rev. 2017, 1–10. [Google Scholar] [CrossRef] [PubMed]
  44. Chen, H.; Zhang, Q.; Wang, X.; Yang, J.; Wang, Q. Qualitative analysis and simultaneous quantification of phenolic compounds in the aerial parts of Salvia miltiorrhiza by HPLC-DAD and ESI/MSn. Phytochem. Anal. 2011, 22, 247–257. [Google Scholar] [CrossRef] [PubMed]
  45. Chen, Y.S.; Yu, H.M.; Shie, J.J.; Cheng, T.J.R.; Wu, C.Y.; Fang, J.M.; Wong, C.H. Chemical constituents of Plectranthus amboinicus and the synthetic analogs possessing anti-inflammatory activity. Bioorganic Med. Chem. 2014, 22, 1766–1772. [Google Scholar] [CrossRef] [PubMed]
  46. Murata, T.; Miyase, T.; Yoshizaki, F. Hyaluronidase inhibitors from Keiskea japonica. Chem. Pharm. Bull. 2012, 60, 121–128. [Google Scholar] [CrossRef] [PubMed]
  47. Watzke, A.; O′Malley, S.J.; Bergman, R.G.; Ellman, J.A. Reassignment of the Configuration of Salvianolic Acid B and Establishment of Its Identity with Lithospermic Acid B. J. Nat. Prod. 2006, 69, 1231–1233. [Google Scholar] [CrossRef] [PubMed]
  48. Liu, A.H.; Guo, H.; Ye, M.; Lin, Y.H.; Sun, J.H.; Xu, M.; Guo, D.A. Detection, characterization and identification of phenolic acids in Danshen using high-performance liquid chromatography with diode array detection and electrospray ionization mass spectrometry. J. Chromatogr. A 2007, 1161, 170–182. [Google Scholar] [CrossRef] [PubMed]
  49. Barros, L.; Dueñas, M.; Dias, M.I.; Sousa, M.J.; Santos-Buelga, C.; Ferreira, I.C.F.R. Phenolic profiles of cultivate, in vitro cultured and commercial samples of Melissa officinalis L. infusions. Food Chem. 2013, 136, 1–8. [Google Scholar] [CrossRef] [PubMed]
  50. Li, L. Water soluble components of Danshen. In Dan Shen (Salvia Miltiorrhiza) in Medicine; Yan, X., Ed.; Springer: Dordrecht, The Netherlands, 2008; pp. 97–117. [Google Scholar]
  51. Lu, Y.; Yeap Foo, L. Polyphenolics of Salvia—A review. Phytochemistry 2002, 59, 117–140. [Google Scholar] [CrossRef]
  52. Lin, Y.L.; Chang, Y.Y.; Kuo, Y.H.; Shiao, M.S. Anti-lipid-peroxidative principles from Tournefortia sarmentosa. J. Nat. Prod. 2002, 65, 745–747. [Google Scholar] [CrossRef] [PubMed]
  53. Fecka, I.; Turek, S. Determination of polyphenolic compounds in commercial herbal drugs and spices from Lamiaceae: Thyme, wild thyme and sweet marjoram by chromatographic techniques. Food Chem. 2008, 108, 1039–1053. [Google Scholar] [CrossRef] [PubMed]
  54. Kelley, C.J.; Mahajan, R.J.; Brooks, L.C.; Neubert, L.A.; Breneman, W.R.; Carmack, M. Polyphenolic acids of Lithospermum ruderale Dougl. ex Lehm. (Boraginaceae). Isolation and structure determination of lithospermic acid. J. Org. Chem. 1975, 40, 1804–1815. [Google Scholar] [CrossRef]
  55. Liu, X.; Chen, R.; Shang, Y.; Jiao, B.; Huang, C. Lithospermic acid as a novel xanthine oxidase inhibitor has anti-inflammatory and hypouricemic effects in rats. Chem. Biol. Interact. 2008, 176, 137–142. [Google Scholar] [CrossRef] [PubMed]
  56. Lin, Y.L.; Tsay, H.J.; Lai, T.H.; Tzeng, T.T.; Shiao, Y.J. Lithospermic acid attenuates 1-methyl-4-phenylpyridine-induced neurotoxicity by blocking neuronal apoptotic and neuroinflammatory pathways. J. Biomed. Sci. 2015, 22, 1–13. [Google Scholar] [CrossRef] [PubMed]
  57. Abd-Elazem, I.S.; Chen, H.S.; Bates, R.B.; Huang, R.C.C. Isolation of two highly potent and non-toxic inhibitors of human immunodeficiency virus type 1 (HIV-1) integrase from Salvia miltiorrhiza. Antivir. Res 2002, 55, 91–106. [Google Scholar] [CrossRef]
  58. Chen, L.; Wang, W.; Wang, Y. Inhibitory effects of lithospermic acid on proliferation and migration of rat vascular smooth muscle cells. Acta Pharmacol. Sin. 2009, 30, 1245–1252. [Google Scholar] [CrossRef] [PubMed] [Green Version]
  59. Chan, K.W.K.; Ho, W.S. Anti-oxidative and hepatoprotective effects of lithospermic acid against carbon tetrachloride-induced liver oxidative damage in vitro and in vivo. Oncol. Rep. 2015, 34, 673–680. [Google Scholar] [CrossRef] [PubMed]
  60. Murata, T.; Oyama, K.; Fujiyama, M.; Oobayashi, B.; Umehara, K.; Miyase, T.; Yoshizaki, F. Diastereomers of lithospermic acid and lithospermic acid B from Monarda fistulosa and Lithospermum erythrorhizon. Fitoterapia 2013, 91, 51–59. [Google Scholar] [CrossRef] [PubMed]
  61. Odonbayar, B.; Murata, T.; Matsumoto, N.; Batkhuu, J.; Sasaki, K. Chemical constituents of aerial parts of Thymus gobicus and their cholinesterase inhibitory activities. Mong. J. Chem. 2016, 17, 1–4. [Google Scholar]
  62. Kamata, K.; Iizuka, T.; Nagai, M.; Kasuya, Y. Endothelium-dependent vasodilator effects of the extract from Salviae Miltiorrhizae radix. A study on the identification of lithospermic acid B in the extracts. Gen. Pharmacol. 1993, 24, 977–981. [Google Scholar] [CrossRef]
  63. Kang, D.G.; Oh, H.; Sohn, E.J.; Hur, T.Y.; Lee, K.C.; Kim, K.J.; Kim, T.Y.; Lee, H.S. Lithospermic acid B isolated from Salvia miltiorrhiza ameliorates ischemia/reperfusion-induced renal injury in rats. Life Sci. 2004, 75, 1801–1816. [Google Scholar] [CrossRef] [PubMed]
  64. Tanaka, T.; Nishimura, A.; Kouno, I.; Nonaka, G.I.; Young, T.J. Isolation and characterization of yunnaneic acids A-D, four novel caffeic acid metabolites from Salvia yunnanensis. J. Nat. Prod. 1996, 59, 843–849. [Google Scholar] [CrossRef]
  65. Dapkevicius, A.; Van Beek, T.A.; Lelyveld, G.P.; van Veldhuizen, A.; de Groot, A.; Linssen, J.P.H.; Venskutonis, R. Isolation and structure elucidation of radical scavengers from Thymus vulgaris leaves. J. Nat. Prod. 2002, 65, 892–896. [Google Scholar] [CrossRef] [PubMed]
  66. Clifford, M.; Johnston, K.; Knigh, S.; Kuhnert, N. Hierarchical scheme for LC-MSn identification of chlorogenic acid. J. Agric. Food Chem. 2003, 51, 2900–2911. [Google Scholar] [CrossRef] [PubMed]
  67. Clifford, M.N.; Knight, S.; Kuhnert, N. Discriminating between the six isomers of dicaffeoylquinic acid by LC-MSn. J. Agric. Food Chem. 2005, 53, 3821–3832. [Google Scholar] [CrossRef] [PubMed]
  68. Taofiq, O.; Gonzalez-Paramïas, A.M.; Barreiro, M.F.; Ferreira, I.C.F.R. Hydroxycinnamic acids and their derivatives: Cosmeceutical significance, challenges and future perspectives, a review. Molecules 2017, 22, 281. [Google Scholar] [CrossRef] [PubMed]
  69. Ovenden, S.P.B.; Yu, J.; San Wan, S.; Sberna, G.; Murray Tait, R.; Rhodes, D.; Cox, S.; Coates, J.; Walsh, N.G.; Meurer-Grimes, B.M. Globoidnan A: A lignan from Eucalyptus globoidea inhibits HIV integrase. Phytochemistry 2004, 65, 3255–3259. [Google Scholar] [CrossRef] [PubMed]
  70. Elmastas, M.; Celik, S.M.; Genc, N.; Aksit, H.; Erenler, R.; Gulcin, İ. Antioxidant activity of an anatolian herbal tea—Origanum minutiflorum: Isolation and characterization of its secondary metabolites. Int. J. Food Prop. 2018, 2912. [Google Scholar] [CrossRef]
  71. Erenler, R.; Sen, O.; Yildiz, I.; Aydın, A. Antiproliferative activities of chemical constituents isolated from Thymus praecox subsp. grossheimii (Ronniger) Jalas. Rec. Nat. Prod. 2016, 10, 766–770. [Google Scholar]
  72. Seigler, D.S.; Pauli, G.F.; Fröhlich, R.; Wegelius, E.; Nahrstedt, A.; Glander, K.E.; Ebinger, J.E. Cyanogenic glycosides and menisdaurin from Guazuma ulmifolia, Ostrya virginiana, Tiquilia plicata, and Tiquilia canescens. Phytochemistry 2005, 66, 1567–1580. [Google Scholar] [CrossRef] [PubMed]
  73. Geng, C.A.; Huang, X.Y.; Lei, L.G.; Zhang, X.M.; Chen, J.J. Chemical constituents of Saniculiphyllum guangxiense. Chem. Biodivers. 2012, 9, 1508–1516. [Google Scholar] [CrossRef] [PubMed]
  74. Yi, X.X.; Deng, J.G.; Gao, C.H.; Hou, X.T.; Li, F.; Wang, Z.P.; Hao, E.W.; Xie, Y.; Du, Z.C.; Huang, H.X.; et al. Four new cyclohexylideneacetonitrile derivatives from the hypocotyl of mangrove (Bruguiera gymnorrhiza). Molecules 2015, 20, 14565–14575. [Google Scholar] [CrossRef] [PubMed]
  75. Muhammad, A.; Sirat, H.M. COX-2 inhibitors from stem bark of Bauhinia rufescens Lam. (Fabaceae). EXCLI J. 2013, 12, 824–830. [Google Scholar] [PubMed]
  76. Yahara, S.; Uda, N.; Yoshio, E.; Yae, E. Steroidal alkaloid glycosides from tomato (Lycopersicon esculentum). J. Nat. Prod. 2004, 67, 500–502. [Google Scholar] [CrossRef] [PubMed]
  77. Cao, R.; Peng, W.; Wang, Z.; Xu, A. b-carboline alkaloids: Biochemical and pharmacological functions. Curr. Med. Chem. 2007, 14, 479–500. [Google Scholar] [CrossRef] [PubMed]
  78. Murai, F.; Tagawa, M. Relationship between ionone glycosides and terpenoids in Actinidia polygama. In Proceedings of the Abstract Papers of the 33rd Symposium on the Chemistry of Terpenes, Essential Oils, and Aromatics (TEAC), Sendai, Japan, September 1989; pp. 68–70. [Google Scholar]
  79. Otsuka, H.; Hirata, E.; Shinzato, T.; Takeda, Y. Stereochemistry of megastigmane glucosides from Glochidion zeylanicum and Alangium premnifolium. Phytochemistry 2003, 62, 763–768. [Google Scholar] [CrossRef]
  80. Samy, M.N.; Hamed, A.N.E.S.; Sugimoto, S.; Otsuka, H.; Kamel, M.S.; Matsunami, K. Officinalioside, a new lignan glucoside from Borago officinalis L. Nat. Prod. Res. 2016, 30, 967–972. [Google Scholar] [CrossRef] [PubMed]
  81. Papageorgiou, V.; Gardeli, C.; Mallouchos, A.; Papaioannou, M.; Komaitis, M. Variation of the chemical pofile and antioxidant behavior of Rosmarinus officinalis L. and Salvia fruticosa Miller grown in Greece. J. Agric. Food Chem. 2008, 56, 7254–7264. [Google Scholar] [CrossRef] [PubMed]
  82. Çirak, C.; Radušiene, J.; Ivanauskas, L.; Janulis, V. Variation of bioactive secondary metabolites in Hypericum origanifolium during its phenological cycle. Acta Physiol. Plant. 2007, 29, 197–203. [Google Scholar] [CrossRef]
  83. Tan, X.J.; Li, Q.; Chen, X.H.; Wang, Z.W.; Shi, Z.Y.; Bi, K.-S.; Jia, Y. Simultaneous determination of 13 bioactive compounds in Herba Artemisiae Scopariae (Yin Chen) from different harvest seasons by HPLC-DAD. J. Pharm. Biomed. Anal. 2008, 47, 847–853. [Google Scholar] [CrossRef] [PubMed]
  84. Skrzypczak-Pietraszek, E.; Pietraszek, J. Chemical profile and seasonal variation of phenolic acid content in bastard balm (Melittis melissophyllum L., Lamiaceae). J. Pharm. Biomed. Anal. 2012, 66, 154–161. [Google Scholar] [CrossRef] [PubMed]
  85. Skrzypczak-Pietraszek, E.; Pietraszek, J. Seasonal changes of flavonoid content in Melittis melissophyllum L. (Lamiaceae). Chem. Biodivers. 2014, 11, 562–570. [Google Scholar] [CrossRef] [PubMed]
  86. Ono, H.; Nishida, R.; Kuwahara, Y. Oviposition stimulant for a Rutaceae-feeding swallowtail butterfly, Papilio bianor (Lepidoptera: Papilionidae): Hydroxycinnamic acid derivative from Orixa japonica. Appl. Entomol. Zool. 2000, 35, 119–123. [Google Scholar] [CrossRef]
  87. Ryan, K.G.; Markham, K.R.; Bloor, S.J.; Bradley, J.M.; Mitchell, K.A.; Jordan, B.R. UVB radiation induced increase in quercetin: Kaempferol ratio in wild-type and transgenic lines of Petunia. Photochem. Photobiol. 1998, 68, 323–330. [Google Scholar] [CrossRef]
  88. Agati, G.; Brunetti, C.; di Ferdinando, M.; Ferrini, F.; Pollastri, S.; Tattini, M. Functional roles of flavonoids in photoprotection: New evidence, lessons from the past. Plant Physiol. Biochem. 2013, 72, 35–45. [Google Scholar] [CrossRef] [PubMed] [Green Version]
  89. Csepregi, K.; Hideg, É. Phenolic compound diversity explored in the context of photo-oxidative stress protection. Phytochem. Anal. 2018, 29, 129–136. [Google Scholar] [CrossRef] [PubMed]
  90. Chong, J.; Soufan, O.; Li, C.; Caraus, I.; Li, S.; Bourque, G.; Wishart, D.S.; Xia, J. MetaboAnalyst 4.0: Towards more transparent and integrative metabolomics analysis. Nucleic Acids Res. 2018, 46, 1–9. [Google Scholar] [CrossRef] [PubMed]
  91. Duncan, S.J.; Lewis, R.; Bernstein, M.A.; Sandor, P. Selective excitation of overlapping multiplets; the application of doubly selective and chemical shift filter experiments to complex NMR spectra. Magn. Reson. Chem. 2007, 45, 283–288. [Google Scholar] [CrossRef] [PubMed]
Sample Availability: Samples of the compounds and plant material are available from the authors.
Figure 1. UHPLC profile of the P. officinalis 50% MeOH fraction (numbers indicate isolated compounds).
Molecules 23 02277 g001
Figure 2. Structures of novel compounds isolated from the aerial parts of P. officinalis. (3—3-O-(E)-caffeoyl-threonic acid; 10—3′−O-(E)-feruloyl-α-sorbopyranosyl-(2′→1)-α-glucopyranoside; 14—3-O-(E)-caffeoyl-glyceric acid; 18—globoidnan B; 30—yunnaneic acid E-1; 32—pulmonarioside A; 35—pulmonarioside B; 38—pulmitric acid A; 39—pulmitric acid B; 41—isosalvianolic acid A-1).
Molecules 23 02277 g002
Figure 3. Selected HMBC correlations of compound 38.
Molecules 23 02277 g003
Figure 4. 1,1-ADEQUATE spectrum and key correlations of compound 18.
Molecules 23 02277 g004
Figure 5. Selected HMBC and NOE correlations of compound 32.
Molecules 23 02277 g005
Figure 6. Combined results of the univariate t-test, and fold change analyses of P. officinalis samples. Numbers indicate compounds isolated and characterized in this study (Figure 1 and Table 1).
Molecules 23 02277 g006
Figure 7. Scores plot (left) and loadings (right) from principal components analysis of Pulmonaria officinalis spring (red circles) and autumn (green circles) samples using untargeted metabolomics approach. Shading indicates 95% confidence intervals.
Molecules 23 02277 g007
Figure 8. Scores plot (left) and loadings (right) from the principal components analysis of Pulmonaria officinalis spring (red circles) and autumn (green circles) samples, using a targeted metabolomics approach. Shading indicates 95% confidence intervals.
Molecules 23 02277 g008
Figure 9. Result of the aggregative hierarchical clustering (Euclidian distance measure, Ward′s clustering algorithm) of Pulmonaria officinalis samples and metabolites, shown as a heatmap. Numbers correspond to compounds isolated in this study as shown in Figure 1 and Table 1, heatmap colors represent the relative concentrations in the samples from high (red) to low (blue).
Molecules 23 02277 g009
Table 1. Compounds identified in P. officinalis 50% MeOH fraction using UHPLC-QTOF-MS/MS.
NoCompound NameRT (min)FormulaError (ppm)Observed [M − H]Major Fragments (%)
1Danshensu2.9C9H10O50.31197.0455179.0350 (46), 135.0445 (27), 123.0456 (23)
2Menisdaurin3.7C14H19NO717.6312.1086132.0378 (100), 294.0830 (4)
33-O-(E)-caffeoyl-threonic acid4.5C13H14O8−1.22297.0619135.0293 (100), 179.0361 (21), 161.0263 (6)
42-O-(E)-caffeoyl-l-threonic acid5C13H14O81.64.4297.0611135.0293 (100), 179.0346 (17), 161.0245 (11)
5Lycoperodine-15.3C12H12N2O20.52.3215.0825171.0926 (28), 142.0655 (5), 116.0509 (6)
6Chlorogenic acid5.7C16H18O9−15.7353.0882191.0567 (100)
7Actinidioionoside5.9C19H34O914.2405.2126225.1494 (10); 179.0560 (10); 167.1073 (11)
8Caffeic acid6C9H8O4−1.61.8179.0262135.0372 (95)
9Cryptochlorogenic acid6.2C16H18O9−1.18.9353.0882191.0567 (100), 179.0355 (88), 173.0459 (83)
103′−O-(E)-feruloyl-α-sorbopyranosyl-(2′→1)-α-glucopyranoside6.3C22H30O14−1.77.6517.1572341.1105 (24); 175.0407 (100); 160.0172 (57)
112-O-(E)-caffeoyl-d-glyceric acid 6.8C12H12O711.4267.0508161.0242 (100), 133.0288 (14), 179.0356(11)
124-O-(E)-caffeoyl-l-threonic acid6.9C13H14O8−0.18.3297.0616135.0293 (100), 179.0355 (44), 161.0237 (9)
13Neochlorogenic acid7.0C16H18O9012.1353.0882191.0567 (100)
143-O-(E)-caffeoyl-glyceric acid7.1C12H12O70.67.1267.0509179.0352 (24); 161.0244 (100); 135.0446 (21)
153-O-p-coumaroylquinic acid7.2C16H18O81.410.8337.0924191.0560 (100); 163.0398 (5)
164-O-p-coumaroylquinic acid7.4C16H18O80.819.4337.0926191.0552 (16); 173.0455 (100); 163.0410 (20)
175-O-p-coumaroylquinic acid8.4C16H18O81.417.7337.0924191.0561 (100)
18Globoidnan B9.7C27H22O12−1.38.3537.1046493.1135 (24); 339.0503 (100); 295.0604 (58)
19Rutin10.2C27H30O16−0.510.9609.1464300.0277 (68), 271.0249 (100)
20Nicotiflorin isomer10.4C27H30O151.88593.1501284.0320 (83); 255.0295 (100)
21Quercetin 3-O-β-glucoside10.5C21H20O12−2.18.4463.0892300.0284 (100), 271.0256 (100)
22Yunnaneic acid E10.9C27H24O140.24.9571.1092527.1195 (23), 285.0766 (100), 241.0867 (81)
23Quercetin 3-O-(6″-O-malonyl)-β-glucoside11.2C24H22O151.75.6549.0876505.0976 (70), 300.0273 (88)
24Nicotiflorin11.4C27H30O151.513.1593.1503284.0317 (65), 255.0290 (88)
25Astragalin 11.7C21H20O11−1.65.6447.094284.0328 (42), 255.0301 (93)
26Shimobashiric acid C11.9C36H32O161.521.6719.1607359.0766 (100), 161.0239 (11), 539.1191 (6)
27Rosmarinic acid12.4C18H16O8−0.26.4359.0773161.0247 (100), 197.0455 (87), 179.0345 (33)
28Kaempferol 3-O-(6″-O-malonyl)-β-glucoside12.6C24H22O14−0.58.1533.094489.1044 (54), 284.0328 (89)
29Monardic acid A12.7C27H22O120.615537.1035493.1128 (4); 295.0628 (100); 185.0240 (25)
30Yunnaneic acid E-112.9C26H22O11−19509.1094329.0672 (40); 285.0768 (100); 135.0445 (38)
31Lithospermic acid A13C27H22O12−2.95.6537.1054493.1131 (6); 295.0601 (100); 185.0240 (25)
32Pulmonarioside A13.3C47H52O24115.9999.2766853.2179 (100), 809.2258 (16), 485.1282 (37)
33Salvianolic acid H13.5C27H22O120.917537.1034493.1123 (22); 359.0763 (69); 295.0605 (100)
34Lithospermic acid B13.7C36H30O162.49.9717.1444519.0915 (63); 321.0392 (100)
35Pulmonarioside B13.9C48H54O24−1.315.21013.2946867.2370 (89); 823.247 (98); 499.1469 (53)
36Yunnaneic acid B14C54H46O25062.21093.2255537.1043 (100); 555.1151 (40); 295.0613 (8)
37Globoidnan A14.9C26H20O10111.6491.0979311.0557 (100), 267.0658 (79)
38Pulmitric acid A15C28H24O120.942.8551.119463.1394 (34); 295.0608 (100); 255.0657 (60)
39Pulmitric acid B15.3C27H20O12−0.513.6535.0885359.0768 (38); 177.0197 (100)
40Isosalvianolic acid A15.6C26H22O102.318.9493.1134295.0601 (100); 185.0250 (15)
41Isosalvianolic acid A-115.7C26H22O101.34.5493.1134295.0601 (100); 185.0250 (21)
42Isosalvianolic acid A isomer15.8C26H22O10−10.439493.1134295.0601 (100); 359.0775 (36); 185.0250 (11)
43Rosmarinic acid methyl ester15.9C19H18O8−0.910.5373.0932179.0353 (53); 135.0445 (25)
44Salvianolic acid H-9″-methylester 16.4C28H24O12110.9551.1189519.0919 (15); 359.0766 (48); 193.0502 (100)
45Lycopic acid C20.6C27H19O111.625.6519.0933339.0499 (100),161.0227 (14), 179.0337 (5)
Table 2. 1H and 13C-NMR data (MeOH-d4, 500/125 MHz) for compounds 3 and 14.
Position314
δH (J in Hz)δCδH (J in Hz)δC
1 175.4 174.8
24.47 d (2.5)70.54.44 br d (6.0)70.3
35.34 ddd (6.8, 6.3, 2.5)75.84.46 m, 4.38 m66.9
43.81 dd (11.2, 6.8)
3.75 dd (11.2, 6.3)
60.9
1′ 127.8 127.7
2′7.04 d (2.1)115.17.04 d (2.1)115.1
3′ 146.8 146.8
4′ 149.6 149.7
5′6.77 d (8.2)116.56.78 d (8.2)116.5
6′6.94 dd (8.2, 2.1)123.06.94 dd (8.2, 2.1)123.0
7′7.59 d (15.9)147.57.58 d (15.9)147.4
8′6.26 d (15.9)114.86.27 d (15.9)114.6
9′ 168.3 168.9
Table 3. 1H and 13C-NMR data (MeOH-d4 + 0.1% TFA, 500/125 MHz) for compounds 3841.
Position383940/41
δH (J in Hz)δCδH (J in Hz)δCδH (J in Hz)δC
1 137.2 128.2 134.7
26.98 br s115.37.35 d (2.1)121.56.87 d (1.8)114.1
3 145.6 144.1 146.5
4 145.9 152.4 146.5
56.67 d (8.1)116.76.99 d (8.3)118.86.76 d (8.2)116.3
66.84 dd (8.1, 2.1)123.97.37 dd (8.3, 2.1)127.96.78 dd (8.2, 1.8)118.9
72.99 dd (15.4, 8.5)
2.96 dd (15.4, 7.6)
40.17.59 d (15.9)146.45.71 dd (9.4,8.1)86.2
84.83 t (8.2)39.36.36 d (15.9)115.93.74 dd (15.9, 9.4)
3.26 dd (15.9, 8.1)
39.3
9 174.5 168.1--
9-OMe3.54 s52.1
1′ 129.4 129.2 123.8
2′6.52 d (1.9)114.86.73 d (2.1)117.6 129.8
3′ 146.4 146.1 148.3
4′ 142.6 145.3 145.0
5′ 132.86.68 d (8.1)116.36.72 d (8.4)117.1
6′6.72 br s120.06.60 dd (8.1, 2.1)121.87.06 d (8.4)123.0
7′3.15 dd (14.2, 1.6)
2.98 dd (14.2, 11.4)
38.83.08 dd (14.2, 4.3)
2.99 dd (14.2, 8.3)
37.97.62 d (16.0)145.2
8′5.23 dd (11.4, 1.6)75.35.18 dd (8.3, 4.3)74.76.25 d (16.0)115.9
9′ 172.7 173.4 168.3
1′′ 126.0 112.6 129.2
2′′7.40 d (2.1)118.0 146.86.74 d (2.1)117.6
3′ 146.36.79 s103.5 146.2
4′′ 148.5 149.8 145.3
5′′6.79 d (8.3)116.4 144.86.69 d (8.1)116.3
6′′7.16 dd (8.3, 2.1)124.76.81 s112.46.60 dd (8.1, 2.1)121.8
7′′7.13 s127.07.03 s123.83.09 dd (14.3, 4.3)
3.00 dd (14.3, 8.4)
37.9
8′′ 140.2 140.95.19 dd (8.4, 4.3)74.6
9′′ 164.2 160.2 173.4
Table 4. 1H and 13C-NMR data (MeOH-d4, 500/125 MHz) for compounds 18, 32 and 35.
Position183235
δH (J in Hz)δCδH (J in Hz)δCδH (J in Hz)δC
14.40 d (2.8)46.94.34 dd (15.3, 1.0)48.14.34 dd (15.0, 1.4)48.1
23.84 d (2.8)48.64.21 dd (15.3, 2.5)51.74.21 dd (15.2, 2.5)51.6
3 122.7 126.2 126.1
47.58 s140.37.39 d (2.5)140.37.39 d (2.5)140.3
4a 124.9 124.1 124.0
56.83 s117.26.73 s113.66.68 s113.6
6 145.6 147.7 147.7
7 149.2 150.1 150.2
86.55 br s117.26.11 s116.16.11 t (0.9)116.2
8a 131.6 134.7 134.7
9 168.0 168.1 168.0
10 176.2 176.4 176.3
6-OMe 3.79 s56.63.77 s56.6
1′ 136.3 133.5 133.5
2′6.43 d (2.2)115.86.87 d (2.0)114.56.87 d (2.0)114.4
3′ 146.0 149.0 149.0
4′ 144.9 146.7 146.7
5′6.62 d (8.2)116.36.90 d (8.1)116.96.89 d (8.1)116.9
6′6.39 dd (8.2, 2.2)119.96.81 dd (8.1, 2.0)123.36.81 dd (8.1, 2.0)123.4
3′-OMe--3.84 s56.83.84 s56.8
1′′ 129.13.90 d (12.4)
3.72 d (12.4)
63.23.89 d (12.4)
3.72 d (12.4)
63.3
2′′6.71 d (2.1)117.6 110.1 110.1
3′ 146.14.63 o81.94.62 s82.0
4′′ 145.24.63 o73.54.66 d (0.9)73.5
5′′6.68 d (8.1)116.44.24 br d (2.4)87.54.24 t (1.4)87.5
6′′6.56 dd (8.1, 2.1)122.04.71 dd (12.4, 2.4)
4.08 d (12.4)
66.44.69 dd (12.2, 2.5)
4.09 d (12.2)
66.4
7′′3.04 dd (14.3, 5.3)
3.00 dd (14.3, 7.2)
37.9
8′′5.12 dd (7.2, 5.2)74.9
9′′
1′′′ 5.35 d (3.6)94.45.35 d (3.6)94.4
2′′′ 3.46 dd (9.6, 3.6)73.43.46 dd (9.6, 3.6)73.4
3′′′ 3.64 t (9.2)75.03.65 t (9.2)75.0
4′′′ 3.31 dd (10.0, 8.9)72.03.29 dd (10.0, 9.0)72.2
5′′′ 4.32 ddd (9.6, 6.5, 2.2)72.34.33 ddd (9.8, 7.0, 2.4)72.3
6′′′ 4.48 dd (12.0, 2.2)
4.16 dd (12.0, 6.5)
65.54.47 dd (11.9, 2.4)
4.16 dd (11.9, 7.0)
65.8
1′′′′ 130.6 130.8
2′′′′ 7.07 d (2.1)116.57.26 d (2.0)112.4
3′′′′ 148.7 152.0
4′′′′ 147.9 149.0
5′′′′ 7.18 d (8.4)118.07.17 d (8.4)118.6
6′′′′ 7.01 dd (8.4, 2.1)122.27.09 dd (8.4, 2.0)123.7
7′′′′ 7.47 d (15.9)146.37.53 d (15.9)146.3
8′′′′ 6.21 d (15.9)116.86.29 d (15.9)117.0
9′′′′ 168.9 168.9
3′′″-OMe 3.92 s56.7
1′′′′′ 5.50 d (1.8)100.75.48 d (1.8)100.8
2′′′′′ 4.14 dd (3.5, 1.8)71.84.10 dd (3.5, 1.8)71.9
3′′′′′ 3.98 dd (9.5, 3.5)72.13.92 dd (9.5, 3.5)72.2
4′′′′′ 3.49 t (9.5)73.83.48 t (9.5)73.7
5′′′′′ 3.74 dq (9.5, 6.2)70.93.76 dq (9.5, 6.2)71.0
6′′′′′ 1.25 d (6.2)18.01.24 d (6.2)18.0
Table 5. 1H and 13C-NMR data (MeOH-d4, 500/125 MHz) for compounds 10 and 30.
Position1030 *
δH (J in Hz)δCδH (J in Hz)δC
15.44 d (3.7)93.3 141.2
23.43 dd (9.8, 3.7)73.27.87 d (2.0)131.4
33.66 t (9.4)75.0 132.5
43.40 dd (9.9, 8.9)71.2 142.1
53.93 ddd (9.9, 4.5, 2.5)74.67.19 d (8.0)133.3
63.85 dd (12.0, 2.5)
3.77 dd (12.0, 4.5)
62.47.67 dd (8.0, 2.0)132.7
7 3.25 m, 3.17 m29.8
8 2.70 m36.1
9 173.8
10 192.0
11 167.8
1′3.66 d (12.2)
3.59 d (12.2)
65.4 132.4
2′ 104.87.04 d (2.2)114.8
3′5.46 d (7.9)79.7 146.9
4′4.38 t (7.9)73.9 146.8
5′3.93 ddd (7.9, 5.6, 3.5)84.26.85 d (8.2)116.9
6′3.84 dd (12.3, 5.6)
3.80 dd (12.3, 3.5)
62.96.94 dd (8.2, 2.2)119.4
1′′ 127.7 129.2
2′′7.23 d (2.0)112.16.73 d (2.1)117.5
3′′ 149.4 146.2
4′′ 150.7 145.4
5′′6.81 d (8.3)116.56.70 d (8.1)116.4
6′′7.14 dd (8.3, 2.0)124.26.59 dd (8.1, 2.1)121.9
7′′7.71 d (15.9)147.73.07 dd (14.3, 4.0)
2.93 dd (14.3, 8.9)
37.8
8′′6.43 d (15.9)115.15.10 dd (8.9, 4.0)74.8
9′′ 168.3 173.2
3″-OMe3.91 s56.5
* analyzed with an addition of 0.1% TFA.
Table 6. Comparison of metabolite content observed in spring and autumn extracts of P. officinalis aerial parts.
No.Compound NameContents [µg/g DW] (Mean ± SD, n = 3)
SpringAutumn
1Danshensu20.6 ± 0.259.5 ± 4.6
2Menisdaurin107.3 ± 3.6ND
33-O-(E)-caffeoyl-threonic acid90.4 ± 1.827.7 ± 2.0
42-O-(E)-caffeoyl-l-threonic acid567.4 ± 33.1123.5 ± 19.7
5Lycoperodine-18.1 ± 0.8ND
6Chlorogenic acid240.9 ± 12.3330.7 ± 16.6
7Actinidioionoside26.1 ± 6.8397.0 ± 15.4
8Caffeic acid23.3 ± 0.8119.5 ± 8.8
9Cryptochlorogenic acid5.5 ± 0.830.9 ± 2.4
103′-O-(E)-feruloyl-α-sorbopyranosyl-(2′→1)-α-glucopyranoside14.8 ± 0.823.0 ± 1.4
112-O-(E)-caffeoyl-d-glyceric acid465.3 ± 22.7227.8 ± 11.2
124-O-(E)-caffeoyl-l-threonic acid48.6 ± 3.020.4 ± 1.4
13Neochlorogenic acid28.4 ± 1.737.8 ± 3.7
143-O-(E)-caffeoyl- glyceric acid18.4 ± 1.57.1 ± 1.1
153-O-p-coumaroylquinic acid111.6 ± 6.3362.9 ± 24.1
164-O-p-coumaroylquinic acid TR13.9 ± 0.8
175-O-p-coumaroylquinic acid 152.6 ± 10.7420.4 ± 29.8
18Globoidnan B6843.6 ± 853.43797.6 ± 845.4
19Rutin369.9 ± 9.457.1 ± 18.4
20Nicotiflorin isomer3.1 ± 0.3ND
21Quercetin 3-O-β-glucoside253.6 ± 7.1227.7 ± 10.5
22Yunnaneic acid E103.0 ± 3.8183.1 ± 33.7
23Quercetin 3-O-(6″-O-malonyl)-β-glucoside1563.4 ± 109.2858.8 ± 44.5
24Nicotiflorin184.8 ± 4.569.7 ± 4.8
25Astragalin146.6 ± 3.2513.3 ± 28.2
26Shimobashiric acid C1188.0 ± 46.21797.8 ± 115.0
27Rosmarinic acid7002.1 ± 345.812201.5 ± 503.2
28Kaempferol 3-O-(6″-O-malonyl)-β-glucoside731.6 ± 45.51567.2 ± 86.3
29Monardic acid A806.8 ±168.5971.7 ± 75.0
30Yunnaneic acid E-1NANA
31Lithospermic acid A609.7 ± 110.7576.3 ± 37.8
32Pulmonarioside A18.0 ± 1.591.5 ± 5.1
33Salvianolic acid H29.6 ± 9.3261.9 ± 17.3
34Lithospermic acid BNANA
35Pulmonarioside B147.5 ± 12.8199.6 ± 5.7
36Yunnaneic acid B216.8 ± 29.31834.6 ± 40.5
37Globoidnan A21.7 ± 3.527.1 ± 2.2
38Pulmitric acid ATRTR
39Pulmitric acid BTRTR
40Isosalvianolic acid ATR0.7 ±0.1
41Isosalvianolic acid A-1TRTR
42Isosalvianolic acid A isomer TR1.8 ± 0.3
43Rosmarinic acid methyl ester15.4 ± 0.915.8 ± 1.4
44Salvianolic acid H-9″-methylester5.6 ± 2.931.5 ± 4.1
45Lycopic acid CNANA
TR—traces, indicates level below the limit of quantification; NA—not analyzed; ND—not detected.
Table 7. Meteorological data for April and September of 2015.
Meteorological Data for GPS Coordinates: 51°24′47.5″ N, 21°57′54.7″ E
April 2015September 2015
Average temperature (°C)8.615.3
Average minimal (°C)4.011.8
Average maximal (°C)13.920.2
Rainfall (mm)28.5126
Humidity (%)7889

