Quality Evaluation of Phellodendri Chinensis Cortex by Fingerprint–Chemical Pattern Recognition


Abstract
:1. Introduction
2. Methods
2.1. Materials and Reagents
2.2. Sample Preparation
2.3. Chromatography Analysis
2.4. HPLC Methodological Evaluation
2.5. Software
3. Results
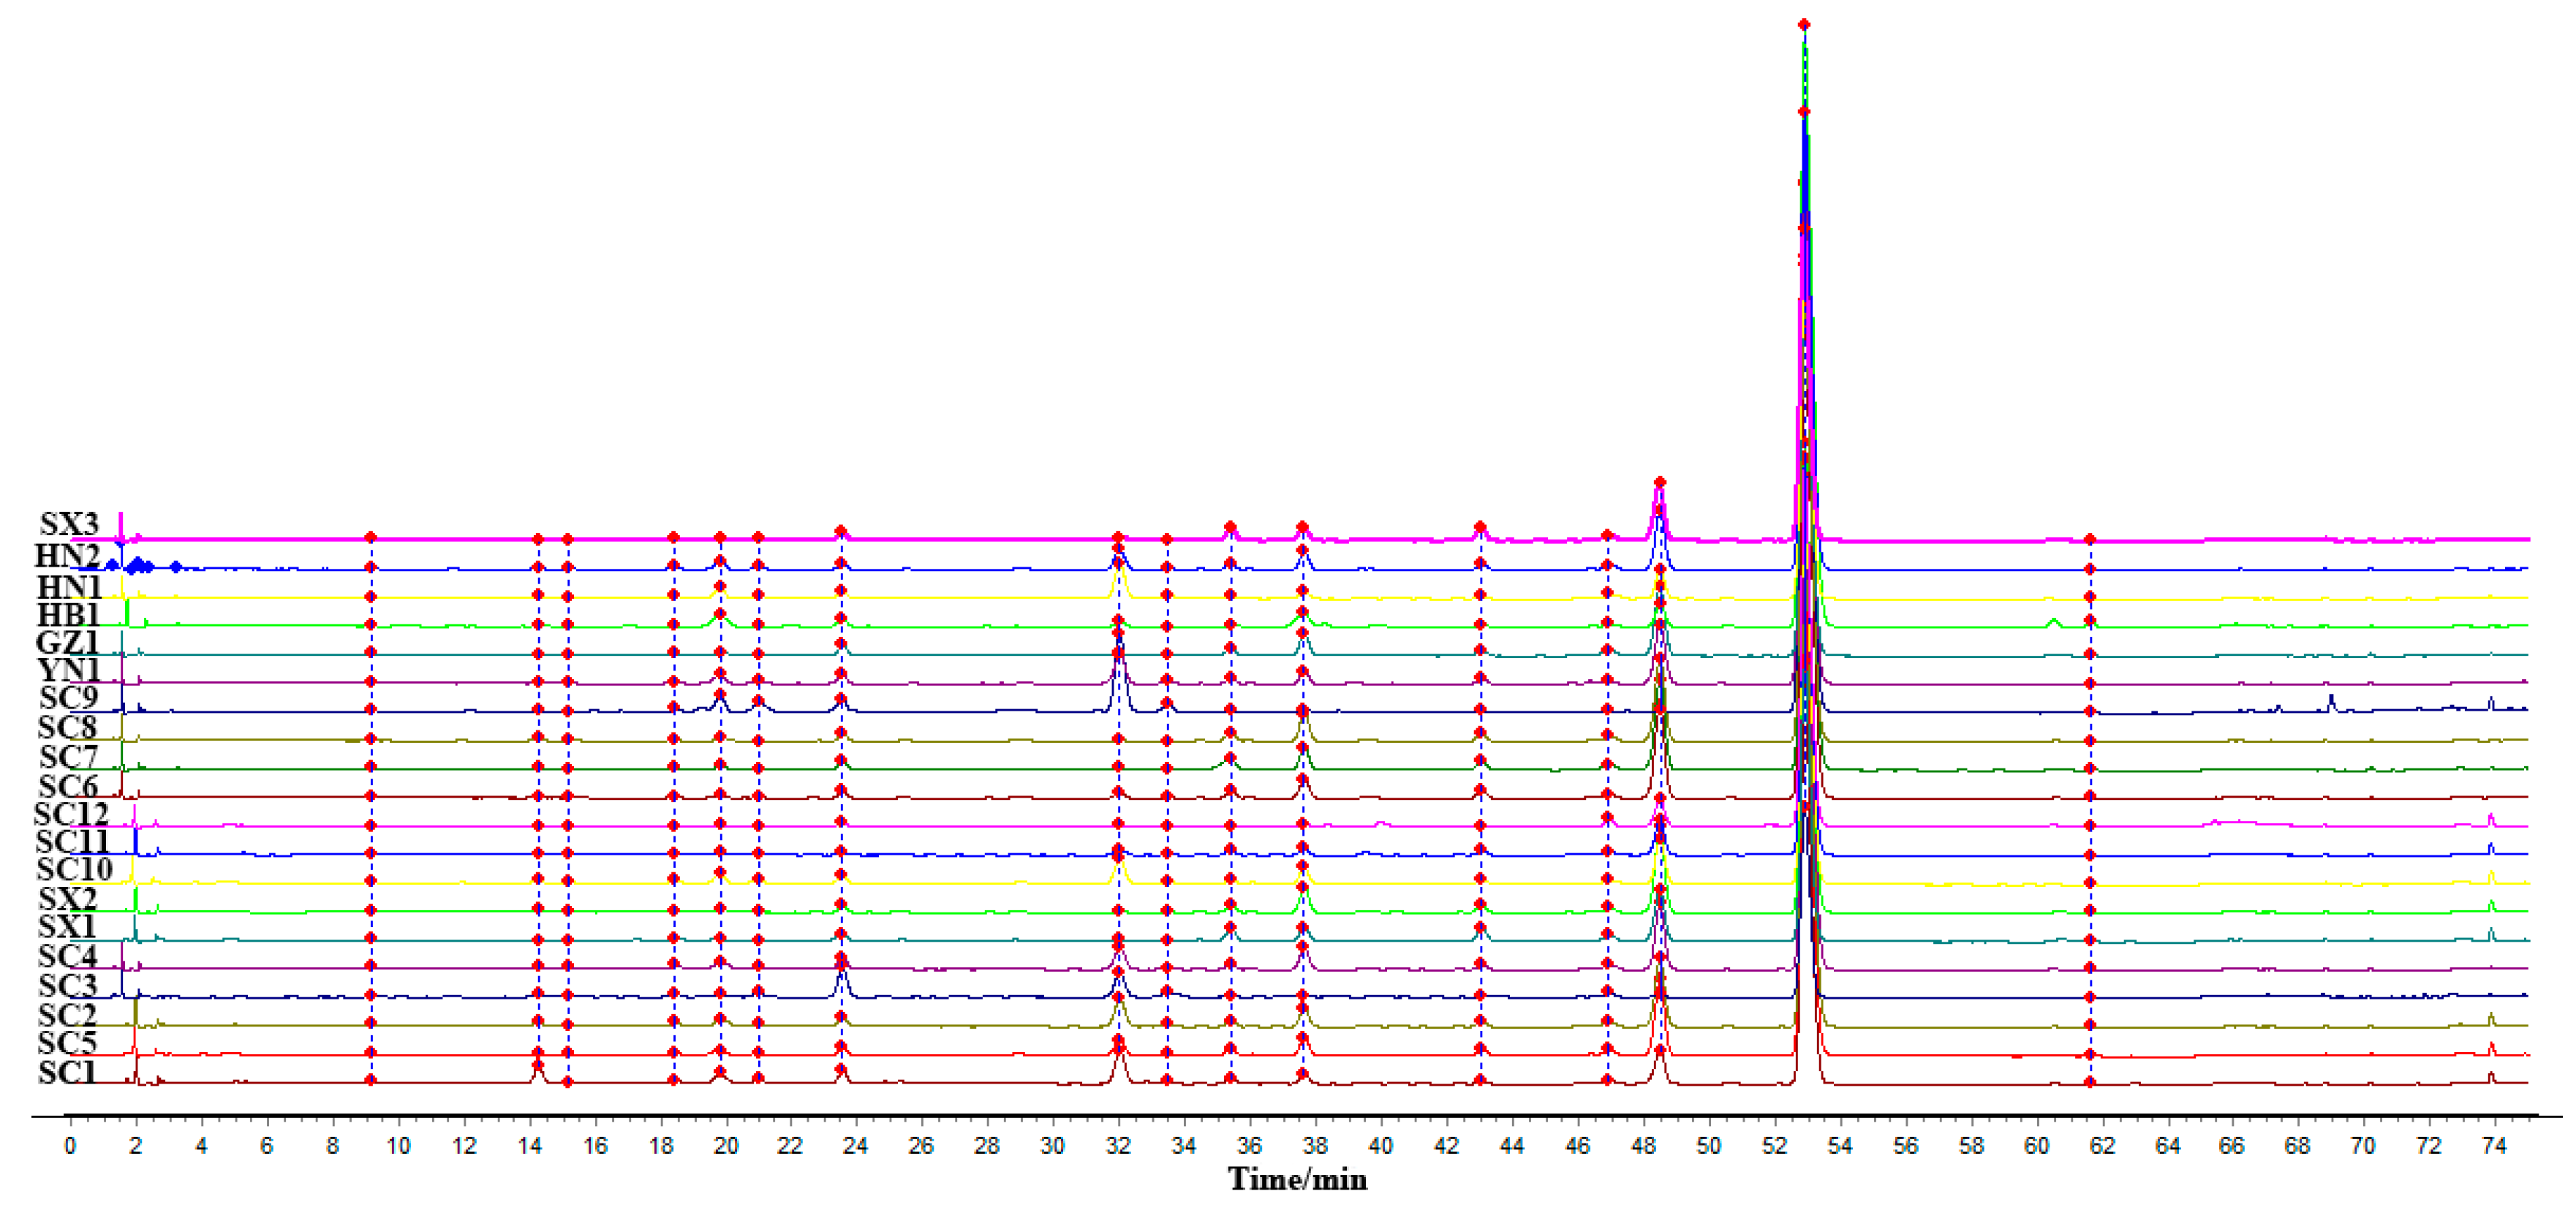
3.1. Similarity Evaluation
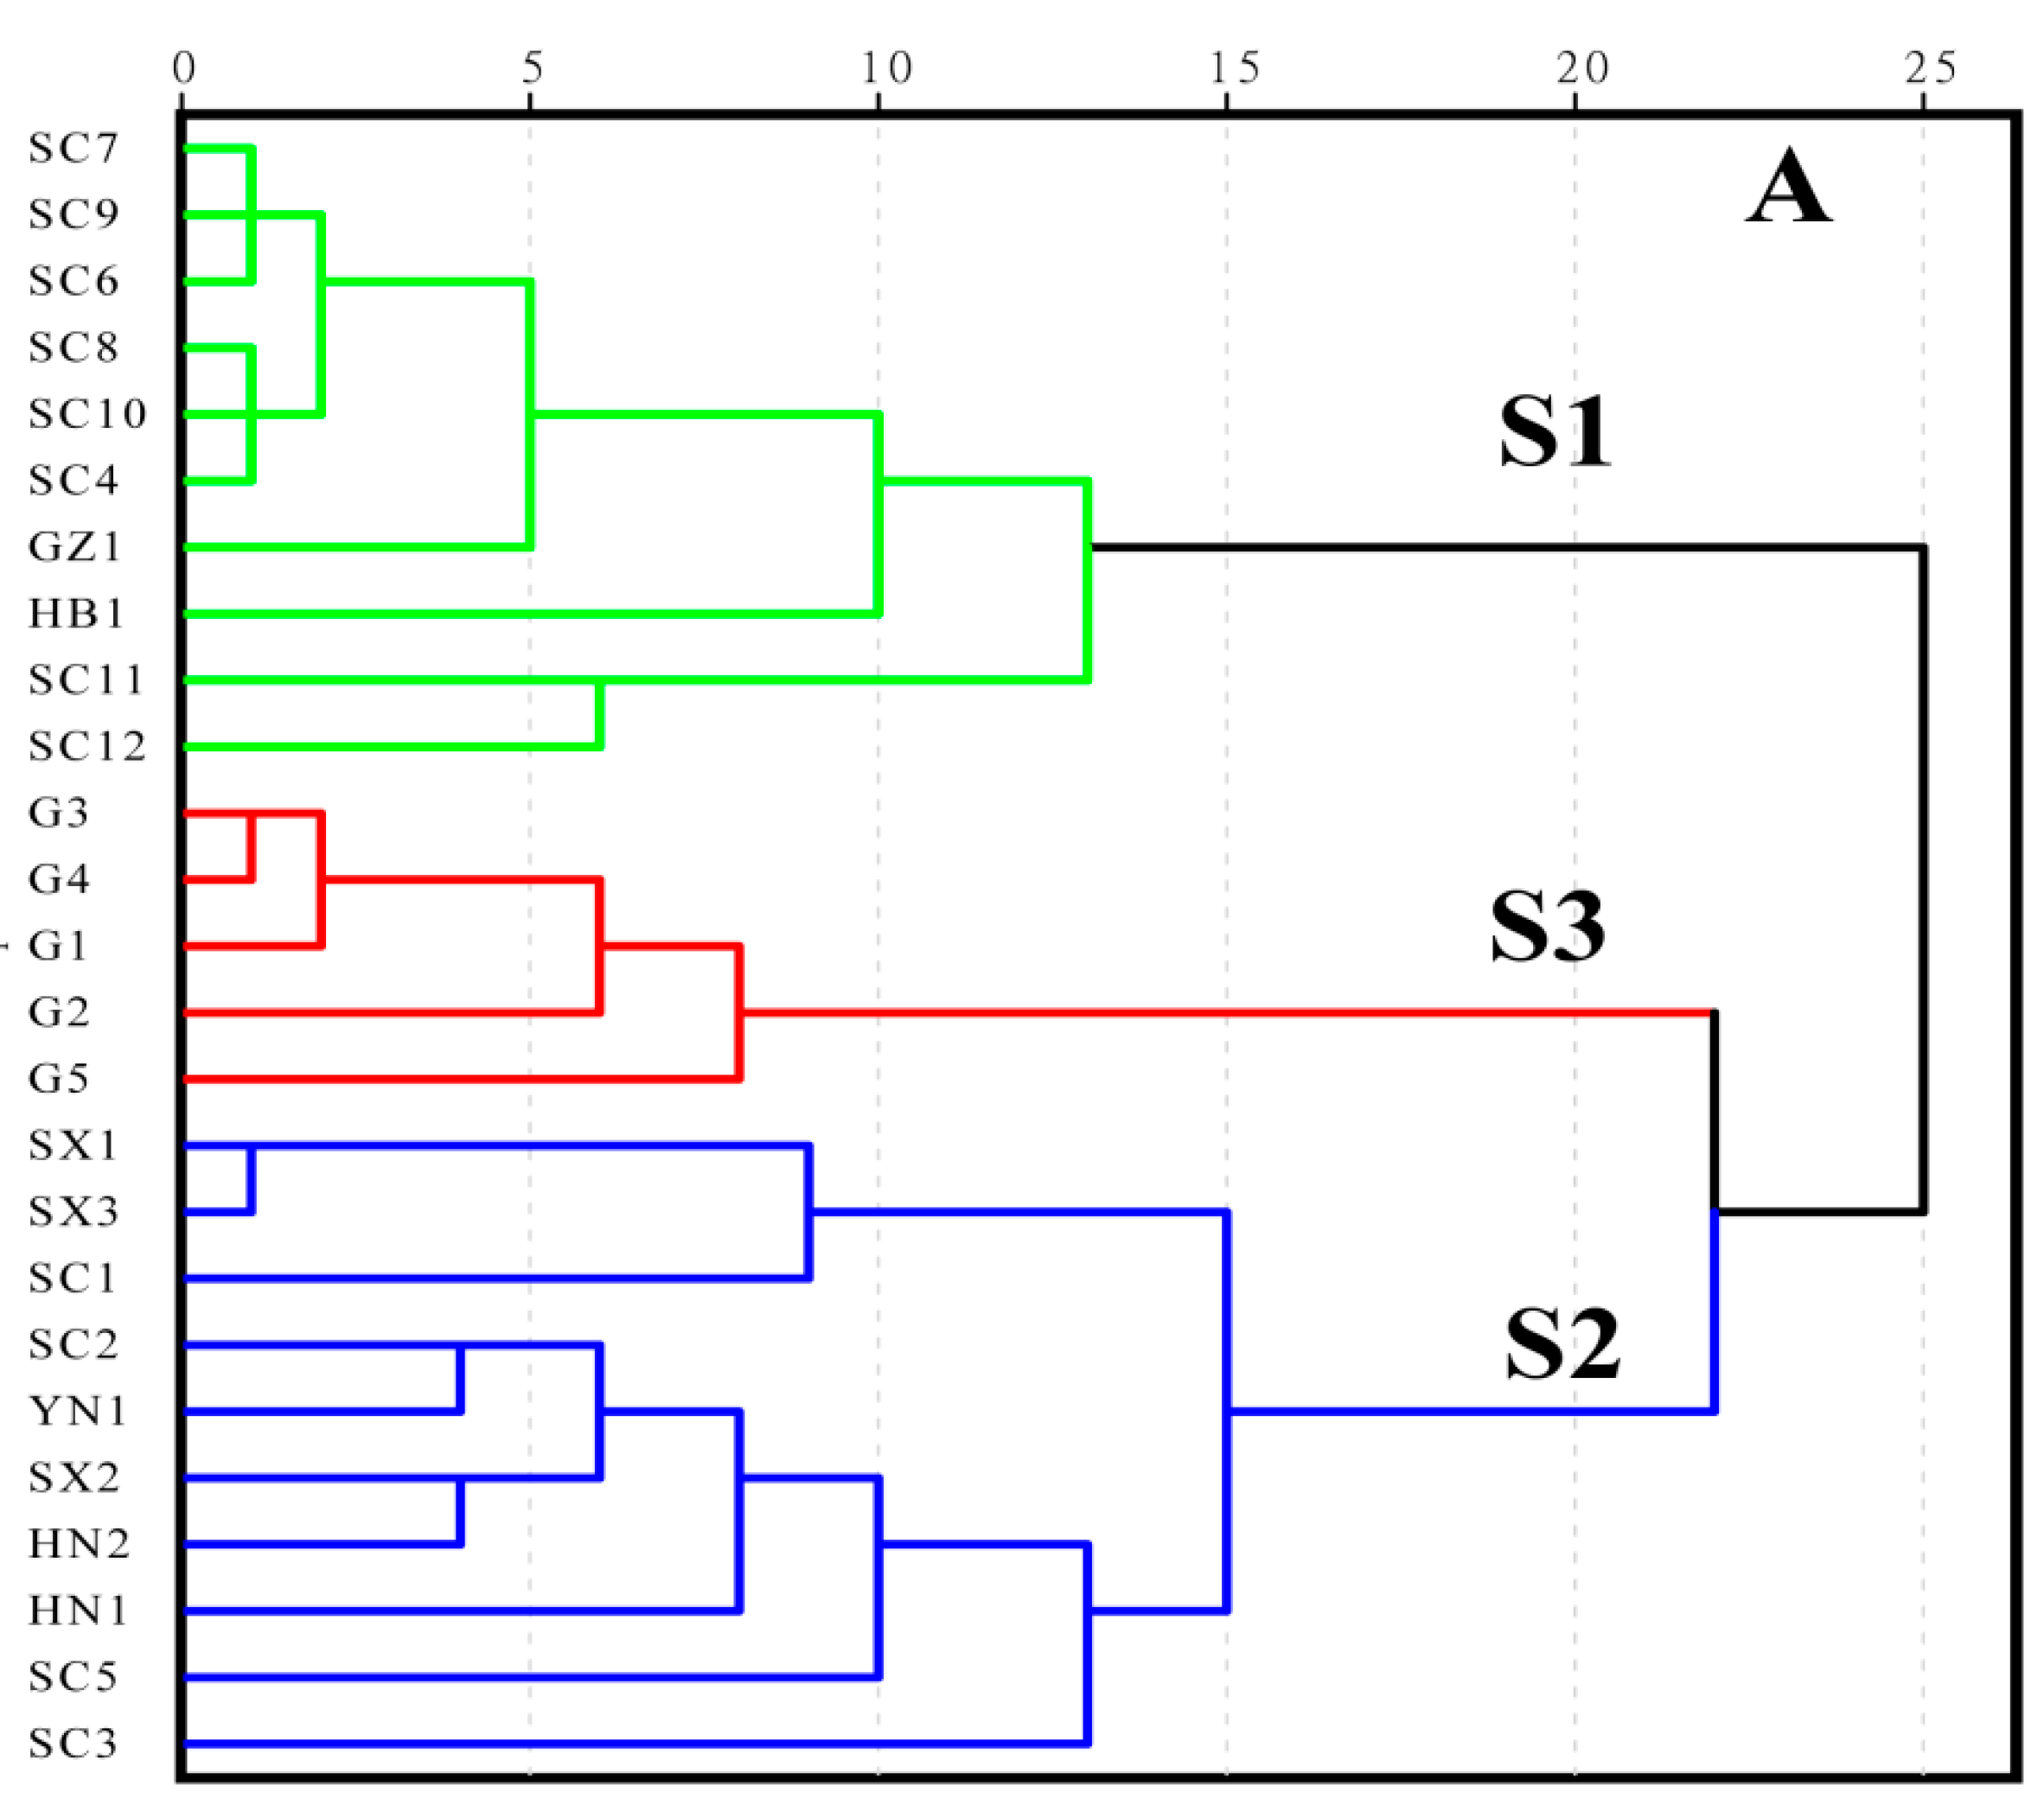
3.2. HCA Modeling
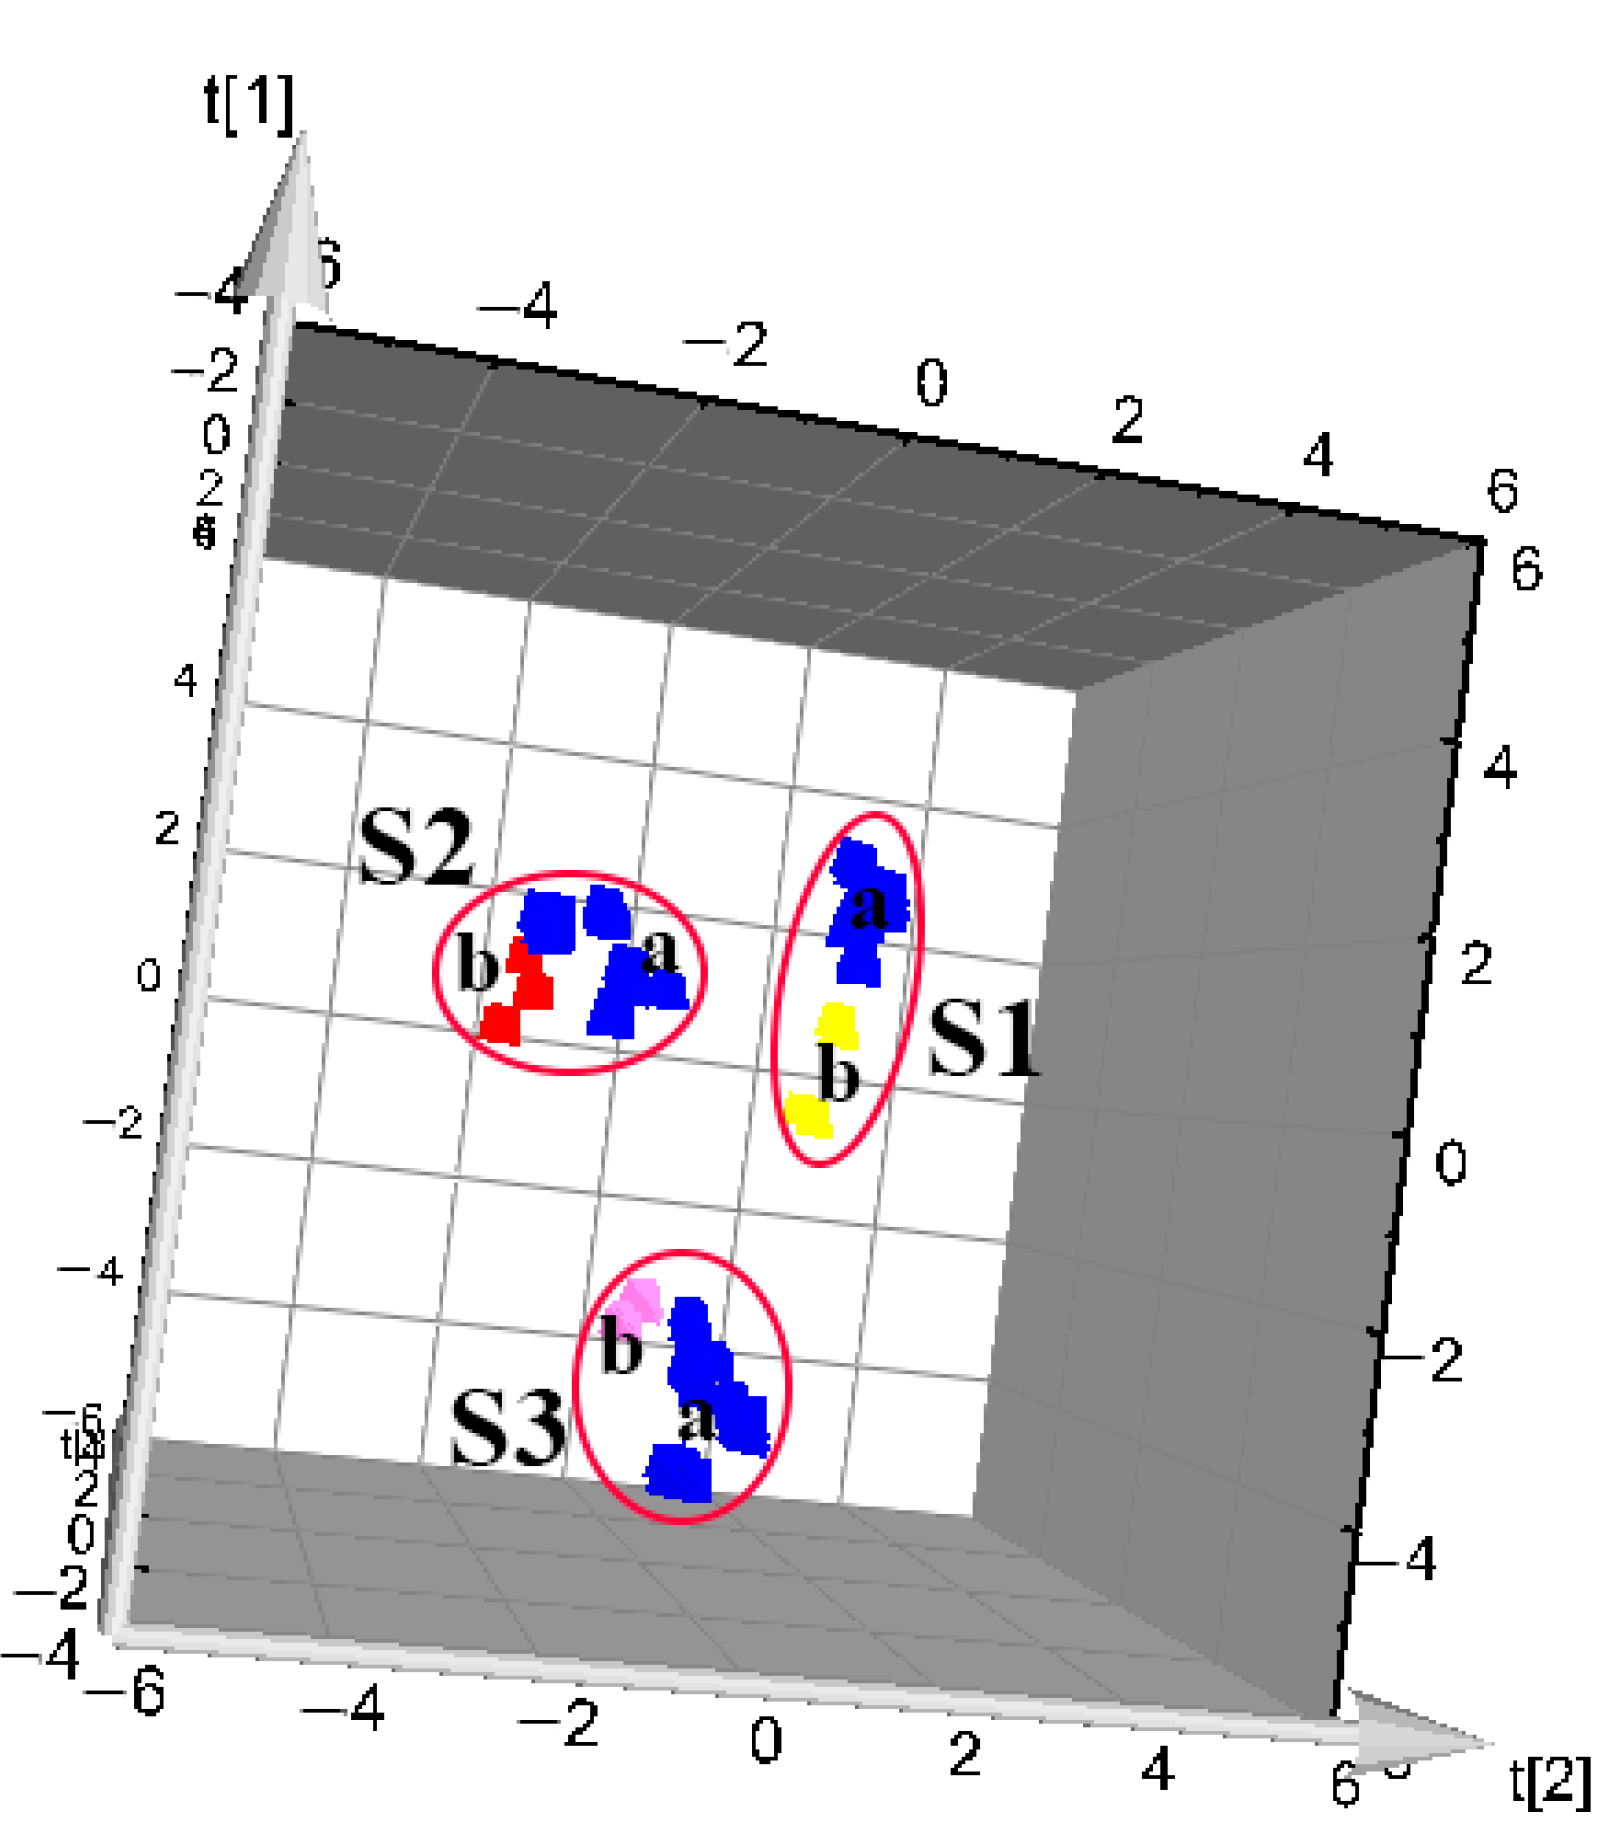
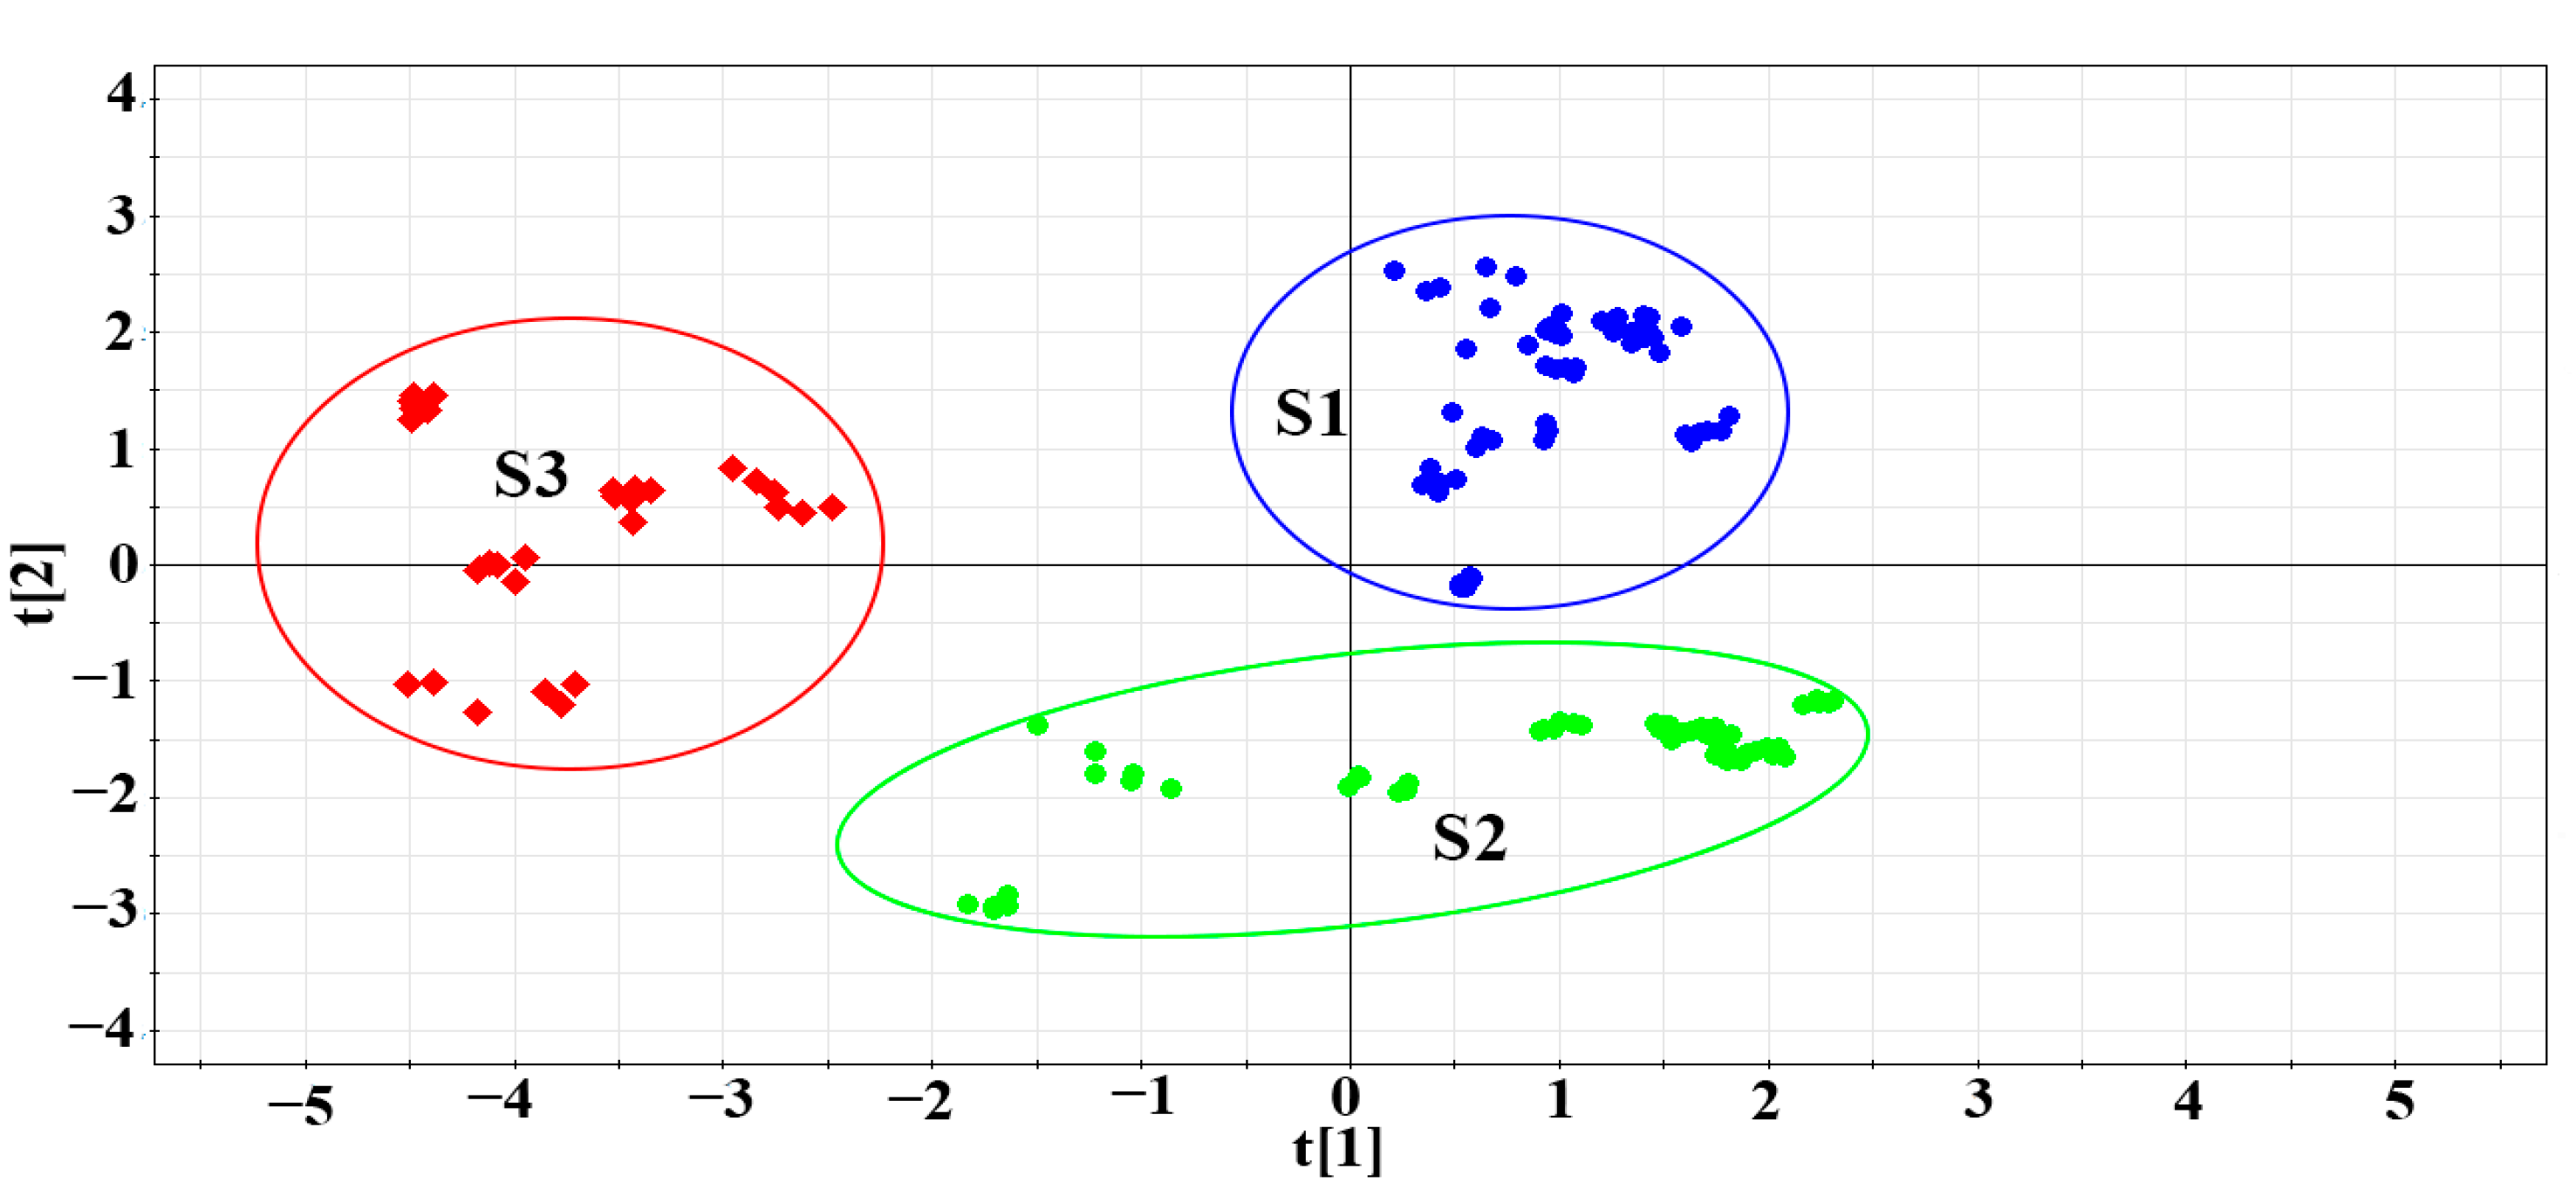
3.3. PCA Modeling
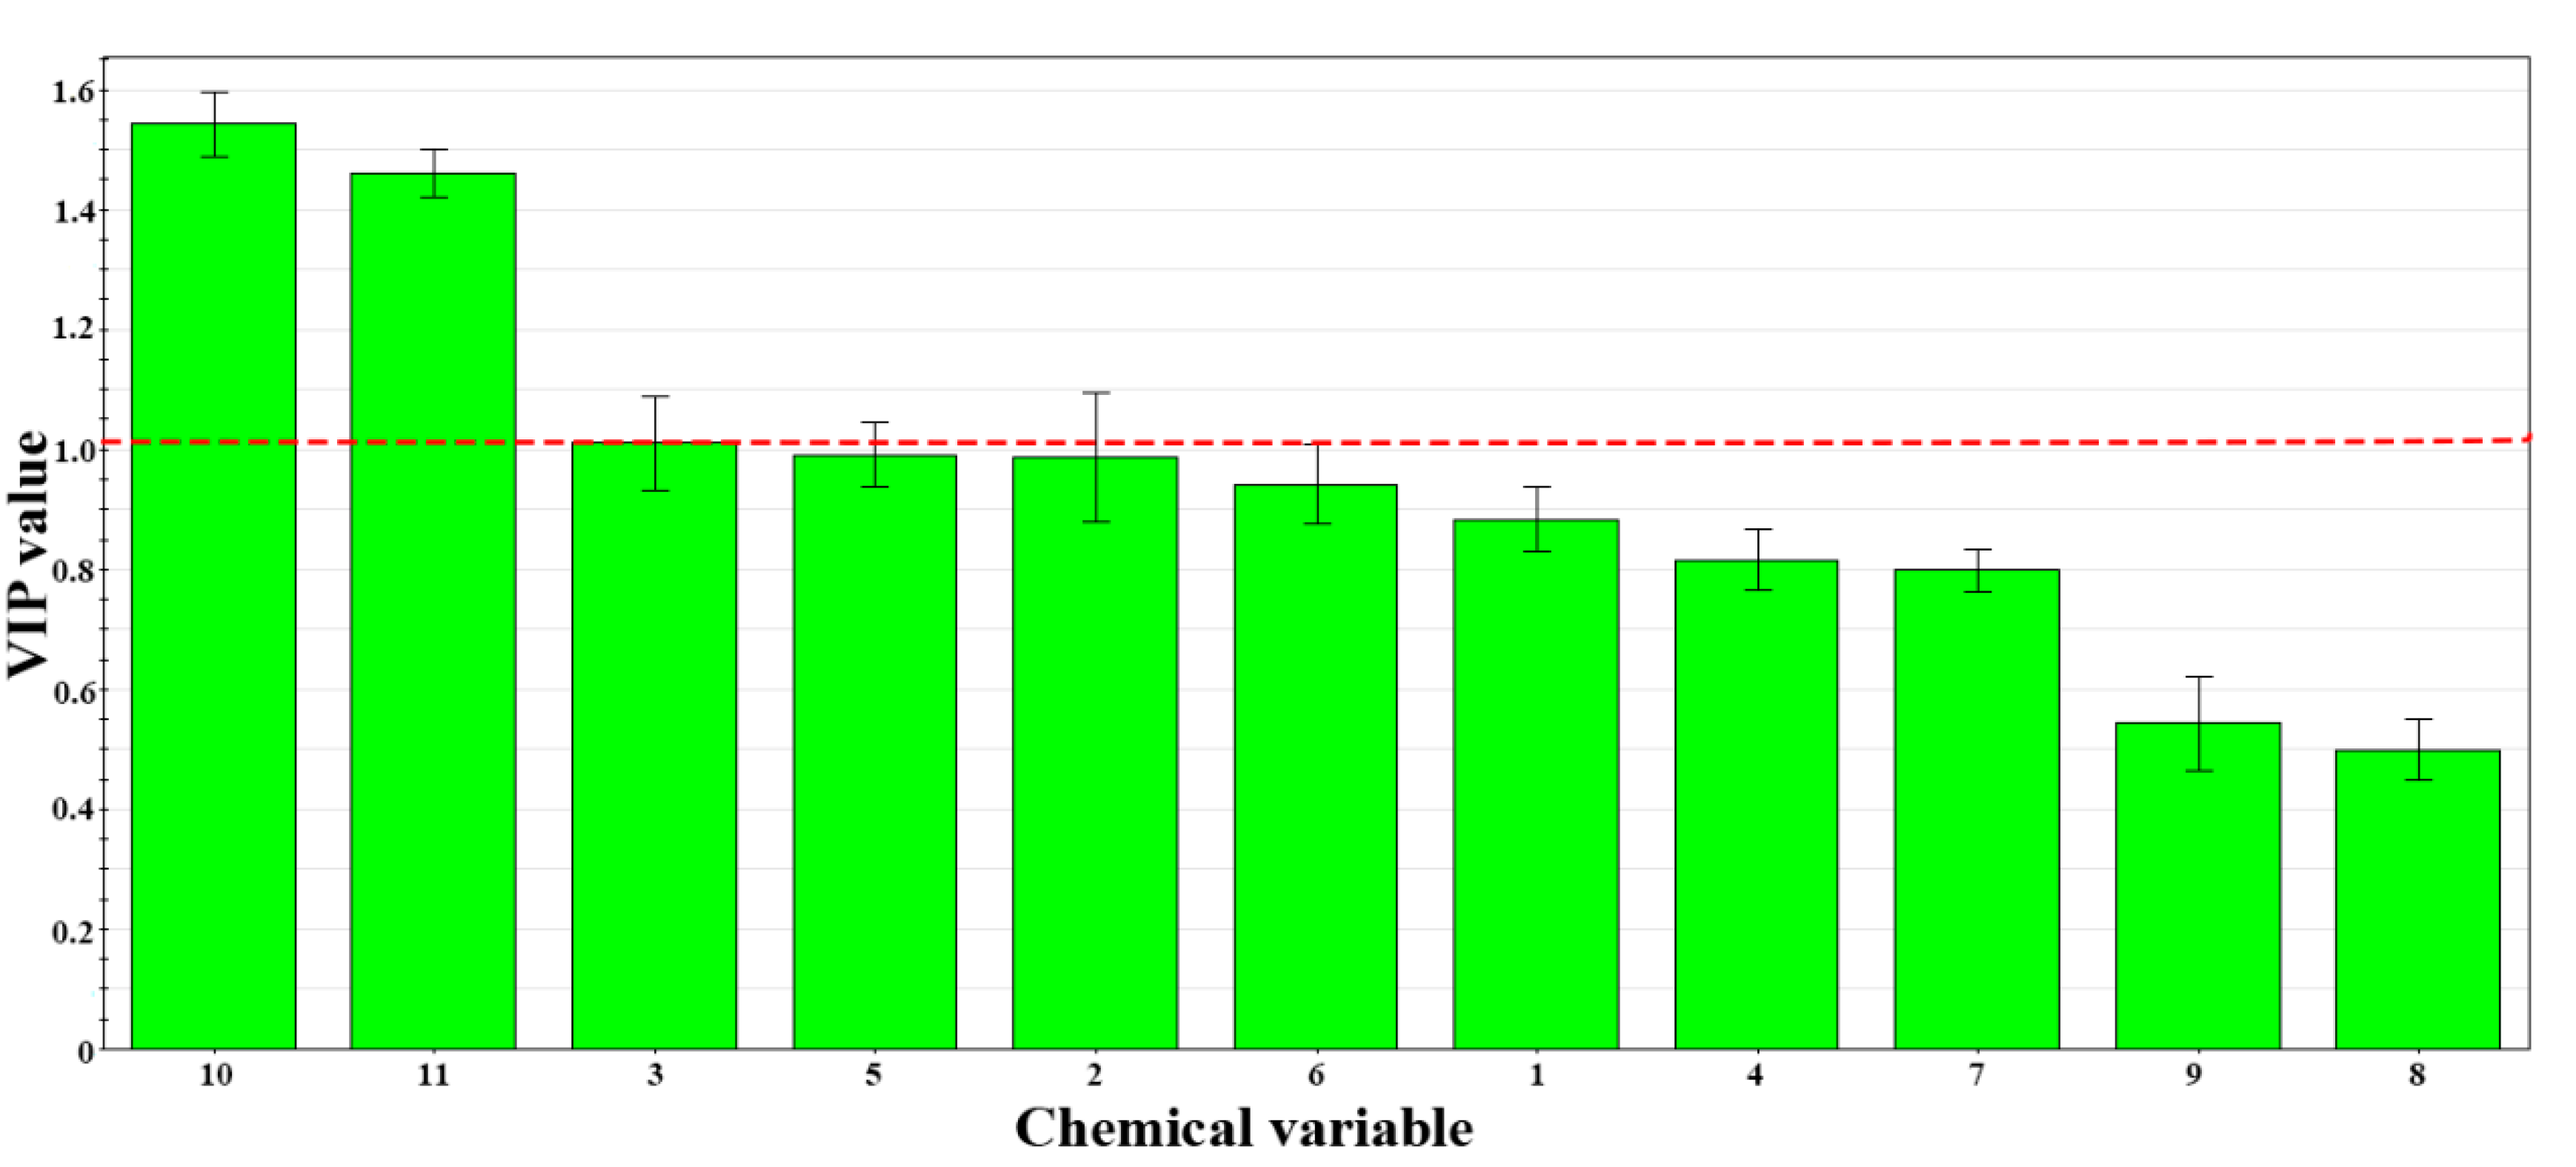
3.4. PLS-DA Modeling
3.5. Determination of Berberine Hydrochloride
4. Discussion and Conclusions
Author Contributions
Funding
Conflicts of Interest
Abbreviations
| HPLC | High-performance liquid chromatography |
| HCA | Hierarchical cluster analysis |
| PCA | Principal component analysis |
| PLS-DA | Partial least squares discriminant analysis |
| PCC | Phellodendri Chinensis Cortex |
| PAC | Phellodendri amurensis cortex |
| TCM | Traditional Chinese medicine |
| VIP | Variable importance for the project |
References
- Chinese Pharmacopoeia Committee. Pharmacopoeia of the People’s Republic of China; China Chemical Industry Press: Beijing, China, 2015. [Google Scholar]
- Chatuphonprasert, W.; Nemoto, N.; Sakuma, T.; Jarukamjorn, K. Modulations of cytochrome P450 expression in diabetic mice by berberine. Chem. Biol. Interact. 2012, 196, 23–29. [Google Scholar] [CrossRef] [PubMed]
- Xian, Y.F.; Lin, Z.X.; Ip, S.P.; Su, Z.R.; Chen, J.N.; Lai, X.P. Comparison of the neuroprotective effect of Cortex Phellodendri chinensis and Cortex Phellodendri amurensis against beta-amyloid-induced neurotoxicity in PC12 cells. Phytomedicine 2013, 20, 187–193. [Google Scholar] [CrossRef] [PubMed]
- Zhu, Z.M.; Lai, X.X.; Su, M.X. Determinations of active compositions in Cortex Phellodendri Chinensis and Cortex Phellodendri Amurensis from different areas by HPLC. Clin. Med. Eng. 2011, 18, 106–108. (In Chinese) [Google Scholar]
- Li, L.X.; Qiao, B.; Li, Y.B.; Zhang, L.Y.; Wang, Y.M.; Jin, J.; Zhang, X.X. Changes of chemical constituents in Phellodendri Chinensis Cortex before and after charing based on RPLC/Q-TOF-MS technology. Chin. Tradit. Herb. Drugs 2012, 43, 1314–1319. (In Chinese) [Google Scholar]
- Wang, H.; Sun, H.; Zhang, A.; Li, Y.; Wang, L.; Shi, H.; Dizou, X.L.; Wang, X. Rapid identification and comparative analysis of the chemical constituents and metabolites of Phellodendri amurensis cortex and Zhibai dihuang pill by ultra-performance liquid chromatography with quadrupole TOF-MS. J. Sep. Sci. 2013, 36, 3874–3882. [Google Scholar] [CrossRef] [PubMed]
- Liu, T.F.; Liu, X.P.; Zhang, H.Y.; Song, H.T.; Wang, J.F.; Wu, M.; Sun, H.B. Susceptibility testing of genus malassezia in vitro to the Chinese medicinal lotion. Chin. J. Dermatovenereol. 2011, 25, 62–63, (In Chinese, English Abstract). [Google Scholar]
- Wang, P.; Xia, F.; Li, X.C.; Hu, M.; Zhang, N; Wang, P.; Xia, F.; Li, X.C.; Hu, M.; Zhang, N. Effects of aqueous extracts of Phellodendri Chinensis Cortex on virulence factors and its mechanisms in Pseudomonas aeruginosa. Pharmacol. Clin. Chin. Mater. Med. 2015, 31, 118–121, (In Chinese, English Abstract). [Google Scholar]
- Jung, H.W.; Jin, G.; Kim, S.Y.; Kim, Y.S.; Park, Y.K. Neuroprotective effect of methanol extract of Phellodendri Cortex against 1-methyl-4-phenylpyridinium (MPP+)-induced apoptosis in PC-12 cells. Cell Biol. Int. 2009, 33, 957–963. [Google Scholar] [CrossRef] [PubMed]
- Li, Y.B.; Zhang, T.J.; Zhang, X.L.; Xu, H.; Liu, C. Chemical fingerprint analysis of Phellodendri Amurensis Cortex by ultra performance LC/Q-TOF-MS methods combined with chemometrics. J. Sep. Sci. 2010, 33, 3347–3353. [Google Scholar] [CrossRef] [PubMed]
- Lin, B. Comparison of the nourishing Yin effect and anti-gout effect of unprocessed and different processed products of Cortex Phellodendri Chinensis. J. Med. Theory Pract. 2016, 29, 3304–3305, 3308, (In Chinese, English Abstract). [Google Scholar]
- Xian, Y.F.; Mao, Q.Q.; Ip, S.P.; Lin, Z.X.; Che, C.T. Comparison on the anti-inflammatory effect of Cortex Phellodendri Chinensis and Cortex Phellodendri Amurensis in 12-O-tetradecanoyl-phorbol-13-acetate-induced ear edema in mice. J. Ethnopharmacol. 2011, 137, 1425–1430. [Google Scholar] [CrossRef] [PubMed]
- Sun, C.F.; Zhang, Y.Y.; Chu, W.C. Progress in research on pharmacological activities of phellodendronamu-rense rupr. ShanDong Chem. Ind. 2017, 46, 99–100, (In Chinese, English Abstract). [Google Scholar]
- Sun, H.; Wang, H.; Zhang, A.; Yan, G.; Han, Y.; Li, Y.; Wu, X.; Meng, X.; Wang, X. Chemical Discrimination of Cortex Phellodendri amurensis and Cortex Phellodendri chinensis by Multivariate Analysis Approach. Pharmacogn. Mag. 2016, 12, 41–49. [Google Scholar] [PubMed]
- Chen, M.L.; Xian, Y.F.; Ip, S.P.; Tsai, S.H.; Yang, J.Y.; Che, C.T. Chemical and biological differentiation of Cortex Phellodendri Chinensis and Cortex Phellodendri Amurensis. Planta Med. 2010, 76, 1530–1535. [Google Scholar] [CrossRef] [PubMed]
- Pardomates, N.; Vera, A.; Barbosa, S.; Hidalgo-Serrano, M.; Núñez, O.; Saurina, J.; Hernández-Cassou, S.; Puignou, L. Characterization, classification and authentication of fruit-based extracts by means of HPLC-UV chromatographic fingerprints, polyphenolic profiles and chemometric methods. J. Food Chem. 2017, 221, 29–38. [Google Scholar] [CrossRef] [PubMed] [Green Version]
- Culzoni, M.J.; De Llanos, A.M.; De Zan, M.M.; Espinosa-Mansilla, A.; Cañada-Cañada, F.; De La Peña, A.M.; Goicoechea, H.C. Enhanced MCR-ALS modeling of HPLC with fast scan fluorimetric detection second-order data for quantitation of metabolic disorder marker pteridines in urine. Talanta 2011, 85, 2368–2374. [Google Scholar] [CrossRef] [PubMed]
- Qin, J.P.; Wang, Z.M.; Li, M.L. Application of chemometrics to the identification and quality control of Chinese traditional medicine. Math. Pharm. Impurities 2004, 17, 351–354, (In Chinese, English Abstract). [Google Scholar]
- Sun, L.L.; Wang, M.; Ren, X.L. Application progress on chemical pattern recognition in quality control of Chinese materia medica. Chin. Tradit. Herb. Drugs 2017, 48, 4339–4345, (In Chinese, English Abstract). [Google Scholar]
- Sun, T.T.; Li, R.R.; Zhang, Z.J.; Gong, Q.F.; Qin, H.L. Investigation of factors affecting the quality of Corydalis yanhusuo samples based on chromatographic fingerprints. J. Liq. Chromatogr. Relat. Technol. 2015, 38, 506–513. [Google Scholar] [CrossRef]
- Kong, W.J.; Zhao, Y.L.; Xiao, X.H.; Jin, C.; Li, Z.L. Quantitative and chemical fingerprint analysis for quality control of Rhizoma Coptidischinensis based on UPLC-PAD combined with chemometrics methods. Phytomedicine 2009, 16, 950–959. [Google Scholar] [CrossRef] [PubMed]
- Barile, D.; Coı¨Sson, J.D.; Arlorio, M.; Rinaldi, M. Identification of production area of Ossolano Italian cheese with chemometric complex approach. Food Control 2006, 17, 197–206. [Google Scholar] [CrossRef]
- Zhuang, H.; Ni, Y.; Kokot, S. Combining HPLC-DAD and ICP-MS data for improved analysis of complex samples: Classification of the root samples from Cortex moutan. Chemom. Intell. Lab. Syst. 2014, 135, 183–191. [Google Scholar] [CrossRef]
- Lucio-Gutiãrrez, J.R.; Coello, J.; Maspoch, S. Enhanced chromatographic fingerprinting of herb materials by multi-wavelength selection and chemometrics. Anal. Chim. Acta 2012, 710, 40–49. [Google Scholar] [CrossRef] [PubMed]
- Zhou, X.; Tang, L.; Wu, H.; Zhou, G.; Wang, T.; Kou, Z.; Li, S.; Wang, Z. Chemometric analyses for the characterization of raw and processed seeds of Descurainia sophia (L.) based on HPLC fingerprints. J. Pharm. Biomed. Anal. 2015, 111, 1–6. [Google Scholar] [CrossRef] [PubMed]
- Gao, Y. Study on Grading Specifications and Quality Evaluation of Phellodendron Chinense and Its Pieces. Master’s Thesis, Chengdu University of Traditional Chinese Medicine, Chengdu, China, 2013. [Google Scholar]
Sample Availability: Samples of the compounds are not available from the authors. |


| Sample Name | Traits | Crude Cork Thickness | Origin | Source |
|---|---|---|---|---|
| SC11-SC12-SC13 | Strip; Thickness 1–3 mm | 0.1–0.3 mm | Sichuan (SC) | PCC |
| SC21-SC22-SC23 | Strip; Thickness 1–2 mm | - | ||
| SC31-SC32-SC33 | Strip; Thickness 1–2 mm | - | ||
| SC41-SC42-SC43 | Strip; Thickness 1–3 mm | 0.5–1.3 mm | ||
| SC51-SC52-SC53 | Strip; Thickness 1–3 mm | - | ||
| SC61-SC62-SC63 | Strip; Thickness 1–3 mm | 0.6–1.3 mm | ||
| SC71-SC72-SC73 | Strip; Thickness 1–4 mm | 0.6–1.5 mm | ||
| SC81-SC82-SC83 | Strip; Thickness 2–4 mm | 0.6–1.5 mm | ||
| SC91-SC92-SC93 | Strip; Thickness 2–4 mm | 0.8–1.5 mm | ||
| SC101-SC102-SC103 | Strip; Thickness 1–3 mm | 0.6–1.5 mm | ||
| SC111-SC112-SC113 | Slice; Thickness 1–3 mm | 0.7–1.2 mm | ||
| SC121-SC122-SC123 | Slice; Thickness 1–3 mm | 0.6–1.3 mm | ||
| SX11-SX12-SX13 | Strip; Thickness 3–8 mm | - | Shanxi (SX) | PCC |
| SX21-SX22-SX23 | Strip; Thickness 1–3 mm | 0.1–0.3 mm | ||
| SX31-SX32-SX33 | Strip; Thickness 3–6 mm | 0.1–0.5 mm | ||
| HN11-HN12-HN13 | Strip; Thickness 1–2 mm | - | Hunan (HN) | PCC |
| HN21-HN22-HN23 | Strip; Thickness 1–3 mm | - | Hubei (HB) | PCC |
| HB11-HB12-HB13 | Strip; Thickness 1–4 mm | 0.6–1.2 mm | ||
| GZ11-GZ12-GZ13 | Slice; Thickness 3–6 mm | 0.8–1.5 mm | Guizhou (GZ) | PCC |
| YN31-YN32-YN33 | Strip; Thickness 3–5 mm | 0.1–0.5 mm | Yunnan (YN) | PCC |
| G11-G12-G13-G21-G22-G23 | - | - | Liaoning, Heilongjiang, Hebei. (G) | PAC |
| G31-G32-G33-G41-G42-G43 | ||||
| G51-G52-G53 |
| Batches | Similarity | Batches | Similarity |
|---|---|---|---|
| SC1 | 0.998 | SC11 | 0.999 |
| SC2 | 1.000 | SC12 | 0.998 |
| SC3 | 0.981 | SX1 | 0.996 |
| SC4 | 1.000 | SX2 | 0.997 |
| SC5 | 1.000 | SX3 | 0.997 |
| SC6 | 0.998 | HN1 | 0.997 |
| SC7 | 0.998 | HN2 | 1.000 |
| SC8 | 0.997 | HB1 | 0.996 |
| SC9 | 0.988 | GZ1 | 0.998 |
| SC10 | 1.000 | YN1 | 1.000 |
| Batches | Berberine Hydrochloride (%) | Batches | Berberine Hydrochloride (%) |
|---|---|---|---|
| SC1 | 4.78 | SC11 | 4.59 |
| SC2 | 6.45 | SC12 | 4.28 |
| SC3 | 2.13 | YN1 | 6.20 |
| SC4 | 6.12 | GZ1 | 5.07 |
| SC5 | 6.15 | HB1 | 7.68 |
| SC6 | 6.03 | HN1 | 4.10 |
| SC7 | 6.54 | HN2 | 5.51 |
| SC8 | 5.64 | SX1 | 3.25 |
| SC9 | 6.45 | SX2 | 5.63 |
| SC10 | 4.65 | SX3 | 3.65 |
© 2018 by the authors. Licensee MDPI, Basel, Switzerland. This article is an open access article distributed under the terms and conditions of the Creative Commons Attribution (CC BY) license (http://creativecommons.org/licenses/by/4.0/).
Share and Cite
Cao, X.; Sun, L.; Li, D.; You, G.; Wang, M.; Ren, X. Quality Evaluation of Phellodendri Chinensis Cortex by Fingerprint–Chemical Pattern Recognition. Molecules 2018, 23, 2307. https://doi.org/10.3390/molecules23092307
Cao X, Sun L, Li D, You G, Wang M, Ren X. Quality Evaluation of Phellodendri Chinensis Cortex by Fingerprint–Chemical Pattern Recognition. Molecules. 2018; 23(9):2307. https://doi.org/10.3390/molecules23092307
Chicago/Turabian StyleCao, Xuexiao, Lili Sun, Di Li, Guangjiao You, Meng Wang, and Xiaoliang Ren. 2018. "Quality Evaluation of Phellodendri Chinensis Cortex by Fingerprint–Chemical Pattern Recognition" Molecules 23, no. 9: 2307. https://doi.org/10.3390/molecules23092307
APA StyleCao, X., Sun, L., Li, D., You, G., Wang, M., & Ren, X. (2018). Quality Evaluation of Phellodendri Chinensis Cortex by Fingerprint–Chemical Pattern Recognition. Molecules, 23(9), 2307. https://doi.org/10.3390/molecules23092307