
Calculation of VS,max and Its Use as a Descriptor for the Theoretical Calculation of pKa Values for Carboxylic Acids


Abstract
1. Introduction
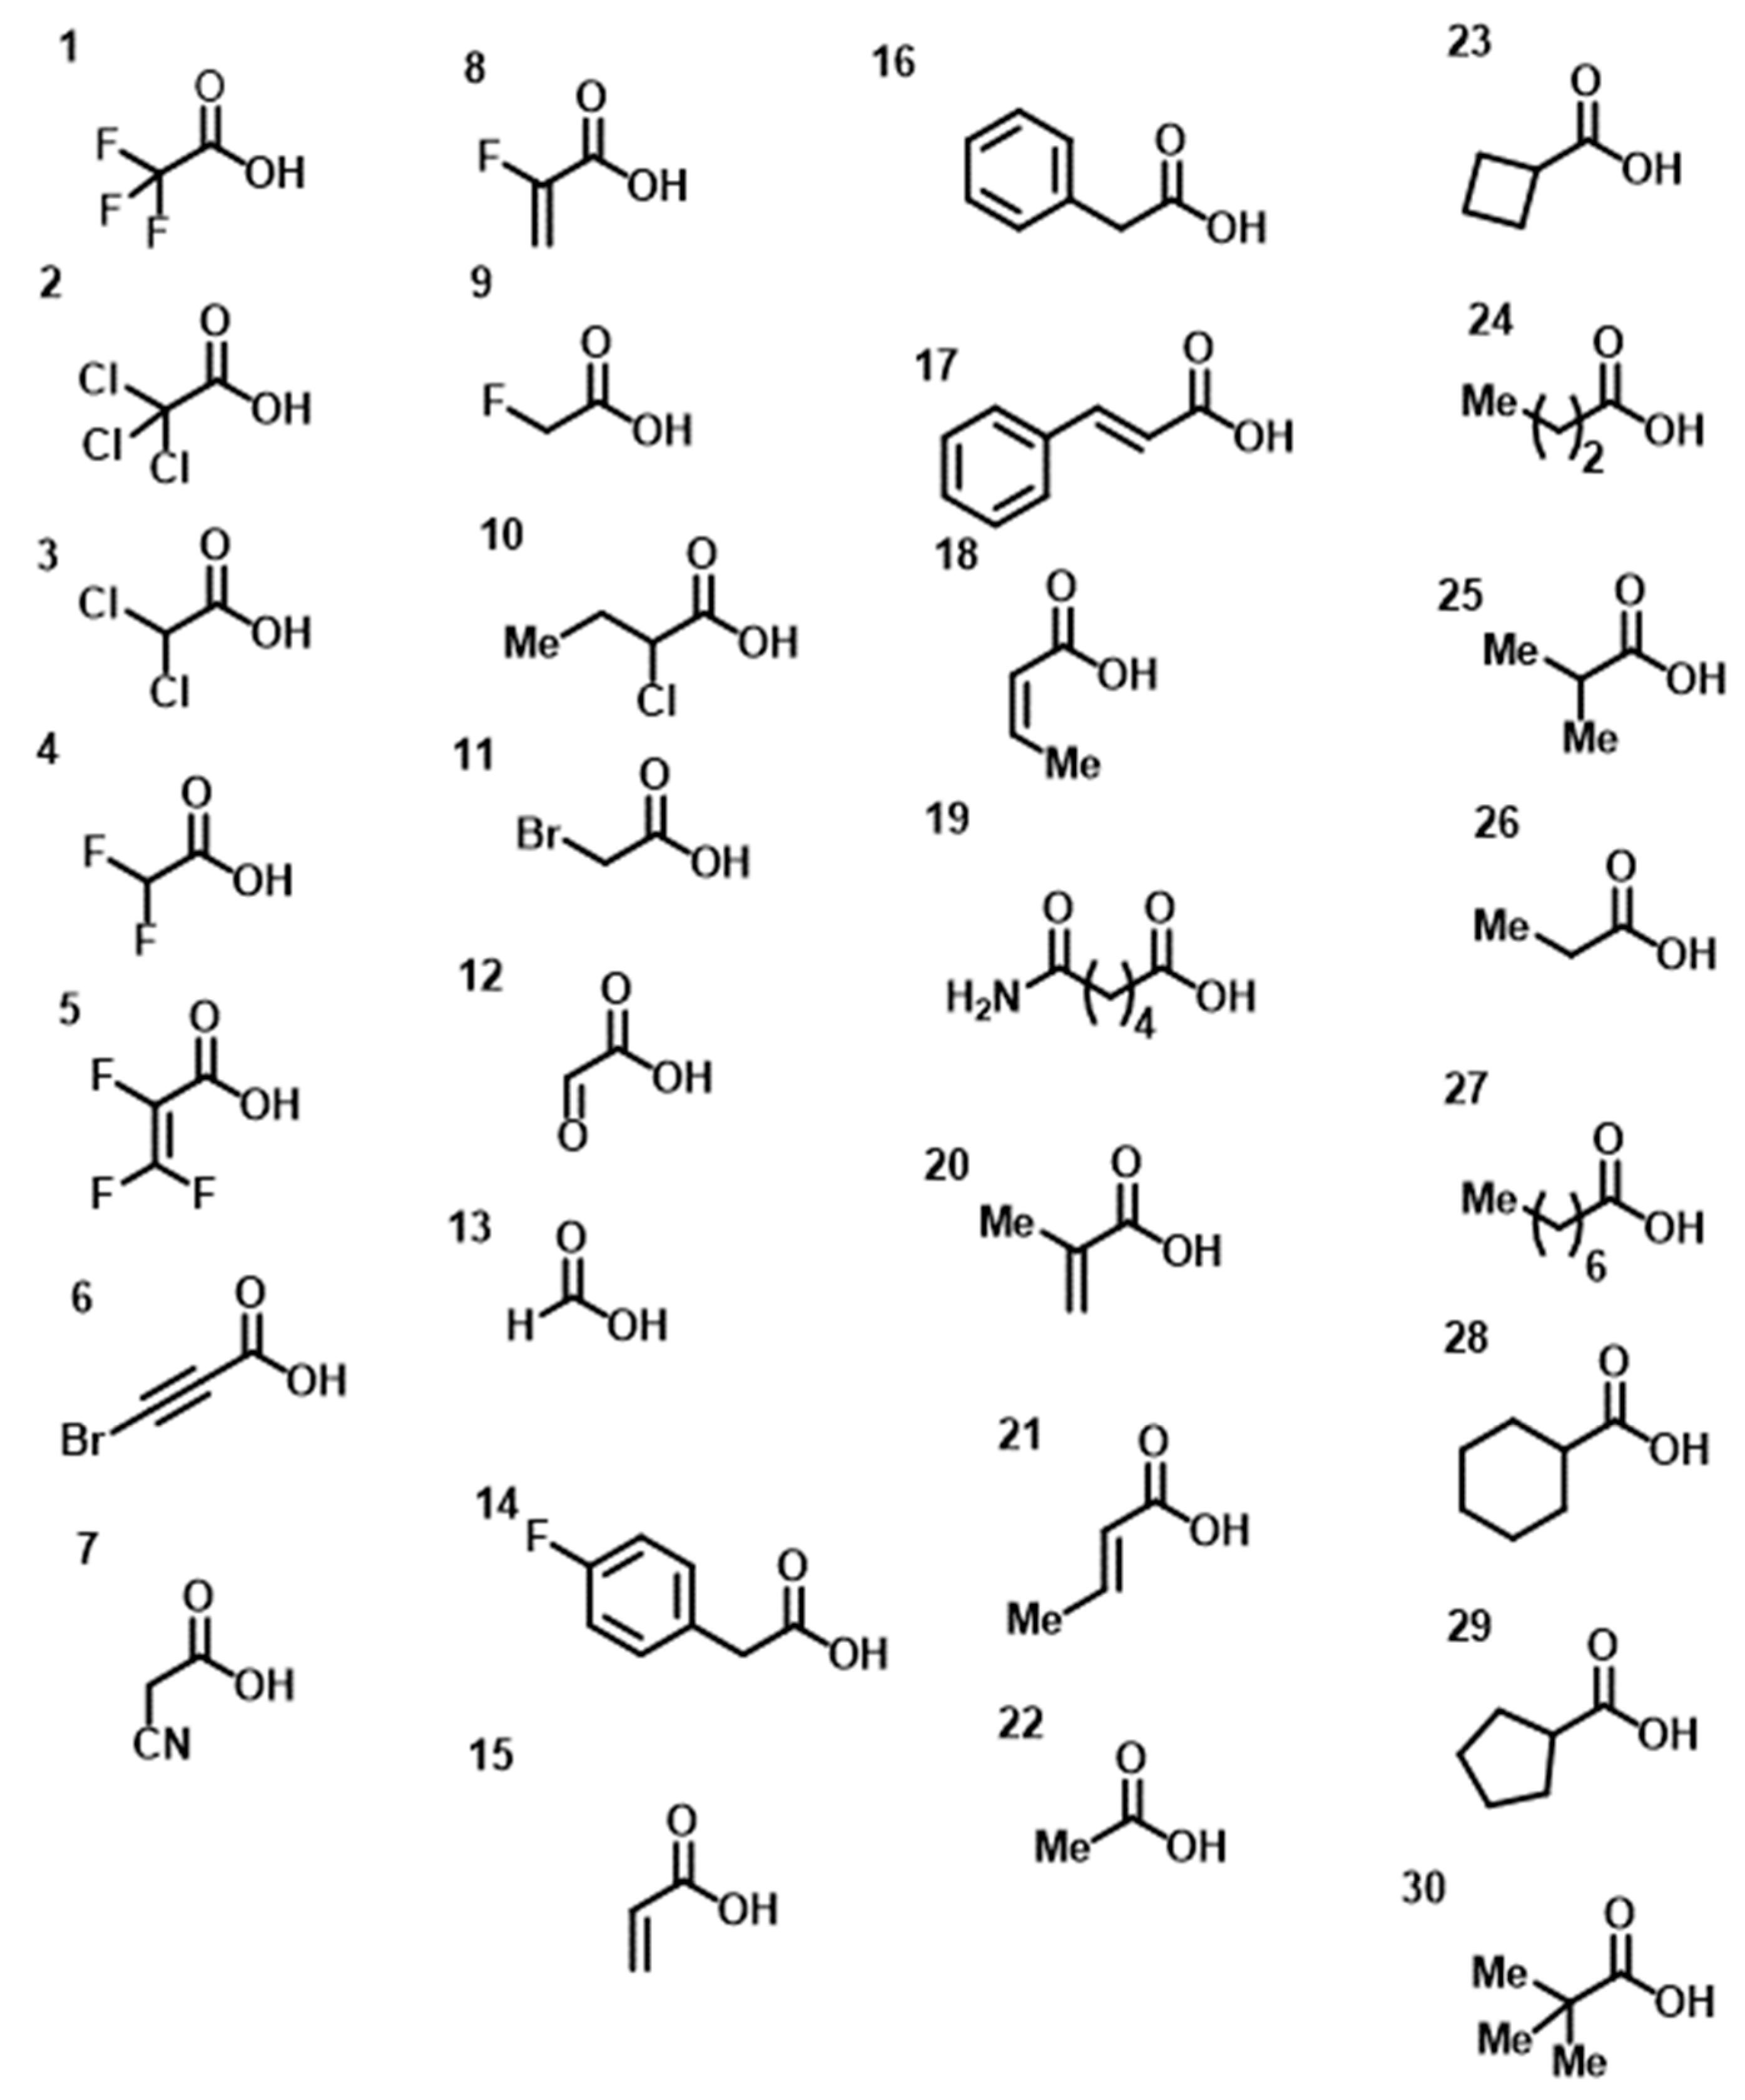
2. Results
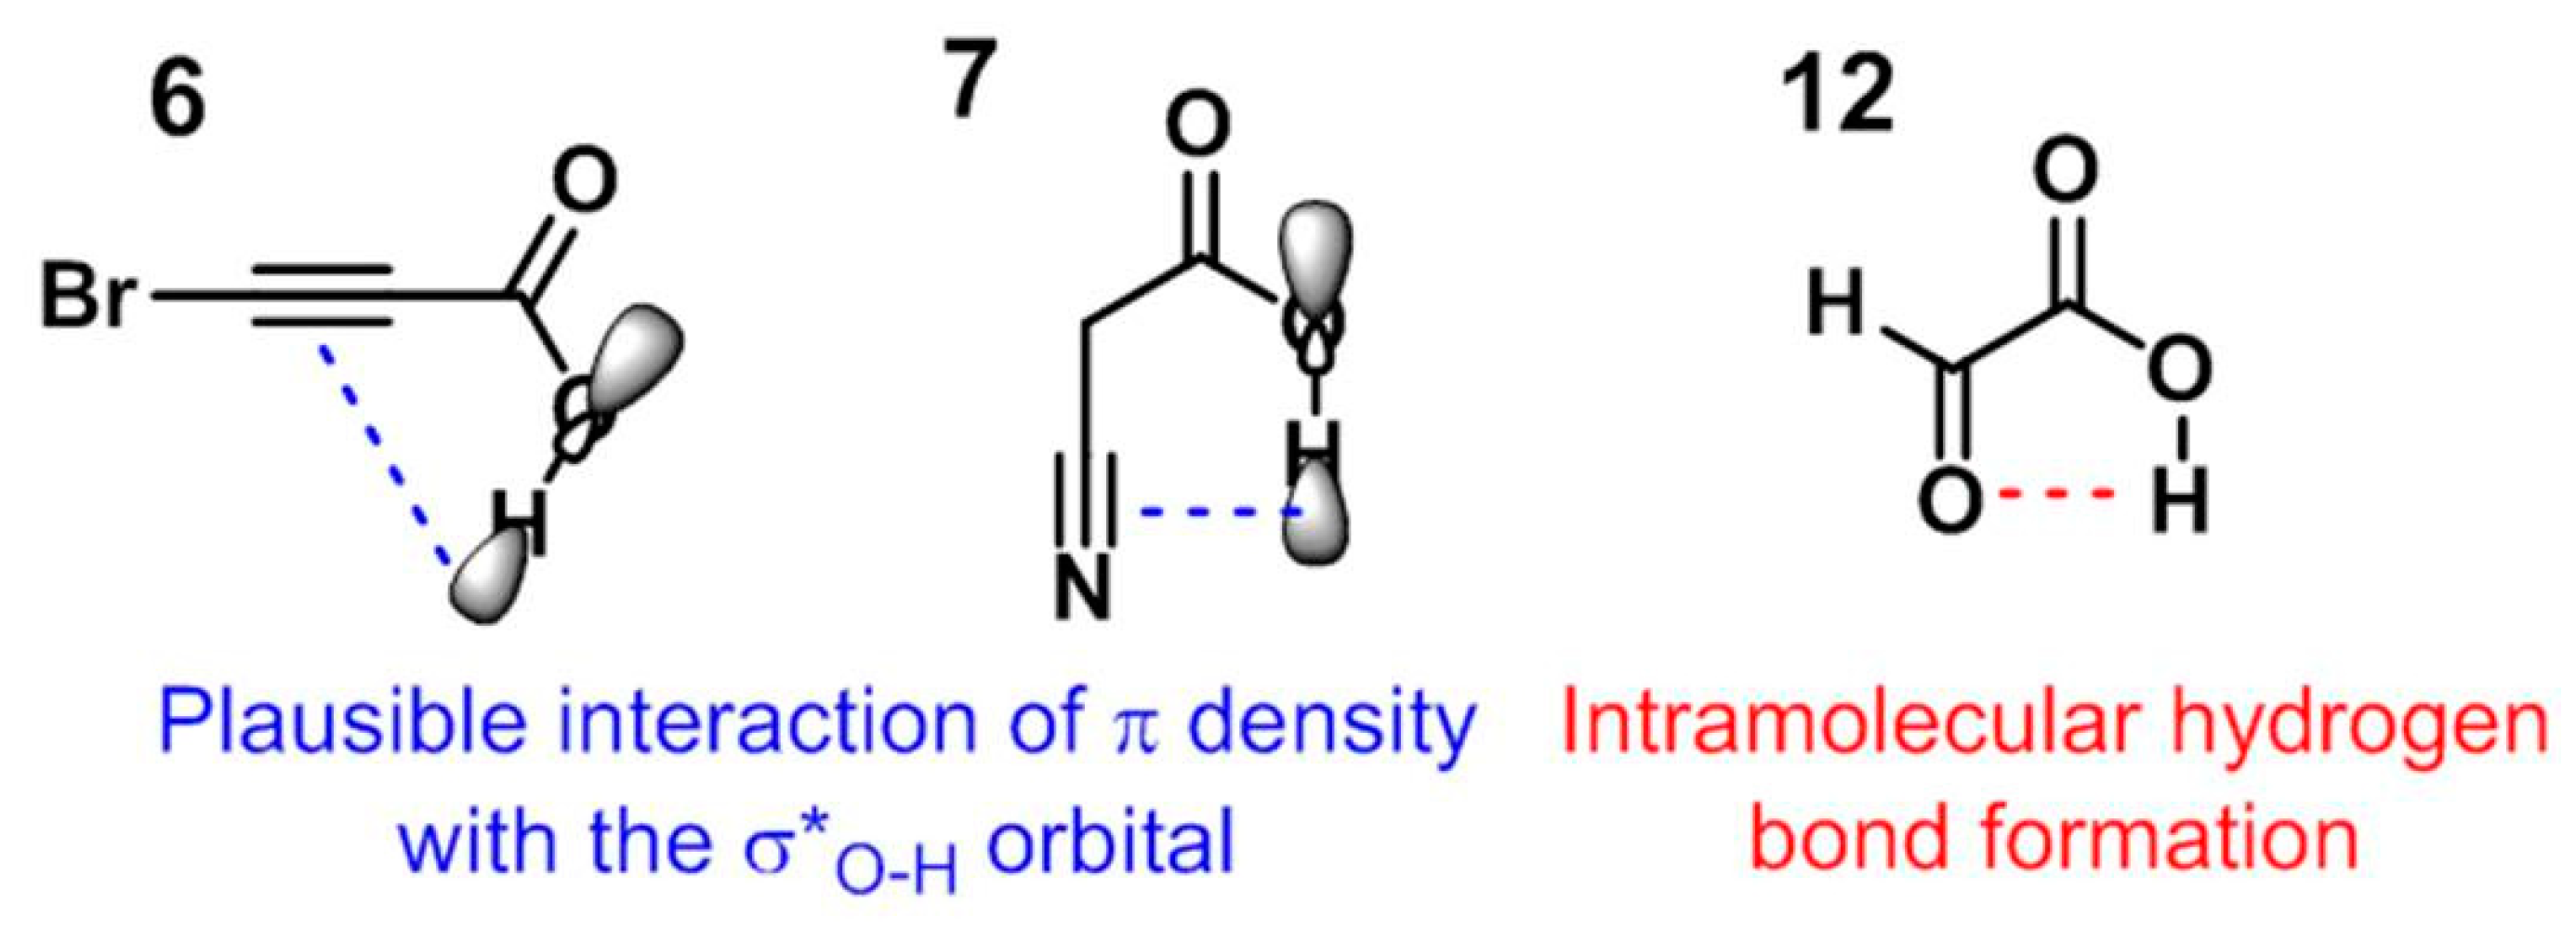
3. Discussion
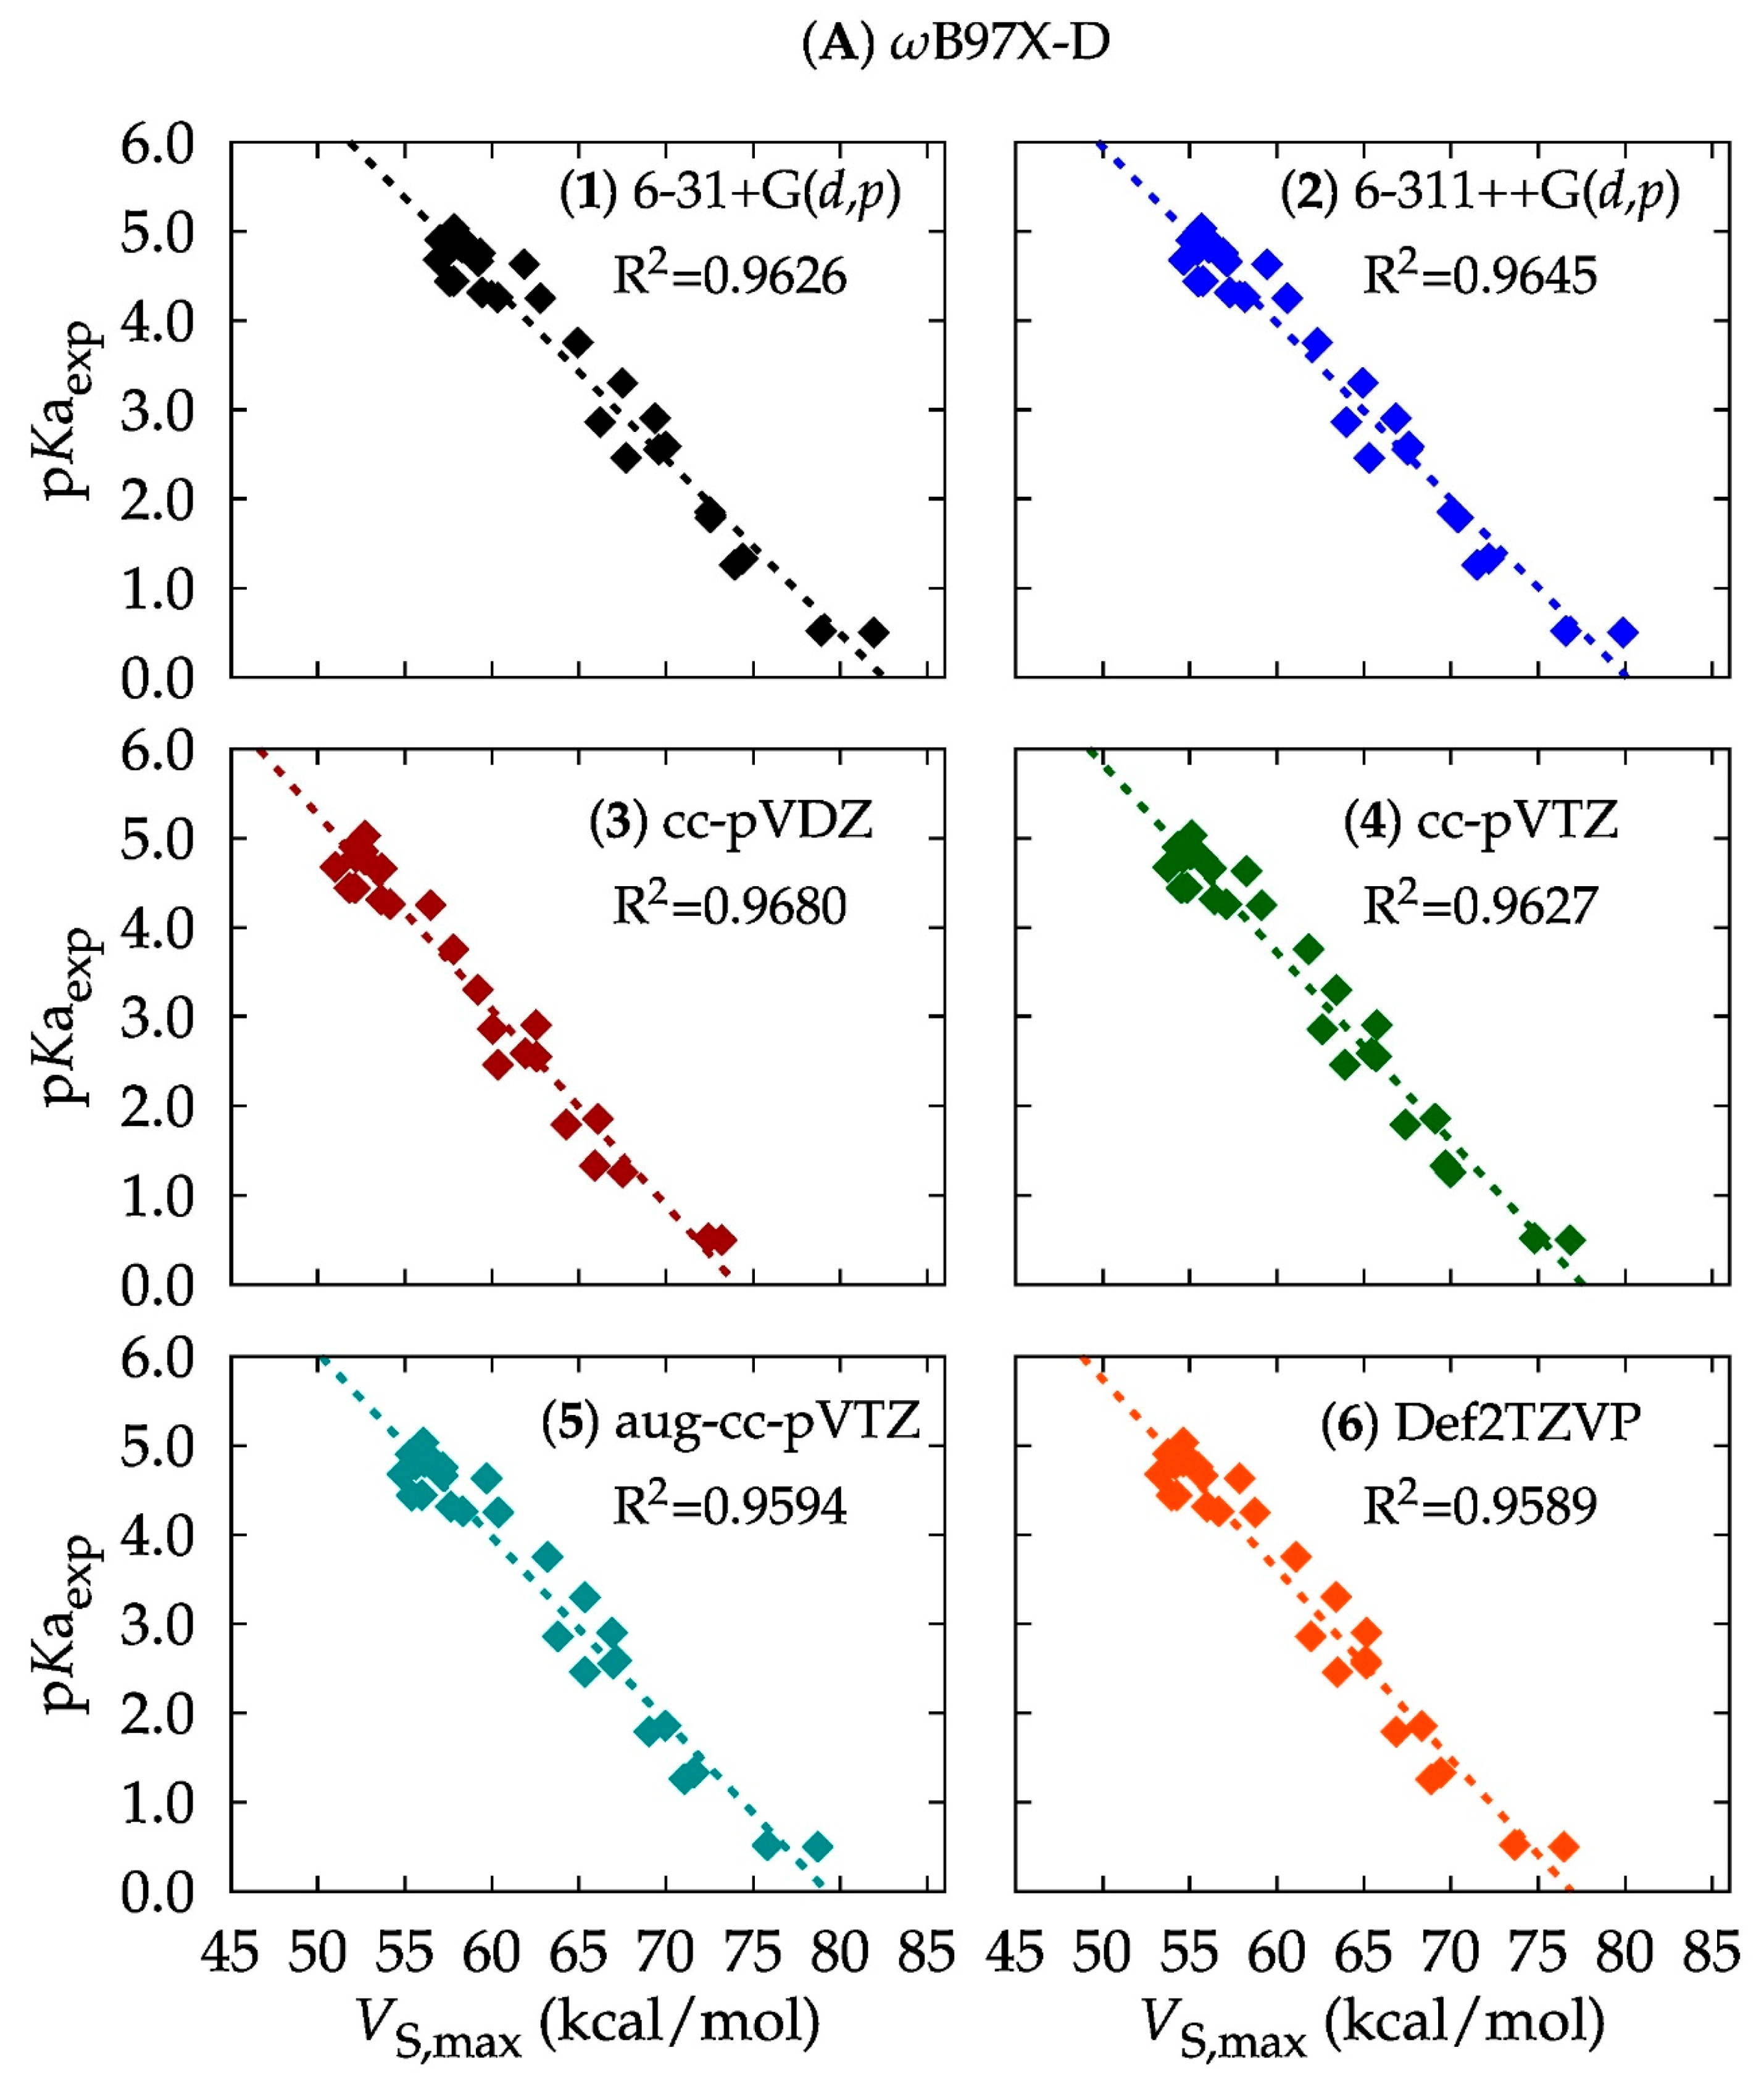
3.1. Computational Method: DFT or Ab Initio?
3.2. Basis Set: Is Larger Better?
3.3. A Final Remark
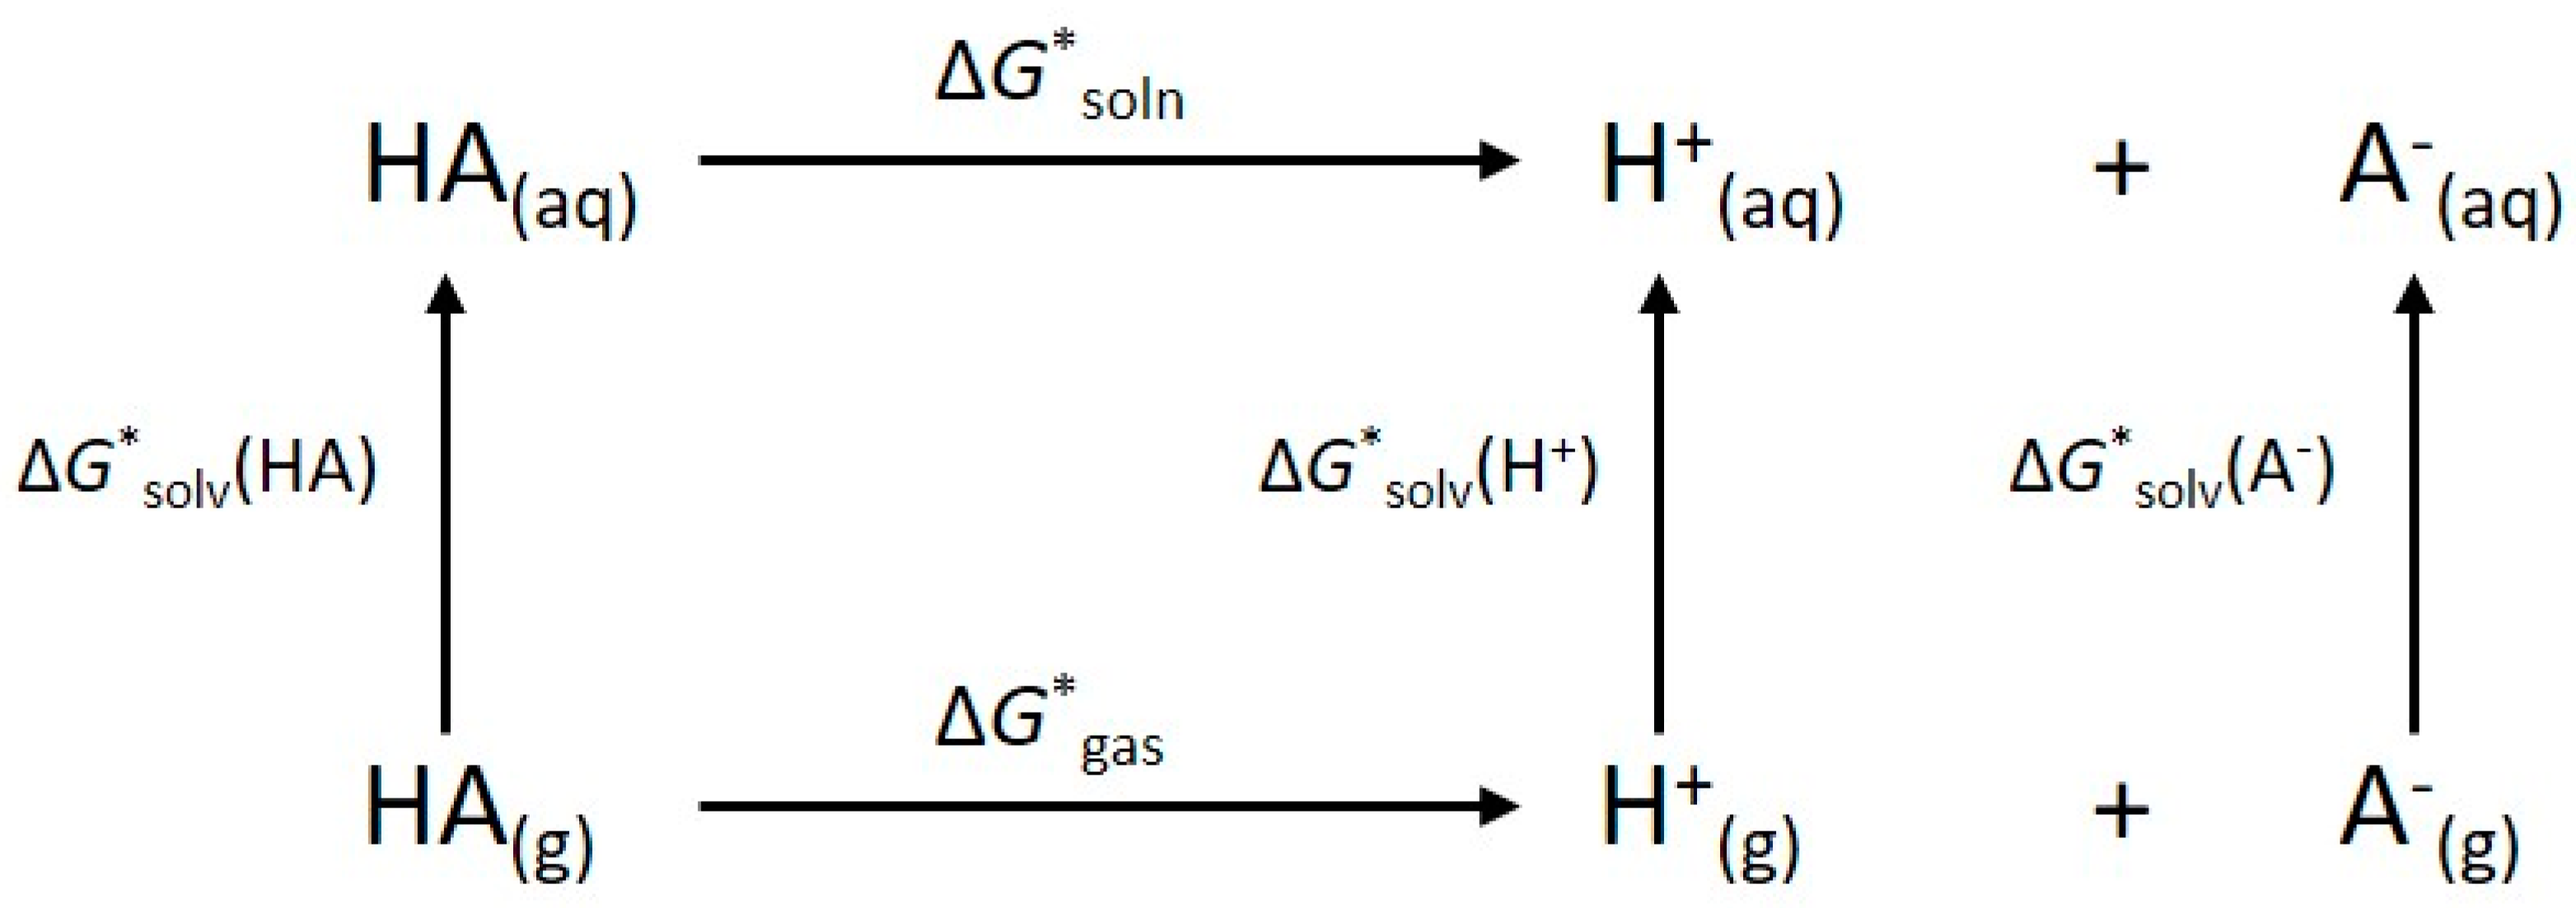
4. Materials and Methods
5. Conclusions
Supplementary Materials
Author Contributions
Funding
Acknowledgments
Conflicts of Interest
References
- Grabowski, S.J. What Is the Covalency of Hydrogen Bonding? Chem. Rev. 2011, 111, 2597–2625. [Google Scholar] [CrossRef] [PubMed]
- Zhao, G.J.; Han, K.L. Hydrogen bonding in the electronic excited state. Acc. Chem. Res. 2012, 45, 404–413. [Google Scholar] [CrossRef] [PubMed]
- Mejía, S.; Hernández-Pérez, J.M.; Sandoval-Lira, J.; Sartillo-Piscil, F. Looking inside the intramolecular C-H⋯O hydrogen bond in lactams derived from α-methylbenzylamine. Molecules 2017, 22, 361. [Google Scholar] [CrossRef] [PubMed]
- Yourdkhani, S.; Jabłoński, M. Revealing the physical nature and the strength of charge-inverted hydrogen bonds by SAPT(DFT), MP2, SCS-MP2, MP2C, and CCSD(T) methods. J. Comput. Chem. 2017, 38, 773–780. [Google Scholar] [CrossRef] [PubMed]
- Jabłoński, M. Binding of X–H to the lone-pair vacancy: Charge-inverted hydrogen bond. Chem. Phys. Lett. 2009, 477, 374–376. [Google Scholar] [CrossRef]
- Cruciani, G.; Milletti, F.; Storchi, L.; Sforna, G.; Goracci, L. In silico pKa prediction and ADME profiling. Chem. Biodivers. 2009, 6, 1812–1821. [Google Scholar] [CrossRef]
- Krieger, E.; Dunbrack, R.; Hooft, R.; Krieger, B. Computational Drug Discovery and Design. In Methods in Molecular Biology; Baron, R., Ed.; Springer: New York, NY, USA, 2012; Volume 819, ISBN 978-1-61779-464-3. [Google Scholar]
- Kim, M.O.; McCammon, J.A. Computation of pH-dependent binding free energies. Biopolymers 2016, 105, 43–49. [Google Scholar] [CrossRef]
- Liptak, M.D.; Gross, K.C.; Seybold, P.G.; Feldgus, S.; Shields, G.C. Absolute pKa Determinations for Substituted Phenols. J. Am. Chem. Soc. 2002, 124, 6421–6427. [Google Scholar] [CrossRef]
- Ho, J.; Coote, M.L. First-principles prediction of acidities in the gas and solution phase. Wiley Interdiscip. Rev. Comput. Mol. Sci. 2011, 1, 649–660. [Google Scholar] [CrossRef]
- Alkorta, I.; Legon, A. Nucleophilicities of Lewis Bases B and Electrophilicities of Lewis Acids A Determined from the Dissociation Energies of Complexes B⋯A Involving Hydrogen Bonds, Tetrel Bonds, Pnictogen Bonds, Chalcogen Bonds and Halogen Bonds. Molecules 2017, 22, 1786. [Google Scholar] [CrossRef]
- Thapa, B.; Schlegel, H.B. Density Functional Theory Calculation of pKa’s of Thiols in Aqueous Solution Using Explicit Water Molecules and the Polarizable Continuum Model. J. Phys. Chem. A 2016, 120, 5726–5735. [Google Scholar] [CrossRef] [PubMed]
- Zhao, D.; Rong, C.; Yin, D.; Liu, S. Molecular Acidity of Building Blocks of Biological Systems: A Density Functional Reactivity Theory Study. J. Theor. Comput. Chem. 2013, 12, 1350034. [Google Scholar] [CrossRef]
- Wang, Y.F.; Cheng, Y.C. Molecular electrostatic potential on the proton-donating atom as a theoretical descriptor of excited state acidity. Phys. Chem. Chem. Phys. 2018, 20, 4351–4359. [Google Scholar] [CrossRef] [PubMed]
- Virant, M.; Drvarič Talian, S.; Podlipnik, Č.; Hribar-Lee, B. Modelling the Correlation Between Molecular Electrostatic Potential and pKa on Sets of Carboxylic Acids, Phenols and Anilines. Acta Chim. Slov. 2017, 560–563. [Google Scholar] [CrossRef]
- Palaz, S.; Türkkan, B.; Eroğlu, E. A QSPR Study for the Prediction of the pKa of N-Base Ligands and Formation Constant Kc of Bis(2,2′-bipyridine)Platinum(II)-N-Base Adducts Using Quantum Mechanically Derived Descriptors. ISRN Phys. Chem. 2012, 2012, 1–11. [Google Scholar] [CrossRef]
- Veyseh, S.; Hamzehali, H.; Niazi, A.; Ghasemi, J.B. Application of multivariate image analysis in QSPR study of pKa of various acids by principal components-least squares support vector machine. J. Chil. Chem. Soc. 2015, 60, 2985–2987. [Google Scholar] [CrossRef]
- Noorizadeh, H.; Farmany, A.; Noorizadeh, M. pKa modelling and prediction of drug molecules through GA-KPLS and L-M ANN. Drug Test. Anal. 2013, 5, 103–109. [Google Scholar] [CrossRef] [PubMed]
- Bochevarov, A.D.; Watson, M.A.; Greenwood, J.R.; Philipp, D.M. Multiconformation, Density Functional Theory-Based pKa Prediction in Application to Large, Flexible Organic Molecules with Diverse Functional Groups. J. Chem. Theory Comput. 2016, 12, 6001–6019. [Google Scholar] [CrossRef]
- Yu, H.S.; Watson, M.A.; Bochevarov, A.D. Weighted Averaging Scheme and Local Atomic Descriptor for pKa Prediction Based on Density Functional Theory. J. Chem. Inf. Model. 2018, 58, 271–286. [Google Scholar] [CrossRef]
- Seybold, P.G.; Shields, G.C. Computational estimation of pKa values. Wiley Interdiscip. Rev. Comput. Mol. Sci. 2015, 5, 290–297. [Google Scholar] [CrossRef]
- Niu, Y.; Lee, J.K. pKa Prediction. In Applied Theoretical Organic Chemistry; Tantillo, D.J., Ed.; World Scientific: London, UK, 2018; pp. 6540–6544. ISBN 978-1-78634-408-3. [Google Scholar]
- Matta, C.F. Modeling biophysical and biological properties from the characteristics of the molecular electron density, electron localization and delocalization matrices, and the electrostatic potential. J. Comput. Chem. 2014, 35, 1165–1198. [Google Scholar] [CrossRef] [PubMed]
- Bauzá, A.; Mooibroek, T.J.; Frontera, A. Tetrel-Bonding Interaction: Rediscovered Supramolecular Force? Angew. Chemie Int. Ed. 2013, 52, 12317–12321. [Google Scholar] [CrossRef] [PubMed]
- Gholipour, A. Mutual interplay between pnicogen–π and tetrel bond in PF3⊥X–Pyr…SiH3CN complexes: NMR, SAPT, AIM, NBO, and MEP analysis. Struct. Chem. 2018, 29, 1255–1263. [Google Scholar] [CrossRef]
- Guo, X.; Liu, Y.W.; Li, Q.Z.; Li, W.Z.; Cheng, J.B. Competition and cooperativity between tetrel bond and chalcogen bond in complexes involving F2CX (X = Se and Te). Chem. Phys. Lett. 2015, 620, 7–12. [Google Scholar] [CrossRef]
- Liu, M.; Li, Q.; Li, W.; Cheng, J.; McDowell, S.A.C. Comparison of hydrogen, halogen, and tetrel bonds in the complexes of HArF with YH3X (X = halogen, Y = C and Si). RSC Adv. 2016, 6, 19136–19143. [Google Scholar] [CrossRef]
- Mani, D.; Arunan, E. The X-C⋯Y (X = O/F, Y = O/S/F/Cl/Br/N/P) “carbon bond” and hydrophobic interactions. Phys. Chem. Chem. Phys. 2013, 15, 14377–14383. [Google Scholar] [CrossRef]
- Cavallo, G.; Metrangolo, P.; Milani, R.; Pilati, T.; Priimagi, A.; Resnati, G.; Terraneo, G. The halogen bond. Chem. Rev. 2016, 116, 2478–2601. [Google Scholar] [CrossRef]
- Auffinger, P.; Hays, F.; Westhof, E.; Ho, P.S. Halogen bonds in biological molecules. Proc. Natl. Acad. Sci. USA. 2004, 101, 16789–16794. [Google Scholar] [CrossRef]
- Politzer, P.; Murray, J.S.; Clark, T. Halogen bonding and other σ-hole interactions: A perspective. Phys. Chem. Chem. Phys. 2013, 15, 11178–11189. [Google Scholar] [CrossRef]
- Legon, A.C. Tetrel, pnictogen and chalcogen bonds identified in the gas phase before they had names: A systematic look at non-covalent interactions. Phys. Chem. Chem. Phys. 2017, 19, 14884–14896. [Google Scholar] [CrossRef]
- Edwards, A.J.; Mackenzie, C.F.; Spackman, P.R.; Jayatilaka, D.; Spackman, M.A. Intermolecular interactions in molecular crystals: What’s in a name? Faraday Discuss. 2017, 203, 93–112. [Google Scholar] [CrossRef] [PubMed]
- Liu, M.; Li, Q.; Scheiner, S. Comparison of tetrel bonds in neutral and protonated complexes of pyridine TF3 and furan TF3 (T = C, Si, and Ge) with NH3. Phys. Chem. Chem. Phys. 2017, 19, 5550–5559. [Google Scholar] [CrossRef] [PubMed]
- Zierkiewicz, W.; Michalczyk, M.; Scheiner, S. Comparison between tetrel bonded complexes stabilized by σ and π hole interactions. Molecules 2018, 23, 1416. [Google Scholar] [CrossRef] [PubMed]
- Kolář, M.H.; Hobza, P. Computer Modeling of Halogen Bonds and Other σ-Hole Interactions. Chem. Rev. 2016, 116, 5155–5187. [Google Scholar] [CrossRef] [PubMed]
- Shields, Z.P.; Murray, J.S.; Politzer, P. Directional tendencies of halogen and hydrogen bonds. Int. J. Quantum Chem. 2010, 110, 2823–2832. [Google Scholar] [CrossRef]
- Scheiner, S. Assembly of Effective Halide Receptors from Components. Comparing Hydrogen, Halogen, and Tetrel Bonds. J. Phys. Chem. A 2017, 121, 3606–3615. [Google Scholar] [CrossRef]
- Tang, Q.; Li, Q. Interplay between tetrel bonding and hydrogen bonding interactions in complexes involving F2XO (X = C and Si) and HCN. Comput. Theor. Chem. 2014, 1050, 51–57. [Google Scholar] [CrossRef]
- Del Bene, J.E.; Alkorta, I.; Elguero, J. Exploring the (H2C=PH2)+:N-Base Potential Surfaces: Complexes Stabilized by Pnicogen, Hydrogen, and Tetrel Bonds. J. Phys. Chem. A 2015, 119, 11701–11710. [Google Scholar] [CrossRef]
- Esrafili, M.D.; Vakili, M.; Javaheri, M.; Sobhi, H.R. Tuning of tetrel bonds interactions by substitution and cooperative effects in XH3Si···NCH···HM (X = H, F, Cl, Br; M = Li, Na, BeH and MgH) complexes. Mol. Phys. 2016, 114, 1974–1982. [Google Scholar] [CrossRef]
- Marín-Luna, M.; Alkorta, I.; Elguero, J. Cooperativity in Tetrel Bonds. J. Phys. Chem. A 2016, 120, 648–656. [Google Scholar] [CrossRef]
- Solimannejad, M.; Orojloo, M.; Amani, S. Effect of cooperativity in lithium bonding on the strength of halogen bonding and tetrel bonding: (LiCN)n···ClYF3 and (LiCN)n···YF3Cl (Y= C, Si and n = 1–5) complexes as a working model. J. Mol. Model. 2015, 21. [Google Scholar] [CrossRef] [PubMed]
- Mahmoudi, G.; Bauzá, A.; Frontera, A.; Garczarek, P.; Stilinović, V.; Kirillov, A.M.; Kennedy, A.; Ruiz-Pérez, C. Metal-organic and supramolecular lead(II) networks assembled from isomeric nicotinoylhydrazone blocks: The effects of ligand geometry and counter-ion on topology and supramolecular assembly. CrystEngComm 2016, 18, 5375–5385. [Google Scholar] [CrossRef]
- Wei, Y.; Cheng, J.; Li, W.; Li, Q. Regulation of coin metal substituents and cooperativity on the strength and nature of tetrel bonds. RSC Adv. 2017, 7, 46321–46328. [Google Scholar] [CrossRef]
- Esrafili, M.D.; Mohammadian-Sabet, F. Cooperativity of tetrel bonds tuned by infstituent effects. Mol. Phys. 2016, 114, 1528–1538. [Google Scholar] [CrossRef]
- George, J.; Dronskowski, R. Tetrel bonds in infinite molecular chains by electronic structure theory and their role for crystal stabilization. J. Phys. Chem. A 2017, 121, 1381–1387. [Google Scholar] [CrossRef] [PubMed]
- Mahmoudi, G.; Dey, L.; Chowdhury, H.; Bauzá, A.; Ghosh, B.K.; Kirillov, A.M.; Seth, S.K.; Gurbanov, A.V.; Frontera, A. Synthesis and crystal structures of three new lead(II) isonicotinoylhydrazone derivatives: Anion controlled nuclearity and dimensionality. Inorganica Chim. Acta 2017, 461, 192–205. [Google Scholar] [CrossRef]
- Mahmoudi, G.; Gurbanov, A.V.; Rodríguez-Hermida, S.; Carballo, R.; Amini, M.; Bacchi, A.; Mitoraj, M.P.; Sagan, F.; Kukulka, M.; Safin, D.A. Ligand-Driven Coordination Sphere-Induced Engineering of Hybride Materials Constructed from PbCl2 and Bis-Pyridyl Organic Linkers for Single-Component Light-Emitting Phosphors. Inorg. Chem. 2017, 56, 9698–9709. [Google Scholar] [CrossRef] [PubMed]
- Scheiner, S. Systematic Elucidation of Factors That Influence the Strength of Tetrel Bonds. J. Phys. Chem. A 2017, 121, 5561–5568. [Google Scholar] [CrossRef]
- Dong, W.; Li, Q.; Scheiner, S. Comparative strengths of tetrel, pnicogen, chalcogen, and halogen bonds and contributing factors. Molecules 2018, 23, 1681. [Google Scholar] [CrossRef]
- Scheiner, S. Steric Crowding in Tetrel Bonds. J. Phys. Chem. A 2018, 122, 2550–2562. [Google Scholar] [CrossRef]
- Laconsay, C.J.; Galbraith, J.M. A valence bond theory treatment of tetrel bonding interactions. Comput. Theor. Chem. 2017, 1116, 202–206. [Google Scholar] [CrossRef]
- Chandra, S.; Bhattacharya, A. Attochemistry of Ionized Halogen, Chalcogen, Pnicogen, and Tetrel Noncovalent Bonded Clusters. J. Phys. Chem. A 2016, 120, 10057–10071. [Google Scholar] [CrossRef] [PubMed]
- Kozuch, S.; Nandi, A.; Sucher, A. Ping-Pong Tunneling Reactions: Can Fluoride Jump at Absolute Zero? Chem.—A Eur. J. 2018. [Google Scholar] [CrossRef]
- Servati Gargari, M.; Stilinovic, V.; Bauzá, A.; Frontera, A.; McArdle, P.; Van Derveer, D.; Ng, S.W.; Mahmoudi, G. Design of Lead(II) Metal-Organic Frameworks Based on Covalent and Tetrel Bonding. Chem.—A Eur. J. 2015, 21, 17951–17958. [Google Scholar] [CrossRef]
- Grabowski, S.J. Tetrel bond-σ-hole bond as a preliminary stage of the SN2 reaction. Phys. Chem. Chem. Phys. 2014, 16, 1824–1834. [Google Scholar] [CrossRef]
- Szabó, I.; Császár, A.G.; Czakó, G. Dynamics of the F− + CH3Cl → Cl− + CH3F SN2 reaction on a chemically accurate potential energy surface. Chem. Sci. 2013, 4, 4362. [Google Scholar] [CrossRef]
- Stei, M.; Carrascosa, E.; Kainz, M.A.; Kelkar, A.H.; Meyer, J.; Szabó, I.; Czakó, G.; Wester, R. Influence of the leaving group on the dynamics of a gas-phase SN2 reaction. Nat. Chem. 2015, 8, 1–6. [Google Scholar] [CrossRef]
- Caballero-García, G.; Romero-Ortega, M.; Barroso-Flores, J. Reactivity of electrophilic chlorine atoms due to σ-holes: A mechanistic assessment of the chemical reduction of a trichloromethyl group by sulfur nucleophiles. Phys. Chem. Chem. Phys. 2016, 18, 27300–27307. [Google Scholar] [CrossRef]
- Lange, N.A.; Speight, J.G. Lange’s Handbook of Chemistry; McGraw-Hill: New York, NY, USA, 2005; ISBN 0071432205. [Google Scholar]
- Chai, J.D.; Head-Gordon, M. Long-range corrected hybrid density functionals with damped atom–atom dispersion corrections. Phys. Chem. Chem. Phys. 2008, 10, 6615. [Google Scholar] [CrossRef]
- Stephens, P.J.; Devlin, F.J.; Chabalowski, C.F.; Frisch, M.J. Ab Initio Calculation of Vibrational Absorption and Circular Dichroism Spectra Using Density Functional Force Fields. J. Phys. Chem. 1994, 98, 11623–11627. [Google Scholar] [CrossRef]
- Vydrov, O.A.; Scuseria, G.E.; Perdew, J.P. Tests of functionals for systems with fractional electron number. J. Chem. Phys. 2007, 126, 154109. [Google Scholar] [CrossRef] [PubMed]
- Zhao, Y.; Truhlar, D.G. The M06 suite of density functionals for main group thermochemistry, thermochemical kinetics, noncovalent interactions, excited states, and transition elements: Two new functionals and systematic testing of four M06-class functionals and 12 other function. Theor. Chem. Acc. 2008, 120, 215–241. [Google Scholar] [CrossRef]
- Perdew, J.P.; Burke, K.; Ernzerhof, M. Generalized Gradient Approximation Made Simple. Phys. Rev. Lett. 1997, 78, 1396. [Google Scholar] [CrossRef]
- Risthaus, T.; Grimme, S. Benchmarking of London dispersion-accounting density functional theory methods on very large molecular complexes. J. Chem. Theory Comput. 2013, 9, 1580–1591. [Google Scholar] [CrossRef] [PubMed]
- Thanthiriwatte, K.S.; Hohenstein, E.G.; Burns, L.A.; Sherrill, C.D. Assessment of the Performance of DFT and DFT-D Methods for Describing Distance Dependence of Hydrogen-Bonded Interactions. J. Chem. Theory Comput. 2011, 7, 88–96. [Google Scholar] [CrossRef] [PubMed]
- Wolters, L.P.; Schyman, P.; Pavan, M.J.; Jorgensen, W.L.; Bickelhaupt, F.M.; Kozuch, S. The many faces of halogen bonding: A review of theoretical models and methods. Wiley Interdiscip. Rev. Comput. Mol. Sci. 2014, 4, 523–540. [Google Scholar] [CrossRef]
- Jensen, F. Method Calibration or Data Fitting? J. Chem. Theory Comput. 2018, 14, 4651–4661. [Google Scholar] [CrossRef]
- Frisch, M.J.; Trucks, G.W.; Schlegel, H.B.; Scuseria, G.E.; Robb, M.A.; Cheeseman, J.R.; Scalmani, G.; Barone, V.; Mennucci, B.; Petersson, G.A.; et al. Gaussian 09; Revision D. 01; Gaussian Inc.: Wallingford, CT, USA, 2009. [Google Scholar]
- Cossi, M.; Rega, N.; Scalmani, G.; Barone, V. Energies, structures, and electronic properties of molecules in solution with the C-PCM solvation model. J. Comput. Chem. 2003, 24, 669–681. [Google Scholar] [CrossRef] [PubMed]
- Barone, V.; Cossi, M. Quantum Calculation of Molecular Energies and Energy Gradients in Solution by a Conductor Solvent Model. J. Phys. Chem. A 1998, 102, 1995–2001. [Google Scholar] [CrossRef]
- Lu, T.; Chen, F. Multiwfn: A multifunctional wavefunction analyzer. J. Comput. Chem. 2012, 33, 580–592. [Google Scholar] [CrossRef]
- Bader, R.F.W.; Carroll, M.T.; Cheeseman, J.R.; Chang, C. Properties of atoms in molecules: Atomic volumes. J. Am. Chem. Soc. 1987, 109, 7968–7979. [Google Scholar] [CrossRef]
Sample Availability: Not available. |


| Level of Theory | Slope | Intercept | R2 | Level of Theory | Slope | Intercept | R2 |
|---|---|---|---|---|---|---|---|
| A1 | −0.1954 | 16.1237 | 0.9626 | D1 | −0.1987 | 16.3352 | 0.9598 |
| A2 | −0.1975 | 15.8213 | 0.9645 | D2 | −0.1947 | 15.5073 | 0.9598 |
| A3 | −0.2185 | 16.1879 | 0.9680 | D3 | −0.2201 | 16.2212 | 0.9653 |
| A4 | −0.2113 | 16.3958 | 0.9627 | D4 | −0.2082 | 16.2411 | 0.9577 |
| A5 | −0.2063 | 16.3542 | 0.9594 | D5 | −0.2027 | 16.0780 | 0.9535 |
| A6 | −0.2131 | 16.3967 | 0.9589 | D6 | −0.2095 | 15.9993 | 0.9534 |
| B1 | −0.1902 | 15.1863 | 0.9494 | E1 | −0.1953 | 15.8840 | 0.9553 |
| B2 | −0.1909 | 14.8019 | 0.9515 | E2 | −0.1953 | 15.3858 | 0.9511 |
| B3 | −0.2191 | 15.5109 | 0.9570 | E3 | −0.2167 | 15.8799 | 0.9616 |
| B4 | −0.2072 | 15.4614 | 0.9521 | E4 | −0.2118 | 16.1281 | 0.9536 |
| B5 | −0.1983 | 15.1505 | 0.9457 | E5 | −0.2038 | 15.8232 | 0.9490 |
| B6 | −0.2030 | 15.1449 | 0.9277 | E6 | −0.2125 | 15.9739 | 0.9485 |
| C1 | −0.2001 | 16.4372 | 0.9654 | F1 | −0.1996 | 15.8814 | 0.9613 |
| C2 | −0.1996 | 15.9700 | 0.9647 | F2 | −0.2123 | 15.9191 | 0.9625 |
| C3 | −0.2272 | 16.6499 | 0.9682 | F3 | −0.2285 | 16.3778 | 0.9702 |
| C4 | −0.2166 | 16.7945 | 0.9633 | F4 | −0.2198 | 16.3264 | 0.9661 |
| C5 | −0.2085 | 16..4776 | 0.9597 | F5 | −0.2094 | 16.0399 | 0.9550 |
| C6 | −0.2162 | 16.4972 | 0.9579 | F6 | −0.2187 | 16.1635 | 0.9616 |
| VS,max | pKaexp * | pKacal ** | ΔpKaexp − cal | |
|---|---|---|---|---|
| a | 70.3733 | 0.7200 | 0.8097 | −0.0897 |
| b | 66.8745 | 1.3900 | 1.5743 | -0.1843 |
| c | 66.2754 | 1.4700 | 1.7052 | −0.2352 |
| d | 65.6112 | 1.9000 | 1.8503 | 0.0497 |
| e | 62.0236 | 2.3600 | 2.6343 | −0.2743 |
| f | 61.9719 | 2.9500 | 2.6456 | 0.3044 |
| g | 59.0914 | 3.1600 | 3.2750 | −0.1150 |
| h | 54.9561 | 3.9100 | 4.1787 | −0.2687 |
| i | 54.6370 | 4.2200 | 4.2484 | 0.0284 |
| j | 52.8925 | 4.3600 | 3.6296 | −0.2696 |
© 2018 by the authors. Licensee MDPI, Basel, Switzerland. This article is an open access article distributed under the terms and conditions of the Creative Commons Attribution (CC BY) license (http://creativecommons.org/licenses/by/4.0/).
Share and Cite
Caballero-García, G.; Mondragón-Solórzano, G.; Torres-Cadena, R.; Díaz-García, M.; Sandoval-Lira, J.; Barroso-Flores, J. Calculation of VS,max and Its Use as a Descriptor for the Theoretical Calculation of pKa Values for Carboxylic Acids. Molecules 2019, 24, 79. https://doi.org/10.3390/molecules24010079
Caballero-García G, Mondragón-Solórzano G, Torres-Cadena R, Díaz-García M, Sandoval-Lira J, Barroso-Flores J. Calculation of VS,max and Its Use as a Descriptor for the Theoretical Calculation of pKa Values for Carboxylic Acids. Molecules. 2019; 24(1):79. https://doi.org/10.3390/molecules24010079
Chicago/Turabian StyleCaballero-García, Guillermo, Gustavo Mondragón-Solórzano, Raúl Torres-Cadena, Marco Díaz-García, Jacinto Sandoval-Lira, and Joaquín Barroso-Flores. 2019. "Calculation of VS,max and Its Use as a Descriptor for the Theoretical Calculation of pKa Values for Carboxylic Acids" Molecules 24, no. 1: 79. https://doi.org/10.3390/molecules24010079
APA StyleCaballero-García, G., Mondragón-Solórzano, G., Torres-Cadena, R., Díaz-García, M., Sandoval-Lira, J., & Barroso-Flores, J. (2019). Calculation of VS,max and Its Use as a Descriptor for the Theoretical Calculation of pKa Values for Carboxylic Acids. Molecules, 24(1), 79. https://doi.org/10.3390/molecules24010079