Article

4-Azafluorenone and α-Carboline Fluorophores with Green and Violet/Blue Emission

1
Faculty of Natural Sciences, Institute of Chemistry, Comenius University, Ilkovičova 6, Mlynská dolina CH-2, SK-842 15 Bratislava, Slovakia
2
SYNKOLA, Ltd., Ilkovičova 6, 842 15, Bratislava, Slovakia
3
Institute of Electronics and Photonics, Slovak University of Technology, Ilkovičova 3, SK-81219 Bratislava, Slovakia
*
Author to whom correspondence should be addressed.
Molecules 2019, 24(13), 2378; https://doi.org/10.3390/molecules24132378
Submission received: 5 June 2019 / Revised: 21 June 2019 / Accepted: 26 June 2019 / Published: 27 June 2019
(This article belongs to the Section Photochemistry)

Abstract

:
The emission properties of three 4-azafluorenone and five new α-carboline fluorophores in both solution and thin solid films were investigated. Fluorescence of the azafluorenone is clearly enhanced in thin solid films due to the presence of phenyl/biphenyl rotors, and these derivatives can be classified as green Aggregation-Induced Emission luminogens (AIEgens) with a non-emissive heteroaromatic core structure. Compared to azafluorenones, emission of α-carbolines is hypsochromically shifted to the blue region of the electromagnetic spectrum, and most of these derivatives exhibit strong violet-blue fluorescence in both solution and thin solid film layers. Further, the effective mobility and electroluminescence of new α-carbolines were investigated in prepared organic field-effect transistors and organic light-emitting diodes, respectively.

Graphical Abstract

1. Introduction

The development of luminescent materials allowed gaining enormous knowledge that has undoubtedly promoted high-tech innovations and benefited the whole world [1]. For the vast majority of practical applications, luminophores are used as films and aggregates. Due to intense intermolecular π−π stacking interactions in the aggregate state, luminophores with aromatic rings often suffer from the phenomenon called aggregation-caused quenching (ACQ), particularly those with a disc or rod-like shape, and their emission is significantly reduced compared to the solution.
Fortunately, aggregation-induced emission (AIE) is another photophysical phenomenon associated with chromophore aggregation [1,2,3]. Whereas the emissive chromophores as molecular species are called “luminophores”, those non-emissive as molecules but emissive as aggregates are named “luminogens”. Upon aggregate formation, the emission of luminogens without independent double bonds is induced or rejuvenated by restricted intramolecular rotation (RIR) or vibratory motions (RIV; in-plane/out-of-plane bending, flapping, stretching, scissoring, wagging, twisting, rocking, etc., vibrations) or the synergistic effects of both motions (RIM; restricted intramolecular motion). As revealed by the Thomson Reuters Essential Science Indicators, AIE has been ranked No. 3 among the Top 100 Research Frontiers in the field of Chemistry and Materials Science in 2013, reflecting the increasing global interest towards AIE research [1]. The exploitation of aggregation-induced emission luminogens (AIEgens) is both of great academic and practical importance and can stimulate rapid development in the areas of optoelectronics, bio-imaging, nanoscience, etc. [2]. Only recently, Jeffrey S. Moore et al. demonstrated a simple, robust, and sensitive fluorescence-based approach for autonomous detection of damage in polymeric materials and composites enabled by AIE [4].
Compared with the pure hydrocarbon aromatic rings, heterocycle rings usually have lone pair electrons or empty orbits [3]. The AIE phenomenon of several heterocycle-based AIE systems with high stability due to their whole aromatic conjugated structure, such as phenyl-substituted siloles, pyrazines, pyrroles, and oxazoliums, has been investigated to date, although most of them are difficult to synthesize and purify [2]. Moreover, their emissions are mainly centered in the blue light region, which greatly hampers their practical applications in the field of biological imaging. This makes the development of new heterocycle-based AIEgens very promising, but challenging. Houk and coworkers predicted that N-heteroacenes could act as n-type semiconducting or electron-accepting materials through theoretical calculation [5]. Moreover, N-substituted acenes are believed to be less sensitive to degradation through oxidation or dimerization [6,7,8]. Actually, the number, position, and valence states of N atoms in backbones of azacenes have a strong effect on their properties [9,10,11].
Efficient blue organic light-emitting devices (OLEDs) play an important role in both full-color display and solid-state lighting [12,13,14]. Especially deep blue emitting materials not only act as the energy-transfer donor for a low energy dopant to generate green, red, or white light, but also increase the color gamut and reduce power consumption [15,16,17,18]. Fluorene has been intensively studied as an attractive building block due to its high photoluminescence efficiency, high carrier mobility, and easy modification. Many fluorene-based blue emitters and their derivatives have been reported and exhibited impressive device performance [18,19]. Similarly, the fluorenone unit as a strong electron acceptor was recently used in thermally-activated delayed fluorescence (TADF) materials [20]. TADF material is a kind of noble metal-free fluorescent material able to transform triplet excitons into singlet excitons through reverse intersystem crossing (RISC) to achieve 100% internal quantum efficiency in modern blue OLEDs [20,21,22,23]. Efficient blue OLEDs play an important role in both full-color display and solid-state lighting [18]. Although azafluorenone was discovered decades ago and its derivatives have received widespread attention in various research fields, the application of azafluorenone and its derivatives in OLEDs is rarely reported. Only recent results showed the high potential of azafluorenone and its analogues in the building of efficient host materials [24].
Phosphorescent organic light-emitting diodes (PhOLEDs) have attracted considerable attention due to high-efficiency device performance in flat-panel display applications. However, the development of high-efficiency blue PhOLEDs still remains a challenge because a larger energy bandgap and higher triplet energy are required for carrier transport materials and blue dopants, when compared to red- and green-emitting layer materials [25]. Among high triplet energy host materials, carbazole has been widely used as the high triplet energy moiety because of high triplet energy, easy synthesis, and facile functionalization. However, it was difficult to balance holes and electrons in the emitting layer just by using carbazole-based host materials due to the strong hole transport character of carbazole. Therefore, carboline was developed as the high triplet energy unit to compensate for the poor electron transport properties of carbazole [26]. However, further development of the high triplet energy host materials derived from carboline is required due to insufficient device performances.
Herein, we report the results of a comprehensive investigation of the emission properties of three (one new) 4-azafluorenone and five new α-carboline fluorophores (Scheme 1) in both solution and thin solid films. Furthermore, the effective mobility and electroluminescence of new α-carbolines in prepared organic field-effect transistors and organic light-emitting diodes were also investigated.

2. Results and Discussion

2.1. Emission Characteristics

Azafluorenone derivatives 1a1c exhibited light absorption in the UV-A region of electromagnetic spectrum and only poor emission in solution (low fluorescent quantum yields; Table 1). This behavior was very similar to 9-fluorenone with a near 100% triplet quantum yield of fluorenone in the non-polar solvent due to the efficient ISC (intersystem crossing) processes in the S1 state, particularly in the non-polar solvents [27,28]. Contrary to parent 4-azafluorenone, the increased amount of water as a co-solvent in 1a1c THF solutions led to a significant increase in emission intensity, and the 4-azafluorenones thus exhibited the typical feature of aggregation-induced emission luminogens (AIEgens; Figure 1 and Figure S1). Because the AIE appeared only in the presence of freely-rotatable phenyl or biphenyl substituents, we assumed that this behavior resulted particularly from the restriction of intramolecular rotations (RIR) and not the restriction of intramolecular vibrations (RIV). The presence of the freely-rotatable phenyl and biphenyl substituent was reflected particularly in almost equal values of solution emission maxima (λE) of disubstituted 1a, 1b, and monosubstituted 1c derivative (Table 1). At a water content above 70–80%, the compounds started to precipitate from the solution. The emission of 1a1c was clearly enhanced also in thin solid film layers, and the studied azafluorenones therefore can be classified as new green AIEgens with a non-emissive heteroaromatic core structure (Figure 2). Particularly the azafluorenone 1b with a biphenyl rotor has a really high emission enhancement factor (αAIE), exceeding a value of 100 (Table 1).
The photophysical characteristics of new α-carboline derivatives 2a2e are shown in Table 2 and Table 3. Due to the non-planar geometry of the ground state, which hampered effective π-conjugation throughout the molecule (Table S1, Figures S2–S6), absorption of α-carbolines 2a2c and 2e fell again into the near UV-A region of the electromagnetic spectrum. Compared to azafluorenone derivatives 1a1c, the fluorescence of 2a2e was hypsochromically shifted to the blue region of the electromagnetic spectrum in both the solution and thin solid film layers.
Luminophores 2a and 2b preserved their solution emission efficiency also in thin solid films, and only carboline 2e behaved as a violet-blue AIEgen with an αAIE factor value of 7.4 (Figure 3).
Carboline 2c exhibited the aggregation-caused quenching (ACQ) phenomenon, and its fluorescent quantum yield significantly decreased from approximately 0.8 in solution to the value of 0.2 in the thin solid film (Table 3). As expected, luminophore 2d with a rigid phenylethynyl spacer absorbed light in the violet region of the electromagnetic spectrum due to increased conjugation of anthracene with the phenylethynyl linker and exhibited really strong emission in the solid state with almost 100% efficiency (ΦF ~ 1; Table 3). Interestingly, when irradiated with visible (Vis) light of a 405-nm wavelength, luminophore 2d in thin solid film underwent a photochemically-allowed [4πs + 4πs] dimerization through anthracene subunits, with the typical decrease of the long-wavelength absorption band in the Vis region and the appearance of a new strong light anthracene dimer absorption around 250 nm (Figure 4) [29]; contrary to the Diels–Alder dimer of 9-phenylethynylanthracene with the typical vibrational structure of the anthracene absorption band between 350 and 400 nm [30]. This Vis light-driven dimerization phenomenon in the solid state and its back thermally-driven reaction could be important for reversible optical writing and data storage applications [31,32,33]; however, the switching system needs deeper investigation, which is out of the scope of this paper. Bi- and tri-exponential fluorescence decay behavior in the solid films versus mono-exponential fluorescence decay in both polar and non-polar solutions, together with evident bathochromic shift of the emission maximum, clearly indicated aggregation of the carbolines 2a2e in the solid state (Table 3, Figure 5).
Although none of the studied carbolines exhibited the feature of delayed fluorescence (long fluorescence lifetime component due to the back ISC from the triplet to singlet excited state), the carboline luminophores 2a2e were further investigated as emissive layers in organic light-emitting diodes (OLEDs) and also as transport layers in organic field-effect transistors (OFETs).

2.2. Surface Potential Measurement

The surface potential evaluation by the Kelvin probe is recognized as a well-established method for estimation of charge transport energy levels. In principle, the surface potential depicts the energy difference between the work function of the metal substrate and the energy level of an organic semiconductor. Since the work function, 5.2 eV, of the selected metal (Pd) is close to the calculated HOMO level, the surface potential reflects hole transport through the metal/organic interface. Table 4 illustrates the HOMO energy levels of synthesized organic semiconductors. Subsequently, the optical energy gap was estimated using the Tauc plot from the absorbance spectra of the organic film deposited on the quartz substrate. Hence, the energies of LUMO levels, summarized in Table 4, were evaluated by the combination of the surface potential measurement and optical absorbance.

2.3. Organic Field-Effect Transistors

The output and transfer characteristics have been recorded for voltage ranging from −40 V to 40 V; however, the output current was significantly lower than 1 nA, which represents effective mobility on the level of 10−6 or lower. It should be noted that the same result provided a combination of low mobility and high contact resistance of the fabricated devices. Nevertheless, device optimization is beyond the scope of the present work.
Thermal stability is one of the key parameters for molecules used in organic electronics. As shown in Figures S7–S14, the studied 4-azafluorenone and α-carboline derivatives exhibited sufficient thermal stability, which ranged from 284 °C to 392 °C for 4-azafluorenones 1a1c and from 366 °C to 456 °C for α-carbolines 2a2e, respectively (the thermal stability was determined from the extrapolated onset temperature To).

2.4. Organic Light-Emitting Diodes

Figure 6 illustrates the energy band diagrams of the designed OLED devices. It should be noted here that since the deviation of HOMO for Compounds 2a2e varied from −4.5 to −5.7 eV, the design should be adjusted to the specific energy levels of material used as an emissive one.
The electroluminescence (EL) spectra of fabricated OLED devices with carboline 2a2e emissive layers are depicted in Figure 7. It should be noted here that the EL spectra were independent of the applied voltage, and only intensity increased proportional to the current density. Hence, all plotted spectra were normalized for better comparison. Even though the devices were not stable for long-period measurement, the devices exhibited reproducible characteristics, and spectra were identical for the group of fabricated devices (eight devices for each derivative).
Table 4 summarizes the optical energy gap and the energy transitions corresponding to the observed electroluminescence peaks. In most cases, the energy of emitted light was slightly lower than the energy gap, which is a common phenomenon of emitting materials. Only the derivative 2a exhibited separated EL with energy of 3.25 eV, which was higher than the energy gap. The origin of this emission should be in exciplex formation on the interface of the 2a and 5-(4-biphenylyl)-3-(tert-butylphenyl)-1,2,4-triazole (TAZ), which serves as an electron transport and hole blocking layer. Furthermore, the OLED device with the 2d emissive layer showed the presence of exciplex on the 2d-4,7-diphenyl-1,10-phenanthroline (BPhen) interface. The observed emission was in good agreement with the difference of the BPhen LUMO level and 2d HOMO level. As a result, the EL emission apparently differed from the photoluminescence emission due to the mutual interaction between the emissive layer and other layers in the OLED device.
Micrographs depicted in Figure 8 illustrate crystals and photoluminescence. Obviously, the broad emission spectra of some derivates led to the white-like emission even though the blue regions were present there. Since the derivate 2d did not exhibit blue emission, the color appeared yellowish.

3. Materials and Methods

3.1. Synthesis

All chemicals and solvents were purchased from Sigma-Aldrich (Merck KGaA, Darmstadt, Germany), Fluorochem (Derbyshire, UK) and Merck (Darmstadt, Germany) chemical companies. FTIR spectra were recorded on a Cary 630 FTIR (Agilent technologies, Santa Clara, CA, USA) using the ATR technique. Elemental analyses were obtained on an Elementar vario MICRO cube (Elementar, Langenselbold, Germany). Melting points were recorded on a Kofler apparatus Electrothermal IA-9200 (The Lab Warehouse, Grays, UK). NMR spectra were recorded in a 5-mm NMR tube on a Varian VNMRS 600-MHz spectrometer (600 MHz for 1H and 150 MHz for 13C, Agilent, Santa Clara, CA, USA) in DMSO-d6 or CDCl3, with tetramethylsilane (TMS) as an internal standard. High resolution mass spectrometry (HRMS) analyses were performed on a Thermo Scientific Orbitrap Fusion Mass Spectrometer (ThermoFisher Scientific, Waltham, MA, USA). Thermogravimetric (TGA) analysis was carried out on a LINSEIS STA PT 1600 analyzer (Linseis, Selb, Germany).

3.1.1. 4-Azafluorenones

Synthesis of 1a1c, general scheme (Scheme 2):
2,4-diphenyl-5H-indeno[1,2-b]pyridin-5-one (1a)
Acetophenone (1.18 mL,1.216 g, 10 mmol, 1 mol eq.), benzaldehyde (1.01 mL, 1.05 g, 10 mmol, 1 mol eq.), and ammonium acetate (1.54 g, 20 mmol,2 mol eq.) were added to a stirred solution of 1H-indene-1,3(2H)-dione (1.462 g, 10 mmol, 1 mol eq.) in anhydrous DMF (40 mL) under argon. The mixture was warmed up to 100 °C and stirred five hours at this temperature. The reaction mixture was cooled to RT and DMF removed under reduced pressure. Water (20 mL) and EtOAc (20 mL) were added to the remaining wax and stirred for 30 min. The mixture was extracted with EtOAc (3 × 20 mL). The combined organic phases were dried over Na2SO4 and concentrated under reduced pressure. The crude product was isolated by LCC (50 g SiO2; DCM in Hex 0/100 to 100/0) [34,35].
2,4-diphenyl-5H-indeno[1,2-b]pyridin-5-one: yield 16.5%, yellow crystalline solid, m.p.: 167–169 °C; 1H-NMR (600 MHz, DMSO-d6): δ (ppm) 8.31 (m, 2H), 7.96 (d, J = 7.3 Hz, 1H), 7.83 (s, 1H), 7.76 (m, 2H), 7.73 (dtr, J = 7.7, 7.3 Hz, 1H), 7.65 (d, J = 7 Hz, 1H), 7.49–7.57 (m, 7H); 13C-NMR (150 MHz, DMSO-d6): δ (ppm) 190.6, 166.0, 160.5, 149.4, 142.6, 137.9, 135.8, 135.36, 135.32, 131.9, 130.8, 130.0, 129.8 (2C), 129.3 (2C), 128.5 (2C), 127.9 (2C), 124.0, 122.7, 121.5, 121.1; HRMS m/z calculated for C24H15NO [M + H]+: 334.1232, found: 334.1223; IR (neat): ῡ = 1710, 1550, 746, 687 cm−1.
2-([1,1′-biphenyl]-4-yl)-4-phenyl-5H-indeno[1,2-b]pyridin-5-one (1b)
Biphenyl-4-acetaldehyde (1.963 g, 10 mmol, 1 mol eq.), benzaldehyde (1.01 mL,10 mmol, 1 mol eq.), and ammonium acetate (1.54 g, 20 mmol, 2 mol eq.) were added to a stirred solution of 1H-indene-1,3(2H)-dione 1 (1.462 g, 10 mmol, 1 mol eq.) in anhydrous DMF (40 mL) under argon. The mixture was warmed up to 110 °C and stirred five hours at this temperature. The reaction mixture was cooled to RT and DMF removed under reduced pressure. Water (20 mL) and EtOAc (20 mL) were added to the remaining wax and stirred 30 min. The mixture was extracted with EtOAc (5 × 10 mL). The combined organic phases were dried over Na2SO4 and concentrated under reduced pressure. The crude product was isolated by LCC (50 g SiO2; Hex to DCM).
2-([1,1′-biphenyl]-4-yl)-4-phenyl-5H-indeno[1,2-b]pyridin-5-one: yield 17.6%, yellow crystalline solid, m.p.: 214–216 °C; 1H-NMR (600 MHz, DMSO-d6): δ (ppm) 8.44 (d, J = 8.5 Hz, 2H), 8.00 (d, J = 7.3 Hz, 1H), 7.92 (s, 1H), 7.86 (d, J = 8.5 Hz, 1H), 7.80–7.76 (m, 4H), 7.74 (dtr, J = 7.6, 7.3 Hz, 1H), 7.76 (d, J = 7.3 Hz, 1H), 7.56 (dtr, J = 7.6, 7.3 Hz, 1H), 7.54–7.48 (m, 5H), 7.41 (tr, J = 7.6, 7.3 Hz, 1H); 13C-NMR (150 MHz, DMSO-d6): δ (ppm) 190.6, 166.1, 160.0, 149.5, 142.6, 142.3, 139.7, 136.9, 135.8, 135.4, 135.3, 132.0, 130.0, 129.9 (2C), 129.5 (2C), 128.5 (4C), 128.4, 127.5 (2C), 127.2 (2C), 124.0, 122.7, 121.4, 121.2; HRMS m/z calculated for C30H19NO [M + H]+: 410.1544, found: 410.1537; IR (neat): ῡ = 1702, 1546, 746, 689 cm−1.
2-phenyl-5H-indeno[1,2-b]pyridin-5-one (1c)
Dimethylamino-1-phenyl-2-propen-1-one (876 mg, 5 mmol, 1 mol eq.), ammonium acetate (611 mg, 10 mmol, 2 mol eq.), sodium iodide (150 mg, 1 mmol, 0.2 mol eq.), and cerium chloride (370 mg, 1.5 mmol 0.3 mol eq.) were added to a stirred solution of 1H-indene-1,3(2H)-dione (730 mg, 5 mmol, 1 mol eq.) in anhydrous isopropanol (25 mL) under argon. The mixture was refluxed 24 h. The reaction mixture was cooled to RT, and isopropanol was removed under reduced pressure. Water (20 mL) and EtOAc (20 mL) were added to the remaining wax and stirred 30 min. The mixture was extracted with EtOAc (3 × 20 mL). The combined organic phases were dried overNa2SO4 and concentrated on a rotavap. The crude product was purified by flash liquid chromatography (FLC) (50 g SiO2; Hex to DCM) [36].
2-phenyl-5H-indeno[1,2-b]pyridin-5-one: yield 24%, yellow crystalline solid, m.p.: 148–150 °C, 1H-NMR (600 MHz, DMSO-d6): δ (ppm) 8.22 (d, J = 7.9 Hz, 2H), 8.04 (d, J = 7.9 Hz, 1H), 7.95 (d, J = 7.9 Hz, 1H), 7.93 (d, J = 7.3 Hz, 1H), 7.74–7.70 (m, 2H), 7.57–7.50 (m, 4H); 13C-NMR (150 MHz, DMSO-d6): δ (ppm) 191.3, 165.0, 161.1, 143.3, 138.0, 136.1, 135.3, 133.0, 131.9, 130.9, 129.4 (2C), 127.6 (2C), 126.7, 124.3, 121.2, 120.5; HRMS: m/z calculated for C18H11NO [M + H]+: 258.0919, found: 258.0911; IR (neat): ῡ = 1708, 1568, 1408, 745, 687 cm−1.

3.1.2. α-Carbolines

A. Synthesis of 2a2c, general scheme (Scheme 3):
Preparation of Intermediates A and B:
Preparation of 9-(4-iodophenyl)-9H-pyrido[2,3-b]indole (Intermediate A) and 9-(4′-iodo-[1,1′-biphenyl]-4-yl)-9H-pyrido[2,3-b]indole (Intermediate B)
General Procedure A: 9-(4′-iodo-[1,1′-biphenyl]-4-yl)-9H-pyrido[2,3-b]indole (Intermediate B)
To a solution of 9H-pyrido[2,3-b]indole (1.00 g, 5.95 mmol, 1 mol eq.) in toluene/dry (60 mL) were added 3.62 g of 4,4′-diiodobiphenyl (8.93 mmol, 1.5 mol eq.), 6.32 g of K3PO4 (7.15 mmol, 5 mol eq.), 0.36 mL of trans-1,2-diaminocyklohexane (340 mg, 2.98 mmol, 0.5 mol eq.), and 225 mg of CuI (1.19 mmol., 0.2 mol eq.). The resulting mixture was refluxed under argon for 18 h. After consumption of all starting material (monitored by TLC), the reaction mixture was cooled to RT, filtered through Celite, and the filtration cake was washed with DCM. The crude product was isolated by FLC (CombiFlash; 330 g SiO2; 100 mL/min; Hex/EtOAc 3:1 v/v).
9-(4′-iodo-[1,1′-biphenyl]-4-yl)-9H-pyrido[2,3-b]indole: yield 1.06 g, 40%, white solid; m.p.: 210.1–212.3 °C [EtOAc/Hex]; 1H-NMR (CDCl3, 600 MHz): δ (ppm) 8.51 (dd, J = 4.8, 1.6 Hz, 1H), 8.41 (dd, J = 7.6, 1.6 Hz, 1H), 8.15 (d, J = 7.8 Hz, 1H), 7.82 (dm, J = 8.4 Hz, 2H), 7.79 (dm, J = 8.6 Hz, 2H), 7.74 (dm, J = 8.6 Hz, 2H), 7.56 (d, J = 8.2 Hz, 1H), 7.50 (ddd, J = 8.2, 7.0, 1.0 Hz, 1H), 7.42 (dm, J = 8.4 Hz, 2H), 7.36 (ddd, J = 8.0, 7.0, 1.0 Hz, 1H), 7.27–7.25 (m, 1H); 13C-NMR (CDCl3, 150 MHz): δ (ppm) 151.8, 146.3, 140.0, 139.9, 139.3, 138.0, 135.8, 129.0, 128.5, 128.2, 127.7, 127.1, 121.0, 120.93, 120.90, 116.5, 116.2, 110.4, 93.4; HRMS: m/z calculated for C23H15N2I [M + H]+; 447.0353, found: 447.0352.
9-(4-iodophenyl)-9H-pyrido[2,3-b]indole (Intermediate A)
Intermediate A was prepared according to General Procedure A.
9-(4-iodophenyl)-9H-pyrido[2,3-b]indole: yield 620 mg, 47%, white solid; m.p.: 145.0–146.7 °C [EtOAc/Hex]; 1H-NMR (CDCl3, 600 MHz): δ (ppm) 8.47 (dd, J = 5.0, 1.6 Hz, 1H), 8.38 (dd, J = 7.7, 1.6 Hz, 1H), 8.12 (ddd, J = 8.6, 7.9, 0.9 Hz, 1H), 7.93 (dm, J = 8.6 Hz, 2H), 7.50–7.47 (m, 2H), 7.43 (dm, J = 8.6 Hz, 2H), 7.37–7.32 (m, 1H), 7.25 (q, J = 7.7 Hz, 1H); 13C-NMR (CDCl3, 150 MHz): δ (ppm) 151.8, 146.6, 139.8, 139.0, 136.2, 129.3, 128.7, 127.3, 121.3, 121.2, 116.8, 116.6, 110.4, 92.7; HRMS: m/z calculated for C17H11N2I [M + H]+; 371.0040, found: 371.0039.
Reaction scheme (Scheme 4):
Preparation of final products 2a2c (Suzuki coupling reactions):
9-(4′-(anthracen-9-yl)-[1,1′-biphenyl]-4-yl)-9H-pyrido[2,3-b]indole (2a)
General Procedure B
In a 50-mL round-bottom flask, (intermediate B) (781 mg, 1.75 mmol, 1 mol eq.), anthracene-9-boronic acid (583 mg, 2.63 mmol, 1.5 mol eq.), aqueous solution of K2CO3 (2.2 mL, 4.38 mmol, 2.5 mol eq.), EtOH (8 mL), and toluene (16 mL) were stirred under argon for 5 min. Then, Pd(PPh3)4 (61 mg, 0.053 mmol, 0.05 mol eq.) was added. The flask was evacuated and backfilled with argon three times, and the resultant reaction mixture was stirred at reflux (oil bath) for 18 h. After cooling to RT, the solvent was evaporated under reduced pressure. The solid material was dissolved in DCM (30 mL), washed with water (3 × 10 mL), and dried over Na2SO4. After filtration and evaporation of the solvent, the crude product was purified by FLC (CombiFlash, 120 g SiO2, 75 mL/min, Hex/DCM 1:1 v/v).
9-(4′-(anthracen-9-yl)-[1,1′-biphenyl]-4-yl)-9H-pyrido[2,3-b]indole: yield 575 mg, 66%, pale yellow solid, m.p.: 312.4–316.8 °C [EtOAc/Hex]; 1H-NMR (CDCl3, 600 MHz): δ (ppm) 8.55 (dd, J = 4.8, 1.6 Hz, 1H), 8.53 (s, 1H), 8.43 (dd, 7.7, 1.6 Hz, 1H), 8.18–8.15 (m, 1H), 8.08 (dm, J = 8.6 Hz, 2H), 7.99 (dm, J = 8.6 Hz, 2H), 7.89 (dm, J = 8.2 Hz, 2H), 7.82 (dm, J = 8.6 Hz, 2H), 7.78 (dd, J = 8.9, 0.5 Hz, 2H), 7.62 (d, J = 8.3 Hz, 1H), 7.56 (dm, J = 8.2 Hz, 2H), 7.53 (ddd, J = 8.3, 7.2, 1.1 Hz, 1H), 7.51–7.47 (m, 2H), 7.42–7.36 (m, 3H), 7.28 (q, J = 7.7 Hz, 1H); 13C-NMR (CDCl3, 150 MHz): δ (ppm) 146.1, 140.3, 140.1, 139.5, 138.1, 136.6, 135.4, 131.8, 131.4, 130.2, 128.7, 128.5, 128.4, 127.7, 127.18, 127.15, 126.8, 125.4, 125.2, 121.03, 121.0, 120.9, 116.1, 110.6; HRMS: m/z calculated for C37H24N2 [M + H]+: 497.2012, found: 497.2012.
9-(4′-(pyren-1-yl)-[1,1′-biphenyl]-4-yl)-9H-pyrido[2,3-b]indole (2b)
Compound 2b was prepared according to General Procedure B.
9-(4′-(pyren-1-yl)-[1,1′-biphenyl]-4-yl)-9H-pyrido[2,3-b]indole: yield 308 mg, 53%, pale orange solid, m.p.: 235.6–237.4 °C [EtOAc/Hex]; 1H-NMR (CDCl3, 600 MHz): δ (ppm) 8.55 (dd, J = 4.8, 1.6 Hz, 1H), 8.43 (dd, J = 7.6, 1.6 Hz, 1H), 8.3 (d, J = 9.3 Hz, 1H), 8.27 (d, J = 7.8 Hz, 1H), 8.22 (d, J = 7.7 Hz, 1H), 8.19 (d, J = 7.4 Hz, 1H), 8.17 (d, J = 7.8 Hz, 1H), 8.12 (m, 1H), 8.08 (d, J = 9.3 Hz, 1H), 8.06 (d, J = 7.9 Hz, 1H), 8.04 (t, J = 7.6 Hz, 1H), 7.97 (dm, J = 8.2 Hz, 2H), 7.88 (dm, J = 8.2 Hz, 2H), 7.81 (dm, J = 8.2 Hz, 2H), 7.78 (dm, J = 8.2 Hz, 2H), 7.62 (d, J = 8.2 Hz, 1H), 7.53 (ddd, J = 8.2, 7.2, 1.0 Hz, 1H), 7.38 (ddd, J = 8.2, 7.2, 1.0 Hz, 1H), 7.28 (dd, J = 7.7 Hz, 1H); 13C-NMR (CDCl3, 150 MHz): δ (ppm) 145.9, 140.5, 140.3, 140.1, 139.4, 137.2, 131.5, 131.2, 131.0, 130.7, 128.53, 128.51, 127.7, 127.61, 127.60, 127.5, 127.4, 127.3, 127.2, 126.0, 125.3, 125.2, 125.0, 124.93, 124.90, 124.7, 121.1, 120.8, 116.1, 110.6; HRMS: m/z calculated for C39H24N2 [M + H]+: 521.2012, found: 521.2012.
9-(4-(10-phenylanthracen-9-yl)phenyl)-9H-pyrido[2,3-b]indole (2c)
Compound 2c was prepared according to General Procedure B.
9-(4-(10-phenylanthracen-9-yl)phenyl)-9H-pyrido[2,3-b]indole: yield 371 mg, 92%, pale yellow solid, m.p.: 265.5–268.0 °C [EtOAc/Hex]; 1H-NMR (CDCl3, 600 MHz): δ (ppm) 8.61 (dd, J = 4.8, 1.5 Hz, 1H), 8.47 (dd, J = 7.7, 1.5 Hz, 1H), 8.2 (d, J = 7.7 Hz, 1H), 7.95 (dm, J = 8.2 Hz, 2H), 7.9 (dm, J = 8.3 Hz, 2H), 7.78–7.16 (m, 5H), 7.65–7.60 (m, 2H), 7.6–7.55 (m, 2H), 7.53–7.49 (m, 2H), 7.43–7.35 (m, 5H), 7.32 (q, J = 7.7 Hz, 1H); 13C-NMR (CDCl3, 150 MHz): δ (ppm) 146.3, 140.1, 139.0, 138.3, 137.5, 136.2, 135.6, 132.6, 131.3, 129.91, 128.6, 128.4, 127.5, 127.2, 127.1, 127.0, 125.2, 125.1, 121.1, 121.0, 116I.8, 116.2, 110.7; HRMS: m/z calculated for C37H24N2 [M + H]+; 497.2012, found: 497.2011.
B. Synthesis of 2d and 2e, general scheme (Scheme 5):
9-(4-iodophenyl)-3-trifluoromethyl-9H-pyridino[2,3-b]indole (Intermediate C)
A portion of 3-trifluoromethyl-9H-pyridino[2,3-b]indole1 (826 mg, 3.5 mmol, 1 mol eq.), 1,4-diiodonenzene (1.24 g, 4.375 mmol, 1.25 mol eq.), K3PO4(3.715 g, 17.5 mmol, 5 mol eq.), CuI (9.135 g, 0.7 mmol, 0.5 mol eq.), and trans-1,2-diaminocyclohexane (200 mg, 0.21 mL, 1.75 mmol, 0.5 mol eq.) were suspended in dry toluene (25 mL) under an argon atmosphere, and the mixture was stirred at 110 °C for 18 h. After finishing the reaction, the mixture was filtered through Celite and washed with DCM. The organic phase was concentrated on a rotavap. The crude product was purified by FLC (CombiFlash, 120 g SiO2, 75 mL/min, Hex/DCM 1:1 v/v).
9-(4-iodophenyl)-3-trifluoromethyl-9H-pyridino[2,3-b]indole: yield 65.1%, white solid, m.p.: 151.4–153.2 °C; 1H-NMR (600 MHz, DMSO-d6): δ 8.72 (d, J = 1.2 Hz, 1H), 8.61 (d, J = 1.8 Hz, 1H), 8.17 (d, J = 7.8 Hz, 1H), 7.97 (m, 2H), 7.56 (dtr, J = 8.4 Hz, 7.0 Hz, 1H), 7.49 (d, J = 8.4 Hz, 1H), 7.43–7.40 (m, 3H); 13C-NMR (150 MHz, DMSO-d6): δ (ppm) 152.8, 143.68, 143.65, 140.5, 138.9, 135.3, 130.0, 128.9, 127.3, 126.7, 124.5, 122.84, 122.35, 120.41, 118.76 (q), 115.93, 111.01, 94.32; HRMS: m/z calculated for C18H10F3IN2 [M + H]: 438.914, found: 438.9913.
Reaction scheme (Scheme 6):
Note: The corresponding starting α-carboline was prepared according to the literature [37] in two steps with a satisfactory yield.
9-[4-(anthracene-9′-ethynyl)phenyl]- 3-trifluoromethyl-9H-pyridino[2,3-b]indole (2d)
9-(4-iodophenyl)-3-trifluoromethyl-9H-pyridino[2,3-b]indole (391 mg, 1.0 mmol, 1 mol eq.), 9-ethynylanthracene (242 mg, 1.2 mmol, 1.2 mol eq.), and PdCl2(PPh3)2 (20 mg, 0.03 mmol, 3 mol%) were dissolved in freshly-degassed triethylamine (10 mL) under argon atmosphere. After 5 min, copper (I) iodide (11.8 mg, 0.025 mmol, 2.5 mol%) was added. The reaction mixture was stirred at 70 °C for 16 h. The crude product was purified by FLC (CombiFlash 50 g silica gel) and gave the title compound (145 mg, 56.6%) as a yellow solid. The chromatographed product was crystallized from EtOAc (yellow powder, 84 mg. 32.78%).
9-[4-(anthracene-9-ethynyl)phenyl]-3-trifluoromethyl-9H-pyridino[2,3-b]indole: yield: 32.78%, yellow powder, m.p.: 242.0–244.5 °C, 1H-NMR (600 MHz, DMSO-d6): δ 9.20 (d, J = 1 Hz, 1H), 8.86 (d, J = 1 Hz, 1H), 8.76 (s, 1H), 8.68 (d, J = 8.4 Hz, 2H), 8.52 (d, J = 7.8 Hz, 2H), 8.22 (d, J = 8.4 Hz, 2H), 8.16 (d, J = 8.4 Hz, 2H), 7.90 (d, J = 8.4 Hz, 2H), 7.76 (dt, J = 7.2, 1.0 Hz, 2H), 7.67–7.63 (m, 4H), 7.50 (dt, J = 7.2, 1.0 Hz, 1H); 13C-NMR (150 MHz, DMSO-d6): δ (ppm) 153.2, 143.9 (t, J = 3.9 Hz), 140.8, 135.7, 133.2, 132.9, 131.4, 129.0, 128.4, 128.3, 127.5, 127.0, 126.9, 125.9, 125.9, 125.8, 125.8, 123.7, 122.1, 121.7, 119.8, 119.6, 117.1, 116.1, 11.1, 100.1, 87.7; HRMS: m/z calculated for C34H19F3N2 [M + H]+: 513.1573, found: 513.1574.
4,4′-Bis(3-trifluoromethyl-9H-pyridino[2,3-b]indole-9-yl)-1,1′-biphenyl (2e)
A portion of 3-trifluoromethyl-9H-pyridino[2,3-b]indole (605 mg, 2.50 mmol, 2.5 mol eq.), 4,4′-diiodobiphenyl (507 mg, 1.0 mmol, 1 mol eq.), K3PO4(5.31 g, 25 mmol, 20 mol eq.), CuI (80 mg, 0.5 mmol, 0.4 mol eq.), and trans-1,2-diaminocyclohexane (286 mg, 0.30 mL, 2.5 mmol, 2 mol eq.) were suspended in dry toluene (36 mL) under an argon atmosphere, and the mixture was stirred at 110 °C for 18 h. After finishing the reaction, the mixture was filtered through Celite and washed with DCM. The crude product was purified by FLC (CombiFlash, 120 g SiO2, 75 mL/min, Hex/DCM 3:1 to 2:3 v/v).
4,4′-Bis(3-trifluoromethyl-9H-pyridino[2,3-b]indole-9-yl)-1,1′-biphenyl: yield 420 mg, 67.46%, white solid, m.p.: >325 °C (dec) °C, 1H-NMR (600 MHz, DMSO-d6): δ (ppm) 9.20 (d, J = 1.8 Hz, 1H), 8.85 (d, J = 1.8 Hz, 1H), 8.51 (d, J = 7.8 Hz, 1H), 8.12 (dd, J = 8.4, 1.8 Hz, 2H), 7.88 (d, J = 8.4 Hz, 2H), 7.66–7.63 (m, 1H), 7.49 (t, J = 7.8 Hz, 1H); not sufficiently soluble for 13C-NMR in either DMSO-d6 or CDCl3; HRMS: m/z calculated for C36H20F6N4 [M + H]+: 623.1665, found: 623.1665.

3.2. Spectroscopic Measurements

Electronic absorption spectra were obtained on an Agilent 8453 diode array spectrophotometer (Hewlett Packard, Palo Alto, CA, USA). The solvents used were HPLC or UV spectroscopy grade (MeOH, for spectroscopy, Acros Organics, Geel, B; CHCl3, Uvasol®, Merck, Darmstadt, Germany) and were used without further purification. Solution fluorescence was measured in a 1-cm cuvette with an FSP 920 (Edinburgh Instruments, Livingston, UK) spectrofluorometer in a right-angle arrangement. Fluorescence of thin solid film layers on quartz substrate (1 cm × 3 cm) was measured in front-face arrangement (FSP 920 spectrofluorometer; Edinburgh Instruments, UK). The fluorescent quantum yield (ΦF) of the studied compounds in solution or in thin solid film layer was determined by Equations (1) and (2) using an integrating sphere (Edinburgh Instruments):
Φ F X = L Sam E Ref E Sam ( % )
corrected to re-absorption by:
Φ F = Φ F X 1 a + a Φ F X / 100   ( % )
where LSam is the area under the detected spectrum in the part of the spectrum where sample emission occurs, ERef is the area under the reflection part of the detected spectrum using the pure solvent (or uncovered quartz substrate) as the reference material (diffuse reflectance), ESam is the area under the reflection part of the detected spectrum after absorption by the sample, and a is the reabsorbed area. The time-resolved fluorescence measurements were performed on an FSP 920 (Edinburgh Instruments, UK) spectrofluorometer with a time-correlated single-photon counting (TCSPC) module and a red-sensitive high-speed photomultiplier in Peltier housing, featuring a Hamamatsu H5773-04 detector (R928P detector; Edinburgh Photonics, Livingston, UK). The excitation source was a 342.0-nm picosecond pulsed LED (Model EPLED-340; pulse width: 950.3 ps; Edinburgh Photonics, UK) or a 402.8-nm picosecond pulsed diode laser (Model EPL-405; pulse width: 60.5 ps; Edinburgh Photonics, UK). Fluorescence decay (lifetime) of thin solid film layers on the quartz substrate (1 cm × 3 cm) was measured in front-face arrangement. Reconvolution fit analysis software (F900, Edinburgh Instruments) was used for lifetime data analysis.

3.3. Organic Thin Films and Thin Film Devices

Organic thin films and thin film devices were fabricated by thermal evaporation under a high vacuum. All solid substrates such as quartz, glass covered by indium tin oxide (ITO), or silicon wafers, were cleaned in an ultrasonic bath subsequently by acetone, isopropyl alcohol, 20 vol% ethanolamine aqueous solution, and in deionized water prior to further processing. UV/ozone cleaning (UV-2 by SAMCO, Santa Clara, CA, USA) was performed just prior to thin film deposition to remove residual organic contamination. Then, a 100 nm-thick organic layer was thermally evaporated in a vacuum with a pressure lower than 10−4 Pa with a fixed deposition rate of 3 nm/min (SPECTROS 100 by Kurt J. Lesker, Jefferson Hills, PA, USA) controlled by a quartz crystal microbalance. The organic film thickness was verified by a mechanical profilometer (Dektak 150 by Bruker, Billerica, MA, USA).
Copper phthalocyanine (CuPc), 2,2′,2′′-(1,3,5-benzinetriyl)-tris(1-phenyl-1-H-benzimidazole) (TPBi), and 4,7-diphenyl-1,10-phenanthroline (BPhen) were supplied by Sigma-Aldrich, whereas 3-(biphenyl-4-yl)-5-(4-tert-butylphenyl)-4-phenyl-4H-1,2,4-triazole (TAZ) and 4,7-diphenyl-1,10-phenanthroline (BPhen) were provided by Ossila company. All materials were used without further purification. The CuPc film of 5 nm was used as a hole injection layer only, whereas other layers were designed as hole-transport layers or electron-transport and hole-blocking layers.
The optical and fluorescence microscopy images were taken by an optical microscope with a 1000× objective and large working distance under white light or UV (365 nm) illumination. Distance/size calibration was done using a 1951 USAF resolution test chart.
The energy level of the highest occupied molecular orbital (HOMO) was estimated using the surface potential measurement by means of the Kelvin probe method. A highly sensitive electrostatic voltmeter 320C and Kelvin probe electrode (Model 3250 by TREK Inc., Lockport, NY, USA) that allowed measuring of surface potential with an accuracy of 1 mV were used. The probe was situated in air approximately 1 mm above the organic layer surface. To perform the surface potential measurement, the palladium layer (100 nm) was deposited on the quartz substrate (1 cm × 3 cm), whereas the organic layer was subsequently deposited on half of the surface to record the surface potential profile and energy difference between the Fermi energy of the metal and the HOMO level of the organic semiconductor. We decided to use palladium due its environmental stability, as well as the well-defined Fermi energy of polycrystalline film (5.22 eV).
The organic light-emitting diodes (OLEDs) were used for estimation of electroluminescence spectra. The ITO was used as the transparent anode for hole injection, whereas the calcium protected by a silver layer was applied as the metal cathode for electron injection. The hole-injection, hole-transport, electron-transport, and electron-injection layers were selected in accordance with the specific values of the HOMO and LUMO energy levels of the emissive layer. Electroluminescence spectra were recorded in a nitrogen atmosphere by a spectrometer (AvaSpec-2048 FiberOptic Spectrometer by Avantes, Apeldoorn, The Netherlands).
The effective mobility was evaluated using organic field-effect transistor (OFET) devices with top-contact bottom-gate geometry. The silicon wafers with a 110-nm thermally-grown silicon dioxide (SiO2) layer as a substrate and gate electrode were used. Organic semiconductors were deposited onto a bare and 1,1,1,3,3,3-hexamethyldisilazane-modified (HMDS, Sigma-Aldrich) SiO2 surface to verify the film transport properties deposited on the hydrophilic, as well as the hydrophobic gate insulator. After the deposition of the semiconducting layer, copper was thermally evaporated through the shadow mask to form the source and drain electrodes. The OFET devices had channel lengths L and a width W of 50~200 μm and 2.5 mm, respectively. All output and transfer characteristics were measured in a nitrogen atmosphere using a semiconductor parameter analyzer (B1500A by Keysight, Santa Rosa, CA, USA).

3.4. Quantum-Chemical Calculations

Ground state molecular geometry was optimized at the B3LYP/G-311G* level of theory using Spartan ’10, Version 1.1.0 (Wavefunction, Inc., Irvine, CA, USA).

4. Conclusions

This paper investigated the emission properties of three 4-azafluorenone and five α-carboline fluorophores in solution and thin solid film layers. Azafluorenone derivatives exhibited typical features of AIEgens with the emission enhancement factor ranging from 10 to 150, whereas most of the α-carboline fluorophores preserved their strong violet-blue solution emission also in thin solid films. Although the prepared α-carbolines had low effective mobility in prepared organic field-effect transistors and the OLED devices with the α-carbolines as emissive layers were not stable for long-period measurement, both types of compounds could represent an important class of new fluorophores/fluorogens in the blue/green emission region or host materials in blue phosphorescent organic light-emitting diodes (PhOLEDs).

Supplementary Materials

The following are available online: Figure S1: Dependence of the fluorescence intensity of 1a and 1b on the water fraction in THF, Table S1: Calculated dihedral angle values between aryl moieties of 2a2e, Figures S2–S6: Molecular structure and ground state molecular geometry of 2a2e, Figures S7–S14: Thermogravimetric curves of 1a1c and 2a2e, Figures SX1–SX12: 1H-NMR, 13C-NMR, FTIR, and HRMS spectra of 4-azafluorenones 1a1c; Figures SX13–SX43: 1H-NMR, 13C-NMR, FTIR, and HRMS spectra of α-carbolines 2a2e and Intermediates A, B, and C.

Author Contributions

M.C. wrote the article and designed the experiments; P.D. and M.Č. synthesized and characterized carbolines 2a2e; H.B. synthesized and characterized azafluorenones 1a1c; R.F. designed the synthesis; J.D. carried out all UV-Vis and fluorescence experiments and determined the basic spectral characteristics; J.F. carried out the quantum-chemical calculations and performed all NMR experiments; M.W. designed the mobility and electroluminescence experiments and wrote the article part related to these experiments; J.J. and M.N. carried out and interpreted the experiments related to OFETs and OLEDs; A.G. designed the whole project and experiments.

Funding

This work was financially supported by the Slovak Research and Development Agency (Grant APVV-15-0087).

Conflicts of Interest

The authors declare no conflict of interest. The founding sponsors had no role in the design of the study; in the collection, analyses, or interpretation of data; in the writing of the manuscript; nor in the decision to publish the results.

References

  1. Mei, J.; Leung, N.L.C.; Kwok, R.T.K.; Lam, J.W.Y.; Tang, B.Z. Aggregation-Induced Emission: Together We Shine, United We Soar! Chem. Rev. 2015, 115, 11718–11940. [Google Scholar] [CrossRef] [PubMed]
  2. Chen, M.; Hu, X.; Liu, J.; Li, B.; Leung, N.L.C.; Viglianti, L.; Cheung, T.S.; Sung, H.H.Y.; Kwok, R.T.K.; Williams, I.D.; et al. Rational design of red AIEgens with a new core structure from non-emissive heteroaromatics. Chem. Sci. 2018, 9, 7829–7834. [Google Scholar] [CrossRef] [Green Version]
  3. Shen, P.; Zhuang, Z.; Zhao, Z.; Tang, B.Z. AIEgens based on main group heterocycles. J. Mater. Chem. C 2018, 6, 11835–11852. [Google Scholar] [CrossRef]
  4. Robb, M.J.; Li, W.; Gergely, R.C.R.; Matthews, C.C.; White, S.R.; Sottos, N.R.; Moore, J.S. A Robust Damage-Reporting Strategy for Polymeric Materials Enabled by Aggregation-Induced Emission. ACS Cent. Sci. 2016, 2, 598–603. [Google Scholar] [CrossRef] [PubMed]
  5. Winkler, M.; Houk, K.N. Nitrogen-rich oligoacenes: Candidates for n-channel organic semiconductors. J. Am. Chem. Soc. 2007, 129, 1805–1815. [Google Scholar] [CrossRef]
  6. Li, G.; Duong, H.M.; Zhang, Z.; Xiao, J.; Liu, L.; Zhao, Y.; Zhang, H.; Huo, F.; Li, S.; Ma, J.; et al. Approaching a stable, green twisted heteroacene through “clean reaction” strategy. Chem. Commun. 2012, 48, 5974. [Google Scholar] [CrossRef]
  7. Wu, Y.; Yin, Z.; Xiao, J.; Liu, Y.; Wei, F.; Tan, K.J.; Kloc, C.; Huang, L.; Yan, Q.; Hu, F.; et al. Crystal Structure and Phototransistor Behavior of N-Substituted Heptacence. ACS Appl. Mater. Interfaces 2012, 4, 1883–1886. [Google Scholar] [CrossRef]
  8. Li, G.; Wu, Y.; Gao, J.; Wang, C.; Li, J.; Zhang, H.; Zhao, Y.; Zhao, Y.; Zhang, Q. Synthesis and Physical Properties of Four Hexazapentacene Derivatives. J. Am. Chem. Soc. 2012, 134, 20298–20301. [Google Scholar] [CrossRef]
  9. Bunz, U.H.F.; Engelhart, J.U.; Lindner, B.D.; Schaffroth, M. Large N-Heteroacenes: New Tricks for Very Old Dogs? Angew. Chemie Int. Ed. 2013, 52, 3810–3821. [Google Scholar] [CrossRef]
  10. Miao, Q. N-Heteropentacenes and N-Heteropentacenequinones: From Molecules to Semiconductors. Synlett 2012, 23, 326–336. [Google Scholar] [CrossRef]
  11. Li, J.; Yan, F.; Gao, J.; Li, P.; Xiong, W.-W.; Zhao, Y.; Sun, X.W.; Zhang, Q. Synthesis, physical properties and OLED performance of azatetracenes. Dye. Pigment. 2015, 112, 93–98. [Google Scholar] [CrossRef]
  12. Zhang, Y.; Lai, S.-L.; Tong, Q.-X.; Lo, M.-F.; Ng, T.-W.; Chan, M.-Y.; Wen, Z.-C.; He, J.; Jeff, K.-S.; Tang, X.-L.; et al. High Efficiency Nondoped Deep-Blue Organic Light Emitting Devices Based on Imidazole-π-triphenylamine Derivatives. Chem. Mater. 2012, 24, 61–70. [Google Scholar] [CrossRef]
  13. Yang, X.; Xu, X.; Zhou, G. Recent advances of the emitters for high performance deep-blue organic light-emitting diodes. J. Mater. Chem. C 2015, 3, 913–944. [Google Scholar] [CrossRef]
  14. Zhao, L.; Wang, S.; Ding, J.; Wang, L. Solution processible distyrylarylene-based fluorescent dendrimers: Tuning of carbazole-dendron generation leads to nondoped deep-blue electroluminescence. Org. Electron. 2018, 53, 43–49. [Google Scholar] [CrossRef]
  15. Liu, H.; Bai, Q.; Li, W.; Guo, Y.; Yao, L.; Gao, Y.; Li, J.; Lu, P.; Yang, B.; Ma, Y. Efficient deep-blue non-doped organic light-emitting diode with improved roll-off of efficiency based on hybrid local and charge-transfer excited state. RSC Adv. 2016, 6, 70085–70090. [Google Scholar] [CrossRef]
  16. Wang, Z.; Li, X.; Xue, K.; Li, H.; Zhang, X.; Liu, Y.; Yu, Z.; Lu, P.; Chen, P. Towards stable deep-blue emission and low efficiency roll-off in OLEDs based on phenanthroimidazole dimers. J. Mater. Chem. C 2016, 4, 1886–1894. [Google Scholar] [CrossRef]
  17. Chen, W.-C.; Yuan, Y.; Wu, G.-F.; Wei, H.-X.; Tang, L.; Tong, Q.-X.; Wong, F.-L.; Lee, C.-S. Staggered Face-to-Face Molecular Stacking as a Strategy for Designing Deep-Blue Electroluminescent Materials with High Carrier Mobility. Adv. Opt. Mater. 2014, 2, 626–631. [Google Scholar] [CrossRef]
  18. Sun, W.; Zhou, N.; Xiao, Y.; Wang, S.; Li, X. Novel carbazolyl-substituted spiro[acridine-9,9′-fluorene] derivatives as deep-blue emitting materials for OLED applications. Dye. Pigment. 2018, 154, 30–37. [Google Scholar] [CrossRef]
  19. Mucur, S.P.; Kök, C.; Bilgili, H.; Canımkurbey, B.; Koyuncu, S. Conventional and inverted organic light emitting diodes based on bright green emmisive polyfluorene derivatives. Polymer (Guildf). 2018, 151, 101–107. [Google Scholar] [CrossRef]
  20. Gan, L.; Li, X.; Cai, X.; Liu, K.; Li, W.; Su, S.-J. D–A–D-type orange-light emitting thermally activated delayed fluorescence (TADF) materials based on a fluorenone unit: simulation, photoluminescence and electroluminescence studies. Beilstein J. Org. Chem. 2018, 14, 672–681. [Google Scholar] [CrossRef]
  21. Ni, F.; Zhu, Z.; Tong, X.; Xie, M.; Zhao, Q.; Zhong, C.; Zou, Y.; Yang, C. Organic emitter integrating aggregation-induced delayed fluorescence and room-temperature phosphorescence characteristics, and its application in time-resolved luminescence imaging. Chem. Sci. 2018, 9, 6150–6155. [Google Scholar] [CrossRef] [PubMed] [Green Version]
  22. Huang, W.; Einzinger, M.; Zhu, T.; Chae, H.S.; Jeon, S.; Ihn, S.-G.; Sim, M.; Kim, S.; Su, M.; Teverovskiy, G.; et al. Molecular Design of Deep Blue Thermally Activated Delayed Fluorescence Materials Employing a Homoconjugative Triptycene Scaffold and Dihedral Angle Tuning. Chem. Mater. 2018, 30, 1462–1466. [Google Scholar] [CrossRef]
  23. Zhang, Y.-X.; Yuan, Y.; Wang, Q.; Hu, Y.; Khan, A.; Jiang, Z.-Q.; Liao, L.-S. Highly efficient non-doped deep-blue organic light-emitting diodes by employing a highly rigid skeleton. Dye. Pigment. 2018, 158, 396–401. [Google Scholar] [CrossRef]
  24. Liu, X.-Y.; Zhang, Y.-J.; Fei, X.; Ran, Q.; Fung, M.-K.; Fan, J. Diazaspirocycles: novel platforms for efficient phosphorescent organic light-emitting diodes. J. Mater. Chem. C 2019, 7, 1370–1378. [Google Scholar] [CrossRef]
  25. Kim, S.J.; Kim, Y.J.; Son, Y.H.; Hur, J.A.; Um, H.A.; Shin, J.; Lee, T.W.; Cho, M.J.; Kim, J.K.; Joo, S.; et al. High-efficiency blue phosphorescent organic light-emitting diodes using a carbazole and carboline-based host material. Chem. Commun. 2013, 49, 6788. [Google Scholar] [CrossRef] [PubMed]
  26. Lee, C.W.; Im, Y.; Seo, J.-A.; Lee, J.Y. Carboline derivatives with an ortho-linked terphenyl core for high quantum efficiency in blue phosphorescent organic light-emitting diodes. Chem. Commun. 2013, 49, 9860. [Google Scholar] [CrossRef] [PubMed]
  27. Chang, C.-W.; Sølling, T.I.; Diau, E.W.-G. Revisiting the photophysics of 9-fluorenone: Ultrafast time-resolved fluorescence and theoretical studies. Chem. Phys. Lett. 2017, 686, 218–222. [Google Scholar] [CrossRef]
  28. Ghosh, I.; Mukhopadhyay, A.; Koner, A.L.; Samanta, S.; Nau, W.M.; Moorthy, J.N. Excited-state properties of fluorenones: influence of substituents, solvent and macrocyclic encapsulation. Phys. Chem. Chem. Phys. 2014, 16, 16436–16445. [Google Scholar] [CrossRef]
  29. Breton, G.W.; Vang, X. Photodimerization of Anthracene. J. Chem. Educ. 1998, 75, 81. [Google Scholar] [CrossRef]
  30. Becker, H.-D.; Andersson, K. Photochemical Diels—Alder dimerization of 9-phenylethylnylanthracene. J. Photochem. 1984, 26, 75–77. [Google Scholar] [CrossRef]
  31. Tu, M.; Reinsch, H.; Rodríguez-Hermida, S.; Verbeke, R.; Stassin, T.; Egger, W.; Dickmann, M.; Dieu, B.; Hofkens, J.; Vankelecom, I.; et al. Reversible Optical Writing and Data Storage in an Anthracene-Loaded Metal-Organic Framework. Angew. Chemie 2018, 58, 2423–2427. [Google Scholar] [CrossRef] [PubMed]
  32. Zdobinsky, T.; Sankar Maiti, P.; Klajn, R. Support Curvature and Conformational Freedom Control Chemical Reactivity of Immobilized Species. J. Am. Chem. Soc. 2014, 136, 2711–2714. [Google Scholar] [CrossRef] [PubMed]
  33. Kim, M.; Hohman, J.N.; Cao, Y.; Houk, K.N.; Ma, H.; Jen, A.K.-Y.; Weiss, P.S. Creating favorable geometries for directing organic photoreactions in alkanethiolate monolayers. Science 2011, 331, 1312–1315. [Google Scholar] [CrossRef] [PubMed]
  34. Moustafa, A.H.; Kaddah, A.M.; El-Abbady, S.A.; Gado, S.H. Cyclocondensation of Cyanoacetamide and N-Substituted Cyanoacetamides with 2-Arylmethylene indan-1-one and -indan-1,3-diones. J. Prakt. Chemie 1982, 324, 1045–1051. [Google Scholar] [CrossRef]
  35. Shrestha, A.; Park, S.; Jang, H.J.; Katila, P.; Shrestha, R.; Kwon, Y.; Lee, E.-S. A new phenolic series of indenopyridinone as topoisomerase inhibitors: Design, synthesis, and structure-activity relationships. Bioorg. Med. Chem. 2018, 26, 5212–5223. [Google Scholar] [CrossRef] [PubMed]
  36. Chen, G.; Wang, Z.; Zhang, X.; Fan, X. Synthesis of Functionalized Pyridines via Cu(II)-Catalyzed One-Pot Cascade Reactions of Inactivated Saturated Ketones with Electron-Deficient Enamines. J. Org. Chem. 2017, 82, 11230–11237. [Google Scholar] [CrossRef] [PubMed]
  37. Hostyn, S.; Van Baelen, G.; Lemière, G.L.F.; Maes, B.U.W. Synthesis of α-Carbolines Starting from 2,3-Dichloropyridines and Substituted Anilines. Adv. Synth. Catal. 2008, 350, 2653–2660. [Google Scholar] [CrossRef]
Sample Availability: Samples of the compounds are not available from the authors.
Scheme 1. Molecular structure of the studied 4-azafluorenones 1a1c and α-carbolines 2a2e.
Molecules 24 02378 sch001
Figure 1. Fluorescence spectra of 1a (left) and 1b (right) in THF/water mixtures with different water fractions. AIE, aggregation-induced emission.
Molecules 24 02378 g001
Figure 2. Absorption and emission spectrum of 1b in the thin solid film layer on the quartz substrate (λEXC = λA) (left) and micrograph of synthesized azafluorenone 1b under visible (white) light and UV light (365 nm). The micrograph illustrates the crystals and fluorescence of 1b in thin solid film (right).
Molecules 24 02378 g002
Figure 3. Absorption and emission spectrum of 2e in the thin solid film layer on the quartz substrate (λEXC = λA) (left) and the micrograph of synthesized carboline 2e under visible (white) light and UV light (365 nm). The micrograph illustrates the crystals and fluorescence of 2e in thin solid film (right).
Molecules 24 02378 g003
Figure 4. Evolution of the absorption spectrum of carboline 2e in the thin solid film layer on the quartz substrate during its irradiation with Vis light of a 405-nm wavelength (four epoxy-encased LED diodes; LED405E from Thorlabs) (left) and the proposed structure of the anthracene dimer due to photochemically-allowed [4πs+ 4πs] dimerization through anthracene subunits during the 2e thin solid film irradiation with Vis light (λirr = 405 nm) (right).
Molecules 24 02378 g004
Figure 5. Fluorescence decay profiles of the carbolines 2e (A) and 2d (B)in thin solid films obtained using an excitation wavelength of 340 nm and 402.8 nm, respectively (monitored at emission maximum; IRF, instrument response function).
Molecules 24 02378 g005
Figure 6. Energy band diagrams of OLED devices using (a) 2a, (b) 2b, (c) 2c, (d) 2d, and (e) 2e as the emissive layer.
Molecules 24 02378 g006
Figure 7. Normalized electroluminescence spectra of (a) 2a, (b) 2b, (c) 2c, (d) 2d, and (e) 2e.
Molecules 24 02378 g007
Figure 8. Micrographs of synthesized carboline derivatives 2a2d under visible (white) light and UV light (365 nm). The micrographs illustrate the crystals and photoluminescence of (a) 2a, (b) 2b, (c) 2c, and (d) 2d.
Molecules 24 02378 g008
Scheme 2. Synthesis of the studied 4-azafluorenones 1a1c.
Molecules 24 02378 sch002
Scheme 3. Synthesis of the studied α-carbolines 2a2c.
Molecules 24 02378 sch003
Scheme 4. Synthesis of the intermediates A and B.
Molecules 24 02378 sch004
Scheme 5. Synthesis of the studied α-carbolines 2d and 2e.
Molecules 24 02378 sch005
Scheme 6. Synthesis of the intermediate C.
Molecules 24 02378 sch006
Table 1. Photophysical properties of the studied azafluorenone derivatives 1a1c.
CpdλA (nm)λE (nm)ΦF (%)αAIE
SolnSolnSolnFilm
1a3864751.011.211.2
1b3884770.575.0150.0
1c3764761.026.126.1
Cpd, compound; λA, absorption maximum; λE, emission maximum; ΦF, fluorescent quantum yield; αAIE, emission enhancement factor (αAIE = ΦF(Film)/ΦF(Solution)); Soln, THF solution.
Table 2. Photophysical (absorption and luminescent) properties of the studied carboline derivatives 2a2e.
CpdλA (nm)λF (nm)
CHCl3MeOHCHCl3MeOHFilm
2a368365425/415 *408/420 *450
2b340342407407455
2c376372422/433 *427/413 *460
2d403399437432450
2e285294401414420
λA, long-wavelength absorption maximum; λF, fluorescence maximum; *, peak with a slightly smaller intensity due to the vibrational structure of the emission band.
Table 3. Fluorescence characteristics of the studied carboline derivatives 2a2e.
CpdΦF CHCl3ΦF CH3OHΦF ssτ(CHCl3) (ns)τ(CH3OH) (ns)τ(ss) (ns)
2a0.580.290.49τ = 3.52
χ2 = 1.181
τ = 3.47
χ2 = 1.161
τ1 = 1.58 (23.0%)
τ2 = 4.07 (77.0%)
χ2 = 1.194
2b0.480.530.41τ = 2.91
χ2 = 1.149
τ = 5.09
χ2 = 1.163
τ1 = 0.64 (65.1%)
τ2 = 2.58 (29.0%)
τ3 = 13.1 (5.9%)
χ2 = 1.124
2c0.940.700.23τ = 5.05
χ2 = 1.172
τ = 5.11
χ2 = 1.159
τ1 = 1.30 (48.7%)
τ2 = 3.86 (51.3%)
χ2 = 1.113
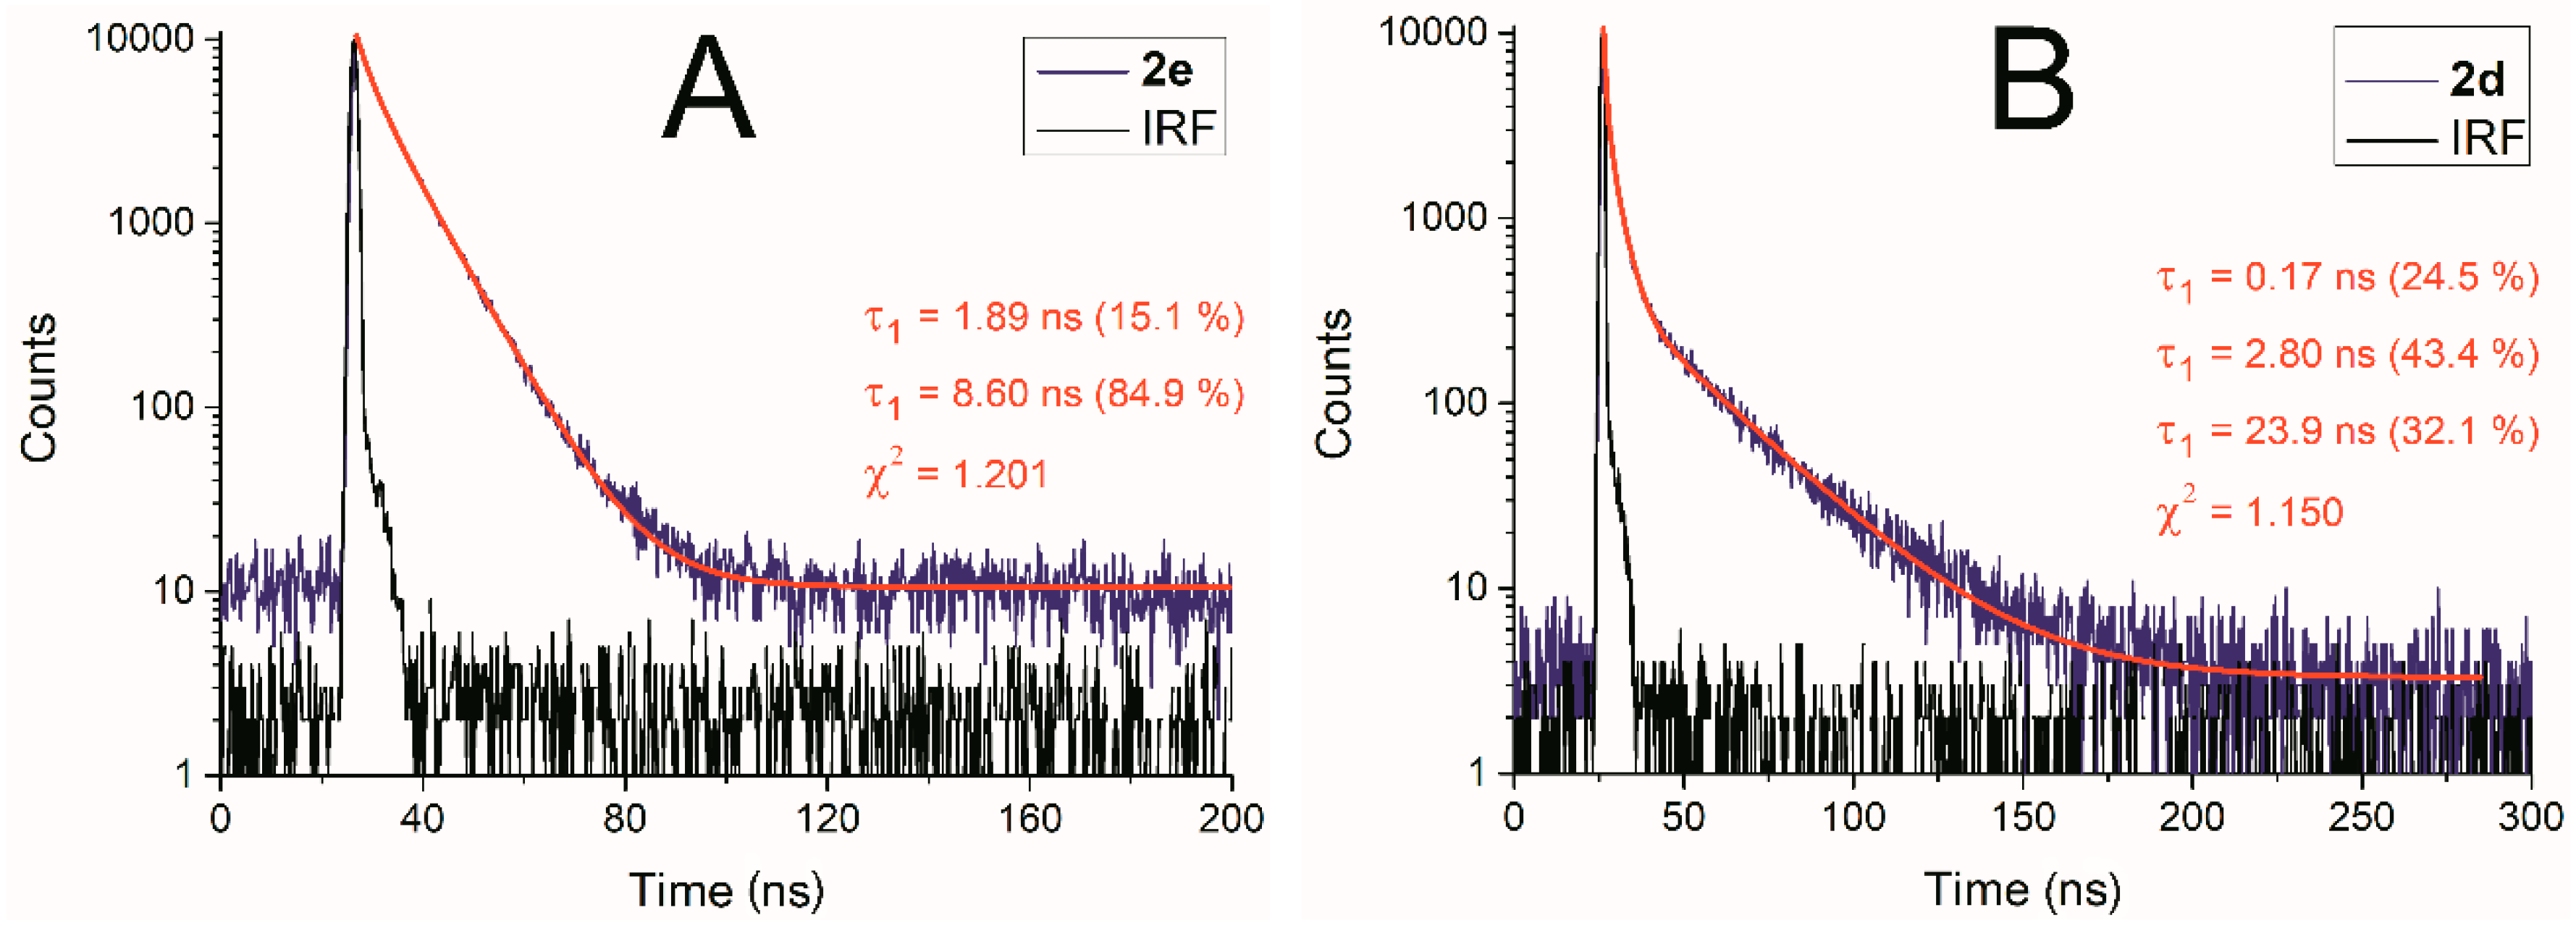
2d0.680.741.00τ = 2.95
χ2 = 1.155
τ = 3.49
χ2 = 1.135
τ1 = 0.17 (24.5%)
τ2 = 2.80 (43.4%)
τ3 = 23.9 (32.1%)
χ2 = 1.150
2e0.070.070.52Low signal intensityLow signal intensityτ1 = 1.89 (15.1%)
τ2 = 8.60 (84.9%)
χ2 = 1.201
ΦF, fluorescent quantum yield; τ, fluorescence lifetime; χ2, reduced chi-squared (quality of fluorescence lifetime fitting) %, relative fluorescence intensity of the corresponding component; ss, solid state.
Table 4. Comparison of optical energy gaps and electroluminescence peaks, together with the energy of frontier orbitals. EL, electroluminescence.
CpdEg,opt (eV)EL (eV)HOMO (eV)LUMO (eV)
2a3.083.25; 2.45−5.7−2.6
2b3.262.55−5.7−2.4
2c3.052.85; 2.60−5.0−2.0
2d2.822.30−4.5−1.7
2e3.082.95; 2.60; 2.00−4.7−1.6
HOMO energy, estimated using the surface potential measurement by means of the Kelvin probe method; LUMO energy, calculated from the estimated HOMO energy and optical energy gap of the organic film deposited on the quartz substrate.

