Article

Effect of the Substitution Position on the Electronic and Solvatochromic Properties of Isocyanoaminonaphthalene (ICAN) Fluorophores

1
Department of Applied Chemistry, University of Debrecen, Egyetem tér 1., H-4032 Debrecen, Hungary
2
Institute of Organic Chemistry, Research Centre for Natural Sciences, Hungarian Academy of Sciences, Magyar tudósok körútja 2., H-1519 Budapest, Hungary
*
Author to whom correspondence should be addressed.
Molecules 2019, 24(13), 2434; https://doi.org/10.3390/molecules24132434
Submission received: 9 May 2019 / Revised: 26 June 2019 / Accepted: 30 June 2019 / Published: 2 July 2019
(This article belongs to the Special Issue Lumino and Fluorophores—Illuminating Science and Technology)

Abstract

:
The properties of 1,4-isocyanoaminonaphthalene (1,4-ICAN) and 2,6-isocyanoaminonaphthalene (2,6-ICAN) isomers are discussed in comparison with those of 1,5-isocyanoaminonaphthalene (1,5-ICAN), which exhibits a large positive solvatochromic shift similar to that of Prodan. In these isocyanoaminonaphthalene derivatives, the isocyano and the amine group serve as the donor and acceptor moieties, respectively. It was found that the positions of the donor and the acceptor groups in these naphthalene derivatives greatly influence the Stokes and solvatochromic shifts, which decrease in the following order: 1,5-ICAN > 2,6-ICAN > 1,4-ICAN. According to high-level quantum chemical calculations, this order is well correlated with the charge transfer character of these compounds upon excitation. Furthermore, unlike 1,5-ICAN, the 1,4-ICAN and 2,6-ICAN isomers showed relatively high quantum yields in water, that were determined to be 0.62 and 0.21, respectively. In addition, time-resolved fluorescence experiments revealed that both the radiative and non-radiative decay rates for these three ICAN isomers varied unusually with the solvent polarity parameter ET(30). The explanations of the influence of the solvent polarity on the resulting steady-state and time-resolved fluorescence emission spectra are also discussed.

Graphical Abstract

1. Introduction

“Smart” fluorophores, whose emission properties, e.g., the color and the intensity of the emitted light varying with the polarity [1,2,3] or the viscosity of their microenvironment [4], have attracted considerable attention due to their fast and non-destructive abilities to detect changes in their local environment. Thus, the utility of such fluorophores ranges from their applications as probes for the determination of critical micelle concentrations (cmc) of various surfactants [5] through viscosity measurements of biological membranes [6,7] to monitoring the interactions of protein bindings [8,9]. Fluorophores, whose fluorescence emissions are particularly sensitive to the polarity of their microenvironment alter the emitted light color upon the effect of polarity change, and are hence called solvatochromic fluorophores [10,11]. Such molecules are typically built up from an electron-donating (donor, D) and an electron-withdrawing (acceptor, A) group, connected through an aromatic π-linker moiety, which is usually naphthalene or a fluorene ring-system. These so-called D-π-A type solvatochromic fluorophores are, therefore, based on the shift of the electron density from the donor group to the acceptor moiety through the π-system upon excitation; hence, an intramolecular charge-transfer (ICT) takes place [10,11,12,13,14]. Furthermore, ICT may give rise to an increase in the excited dipole moment state with respect to that of the ground state. It is believed that the presence of ICT, in the absence of any specific interaction, i.e., hydrogen-bonding, between the fluorophore and the solvent, is the primary reason for the increasing solvatochromic and Stokes shifts with solvent polarity. Until now, several “push-pull” D-π-A type solvatochromic fluorophores have been synthesized. The seminal and the most prominent members of this fluorophore family displaying notable solvatochromism are the 2-(dimethylamino)-6-propionylnaphthalene, also known as Prodan and its related derivatives [2]. Recently, we have synthesized a series of new solvatochromic fluorophores based on the preliminary concept of ICT in which the donor amine and the acceptor isocyano groups are connected via the naphthalene moiety in its 1,5-positions to yield 1,5-isocyanoamino-(1,5-ICAN) derivatives [15,16,17,18]. The 1,5-ICAN exhibits large solvatochromic and Stokes shifts similar to the Prodan [15]. Despite their very simple structure, few members of the isocyanoaminoarene group have been prepared and studied until recently, most probably due to the infamous putrid odor of the common isocyano compounds. Nevertheless, none of the ICAN derivatives prepared by us have any odor at all. On the contrary, they proved to be one of the most versatile “smart” fluorophore dye families, which found applications as nontoxic supravital stains for the investigation and characterization of both plant and animal cells [19,20], enable the selective detection of Hg2+, and at the same time are able to indicate the presence of Ag+, which is unprecedented among fluorescent sensors [21]. In addition, to the best of our knowledge, ICAN is the simplest and lowest molecular weight fluorophore that has ever been used for fluorescent Hg(II) detection. ICANs can also be utilized in silver analytics as isocyanide ligands, and their silver complexes turned out to enhance the contrast during cell staining applications [18]. Furthermore, substitutions of the hydrogen atoms of the amino group in the 1,5-ICAN derivative with methyl-, allyl- or acryl groups have made the 1,5-ICAN more appropriate as vital fluorescent probes [17,19]. The field of isocyanoaminoarenes is still unexplored; however, we believe that they may contain the considerable potential to become versatile smart dyes. However, the rational design and development of more efficient solvatochromic fluorophores require a deeper understanding of their structure-property relationships. One of the key factors, which have not been explored yet in connection with these ICAN fluorophores, is the effect of the substitution position of the amino and the isocyano groups. Thus, in this article, the electronic, solvatochromic and the photophysical properties of the novel 1-amino-4-isocyanonaphthalene (1,4-ICAN) and the Prodan analog, 2-amino-6-isocyanonaphthalene (2,6-ICAN) are reported and compared to those obtained for the 1,5-ICAN isomer (Scheme 1).

2. Results and Discussion

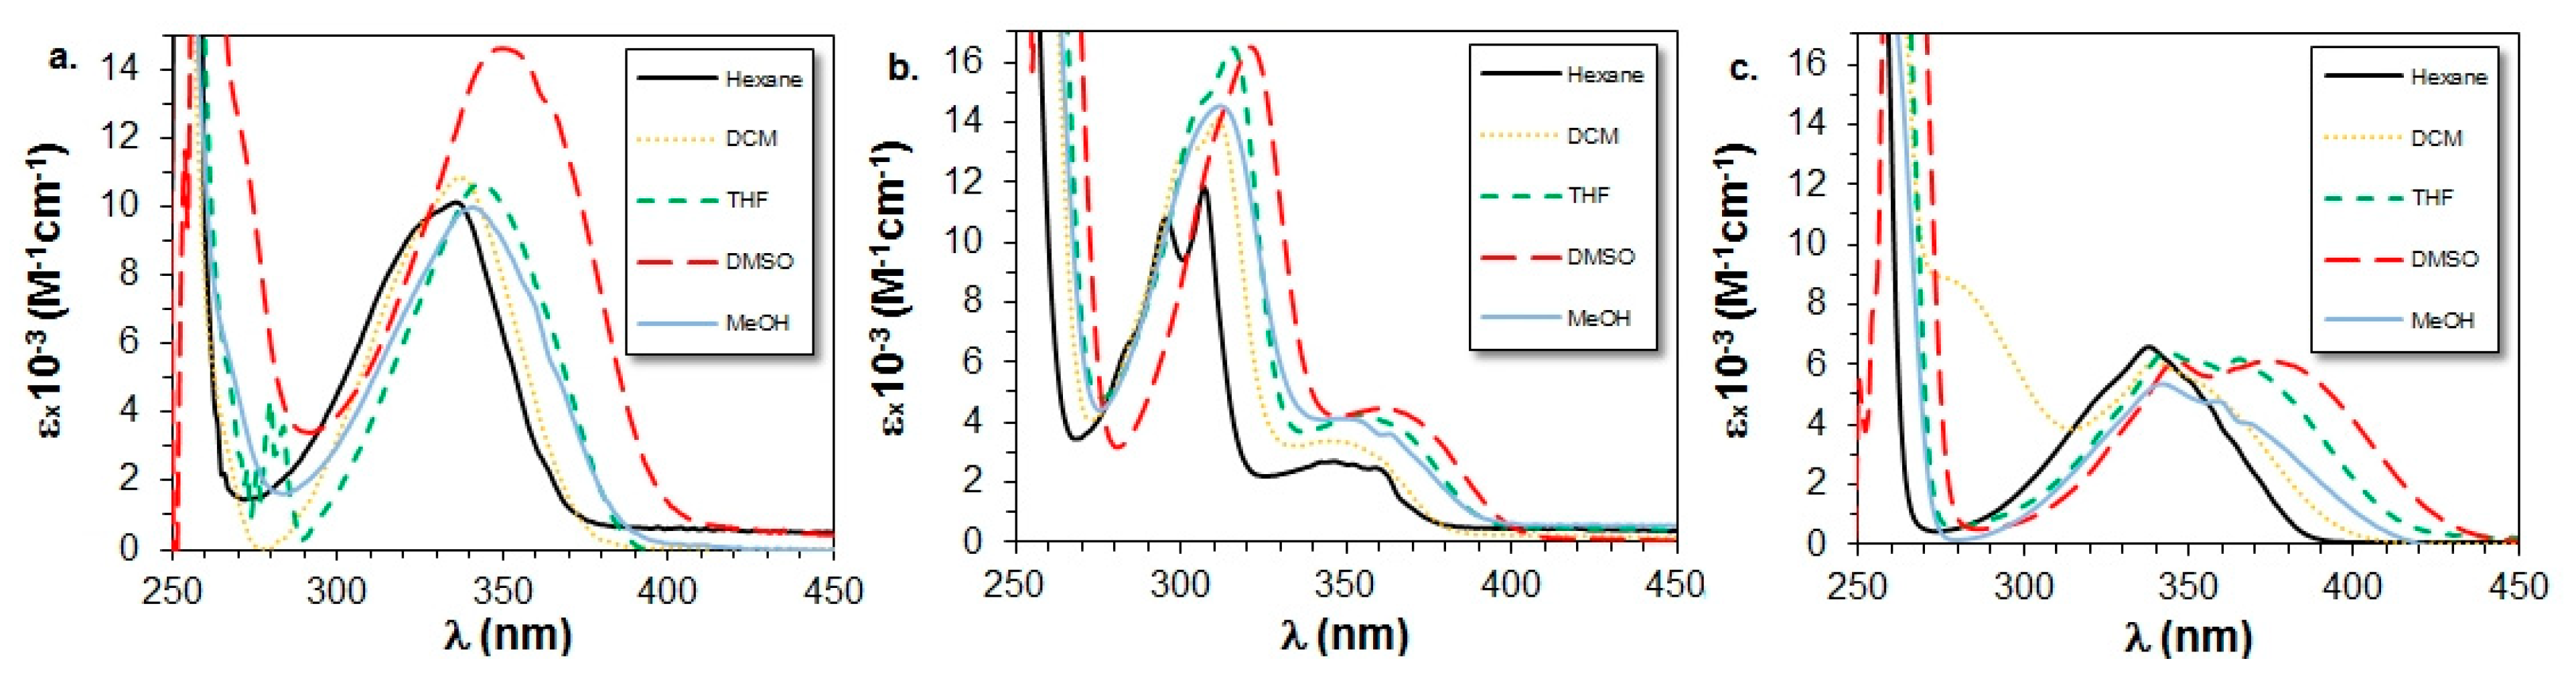
2.1. UV-Vis Electronic Absorption Properties of ICAN Isomers

Recently, we reported the electronic absorption and the fluorescence emission properties of the 1,5-ICAN isomer and the corresponding data are found in ref [15]. For the sake of better comparison of its behavior with those of the other ICAN isomers, some representative data are inserted in the following.
In order to learn more about the ground state electronic properties of the 1,4- and 2,6-ICAN isomers, they were dissolved in various solvents, and their UV-Vis spectra were recorded in the wavelength range of 200 nm to 700 nm. The solvents were chosen to cover a broad range of solvent polarity, spanning from the non-polar hexane to the polar DMSO. The UV-Vis spectra of 1,4-ICAN and 2,6-ICAN along with 1,5-ICAN in different solvents are shown in Figure 1, while the absorption maximum wavelength (λAbs) and the corresponding molar absorption coefficients (ε) are compiled in Table 1.
As seen in Figure 1, in the wavelength range of 300–400 nm which belongs to the lowest electronic energy transition for the ICAN isomers, the UV-Vis spectrum of 1,4-ICAN shows only a single band centered at around 350 nm. In contrast, the 2,6-ICAN isomer displays two markedly different bands in this wavelength region, the first band centered at around 320 nm while the second one occurs at approximately 350 nm. It should be noted that the UV-Vis spectrum of 1,5-ICAN is rather similar to that of the 2,6-ICAN. Furthermore, it can also be observed that the lowest electronic transitions at ca 350 nm occur with significantly higher ε values for 1,4-ICAN than for the 2,6-ICAN and the 1,5-ICAN isomers as confirmed by Figure 1 and the data in Table 1. In addition, DFT-calculations, in line with the experimental observations, also revealed that the oscillator strength (i.e., ε values) increased in the order of 2,6-ICAN < 1,5-ICAN < 1,4-ICAN. In relation to the dependence of λAbs on the solvent polarity, it could also be surmised from the data of Table 1 that the absorption bands at around 350 nm suffer from slight red-shifts with increasing solvent polarity. For example, going from n-hexane to DMSO, the bathochromic shifts are 9 nm, 24 nm, and 12 nm for the 1,5-ICAN, 1,4-ICAN, and 2,6-ICAN isomers, respectively. In addition, the values of λAbs for the 1,5-ICAN and 1,4-ICAN isomers are very similar, whereas the λAbs occur at longer wavelengths for the 2,6-ICAN isomer in all the solvents except DMF and DMSO, where λAbs values follow the order: 1,5-ICAN < 1,4-ICAN < 2,6-ICAN.
The shifts of the low energy bands are indicative of the polar character of the ground state. Indeed, DFT-calculations yielded 7.2 D, 8.0 D, and 8.6 D ground state dipole moments for the 1,5-ICAN, 1,4-ICAN, and 2,6-ICAN isomers, respectively. Interestingly, λAbs values in water, as in the most polar compound listed in Table 1, is lower than those measured in DMSO for all the three ICAN isomers. The wavelength differences (λAbs,DMSO–λAbs,H2O) are 11 nm, 26 nm, and 24 nm for the 1,5-ICAN, 1,4-ICAN, and 2,6-ICAN, respectively. The reason for this finding may be that the amino group of these isomers, due to the formation of hydrogen bonds, strongly interacts with the water molecules as we have previously shown for pyridine [16]. This interaction reduces the electron density on the N-atom of the amino moiety giving rise to a hypsochromic shift with respect to DMSO.
To better describe the excitation behavior of the ICAN isomers, we have calculated their electronic density differences between the first vertical excited state and the ground state in DMSO as represented in Figure 2.
We have chosen DMSO because it is the most polar nonprotic solvent that should show the most pronounced effect on the transition. It can be seen clearly that the blue areas, indicating the loss of electronic density, are located on the amino nitrogen and the near carbons in each isomer, while the red areas, showing the increase of electronic density, are different for 1,5-ICAN and the other two derivates. For 1,5-ICAN, this region is located on the far ring and the isocyano moiety, while the other two show nearly negligible change on the isocyano group. This suggests that although charge gets transferred from the amino group in all cases, it only reaches the desired acceptor in case of the 1,5-ICAN, while the other two exhibit local changes in the naphthalene ring. Therefore, the proper ICT character can only be attributed to the 1,5-ICAN according to this model.

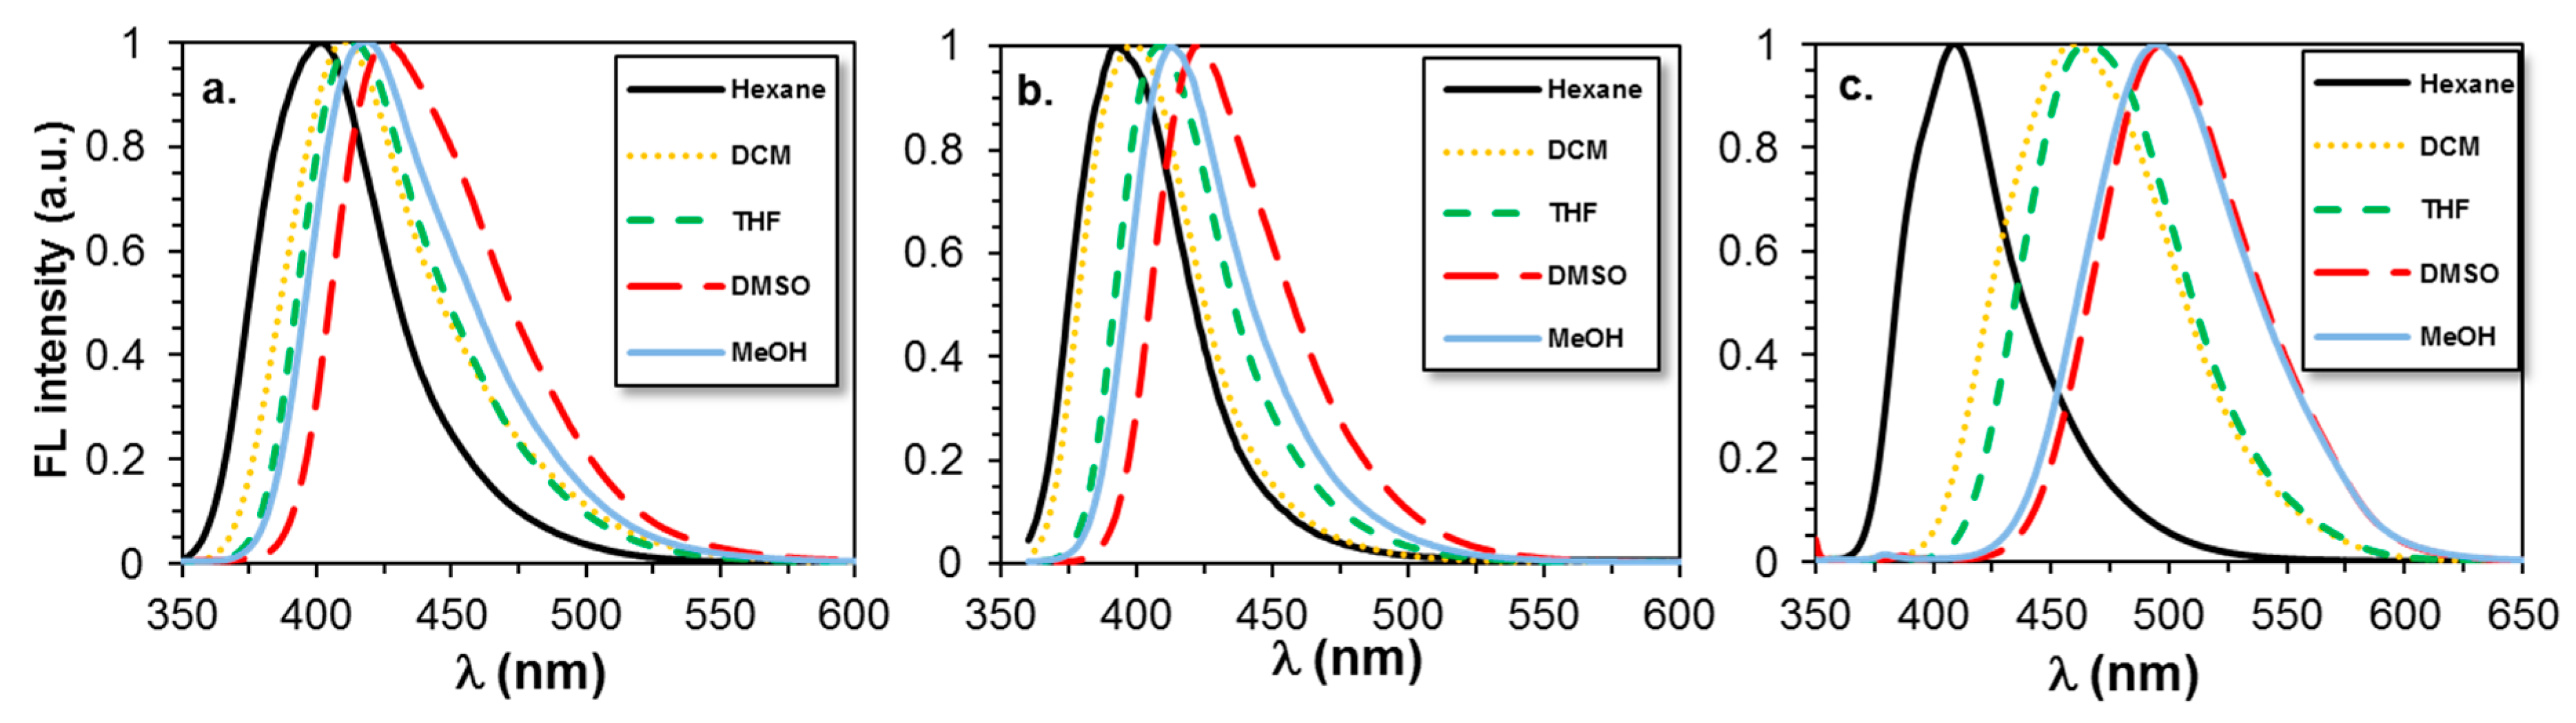
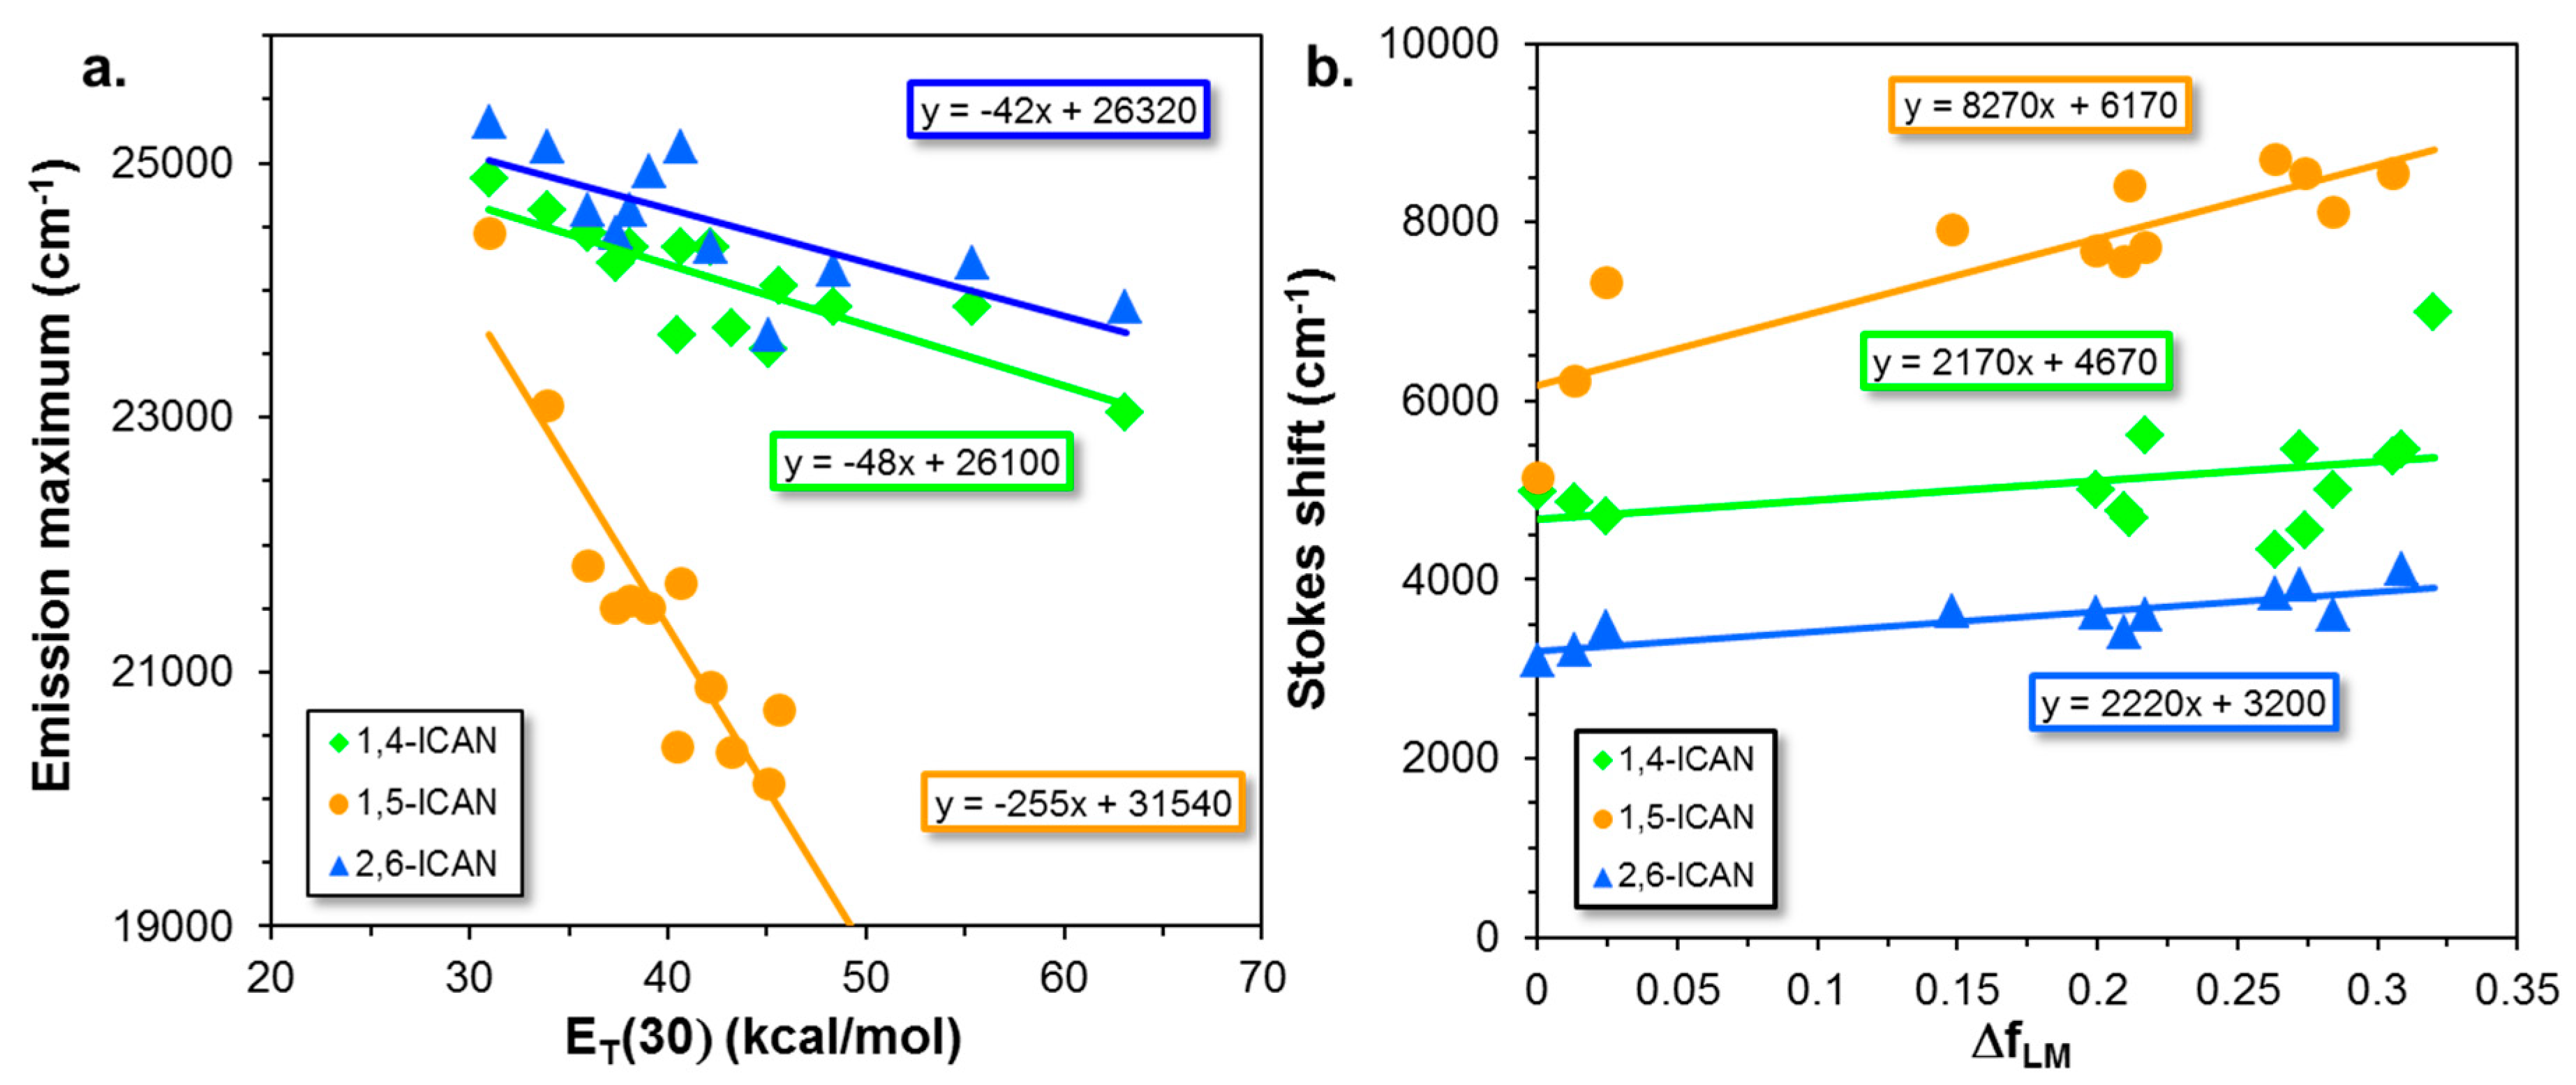
2.2. Steady-State Fluorescence Emission Properties of ICAN Isomers

The normalized fluorescence emission spectra for the 1,4-ICAN and 2,6-ICAN isomers are shown in Figure 3, and the fluorescence emission maxima (λEm), and the quantum yields (Φf) determined in various solvents for the 1,5-ICAN, 1,4-ICAN, and 2,6-ICAN isomers are summarized in Table 2.
As seen in Figure 3, the fluorescence emission spectra of both 1,4-ICAN and 2,6-ICAN in various solvents show unstructured, single bands, similar to those of 1,5-ICAN [15], revealing positive solvatochromic shifts upon increasing the solvent polarity from n-hexane to DMSO. In addition, the same is valid for the fluorescence emission bandwidth at half maximum (Δν1/2), which may be indicative of the extent of intramolecular charge transfer (ICT) upon excitation. For example, in dioxane, the Δν1/2 increases in the order of 2,6-ICAN (2660 cm−1) < 1,4-ICAN (3220 cm−1) < 1,5-ICAN (3625 cm−1). Stemming from the data of Table 2, it could also be realized that the fluorescence emission maxima in all the solvents follow the same order, i.e., the λEm increases in the order of 2,6-ICAN < 1,4-ICAN < 1,5-ICAN in good agreement with the TD-DFT calculations as illustrated in Figure S13 in the Supporting Information.
According to the data of Table 2, the solvatochromic shifts from hexane to DMSO are 88 nm, 23 nm, and 25 nm for the 1,5-ICAN, 1,4-ICAN, and 2,6-ICAN, respectively. The relatively small solvatochromic shift for the 2,6-ICAN isomer is surprising in light of the fact that the longest dipole distance between the donor amino and the acceptor isocyano group is available in the 2,6-ICAN isomer, as will be shown later. As a consequence, this finding may shed light also on the fact that a rational design of effective fluorophores which requires extensive prior knowledge on the electronic absorption and fluorescence emission properties of a specific class of compounds to be developed. Furthermore, the data in Table 2 also indicate that the quantum yields (Φf) vary significantly with the solvent used. The highest Φf were obtained for the 1,5-ICAN (0.28–0.95), whereas 1,4-ICAN isomer yields lower Φf values (0.41–0.86), and the lowest Φf values were determined in the case of the 2,6-ICAN isomer (0.15–0.53). It is also intriguing that the highest Φf were found in dioxane for the 1,5-ICAN (0.95) and the 1,4-ICAN (0.86), while the 2,6-ICAN isomer displays the highest Φf in highly polar solvents, such as DMF (0.53) and DMSO (0.51). In addition, it is to be noted that relatively high Φf values were found for all the three ICAN isomers in highly polar solvents indicating that the fluorescence decay by a non-radiative triplet-singlet transition does not play a significant role, as Nad et al. pointed out for Coumarin-151 [22], which is very similar to our ICAN dyes. Another interesting finding is the low Φf value for the 1,5-ICAN (0.04), while appreciable Φf values were found for the 1,4-ICAN (0.63) and 2,6-ICAN (0.21) isomers in water. An explanation for this finding will be given later.
In order to quantify the solvatochromic effect induced by the solvents of different polarity, the fluorescence emission maxima (νEm) are plotted as a function of the empirical solvent polarity parameter ET(30) [23] and the Lippert–Mataga (LM) plot [24,25], i.e., a plot for the Stokes shifts (ΔνSS) versus the orientation polarizations (ΔfLM) are constructed and presented in Figure 4.
As it turns out from Figure 4a, there are linear correlations between the fluorescence emission maximum and ET(30) for all the three fluorophores. On the other hand, as judging from the corresponding slopes illustrated in Figure 4a, it is also evident that the highest solvatochromic shift, i.e., the highest slope can be observed for the 1,5-ICAN isomer (255 kcal−1cm−1mol), while these values are very similar for the 1,4-ICAN (48 kcal−1cm−1mol) and the 2,6-ICAN (42 kcal−1cm−1mol) isomers. This reflects the computational findings presented in Figure 2. To gain quantitative insight, the Lippert–Mataga equation (Equation (1)) can be employed, although it should be noted that the model has some inherent restrictions. Nevertheless, it provides a way to calculate the difference of the excited (µE) and the ground state (µG) dipole moments, which is the key factor in determining the Stokes-shift (ΔνSS) of a fluorophore according to Equation (1).
Δ ν SS = 2 ( μ E μ G ) 2 4 π ε o hca o 3 Δ f LM + const
where ΔνSS (in cm−1) is the Stokes shift, h, c, and εo are the Planck’s constant, speed of the light in vacuum, and the permittivity of the vacuum, respectively, whereas ao is the Onsager-radius, which closely reflects the radius of a spherical cavity the fluorophore molecule occupies. ΔfLM stands for the orientation polarizability defined as:
Δ f LM = ε 1 2 ε 1 n 2 1 2 n 2 1
where ε and n are the dielectric constants and the refractive index of the solvent, respectively.
According to Figure 4b, the 1,5-ICAN isomer yields much higher slope (8270 cm−1) obtained from the LM-plot than do the 1,4-ICAN and 2,6-ICAN isomers, whose LM-plots give very similar slopes (2170 and 2220 cm−1, respectively). In addition, the Stokes shifts at ΔfLM = 0, i.e., the intercepts of the lines determined from the LM-plots decrease in the order of 1,5-ICAN > 1,4-ICAN > 2,6-ICAN. The LM-plot can also be used to estimate the difference in the values of the excited and the ground state dipole moments, i.e., Δµ = µE − µG according to Equation (1). The values of ao for the determination of Δμ from the corresponding LM-plots were obtained as the half distance between the amino and isocyano groups of the corresponding DFT-optimized geometries. The values of ao, (µE − µG, calculated for vertical emission) calculated by the DFT and determined from the corresponding LM-plots are listed in Table 3.
As seen from the data in Table 3, the calculated and the determined values of Δµ from the LM-plots agree reasonably well. It should be noted; however, that the value of Δμ, according to Equation (1), markedly depends on the value of ao.
It must be noted here that there is a different, i.e., another accepted way to determine ao. This is based on the following relationship: a o = [ 3 M / ( 4 π N A ρ ) ] 1 / 3 , where M is the molecular weight of the fluorophore, NA is the Avogadro’s constant, and ρ is the density. For example, for the 1,5-ICAN isomer taking the density 1 g/cm3, a value of ao = 400 pm and Δµ = 7.2 D could be calculated [15].
In order to get a deeper insight into the excited state electronic behavior of these ICAN isomers, further TD-DFT calculations were performed. For the calculations of the electronic transitions, both the ground- and excited-state geometries were optimized. The Highest Occupied Molecular Orbital (HOMO), Lowest Unoccupied Molecular Orbital (LUMO), HOMO − 1, and LUMO + 1 molecular orbitals for the 1,4-ICAN, 1,5-ICAN, and 2,6-ICAN isomers are presented in Figure S14. As these orbitals are spread over the whole molecule in each case, they were not analyzed further, so the reader should refer to Figure 2 for the electronic changes accompanying the absorption process.
Additional information could be obtained on the distribution of the electrons by performing a thorough charge analysis (Tables S3–S5) or mapping the electrostatic potential (ESP) of the relaxed ground and excited states as shown in Figure 5. In every case, a large negative charge is centered on the amino nitrogen, which diminishes upon reaching the relaxed excited state. This is also reflected by a change in the geometry as the amino group flattens, or in other words, rehybridizes to an sp2 state where the nonbonding electrons enter the conjugated π system of the naphthalene ring. The isocyano group; however, shows a different behavior for 1,4-ICAN and the other two molecules. In 1,4-ICAN, a considerable negative charge is centered on this moiety in the ground state already, which changes only slightly upon reaching the relaxed excited state. Therefore, in 1,4-ICAN, simply a local excitation from the amino group to the naphthalene ring takes place. The 1,5-ICAN and 2,6-ICAN isomers; however, reveal a charge transfer from the donor amino to the acceptor isocyano group, which is located on the far ring. A comparison to the vertical excitation (Figure 2) reveals that the final electronic configuration of the excited state is reached almost instantaneously after excitation in 1,5-ICAN, while in 2,6-ICAN this requires changes in the geometry as well. Therefore, in 2,6-ICAN, a charge transfer does take place, but in a non-emissive path via excited state relaxation. The vertical emission process from the relaxed excited state (Figure S16) is essentially the reverse of the absorption, indicating that in both processes only the 1,5-ICAN exhibits charge transfer behavior. In 1,4-ICAN, the charge is only locally transferred, while in 2,6-ICAN, an ICT takes place non-radiatively for the whole absorption-emission cycle.

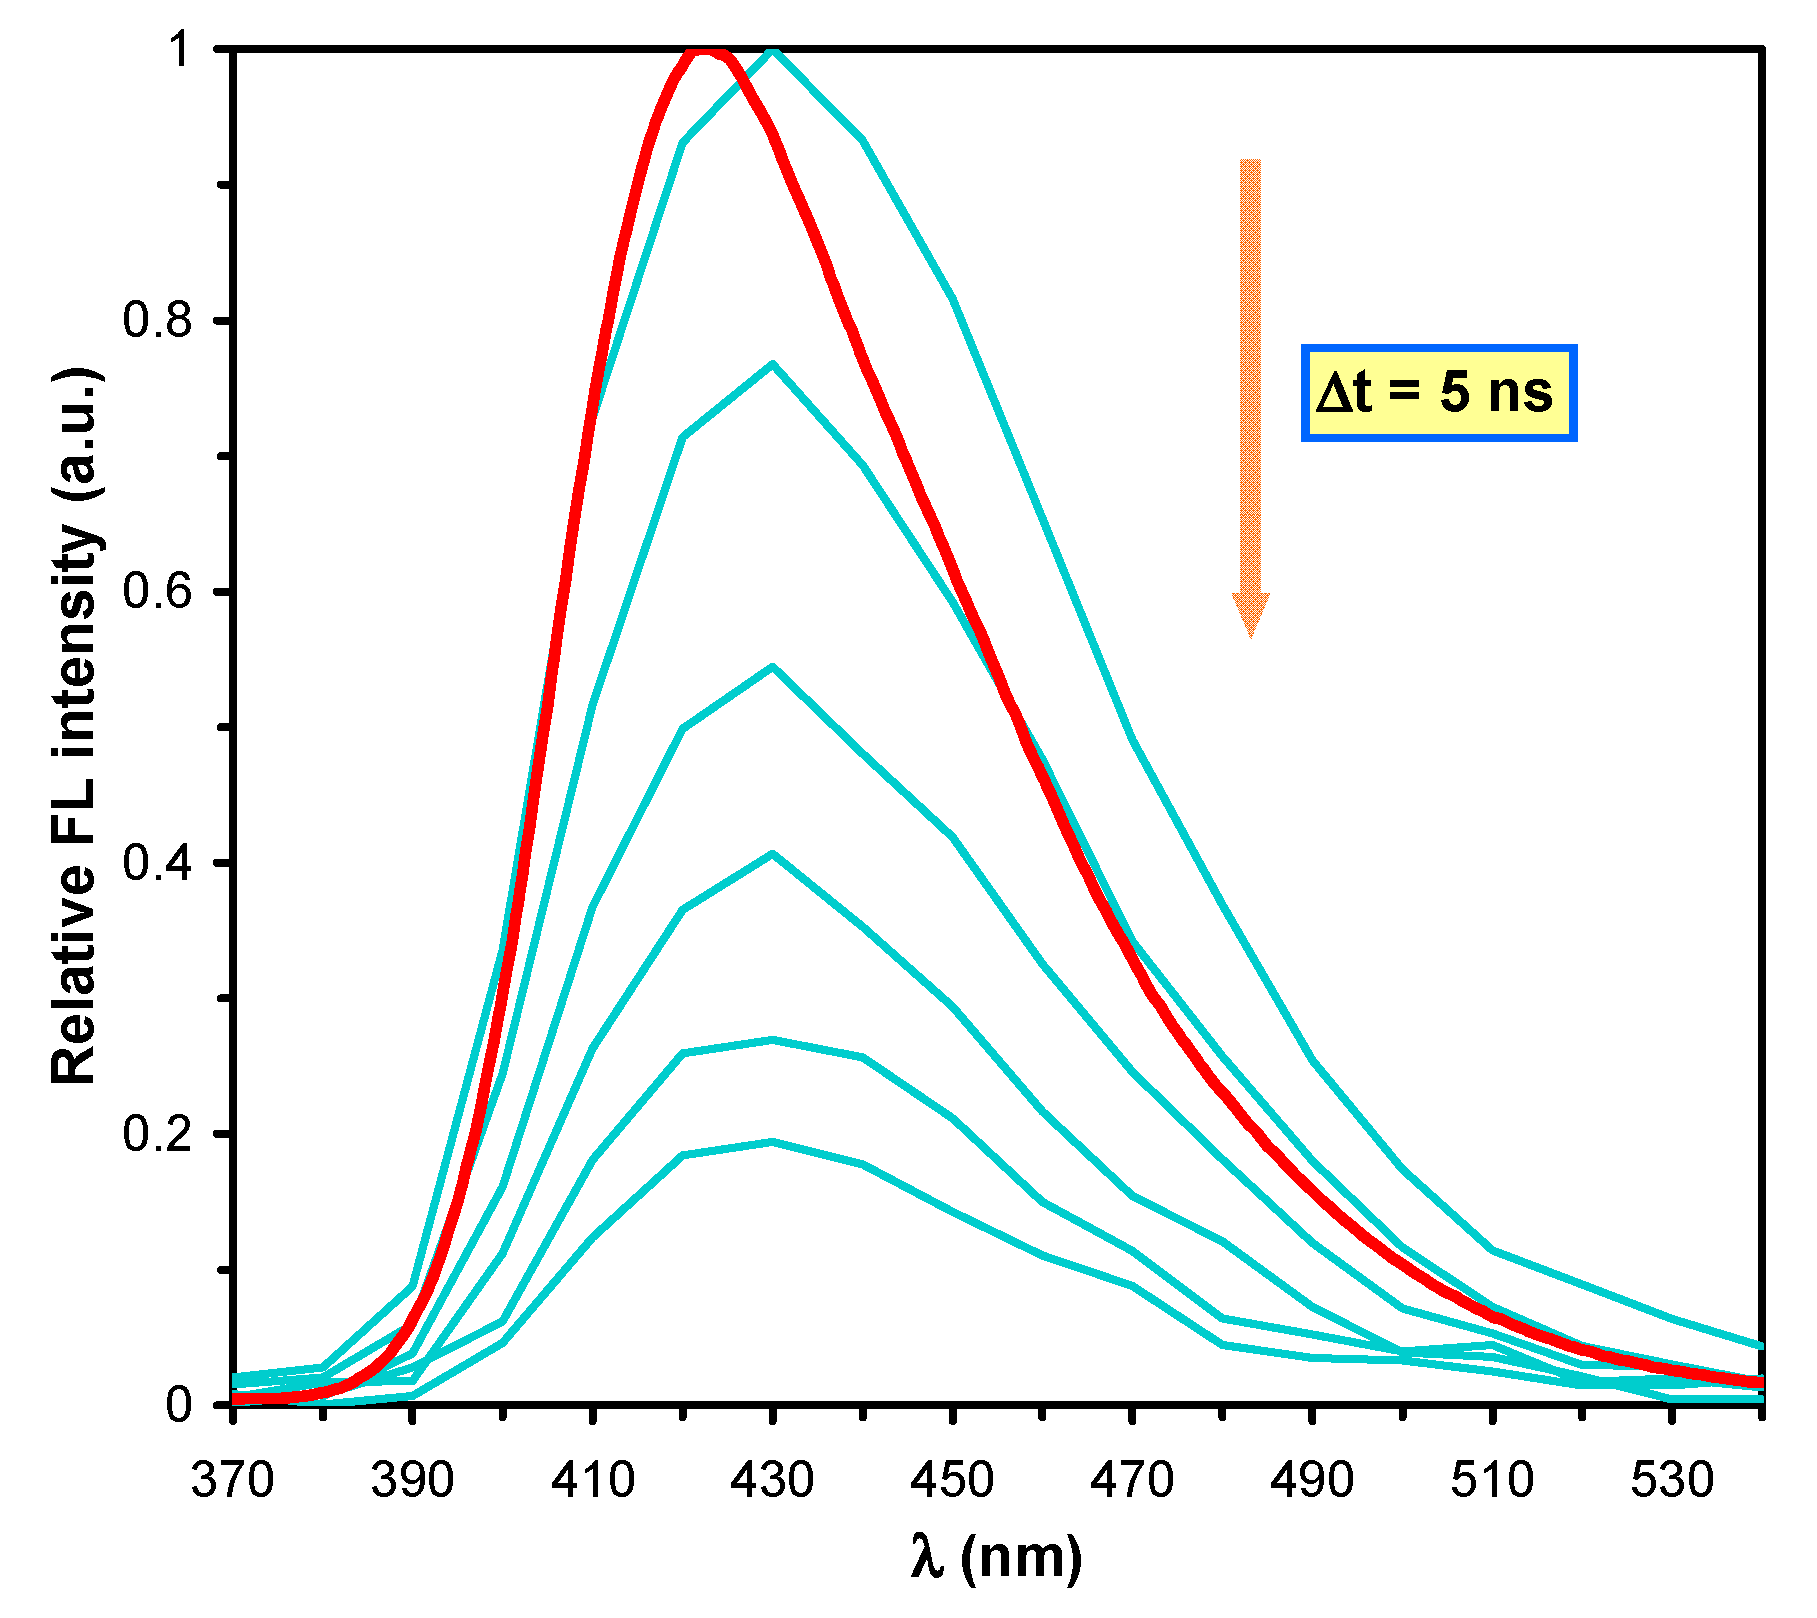
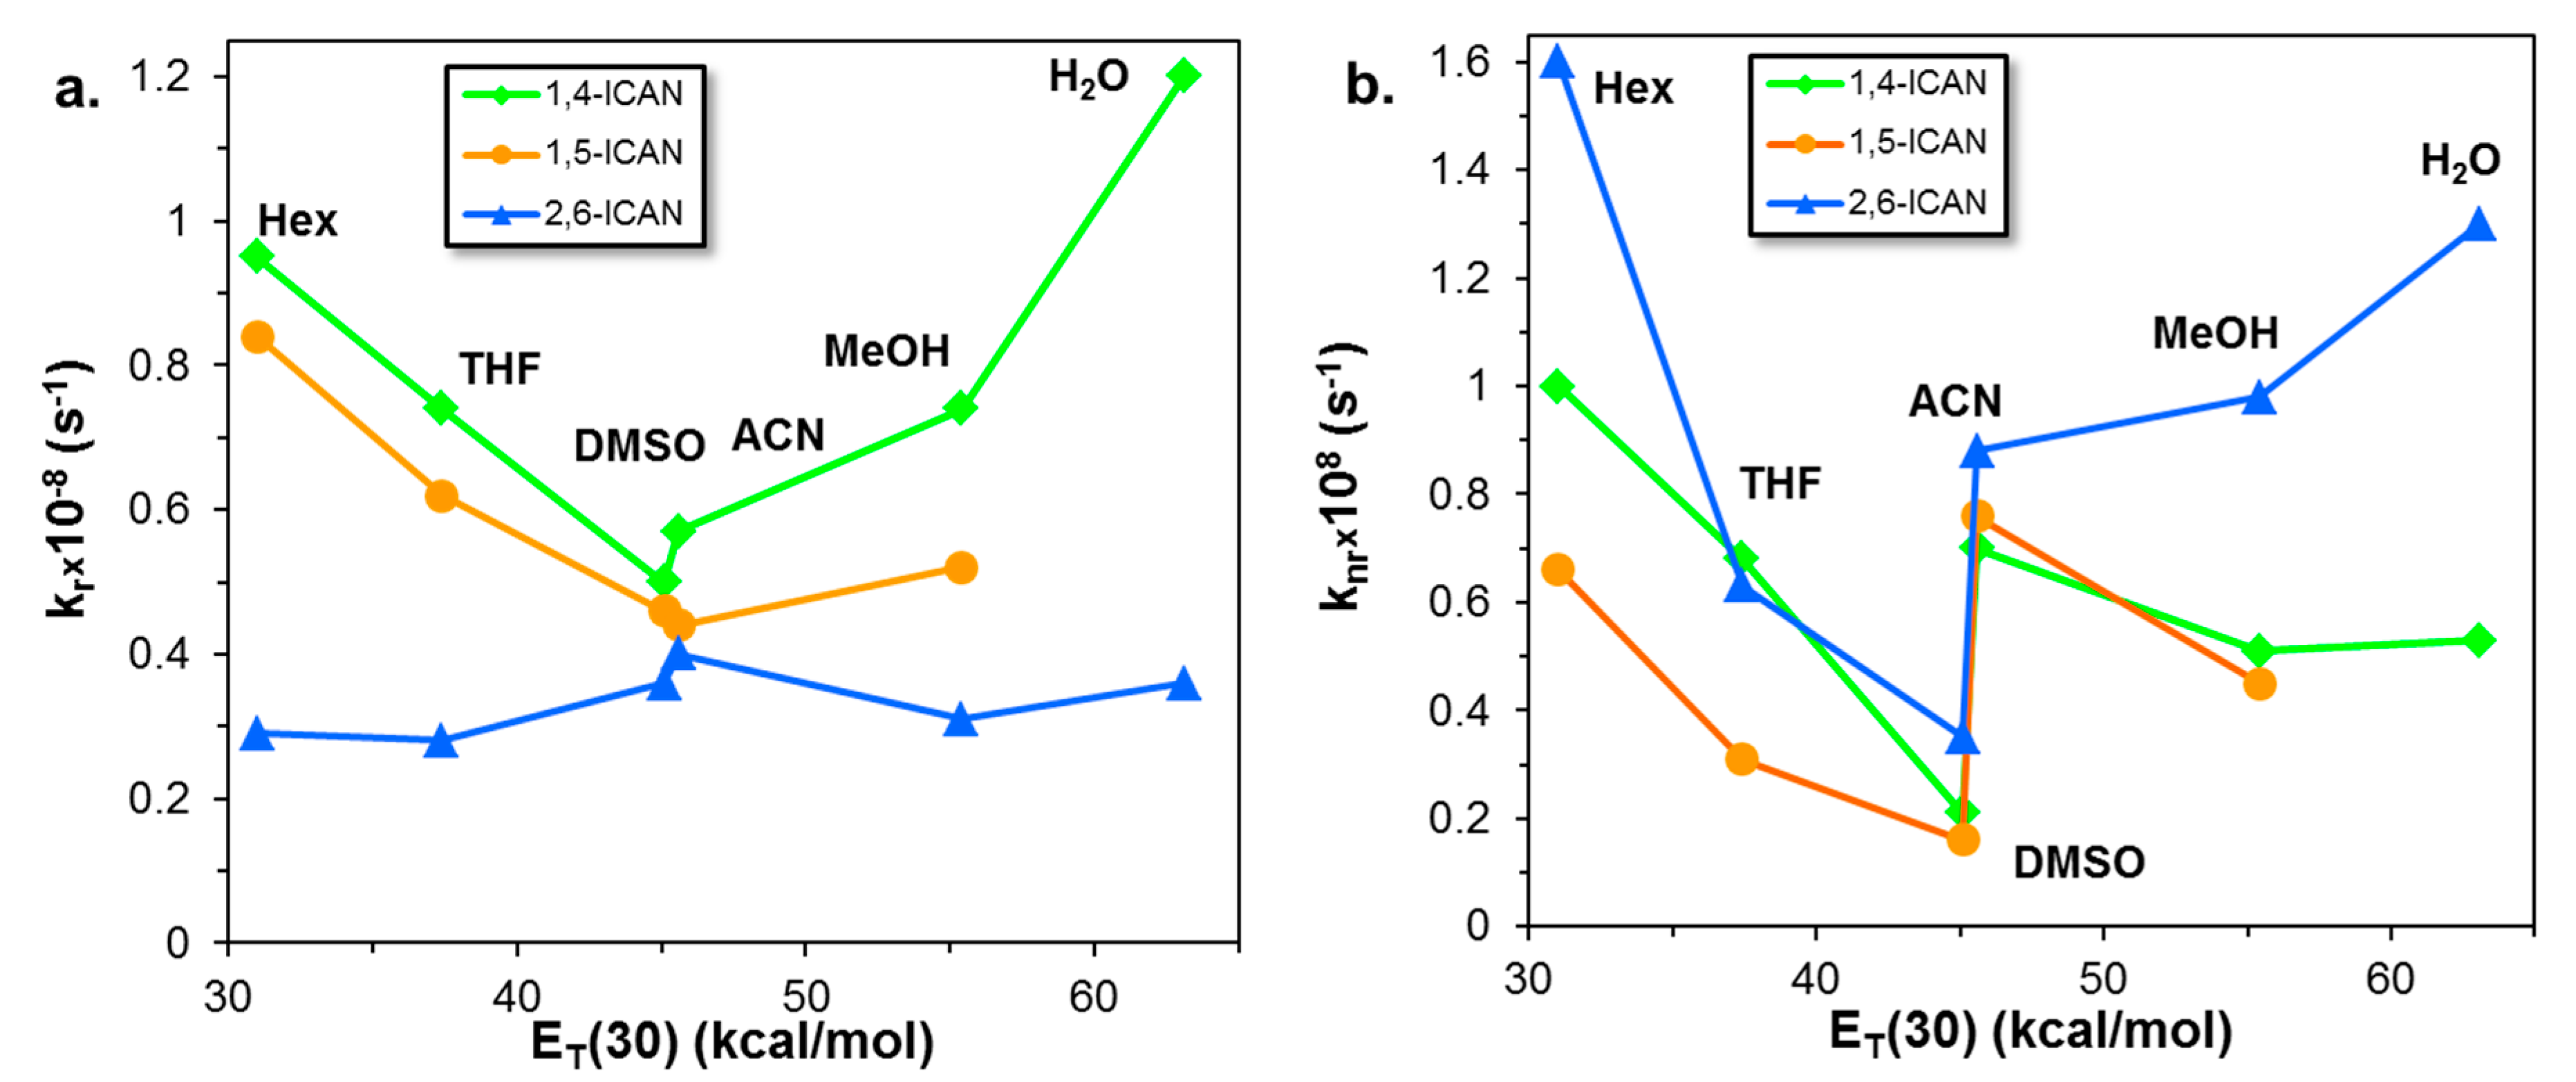
2.3. Time-Resolved Fluorescence Measurements

The time-resolved fluorescence experiments were carried out using laser flash photometry as outlined in the Experimental section. The time-dependent fluorescence emission spectra for the ICAN isomers were recorded in the range from 370 nm to 540 nm in solvents of different polarity in order to shed light on the potential variation of the photophysical parameters with the environment. As an example, the time-resolved fluorescence spectra of the 2,6-ICAN isomer in DMSO are illustrated in Figure 6 (The fluorescence decay curves in different solvents are presented in Figures S17 and S18) For comparison, the steady-state fluorescence emission spectrum is also included.
As seen in Figure 6, the steady-state spectrum matched well with the time-resolved spectra. Furthermore, it is also evident from Figure 6 that there are no shifts in the positions of the time-resolved emission spectra recorded at different times indicating that emissions take place most likely from a fully solvent-relaxed state. From the decay of the fluorescence intensity, the fluorescence decay rate (kF), the radiative decay rate (kr), and the non-radiative decay rate (knr) were calculated according to Equations (3) and (4).
kF = kr + knr
kr = ΦfkF
On the other hand, it is also possible to calculate the radiative decay rate from the electronic absorption and the fluorescence emission spectra using the Strickler–Berg (SB) equation [26] (Equation (4))
k SB ( s 1 ) = 2.88 × 10 9 n 2 F ( ν ¯ ) d ν ¯ F ( ν ¯ ) ν ¯ 3 d ν ¯ ε ( ν ¯ ) ν ¯ d ν ¯
where kSB is the decay rate calculated by the SB equation, n is the refractive index of the solvent, ε( ν ¯ ) is the molar absorption coefficient, and F( ν ¯ ) is the fluorescence intensity at wave number ν ¯ .
The values of kF, kr, knr, and kSB for the three ICAN isomers are compiled in Table 4.
As it turns out from the data in Table 4, the values of kF decrease from hexane to DMSO for all the three ICAN isomers. For example, in the case of 2,6-ICAN, the values of kF are 1.89 × 10⁸ s−1 and 7.1 × 10⁷ s−1 corresponding to τ = 5.3 ns and 14.1 ns lifetime for the excited state in hexane and the DMSO, respectively. However, in water, the values of kF increase again close to the values measured in hexane. Except for a few cases, the corresponding kF values determined for the three ICAN isomers are very similar to each other; however, the kr and knr values differ considerably. Furthermore, in spite of the simplicity of the Strickler–Berg equation (Equation (5)), the values of kSB and kr agree relatively well. In order to find out how the solvent polarity influences the values of kr and knr of the ICAN isomers, kr and knr are plotted as a function of the empirical solvent polarity parameter ET(30), and these plots are shown in Figure 7.
According to Figure 7, both kr and knr show a minimum value as a function of ET(30) for the 1,5-ICAN and 1,4-ICAN isomers in DMSO; however, for the 2,6-ICAN isomer, the values of kr do not change significantly through the entire ET(30) range investigated (Figure 7a), whereas knr versus ET(30) goes through minimum values as seen in Figure 7b. The relatively high value of knr in low polarity solvents (e.g., in n-hexane and THF) may be due to the rotation of the amino group of these ICAN isomers, which initiates a rapid deactivation route from the excited state to the ground state [22]. At higher polarities; however, such a rotation is hindered due to the interaction of the π-system with the amino group that brings about a decrease in the knr values [22]. In addition, further increases in the solvent polarity resulted in an increase in the values of knr. This finding may be attributed to the increasing ICT character of these ICAN isomers with the solvent polarity and due to the interaction of their amino moiety with the protic solvents (MeOH, H2O), which may promote the non-radiative deactivation.
To better understand the behavior of the ICAN derivatives in protic solvents, such as water, we have performed calculations where we included two explicit water molecules. One was placed to the amino and the other one to the isocyano group of 1,5-ICAN as shown in Figure 8.
The bulk of the water was modeled as a continuum, using Integral Equation Formalism Polarizable Continuum Model (IEFPCM), like the hexane and DMSO solvents. The optimization of the excited state geometry revealed a rearrangement of the amino hydrogen bond. This behavior is like what was observed in DMSO, which is the shift of the negative charge from the nitrogen to the carbons and the isocyano group as shown in Figure 5. The model, therefore, can capture the specific solvent-solute interaction in protic solvents, which is also indicated by the very accurate characteristic absorption band position at 355 nm (~6% error). In the excited state, both the neutral and protonated (ammonium) forms were optimized. The former yielded an emission band at 537 nm close to the observed wavelength (513 nm), while the latter is a dark state (close to the zero oscillator strength). Although the neutral isomer is more stable in the model, the protonation or a protonation-induced proton exchange might take place as the molecules can overcome energy barriers in the excited state more easily than in the ground state, resulting in fluorescence loss.

3. Materials and Methods

3.1. Materials

Acetone, dichloromethane (DCM), n-hexane, 2-propanol, toluene (reagent grade) were obtained from Molar Chemicals, Hungary, and they were purified by atmospheric pressure distillation. Furthermore, acetonitrile (MeCN), tetrahydrofuran (THF), methanol (MeOH), dimethyl-formamide (DMF), dimethyl-sulfoxide (DMSO), pyridine (HPLC grade, VWR, Darmstadt, Germany), ethylacetate (EtOAc), (reagent grade, Molar Chemicals, Hungary), 1,4-dioxane (reagent grade, Reanal, Hungary), 1,4-diaminonaphthalene (Sigma-Aldrich, Schnelldorf, Germany) were used without further purification. 2,6-diaminonaphthalene was purchased from Manchester Organics (London, UK) and purified by column chromatography.
The 1-amino-4-isocyanonaphthalene (1,4-ICAN) and the 2-amino-6-isocyanonaphthalene (2,6-ICAN) isomers were synthesized from the corresponding diamines (1,4- and 2,6-diaminonaphthalene), and the obtained products were characterized similarly to that reported for the 1-amino-5-isocyanonaphthalene [15]. The details of the synthesis and the characterization of 1,4-ICAN and 2,6-ICAN are given in the Supporting Information.

3.2. Instrumental Methods

The UV-Vis spectra were recorded on an Agilent Cary 60 spectrophotometer (Agilent, Santa Clara, CA, USA) spectrophotometer in a quartz cuvette with 1 cm optical length. The volume of the solution was 3.00 cm3.
Steady-state fluorescence measurements were performed using a Jasco FP-8200 fluorescence spectrophotometer equipped with a Xe lamp light source. The excitation and emission spectra were recorded at room temperature, using 2.5 nm excitation, 5.0 nm emission bandwidth, and 100 nm/min scanning speed. Fluorescence quantum yields were calculated by using quinine-sulfate in 0.1 mol/L sulfuric acid as the reference absolute quantum yield (Φf = 0.55).
For UV-Vis and the steady-state fluorescence measurements, ICAN isomers were dissolved in various solvents at a concentration of 0.2 mg/mL (1.19 mM) and diluted to 4.00 mg/L (2.38 × 10⁻⁵ M) and 0.800 mg/L (4.76 × 10⁻⁶ M), respectively.
Laser flash photolysis experiments were carried out using an Applied Photophysics (Leatherhead, UK) LKS.60 nanosecond transient absorption spectrometer, equipped with a Quantel Brilliant Nd:YAG laser along with its second, third, and fourth harmonic generator. The third harmonic was used, which emits at 355 nm. For the evaluations of the time-resolved fluorescence curves “DecayFit 1.4”, the time-resolved fluorescence decay fit software downloaded freely from www.fluortools.com was used by applying the tail-fitting method to obtain the corresponding fluorescence decay rates.

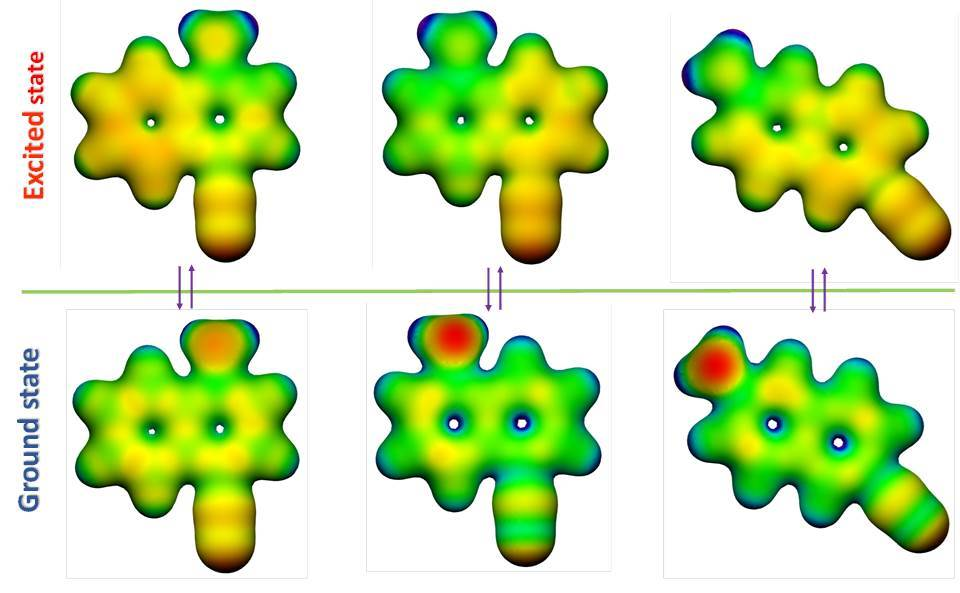
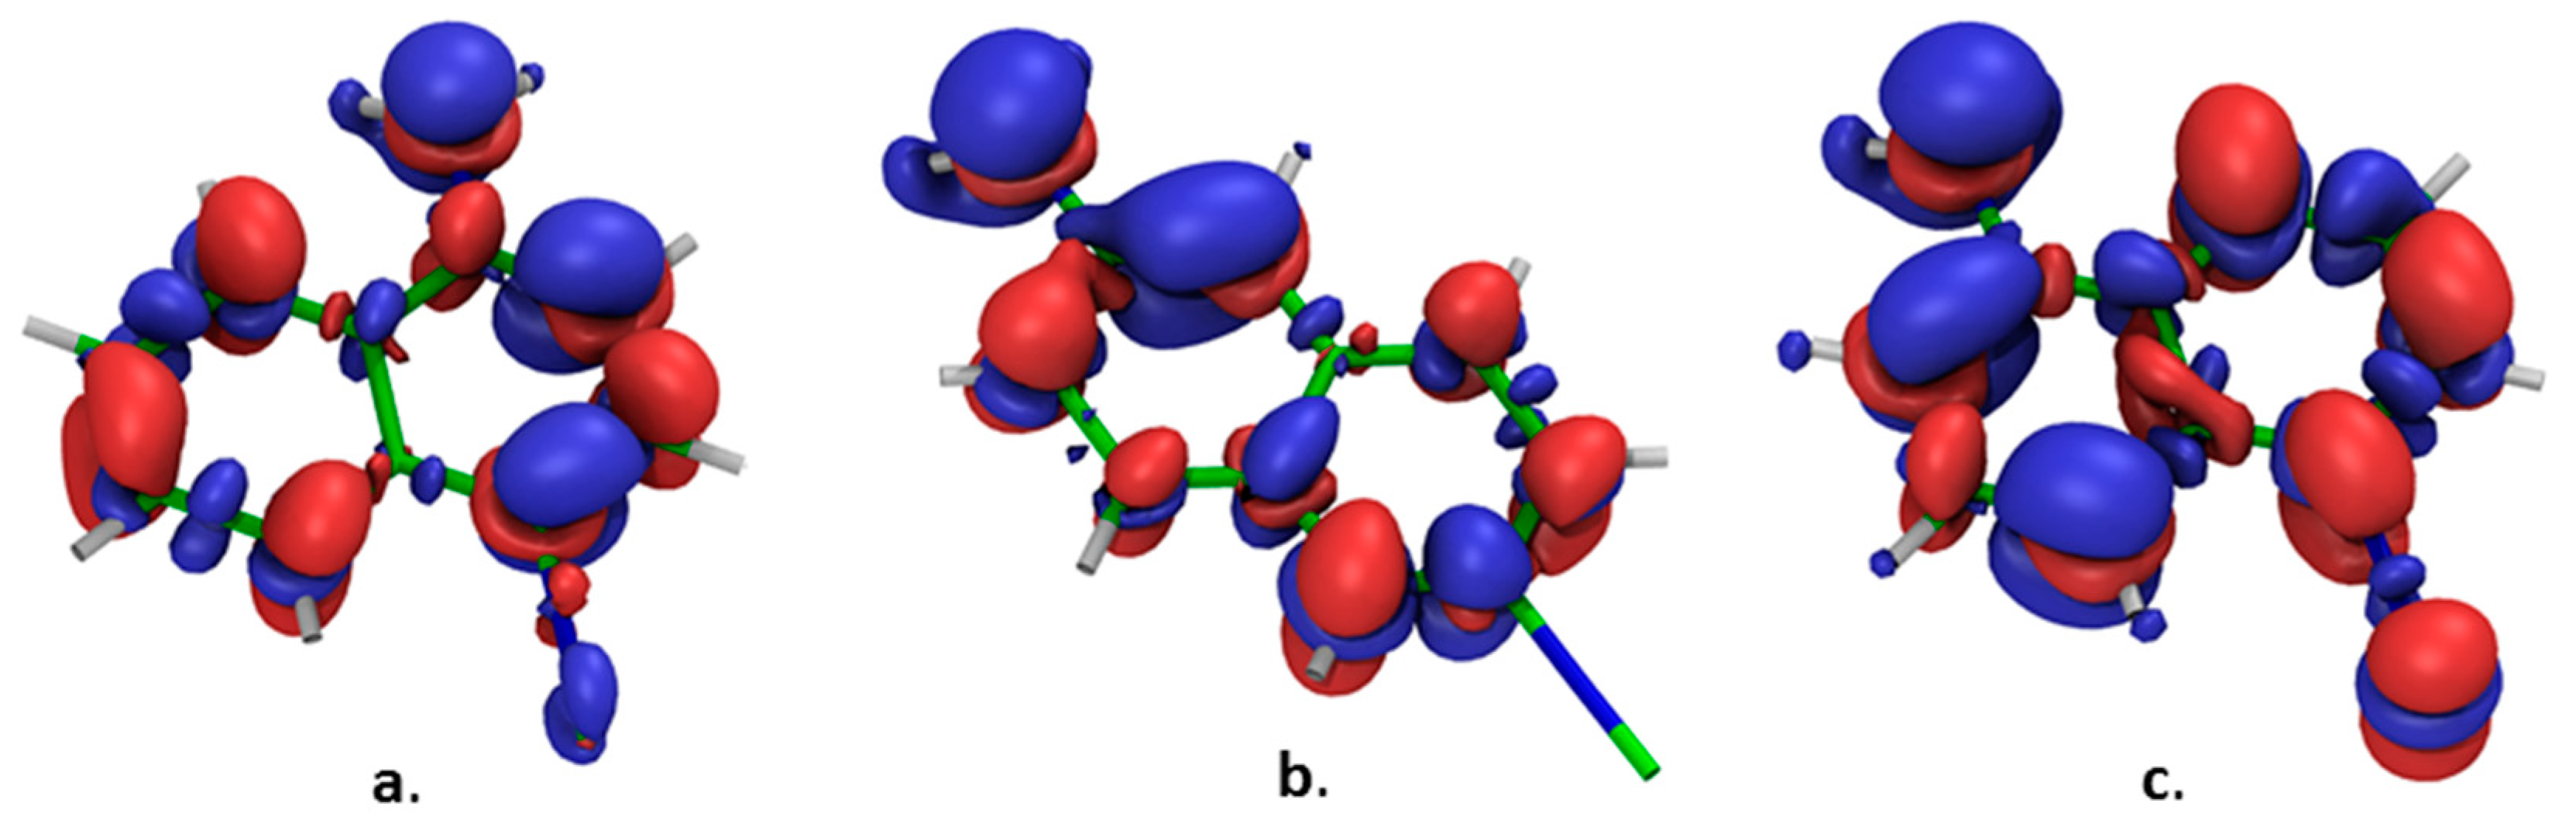
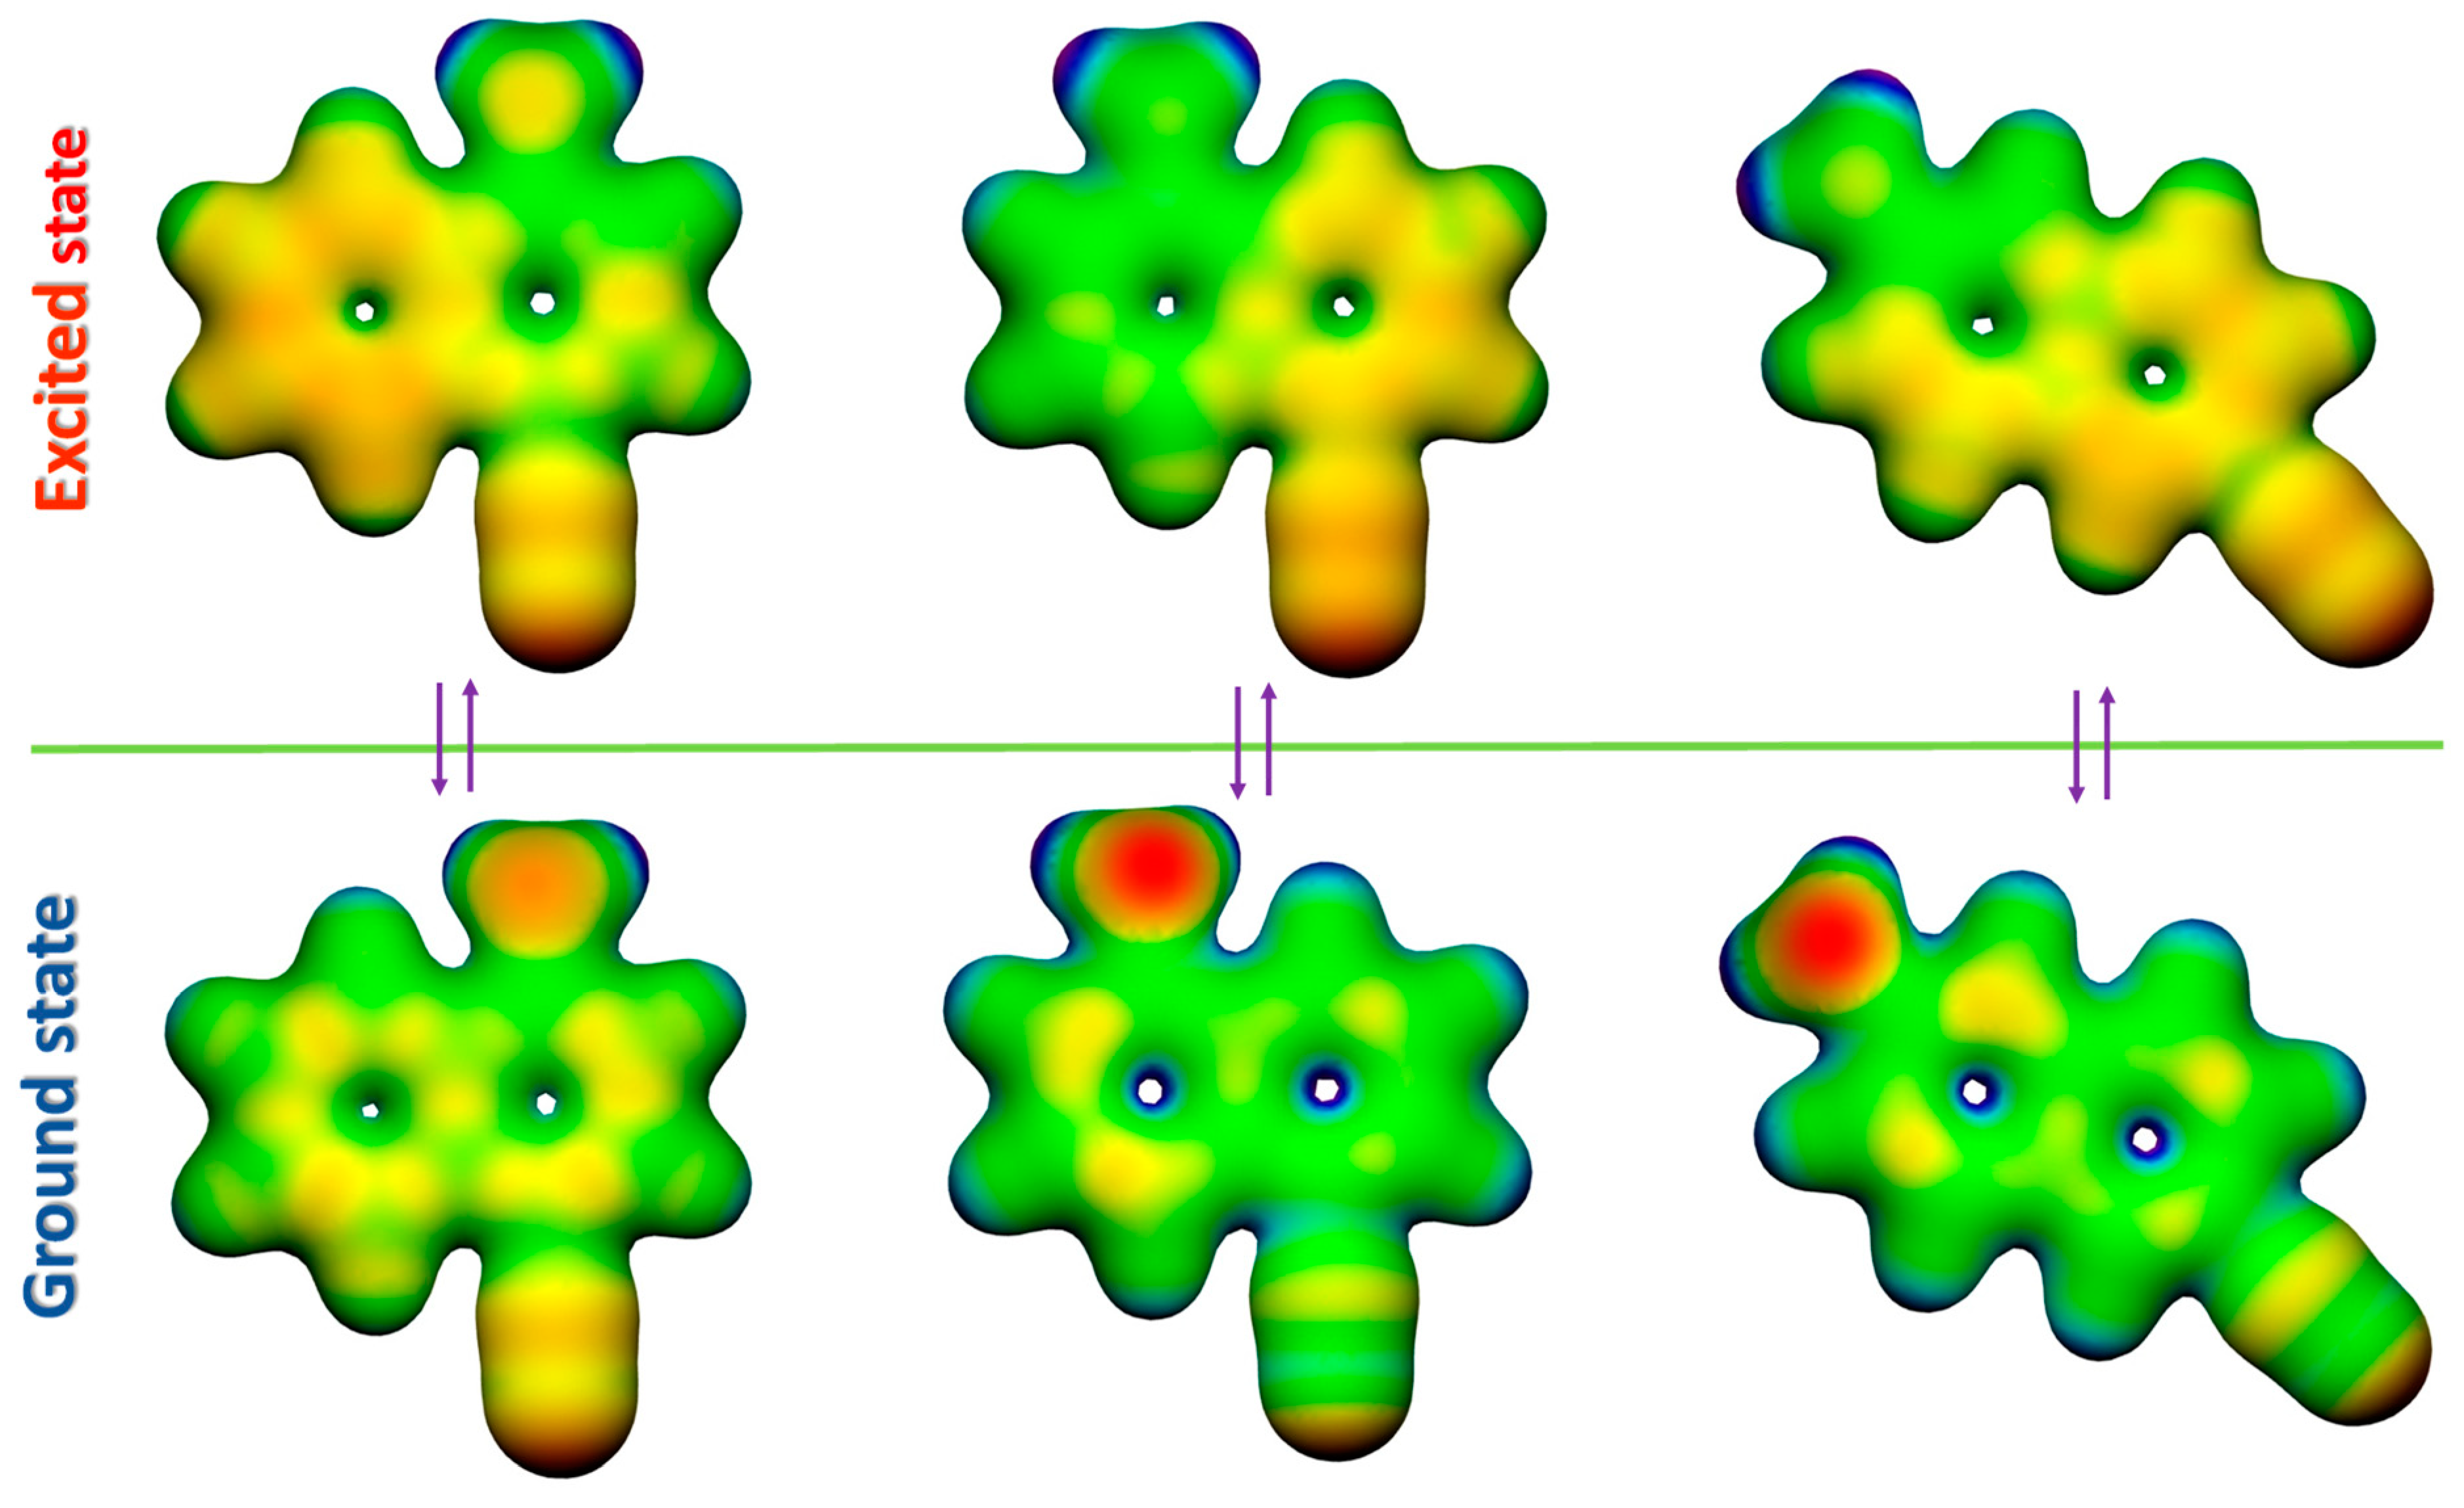
3.3. Computational Methods

The density functional theory (DFT) calculations were carried out using the Gaussian09 software package [27]. To obtain the ground state properties, the 1,4-ICAN, 1,5-ICAN, and the 2,6-ICAN molecules were optimized in the Polarizable Continuum model (PCM) [28] solvent (hexane and DMSO) cavity using the M06 function [29] together with the Valence Triple-Zeta Polarization (TZVP) basis set [30]. Frequency calculations were done on the optimized structures to verify them as stationary points and obtain Gibbs free energy corrections. The electronic excitations were calculated using the time-dependent density functional theory (TD-DFT) employing the same functional and basis mentioned above. The M06 function was chosen from the tested M06-L, M06, M06-2X, M06-HF [29], and CAM-B3LYP [31] functions because it reproduces the experimental emission wavelengths most accurately (a thorough comparison between M06 and CAM-B3LYP is presented in the Supporting Information in Tables S1 and S2). In addition to modeling the vertical excitation, the molecules were optimized on the potential surface of the first singlet excited state to obtain the excited state properties such as dipole moments and electrostatic potentials. The solvent effects were also included during the optimizations via PCM. To further refine the vertical (de-)excitations, the corrected linear response formalism was employed [32] to properly account for nonequilibrium solvation.

4. Conclusions

The electronic absorption, solvatochromic and photophysical properties of three different ICAN isomers including 1,5-ICAN, 1,4-ICAN, and 2,6-ICAN were studied and compared. It was found that the position of the donor amino and the acceptor isocyano group markedly affect these properties. The molar absorption coefficients in various solvents were found to decrease in the order of 1,4-ICAN > 1,5-ICAN > 2,6-ICAN, and this order is in line with the one calculated by the high-level quantum chemical method (DFT). On the other hand, the Stokes shifts (ΔνSS) for these ICAN isomers were interpreted in terms of the Lippert–Mataga (LM) theory and the values of ΔνSS were found to decrease in the order of 1,5-ICAN > 1,4-ICAN ≈ 2,6-ICAN. From the LM-plots, the corresponding differences in the dipole moments of the excited and the ground states were determined, and good agreements with the DFT calculations were obtained. Furthermore, the time-resolved fluorescence emission experiments revealed that (i) emissions take place from the solvent-relaxed state. (ii) both kr and knr showed a minimum value as a function of the solvent polarity parameter ET(30) for the 1,5-ICAN and 1,4-ICAN isomers in DMSO, but for the 2,6-ICAN isomer, kr was found to be nearly constant in the range of the solvent polarity parameter investigated.
In addition, this study may shed light on the fact that a rational design of effective fluorophores requires extensive prior knowledge on the electronic absorption and fluorescence emission properties of the given class of compounds.

Supplementary Materials

The Supplementary materials are available online, Figure S1: 1H-NMR spectrum of 2-amino-6-isocyanonaphthalene in chloroform, Figure S2: 13C-NMR spectrum of 2-amino-6-isocyanonaphthalene in chloroform, Figure S3: UV-vis spectra of 2-amino-6-isocyanonaphthalene, Figure S4: Normalized emission spectra of 2-amino-6-isocyanonaphthalene, Figure S5: Normalized excitation spectra of 2-amino-6-isocyanonaphthalene, Figure S6: Excitation spectra of 2-amino-6-isocyanonaphthalene, Figure S7: 1H-NMR spectrum of 1-amino-4-isocyanonaphthalene in chloroform, Figure S8: 13C-NMR spectrum of 1-amino-4-isocyanonaphthalene in chloroform, Figure S9: UV-vis spectra of 1-amino-4-isocyanonaphthalene, Figure S10: Normalized emission spectra of 1-amino-4-isocyanonaphthalene, Figure S11: Normalized excitation spectra of 1-amino-4-isocyanonaphthalene, Figure S12: Excitation spectra of 1-amino-4-isocyanonaphthalene, Table S1: Comparison of the results obtained by different functionals for the absorption wavelength calculations for the ICAN isomers in different solvents, Table S2: Comparison of the results obtained by different functionals for the emission wavelength calculations for the ICAN isomers in different solvents, Figure S13: Normalized calculated (a) and measured (b) emission spectra for the 1,4-ICAN, 1,5-ICAN and 2,6-ICAN isomers in DMSO, Figure S14: HOMO, LUMO, HOMO-1 (H-1) and LUMO+1 (L+1) molecular orbitals for the 1,4-ICAN (a), 1,5-ICAN (b) and 2,6-ICAN (c) isomer; Figure S15: Atomic indices for the calculation of the Mulliken charges presented in Tables S3–S5 for the 1,4-ICAN (a), 2,6-ICAN (b) and 1.5-ICAN (c) isomer, Table S3: Calculated atomic charges for the ground and excited states of the 1,4-ICAN isomer, Table S4: Calculated atomic charges for the ground and excited states of the 2,6-ICAN isomer, Table S5: Calculated atomic charges for the ground and excited states of the 1,5-ICAN isomer, Figure S16: Calculated electronic density differences calculated for the emission between the relaxed excited state and the corresponding vertical ground state in DMSO for the 1,4-ICAN (a) 2,6-ICAN (b) and 1,5-ICAN (c) isomers, Figure S17: Fluorescence decay of 1,4-ICAN in different solvents, Figure S18: Fluorescence decay of 2,6-ICAN in different solvents.

Author Contributions

Conceptualization, M.N. and S.K.; Data curation, S.L.K. and P.P.F.; Funding acquisition, S.K.; Investigation, M.N.; Methodology, P.P.F.; Supervision, M.N.; Writing—original draft, S.L.K. and S.K.; Writing—review & editing, M.N., P.P.F., M.Z.

Funding

This paper was supported by the grant K-116465, given by the Hungarian Scientific Research Fund (OTKA). The work was also supported by the GINOP-2.3.2-15-2016-00041 and GINOP-2.3.3-15-2016-00004 projects. The projects were co-financed by the European Union and the European Regional Development Fund. Furthermore, this paper was also supported by the János Bolyai Research Scholarship of the Hungarian Academy of Sciences (Miklós Nagy). The authors would also like to express their thanks to József Kalmár for his assistance in the Laser Flash Photolysis experiments. We also acknowledge the computational resources of KIFÜ.

Conflicts of Interest

The authors declare no conflict of interest.

References

  1. Weber, G.; Farris, F.J. Synthesis and spectral properties of a hydrophobic fluorescent probe: 6-propionyl-2-(dimethylamino)naphthalene. Biochemistry 1979, 18, 3075–3078. [Google Scholar] [CrossRef] [PubMed]
  2. Parasassi, T.; Conti, F.; Gratton, E. Time-resolved fluorescence emission spectra of Laurdan in phospholipid vesicles by multifrequency phase and modulation fluorometry. Cell Mol. Biol. 1986, 32, 103–138. [Google Scholar] [PubMed]
  3. Parasassi, T.; Krasnowska, E.K.; Bagatolli, L.; Gratton, E. Laurdan and Prodan as Polarity-Sensitive Fluorescent Membrane Probes. J. Fluoresc. 1998, 8, 365–373. [Google Scholar] [CrossRef]
  4. Nabavi Zadeh, P.S.; Zezzi do Valle Gomes, M.; Abrahamsson, M.; Palmqvist, A.E.C.; Åkerman, B. Measuring viscosity inside mesoporous silica using protein-bound molecular rotor probe. PCCP 2018, 20, 23202–23213. [Google Scholar] [CrossRef] [PubMed] [Green Version]
  5. Vasu, A.K.; Kanvah, S. Red-emitting cationic fluorophore as a probe for anionic surfactants. Dyes Pigm. 2017, 142, 230–236. [Google Scholar] [CrossRef]
  6. Mika, J.T.; Thompson, A.J.; Dent, M.R.; Brooks, N.J.; Michiels, J.; Hofkens, J. Measuring the Viscosity of the Escherichia coli Plasma Membrane Using Molecular Rotors. Biophys. J. 2016, 111, 1528–1540. [Google Scholar] [CrossRef] [PubMed] [Green Version]
  7. Su, D.; Teoh, C.L.; Gao, N.; Xu, Q.-H.; Chang, Y.-T. A Simple BODIPY-Based Viscosity Probe for Imaging of Cellular Viscosity in Live Cells. Sensors 2016, 16, 1397. [Google Scholar] [CrossRef]
  8. Loving, G.S.; Sainlos, M.; Imperiali, B. Monitoring protein interactions and dynamics with solvatochromic fluorophores. Trends Biotechnol. 2010, 28, 73–83. [Google Scholar] [CrossRef] [Green Version]
  9. Nakanishi, J.; Nakajima, T.; Sato, M.; Ozawa, T.; Tohda, K.; Umezawa, Y. Imaging of Conformational Changes of Proteins with a New Environment-Sensitive Fluorescent Probe Designed for Site-Specific Labeling of Recombinant Proteins in Live Cells. Anal. Chem. 2001, 73, 2920–2928. [Google Scholar] [CrossRef]
  10. Lakowicz, J.R. Principles of Fluorescence Spectroscopy; Springer: New York, NY, USA, 2006. [Google Scholar]
  11. Marini, A.; Muñoz-Losa, A.; Biancardi, A.; Mennucci, B. What is Solvatochromism? J. Phys. Chem. B 2010, 114, 17128–17135. [Google Scholar] [CrossRef]
  12. Sasaki, S.; Niko, Y.; Klymchenko, A.S.; Konishi, G. Design of donor–acceptor geometry for tuning excited-state polarization: Fluorescence solvatochromism of push–pull biphenyls with various torsional restrictions on their aryl–aryl bonds. Tetrahedron 2014, 70, 7551–7559. [Google Scholar] [CrossRef]
  13. Klymchenko, A.S. Solvatochromic and Fluorogenic Dyes as Environment-Sensitive Probes: Design and Biological Applications. Acc. Chem. Res. 2017, 50, 366–375. [Google Scholar] [CrossRef] [PubMed] [Green Version]
  14. Li, Y.; Liu, T.; Liu, H.; Tian, M.-Z.; Li, Y. Self-Assembly of Intramolecular Charge-Transfer Compounds into Functional Molecular Systems. Acc. Chem. Res. 2014, 47, 1186–1198. [Google Scholar] [CrossRef] [PubMed]
  15. Rácz, D.; Nagy, M.; Mándi, A.; Zsuga, M.; Kéki, S. Solvatochromic properties of a new isocyanonaphthalene based fluorophore. J. Photochem. Photobiol. A Chem. 2013, 270, 19–27. [Google Scholar] [CrossRef] [Green Version]
  16. Nagy, M.; Rácz, D.; Lázár, L.; Purgel, M.; Ditrói, T.; Zsuga, M. Solvatochromic Study of Highly Fluorescent Alkylated Isocyanonaphthalenes, Their π-Stacking, Hydrogen-Bonding Complexation, and Quenching with Pyridine. Chemphyschem 2014, 15, 3614–3625. [Google Scholar] [CrossRef]
  17. Nagy, M.; Rácz, D.; Nagy, Z.L.; Nagy, T.; Fehér, P.P.; Purgel, M.; Zsuga, M.; Kéki, S. An acrylated isocyanonaphthalene based solvatochromic click reagent: Optical and biolabeling properties and quantum chemical modeling. Dyes Pigm. 2016, 133, 445–457. [Google Scholar] [CrossRef] [Green Version]
  18. Nagy, M.; Rácz, D.; Nagy, Z.L.; Fehér, P.P.; Kalmár, J.; Fábián, I.; Kiss, A.; Zsuga, M.; Kéki, S. Solvatochromic isocyanonaphthalene dyes as ligands for silver(I) complexes, their applicability in silver(I) detection and background reduction in biolabelling. Sens. Actuators B Chem. 2018, 255, 2555–2567. [Google Scholar] [CrossRef] [Green Version]
  19. Nagy, M.; Kéki, S.; Rácz, D.; Mathur, J.; Vereb, G.; Garda, T.; M-Hamvas, M.; Chaumont, F.; Boka, K.; Boddi, B.; et al. Novel fluorochromes label tonoplast in living plant cells and reveal changes in vacuolar organization after treatment with protein phosphatase inhibitors. Protoplasma 2018, 255, 829–839. [Google Scholar] [CrossRef]
  20. Nagy, Z.; Nagy, M.; Kiss, A.; Rácz, D.; Barna, B.; Konczol, P.; Bankó, C.; Bacsó, Z.; Kéki, S.; Bánfalvi, G.; et al. MICAN, a new fluorophore for vital and non-vital staining of human cells. Toxicol. In Vitro 2018, 48, 137–145. [Google Scholar] [CrossRef]
  21. Nagy, M.; Kovács, S.L.; Nagy, T.; Rácz, D.; Zsuga, M.; Kéki, S. Isocyanonaphthalenes as extremely low molecular weight, selective, ratiometric fluorescent probes for Mercury(II). Talanta 2019, 201, 165–173. [Google Scholar] [CrossRef]
  22. Nad, S.; Pal, H. Unusual Photophysical Properties of Coumarin-151. J. Phys. Chem. A 2001, 105, 1097–1106. [Google Scholar] [CrossRef]
  23. Reichardt, C. Solvatochromic Dyes as Solvent Polarity Indicators. Chem. Rev. 1994, 94, 2319–2358. [Google Scholar] [CrossRef]
  24. Lippert, E. Dipolmoment und Elektronenstruktur von angeregten Molekülen. Zeitschrift für Naturforschung 1955, 10, 541–545. [Google Scholar] [CrossRef]
  25. Mataga, N.; Kaifu, Y.; Koizumi, M. The Solvent Effect on Fluorescence Spectrum, Change of Solute-Solvent Interaction during the Lifetime of Excited Solute Molecule. Bull Chem. Soc. Jpn. 1955, 28, 690–691. [Google Scholar] [CrossRef] [Green Version]
  26. Strickler, S.J.; Berg, R.A. Relationship between Absorption Intensity and Fluorescence Lifetime of Molecules. J. Chem. Phys. 1962, 37, 814–822. [Google Scholar] [CrossRef] [Green Version]
  27. Frisch, M.J.; Trucks, G.W.; Schlegel, H.B.; Scuseria, G.E.; Robb, M.A.; Cheeseman, J.R.; Scalmani, G.; Barone, V.; Petersson, G.A.; Nakatsuji, H.; et al. Gaussian 09, Revision, E.01; Gaussian Inc.: Wallingford, CT, USA, 2016. [Google Scholar]
  28. Miertuš, S.; Scrocco, E.; Tomasi, J. Electrostatic interaction of a solute with a continuum. A direct utilization of AB initio molecular potentials for the prevision of solvent effects. Chem. Phys. 1981, 55, 117–129. [Google Scholar] [CrossRef]
  29. Zhao, Y.; Truhlar, D.G. The M06 suite of density functionals for main group thermochemistry, thermochemical kinetics, noncovalent interactions, excited states, and transition elements: Two new functionals and systematic testing of four M06-class functionals and 12 other functionals. Theor. Chem. Acc. 2008, 120, 215–241. [Google Scholar]
  30. Schäfer, A.; Huber, C.; Ahlrichs, R. Fully optimized contracted Gaussian basis sets of triple zeta valence quality for atoms Li to Kr. J. Chem. Phys. 1994, 100, 5829–5835. [Google Scholar] [CrossRef]
  31. Yanai, T.; Tew, D.P.; Handy, N.C. A new hybrid exchange–correlation functional using the Coulomb-attenuating method (CAM-B3LYP). Chem. Phys. Lett. 2004, 393, 51–57. [Google Scholar] [CrossRef]
  32. Caricato, M.; Mennuccia, B.; Tomasi, J. Formation and relaxation of excited states in solution: A new time dependent polarizable continuum model based on time dependent density functional theory. J. Chem. Phys. 2006, 124, 124520. [Google Scholar] [CrossRef]
Sample Availability: Not available.
Scheme 1. The structures of the isocyanoaminonaphthalene (ICAN) derivatives and their general preparation method.
Molecules 24 02434 sch001
Figure 1. The UV-Vis spectra of the 1,4-ICAN (a), 2,6-ICAN (b), and 1,5-ICAN (c) isomers recorded in different solvents.
Molecules 24 02434 g001
Figure 2. Calculated electronic density differences between the first vertical excited state and the ground state in DMSO for the 1,4-ICAN (a), 2,6-ICAN (b), and 1,5-ICAN (c) isomers.
Molecules 24 02434 g002
Figure 3. Normalized fluorescence emission spectra of the 1,4-ICAN (a), 2,6-ICAN (b), and 1,5-ICAN (c) isomers recorded in different solvents.
Molecules 24 02434 g003
Figure 4. Variation of the fluorescence emission maximum with the empirical solvent polarity parameter ET(30) (a), and the Lippert–Mataga (LM) (b), plots for the 1,4-ICAN, 1,5-ICAN, and the 2,6-ICAN isomers. The data for the 1,5-ICAN isomer are taken from ref [15].
Molecules 24 02434 g004
Figure 5. Electrostatic potentials (ESP) for the relaxed ground and excited states of the 1,4-ICAN, 1,5-ICAN, and 2,6-ICAN isomer (from left to right).
Molecules 24 02434 g005
Figure 6. Time-resolved (blue curves) and steady-state emission (red curve) spectra of the 2,6-ICAN isomer in DMSO. The time-resolved emission spectra were recorded at 5 ns intervals.
Molecules 24 02434 g006
Figure 7. The variation of the radiative decay rate (kr) (a) and the non-radiative decay rate (knr) (b) the with the empirical solvent polarity parameter ET(30).
Molecules 24 02434 g007
Figure 8. Solvent rearrangement in the ground- (a) and in the first relaxed excited state (b) for the 1,5-ICAN isomer in water.
Molecules 24 02434 g008
Table 1. The maximum absorption wavelengths (λAbs) and the molar absorption coefficients at λAbs (ε) determined in various solvents for the 1,5-ICAN, 1,4-ICAN, and 2,6-ICAN isomers. The dielectric constants of the solvents (εr) are listed next to the solvent names.
1,5-ICAN *1,4-ICAN2,6-ICAN
Solvent (εr)λAbs (nm)ε (M−1cm−1)λAbs (nm)ε (M−1cm−1)λAbs (nm)ε (M−1cm−1)
n-Hexane (1.89)338673033590403522590
Toluene (2.38)341646033980703533120
DCM (8.93)3406030334102003483370
2-propanol (17.9)3437820341116303563620
THF (7.58)3445940345100003594120
EtOAc (6.02)342745034196403543790
Dioxane (2.25)343520034293903563430
Acetone (20.7)3456100341128003583430
Methanol (32.7)342394034194103534040
Pyridine (12.4)3475700353108903624320
Acetonitrile (37.5)3428140340119803553410
DMF (36.7)3467220354114303623630
DMSO (46.7)3476170359132703644460
Water (80.1)336840033393303402270
* The corresponding values for the 1,5-ICAN isomer are taken from ref [15] and listed here for comparison with those of the other ICAN isomers.
Table 2. The fluorescence emission maxima (λEm) and the quantum yields (Φf) determined in various solvents for the 1,5-ICAN, 1,4-ICAN, and 2,6-ICAN isomers.
1,5-ICAN *1,4-ICAN2,6-ICAN
Solvent (εr)λEm (nm)ΦfλEm (nm)ΦfλEm (nm)Φf
n-Hexane (1.89)4090.554020.483950.15
Toluene (2.38)4330.664060.723980.25
DCM (8.93)4610.884110.743980.29
2-propanol (17.9)4940.404190.544140.37
THF (7.58)4650.664130.524090.31
EtOAc (6.02)4640.454110.644060.24
Dioxane (2.25)4580.954120.864060.38
Acetone (20.7)4790.504110.414110.30
Methanol (32.7)4940.544190.594130.24
Pyridine (12.4)4900.284230.054200.09
Acetonitrile (37.5)4830.384160.454080.31
DMF (36.7)4910.484220.694190.53
DMSO (46.7)4970.744250.704200.51
Water (80.1)5130.044340.634190.21
* The corresponding values for the 1,5-ICAN isomer are taken from ref [15] and listed here for comparison with those of the other ICAN isomers.
Table 3. The Onsager-radius (ao), dipole moment difference between the excited and the ground state ((µE − µG)DFT) calculated by DFT (in DMSO, the values in hexane are ~0.4 D lower), and the dipole moment differences in the excited and ground state ((µE − µG)LM) determined by the Lippert–Mataga equation.
ao (pm)E − µG)DFT (D)E − µG)LM (D)
1,5-ICAN3054.84.9
1,4-ICAN2780.72.2
2,6-ICAN3883.53.6
Table 4. The fluorescence decay rate (kF), the radiative decay rate (kr), the non-radiative decay rate (knr), and the radiative decay rate (kSB) calculated by the Strickler–Berg equation (Equation (5)) for the ICAN isomers.
1,5-ICAN *1,4-ICAN2,6-ICAN
SolventkF × 10−8 (s−1)kr × 10−8 (s−1)knr × 10−8 (s−1)kSB × 10−8 (s−1)kF × 10−8 (s−1)kr × 10−8 (s−1)knr × 10−8 (s−1)kSB × 10−8 (s−1)kF × 10−8 (s−1)kr× 10−8 (s−1)knr × 10−8 (s−1)kSB × 10−8 (s−1)
n-Hexane1.500.840.660.811.950.951.01.21.890.291.60.26
THF0.930.620.310.741.420.740.681.10.910.280.630.29
MeOH0.970.520.450.471.250.740.511.21.290.310.980.26
Acetonitrile1.200.440.760.601.270.570.701.21.280.400.880.33
DMSO0.620.460.160.710.710.500.211.70.710.360.350.37
Water----1.731.20.531.01.660.361.30.21
* The corresponding values for the 1,5-ICAN isomer were taken from ref [15] and listed here for comparison with those of the other ICAN isomers.

