
Analysis of Flavonoid Metabolites in Citrus Peels (Citrus reticulata “Dahongpao”) Using UPLC-ESI-MS/MS


1
Department of Pharmacy, Chengdu University of TCM, Standardization education ministry key laboratory of traditional Chinese medicine, Chengdu 611137, China
2
Food & Drugs Authority of Nanchong, Nanchong 637000, China
*
Authors to whom correspondence should be addressed.
†
These authors contributed equally to this work.
Molecules 2019, 24(15), 2680; https://doi.org/10.3390/molecules24152680
Submission received: 20 June 2019
/
Revised: 14 July 2019
/
Accepted: 22 July 2019
/
Published: 24 July 2019
(This article belongs to the Special Issue Flavonoids: From Structure to Health Issues II)
Abstract
:Flavonoids are a kind of essential substance for the human body because of their antioxidant properties and extremely high medicinal value. Citrus reticulata “Dahongpao” (DHP) is a special citrus variety that is rich in flavonoids, however little is known about its systematic flavonoids profile. In the present study, the presence of flavonoids in five important citrus varieties, including DHP, Citrus grandis Tomentosa (HZY), Citrus ichangensis Swingle (YCC), Citrus sinensis (L.) Osbeck (TC), and Citrus reticulata ‘Buzhihuo’ (BZH), was determined using a UPLC-ESI-MS/MS-based, widely targeted metabolome. Results showed that a total of 254 flavonoid metabolites (including 147 flavone, 39 flavonol, 21 flavanone, 24 anthocyanins, 8 isoflavone, and 15 polyphenol) were identified. The total flavonoid content of peels from DHP was the highest. DHP could be clearly separated from other samples through clustering analysis and principal component analysis (PCA). Further, 169 different flavonoid metabolites were observed between DHP peels and the other four citrus peels, and 26 down-regulated differential metabolites displayed important biological activities in DHP. At the same time, a unique flavonoid component, tricin 4′-O-syringyl alcohol, was only found in DHP, which could be used as a marker to distinguish between other varieties. This work might facilitate a better understanding of flavonoid metabolites between DHP peels and the other four citrus peels and provide a reference for its sufficient utilization in the future.
1. Introduction
Citrus reticulata “Dahongpao” (DHP) is an ancient citrus variety. Its fruits and peels are rich in nutrients and bioactive compounds, and are very popular because of their antioxidant properties and extremely high medicinal value [1]. In recent years, due to the development of new citrus varieties, DHP has been almost completely replaced by various hybrid mandarins in China, however the health promotion or medicinal values of the “Dahongpao” tangerine have attracted more and more attention from researchers [2]. It was reported that the total flavonoid content of DHP peel was one of the highest in citrus varieties [3], and it has been included in the key protection of citrus varieties in China. Previous studies have shown that flavonoids are involved in many biological functions and have important health-related roles, such as anti-oxidative [4], anti-diabetic [5], anti-inflammatory [6], and anti-hypertensive [7] activities. Therefore, systematic analysis of the flavonoids and screening the unique components in DHP peels are of great significance for the sufficient utilization and development of DHP.
Traditionally, high-performance liquid chromatography (HPLC) coupled with DAD, HPLC coupled with MS, or even UPLC-Q-TOF-MS, were often adopted to analyze the components of citrus varieties. Green et al. [8] studied six polymethoxylated flavones in peels of selected Jamaican and Mexican citrus cultivars by HPLC; Zhang et al. [9] identified 28 flavonoid compositions of flavedo and juice using an HPLC-DAD-MS/MS system; Zhao et al. [10] used UPLC-Q-TOF-MS to analyze 81 phytochemical components in the peel of Chinese wild Citrus Mangshanju. Zhao et al. detected 92 compounds in the peels of six oranges and 10 mandarins using UHPLC-Q-TOF-MS; Li et al. [2] established a preparative separation method, which could simultaneously isolate the polymethoxylated flavones (PMFs) from the peel of DHP using macroporous adsorptive resins (MARs) combined with prep-HPLC.
As a whole, the analysis and detection of bioactive compounds in citrus varieties has been studied by many researchers. However, all these methods have the shortcoming of only checking a small number of compounds, which cannot profile the chemical compositions of citrus species in a systematic and comprehensive way. Less than 100 compounds in citrus peel have been reported in the existing literature. In recent years, UPLC-ESI-MS/MS-based, widely targeted metabolome has become very popular in the field of analysis and identification of plant metabolites due to the advantages of high throughput, fast separation, high sensitivity, and wide coverage. At present, this method has been widely applied in plant metabolites analysis in maize [11], rice [12,13,14], tomato [15,16], potato [17], and other plants [18,19]. So far, it is an effective method to thoroughly understand plant secondary metabolites.
Researchers have reported that the types of bioactive compounds in citrus peels are often higher than that in pulp and seeds [20]. So, those citrus peels can be totally regarded as a kind of nutraceutical [21] or functional food to complement and help with the treatment of pathologies [22,23]. In this study, five important citrus varieties, including two mandarins (DHP and BZH), one pummelo (HZY), and two oranges (TC and YCC), were selected as experimental materials in order to have a better understanding of the flavonoids profiling of DHP peel and to clarify the unique flavonoids. A UPLC-ESI-MS/MS method was used for profiling the flavonoid metabolites in the peel of DHP and the other four citrus varieties. These results might facilitate a better understanding of flavonoid metabolites between DHP peels and four other citrus peels and provide a reference for their sufficient utilization in the future.
2. Results
2.1. Determination of Total Flavonoid Content
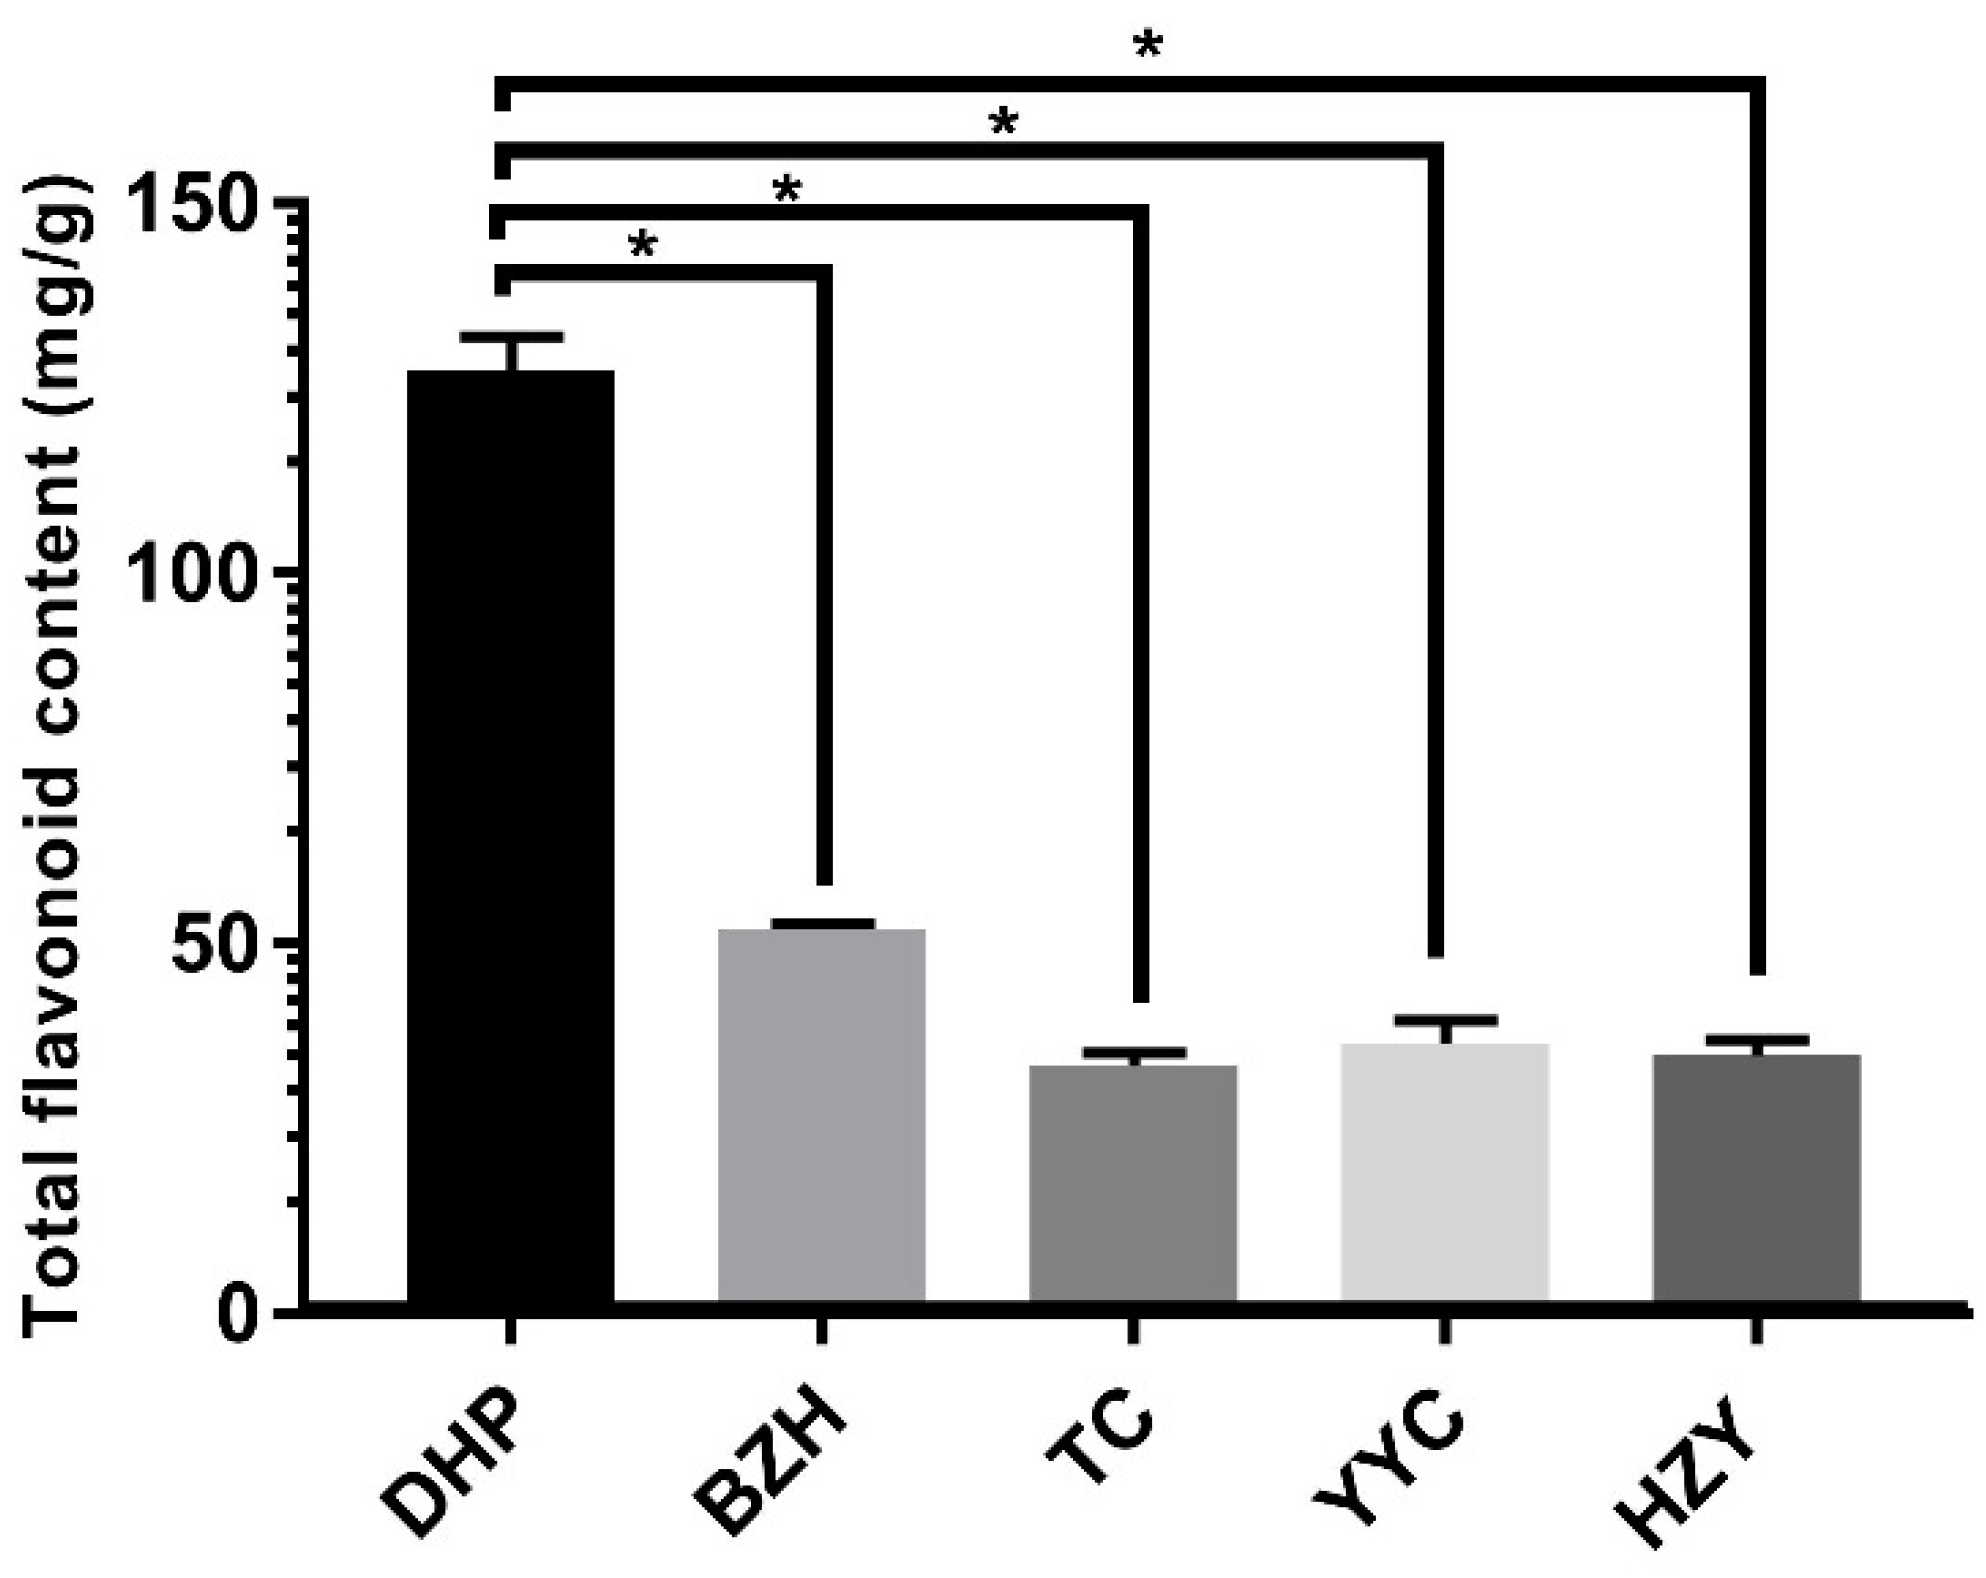
In this study, the total flavonoid content was determined from the Citrus reticulata “Dahongpao” (DHP) sample and four other citrus varieties, including Citrus grandis Tomentosa (HZY), Citrus ichangensis Swingle (YCC), Citrus sinensis (L.) Osbeck (TC), and Citrus reticulata “Buzhihuo” (BZH). The method of ordinary one-way ANOVA was used to analyse the data. The flavonoid content of the peels from DHP was significantly higher (p < 0.05) than that of HZY, YCC, TC, and BZH, reaching 122.5 mg/g (Figure 1). The flavonoid content of BZH was the second highest at 50.1 mg/g. The experimental results were consistent with the literature reported [4].
2.2. Metabolic Profiling
The flavonoid metabolites of the citrus peels from DHP and four other citrus varieties were investigated based on UPLC-ESI-MS/MS and databases. In the present study, 254 flavonoid metabolites were identified (Supplementary Table S1), including 147 flavone, 39 flavonol, 21 flavanone, 24 anthocyanins, 8 isoflavone, and 15 polyphenol. In the heatmap (Supplementary Figure S1), the content of flavonoid metabolites in DHP contrasted with YCC and HZY varied greatly, whereas the contents of flavonoid metabolites among YCC and HZY were basically consistent. Although DHP, BZH, and TC were grouped into one category, the content of metabolites was also quite different from each other on the heatmap. This finding was demonstrated by clustering analysis of the samples and showed that DHP was clearly distinguished from the other four citrus varieties.
2.3. Differential Flavonoid Metabolite Analysis Based on PCA
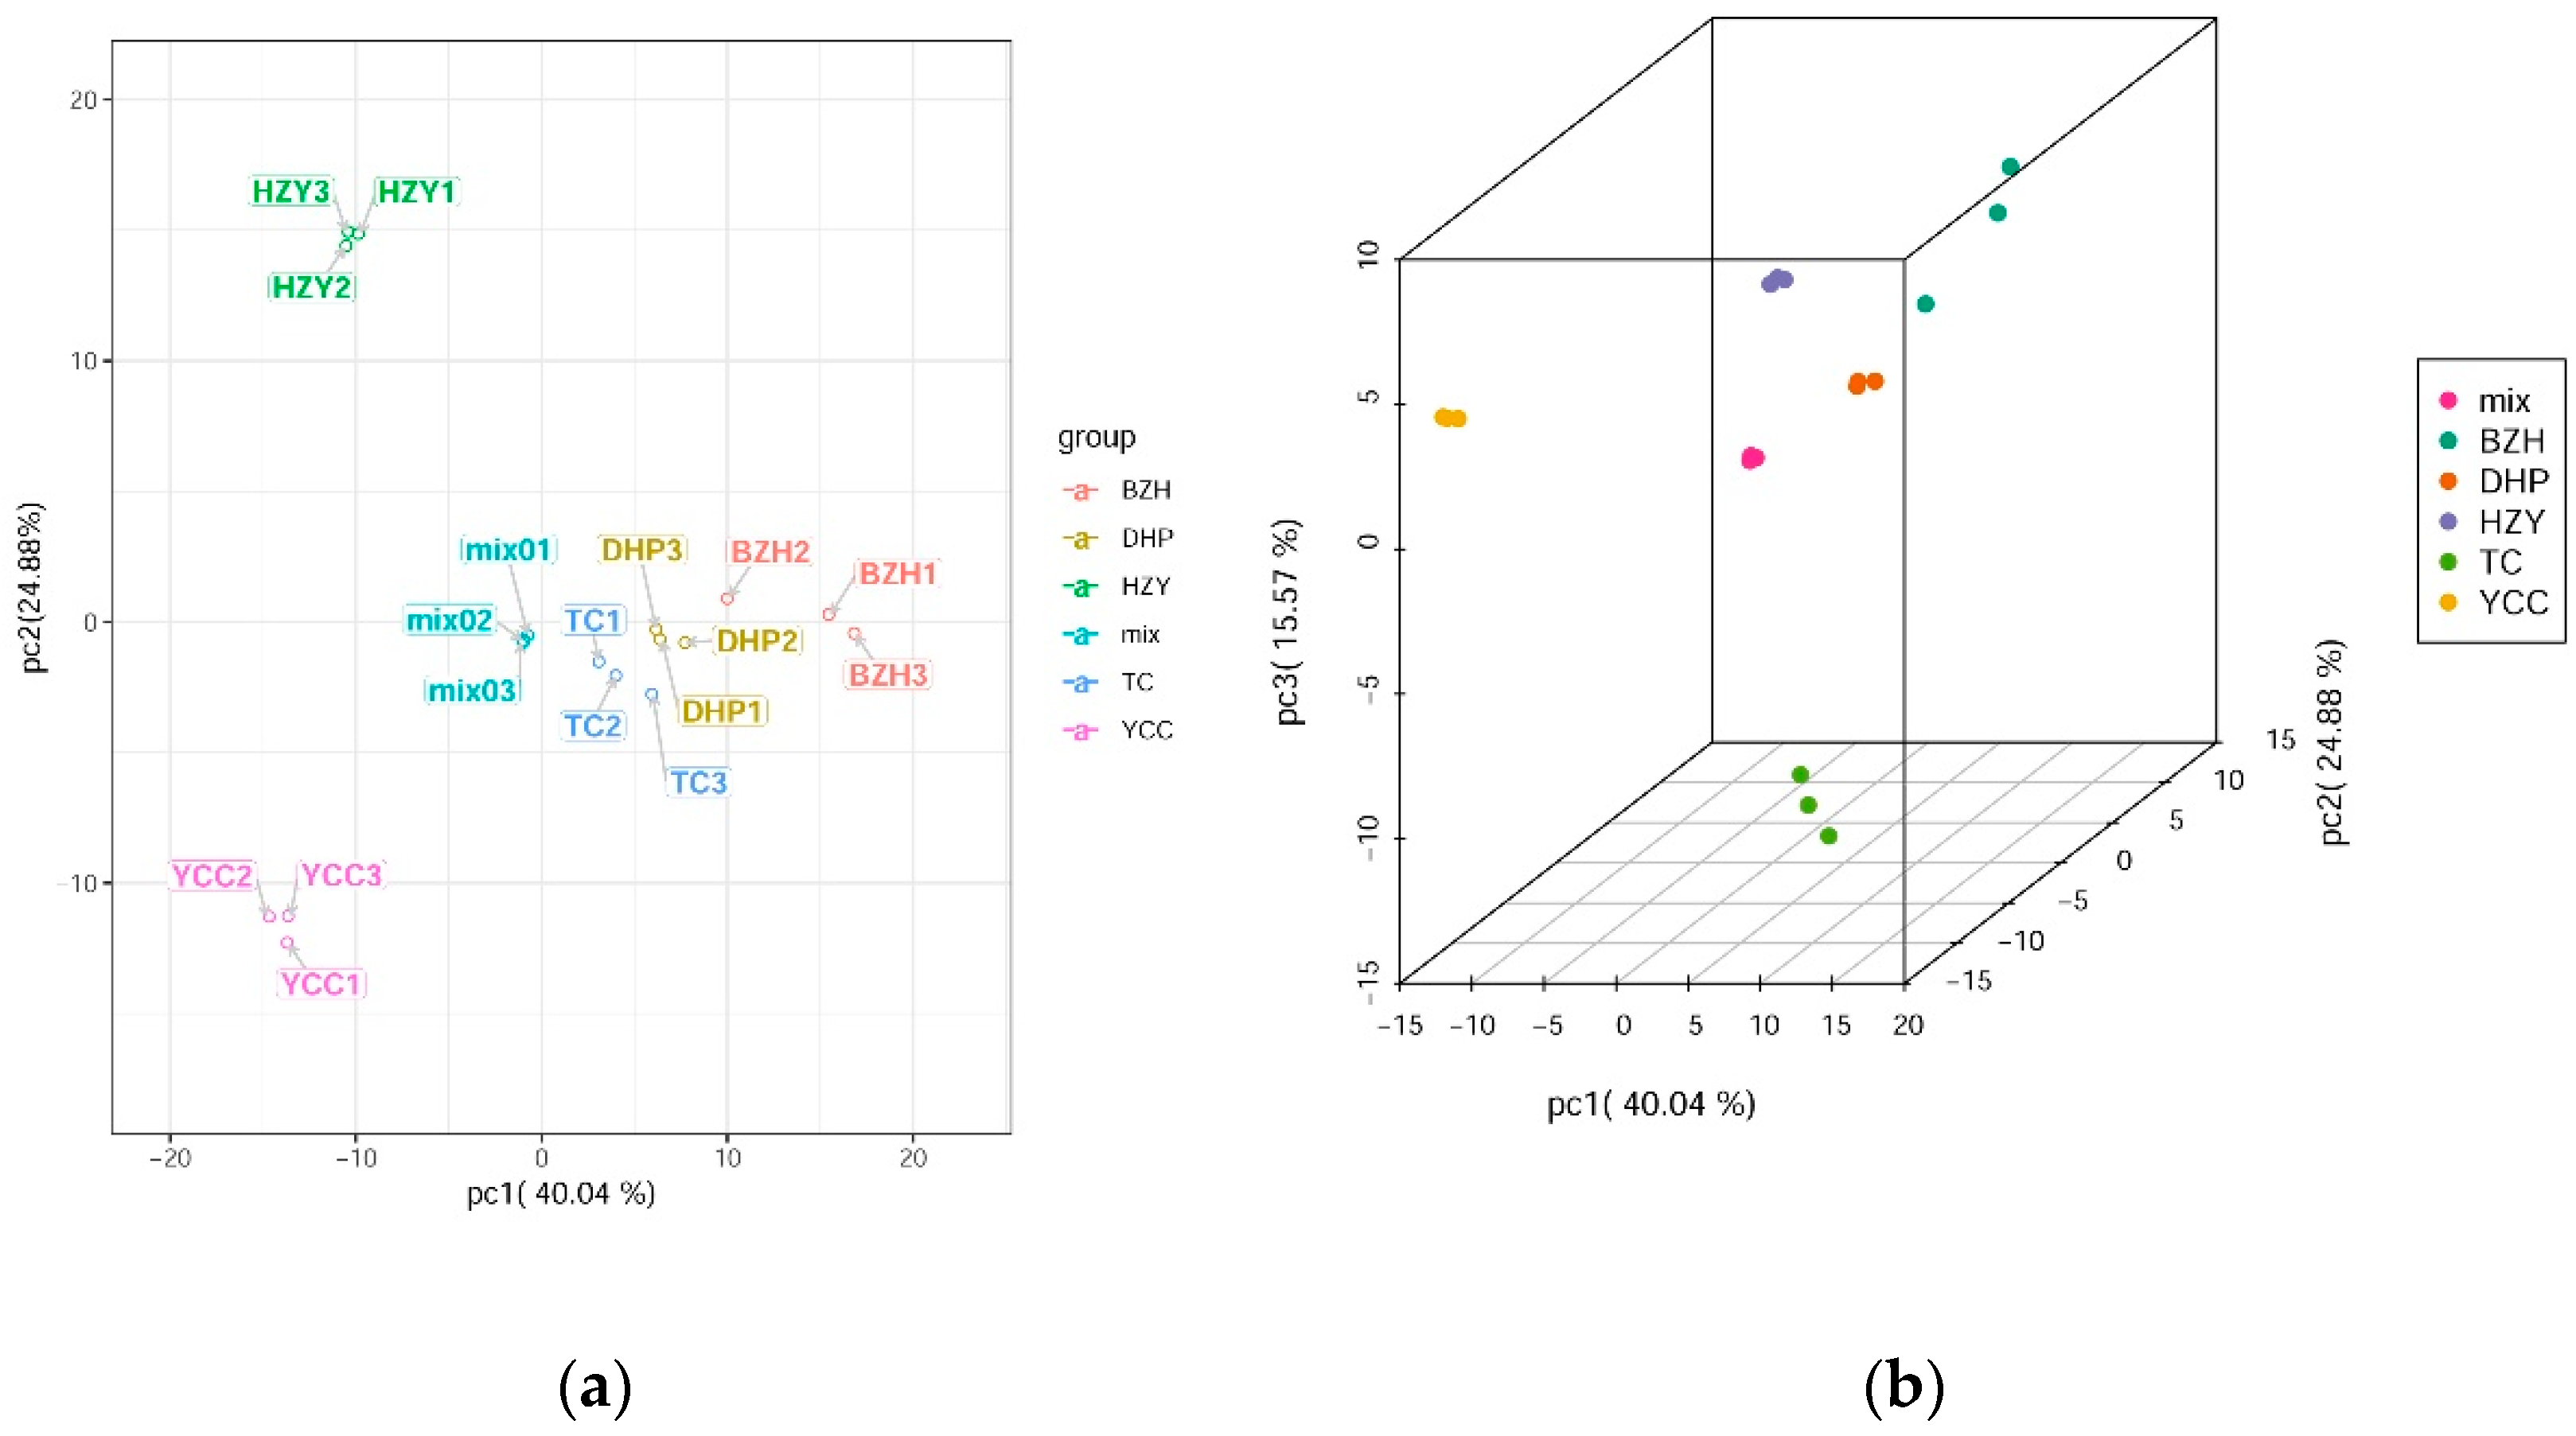
Principle component analysis (PCA) uses several principal components to reveal the overall metabolic differences among the groups and the variability between the intra-group samples. In this study, two principal components, PC1 and PC2, were extracted and were 40.04% and 24.88%, respectively; moreover, the cumulative contribution rate reached 64.92%. In the PCA score plot, DHP, YCC, TC, HZY, and BZH were clearly separated, and the repeated samples were compactly gathered together (Figure 2), thus indicating that the experiment was reproducible and reliable. In the PCA 3D map, the clustering of samples could be seen more intuitively. Through PCA analysis, it was found that the difference of flavonoid metabolic components among samples might be the difference between DHP and other citrus varieties.
2.4. Differential Flavonoid Metabolite Analysis Based on OPLS-DA
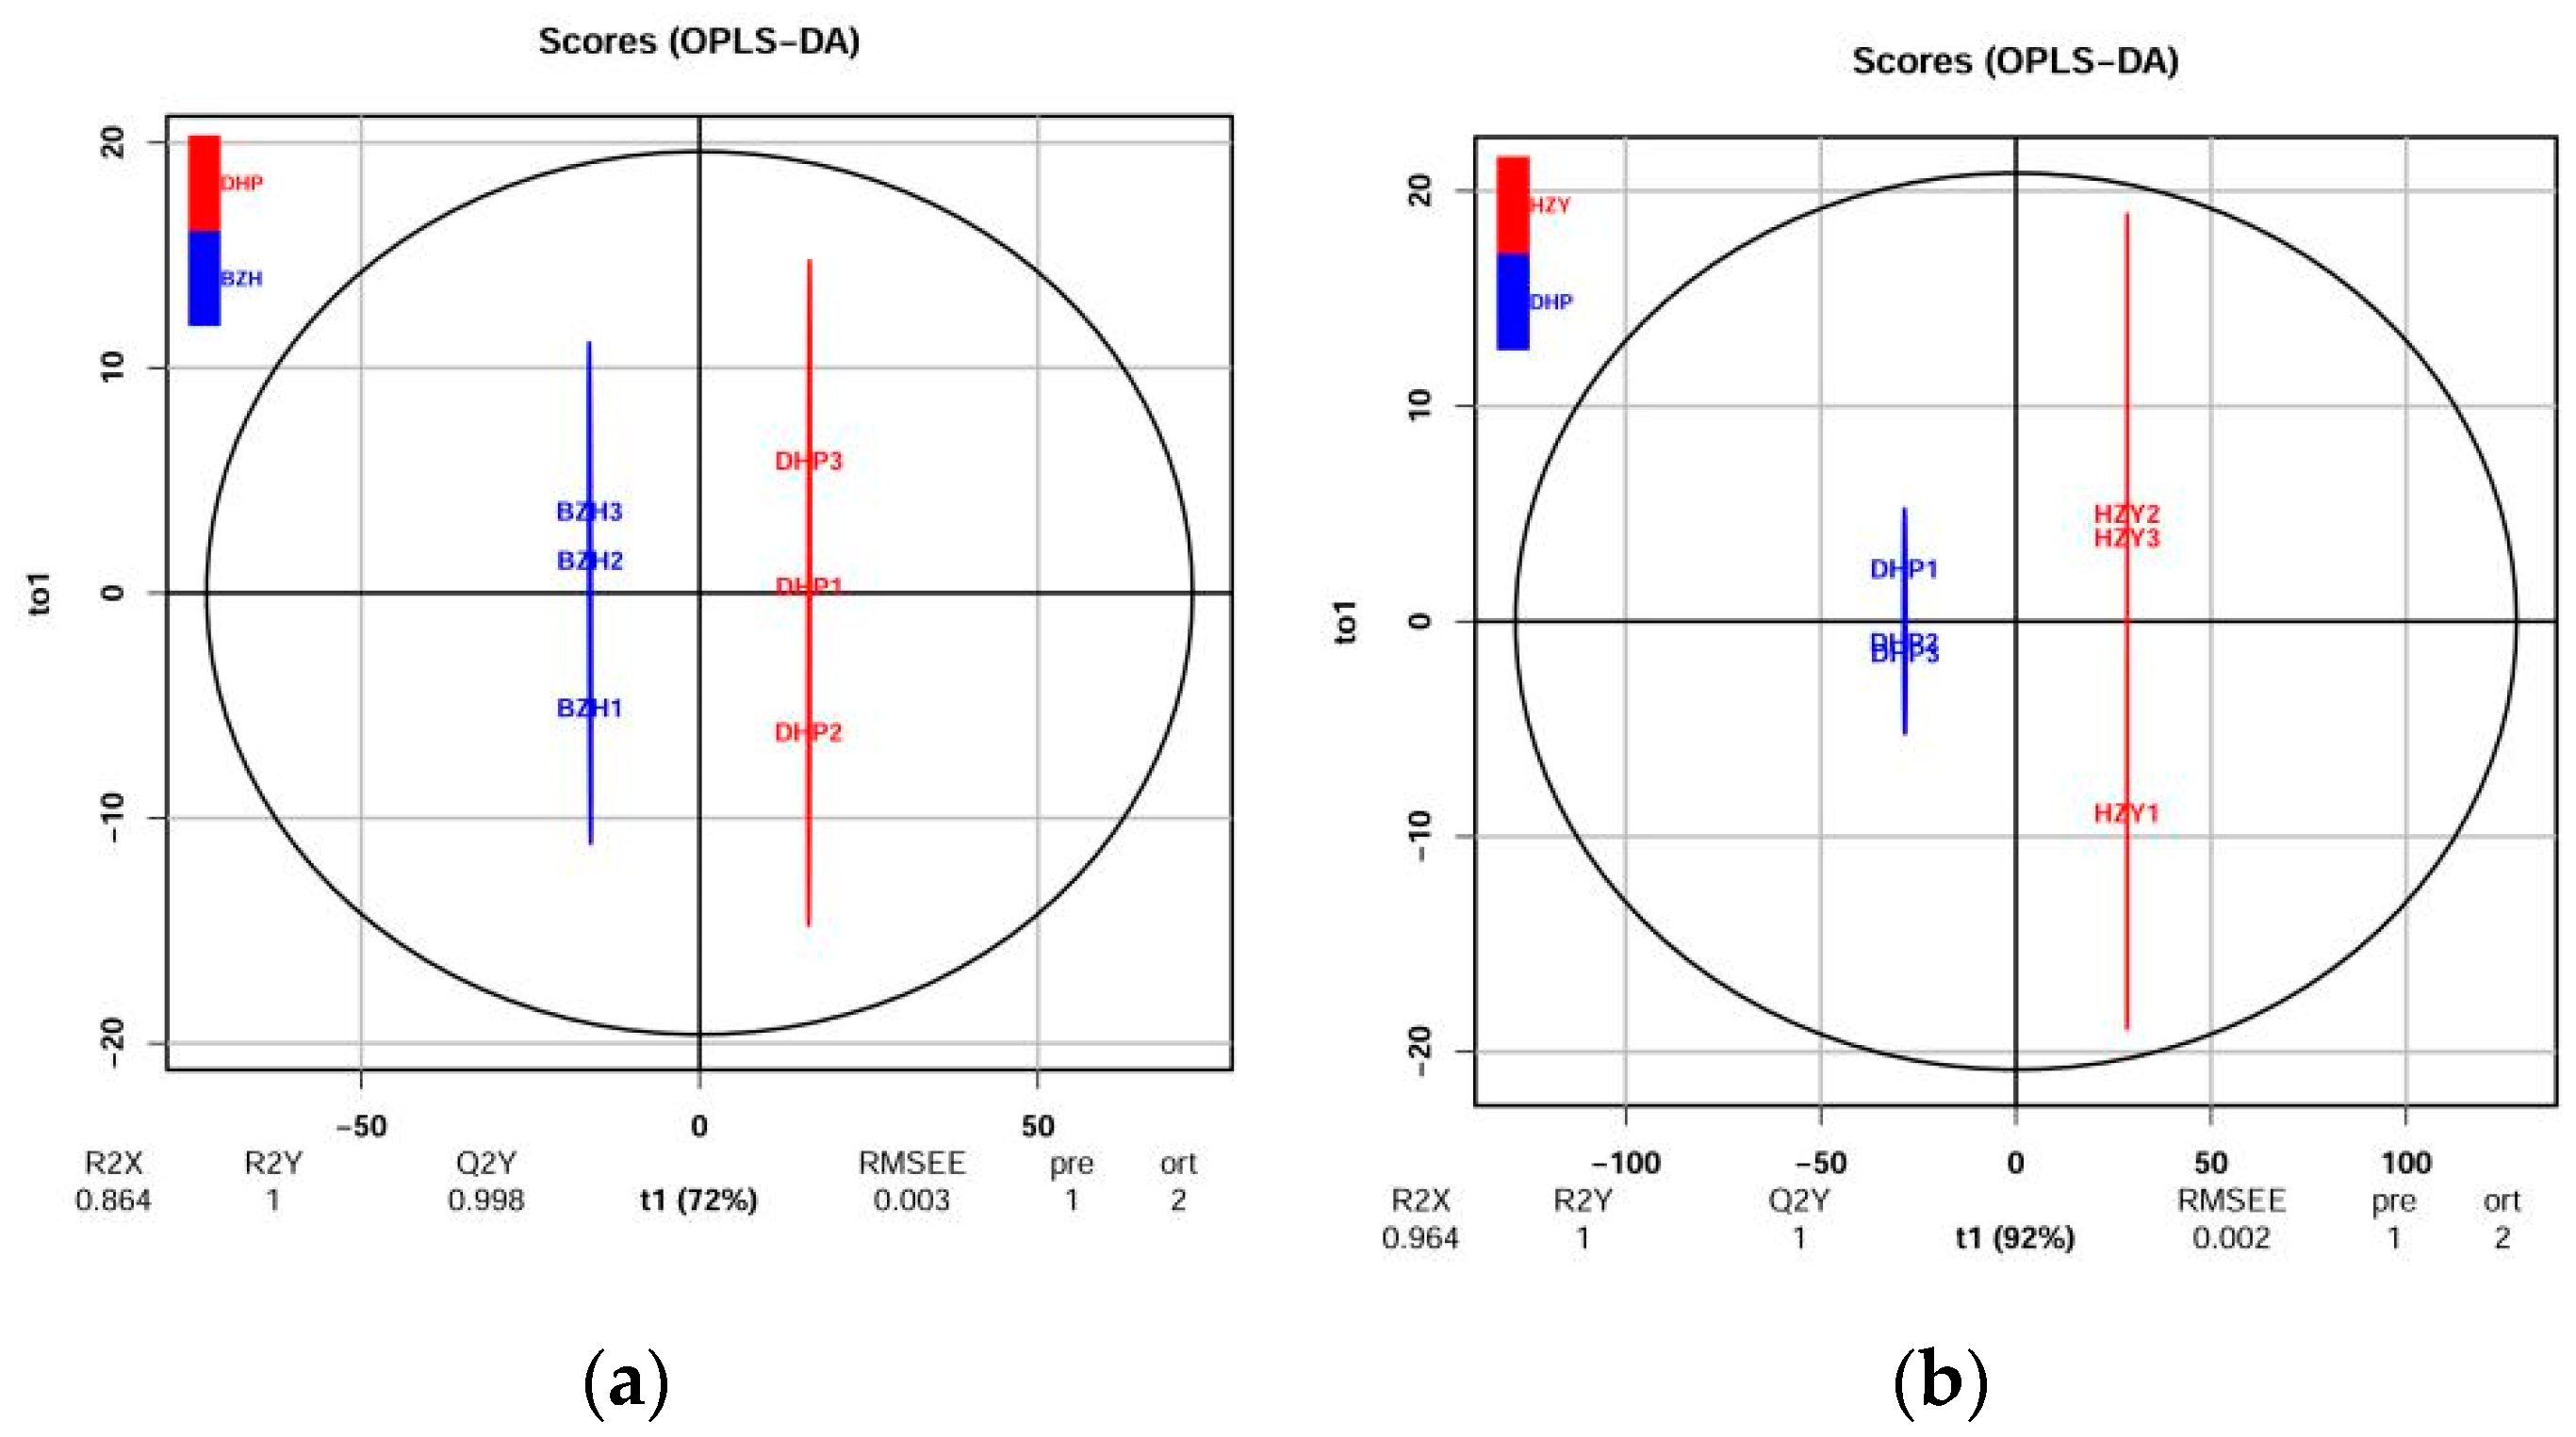
Orthogonal signal correction and partial least squares-discriminant analysis (OPLS-DA) is an effective method for screening differential metabolites because it can maximize the difference between groups. Q2 is an important parameter for evaluating the models in OPLS-DA. Q2 values greater than 0.9 indicate an excellent model. In this study, the OPLS-DA model compared the flavonoid metabolite content of the samples in pairs to evaluate the difference between DHP and YCC (R2X = 0.964, R2Y = 1, Q2 = 1), between DHP and TC (R2X = 0.948, R2Y = 1, Q2 = 0.999), between DHP and HZY (R2X = 0.964, R2Y = 1, Q2 = 1), and between DHP and BZH (R2X = 0.864, R2Y = 1, Q2 = 0.998). The Q2 values of all comparison groups exceeded 0.9 (Figure 3), thus demonstrating that these models were stable and reliable and could be used to further screen for differential flavonoid metabolites.
2.5. Differential Flavonoid Metabolite Screening, Functional Annotation, and Enrichment Analysis
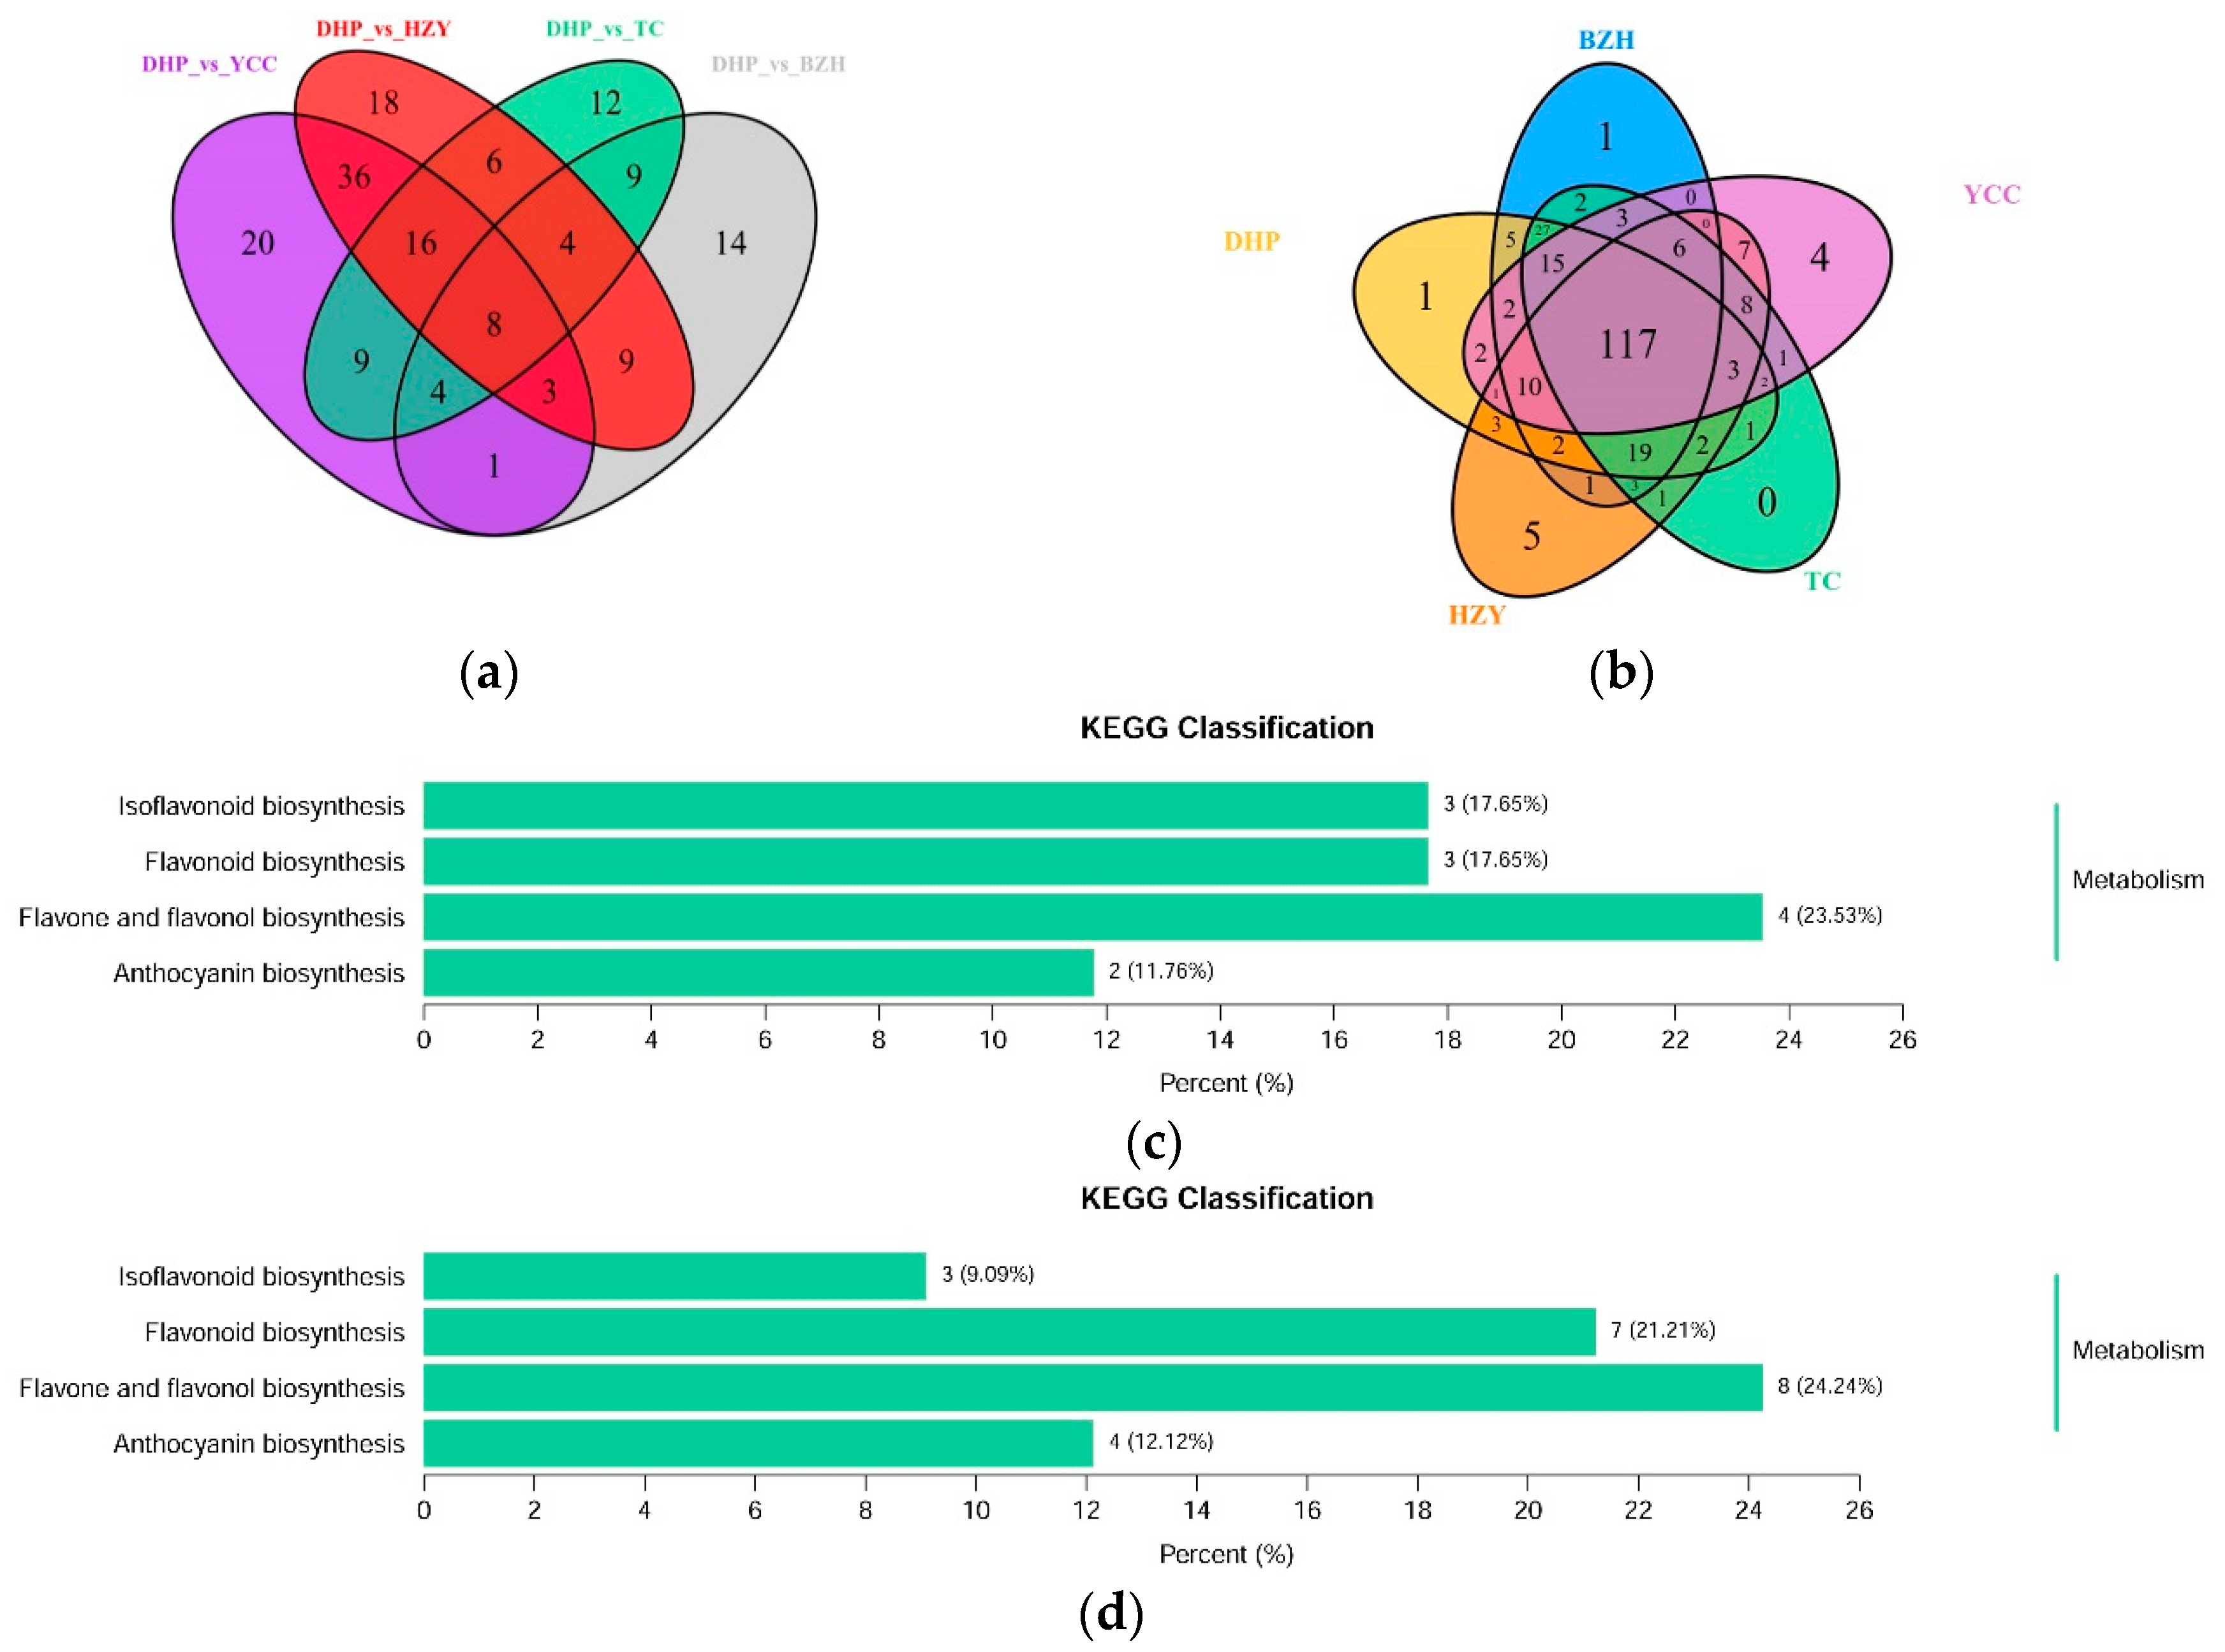
Differential flavonoid metabolites were screened for each comparison group by combining the fold change and variable importance in project (VIP) values of the OPLS-DA model. The criteria for screening included a fold change value of ≥2 or ≤0.5 and a VIP value of ≥1. The screening results are shown in Supplementary Table S2. A volcanic plot provides a quick way to see the differences in metabolite expression levels in two samples, as well as the statistical significance of the differences (Figure 4). There were 52 significantly different flavonoid metabolites between DHP and BZH (21 down-regulated, 31 up-regulated), 100 between DHP and HZY (64 down-regulated, 36 up-regulated), 68 between DHP and TC (41 down-regulated, 27 up-regulated), and 97 between DHP and YCC (65 down-regulated, 32 up-regulated). Compared with DHP, the flavonoid metabolites of BZH were up-regulated, and HZY, TC, and YCC were down-regulated. Further, 169 differential metabolites were observed in all the comparison groups and 26 down-regulated differential metabolites display important biological activities in DHP (Table 1). After taking an intersection of each comparison group in a Venn diagram (Figure 5a), 8 common differential metabolites were observed, and each comparison group had its unique differential metabolites. Therefore, differential metabolites could clearly distinguish DHP from other citrus varieties.
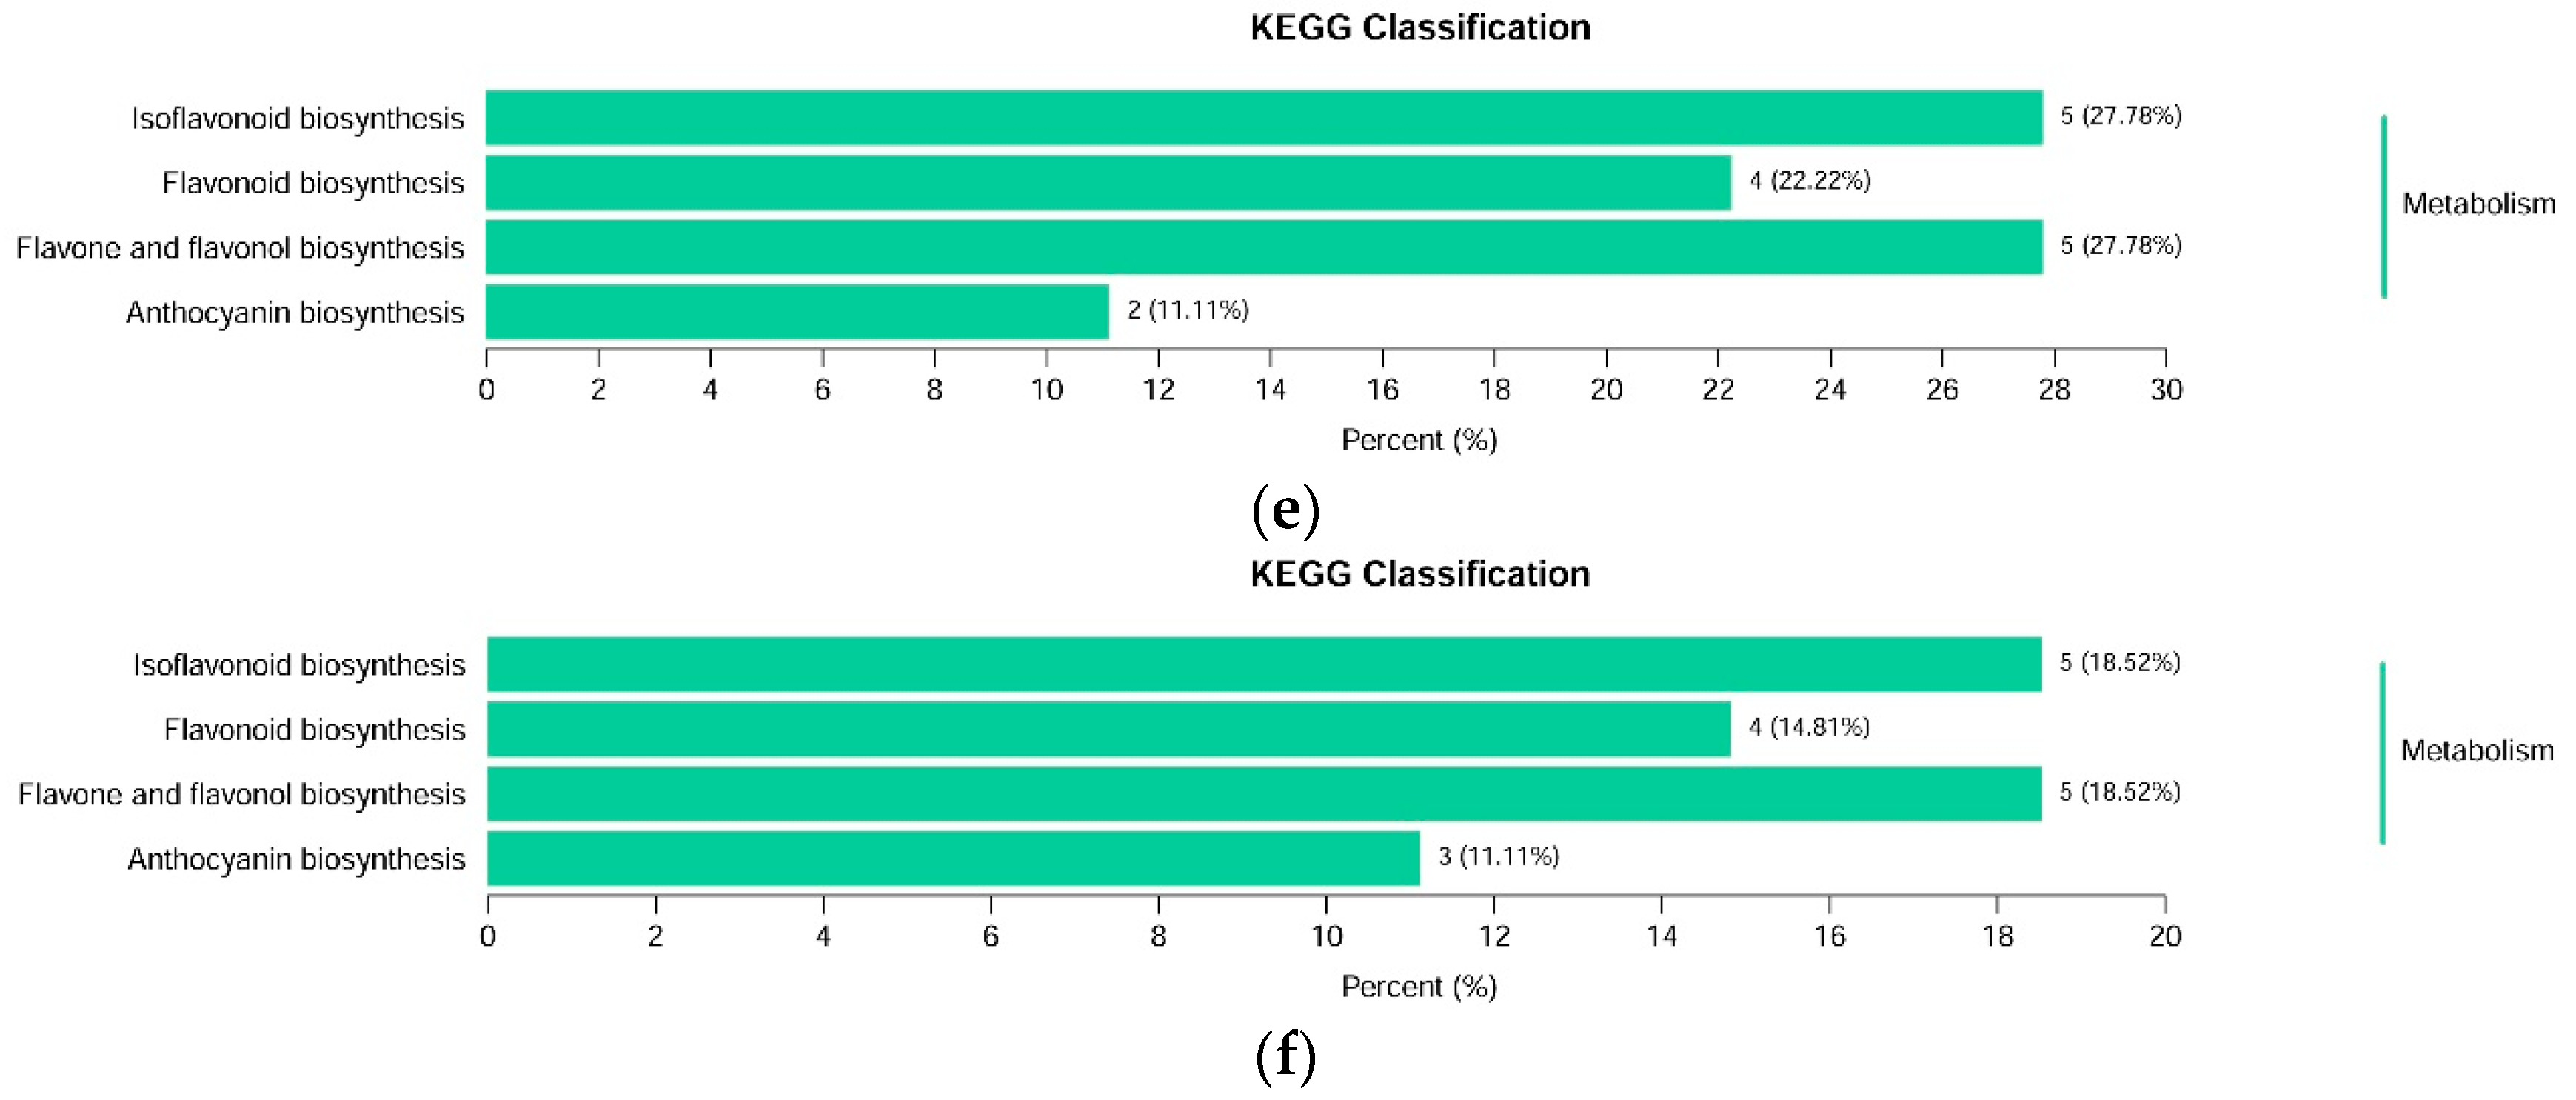
The differential flavonoid metabolites from each comparison group were annotated by the Kyoto Encyclopedia of Genes and Genomes (KEGG) database (Supplementary Table S3). The KEGG classification results and enrichment analysis (Figure 5c–f) indicate that the differential flavonoid metabolites of the comparison groups were involved in isoflavonoid biosynthesis, flavonoid biosynthesis, flavone and flavonol biosynthesis, and anthocyanin biosynthesis.
3. Discussion
The analysis of the experimental data showed that the peels of DHP were rich in flavonoids, and the flavonoid content could reach 122.5 mg/g, which is significantly higher than that of HZY, YCC, TC, and BZH, however the utilization is extremely inadequate. Thus, this study aimed to provide a theoretical basis for the utilization of DHP peels. The enrichment analysis of the differential metabolites revealed that differential metabolites were mainly involved in isoflavonoid biosynthesis, flavonoid biosynthesis, flavone and flavonol biosynthesis, and anthocyanin biosynthesis.
Isoflavones are generally exclusively present in legumes, such as soybeans, and play important roles in plant defense and nodules [24]. In the present study, eight isoflavones were detected in orange peels, of which only the compound prunetin and biochanin A were down-regulated, whereas other compounds were up-regulated. Prunetin is always found in herbs and spices, like Prunus species or Glycyrrhiza glabra [25]. Biochanin A is an isoflavone derivative isolated from red clover Trifolium pratense with anticarcinogenic properties; it has estrogen-like effects, can inhibit the rise of cholesterol, however it also has anti-fungal and anti-tumor effects [26]. Five flavonoid compounds were detected in flavonoid biosynthesis in all the samples. The most interesting thing was that all of them were down-regulated when other samples were compared with DHP. Dihydromyricetin has many peculiar effects, such as scavenging free radicals, antioxidant, anti-thrombosis, anti-cancer, and anti-inflammatory actions [27,28,29]. Dihydroquercetin, as an important flavonoid, exists in many plants and has a high content of larch, especially Pinus elliottii [30]. In recent years, dihydroquercetin has also been found in fruits, especially grapes [31] and oranges [32]. Anthocyanin is a kind of water-soluble natural pigment widely found in plants in nature, which is also a powerful antioxidant that can protect against harmful substances [33]. Compared with DHP, most of the anthocyanin metabolites in the peels of other samples were down-regulated. Cyanidin 3-O-galactoside was the only differential anthocyanin detected in the comparison group DHP versus BZH. Comparison groups showed that 117 overlap metabolites and 11 unique metabolites were detected (Figure 5b). They were Tricin 4′-O-syringyl alcohol, Tricin O-rhamnosyl-O-malonylhexoside, Chrysoeriol O-hexosyl-O-pentoside, 8-C-hexosyl-chrysoeriol O-feruloylhexoside, Apigenin O-hexosyl-O-pentoside, Apigenin O-hexosyl-O-rutinoside, Chrysoeriol 5-O-hexoside, Daidzein 7-O-glucoside, Gossypol, Pedalitin, and Demethoxycurcumin. At the same time, Tricin 4′-O-syringyl alcohol was only detected in DHP, and the compounds Daidzein 7-O-glucoside and Demethoxycurcumin were reported to have pharmacological activities in the literature [34,35].
The identification of closely-related citrus varieties is controversial because of substantial interspecific hybridization, which has resulted in several clonally propagated and cultivated accessions [36]. Some hybrids mandarins are closely-related and have very small differences, so it is very difficult to identify them. In this paper, DHP and BZH are two closely-related citrus varieties. Through clustering analysis, principal component analysis (PCA), and orthogonal signal correction and partial least squares-discriminant analysis (OPLS-DA), DHP and BZH were clearly separated. Therefore, metabolites analysis based on the UPLC-ESI-MS/MS platform may be an effective method to distinguish closely-related species.
4. Materials and Methods
4.1. Plant Materials
Five citrus varieties were collected from the Citrus Research Institute of the Chinese Academy of Agricultural Sciences (106°24′ E, 29°59′ N, altitude 175 m). They were Citrus reticulata “Dahongpao” (DHP), Citrus grandis Tomentosa (HZY), Citrus ichangensis Swingle (YCC), Citrus sinensis (L.) Osbeck (TC), and Citrus reticulata “Buzhihuo” (BZH), respectively. The citrus peels were frozen in liquid nitrogen immediately after collection and stored at −80 °C.
4.2. Sample Preparation and Extraction
The freeze-dried citrus peels were crushed using a mixer mill (MM400, Retsch, Laichi, Germany) with a zirconia bead for 1.5 min at 30 Hz. Then, 100 mg of powder was weighed and extracted overnight at 4 °C with 1.0 mL 70% aqueous methanol. Following centrifugation at 10,000× g for 10 min, the extracts were absorbed (CNWBOND Carbon-GCB SPE Cartridge, 250 mg, 3 mL; ANPEL, Shanghai, China) and filtrated (SCAA-104, 0.22 μm pore size; ANPEL, Shanghai, China) before LC-MS analysis.
4.3. UPLC Conditions
The sample extracts were analyzed using an LC-ESI-MS/MS system (UPLC, Shim-pack UFLC SHIMADZU CBM30A system; MS, Applied Biosystems 6500 QTRAP). The UPLC conditions were performed according to the method by Wang et al. [37]. The analytical conditions were as follows, UPLC: column, Waters ACQUITY UPLC HSS T3 C18 (1.8 µm, 2.1 mm × 100 mm, Milford, MA, USA); solvent system, water (0.04% acetic acid): acetonitrile (0.04% acetic acid); gradient program, 100:0 v/v at 0 min, 5:95 v/v at 11.0 min, 5:95 v/v at 12.0 min, 95:5 v/v at 12.1 min, 95:5 v/v at 15.0 min; flow rate, 0.40 mL/min; temperature, 40 °C; injection volume: 2 μL. The effluent was alternatively connected to an ESI-triple quadrupole-linear ion trap (Q TRAP)-MS.
4.4. ESI-Q TRAP-MS/MS
Mass spectrometry followed the method of Chen et al. [13]. LIT and triple quadrupole (QQQ) scans were acquired on a triple quadrupole-linear ion trap mass spectrometer (Q TRAP), API 6500 Q TRAP LC/MS/MS System, equipped with an ESI Turbo Ion-Spray interface, operating in a positive ion mode and controlled by Analyst 1.6.3 software (AB Sciex, Waltham, MA, USA). The ESI source operation parameters were as follows: ion source, turbo spray; source temperature 500 °C; ion spray voltage (IS) 5500 V; ion source gas I (GSI), gas II (GSII), and curtain gas (CUR) were set at 55, 60, and 25.0 psi, respectively; the collision gas (CAD) was high. Instrument tuning and mass calibration were performed with 10 and 100 μmol/L polypropylene glycol solutions in QQQ and LIT modes, respectively. QQQ scans were acquired as MRM experiments with collision gas (nitrogen) set to 5 psi. DP and CE for individual MRM transitions was done with further DP and CE optimization. A specific set of MRM transitions were monitored for each period according to the metabolites eluted within this period.
4.5. Determination of Total Flavonoids Content
Approximately 2.0 g of citrus peels from each sample were freeze-dried by using a vacuum freeze dryer and then ground into powder using a mortar. The total flavonoid content of 0.02 g citrus peels was determined in accordance with the protocol of Plant Flavonoids Test kit (Suzhou Comin Biotechnology Co., Ltd., Suzhou, China).
4.6. Qualitative and Quantitative Analysis of Metabolites
Qualitative and quantitative analysis of metabolites were performed according to the method by Wang et al. [37]. Based on the self-built database MWDB (Metware Biotechnology Co., Ltd. Wuhan, China) and public database of metabolite information, the metabolites of the samples were qualitatively and quantitatively analyzed by mass spectrometry. The characteristic ions of each substance were screened out by the triple quadrupole rod, and the signal strength of the characteristic ions were obtained in the detector. The mass spectrometry file under the sample was opened with MultiaQuant software 3.0.3 to carry out the integration and correction of chromatographic peaks, and the relative content of the corresponding substances in the peak area of each chromatographic peak were calculated. Finally, all chromatographic peak area integral data were derived. In order to compare the contents of each metabolite in different samples, we calibrated the mass spectrum peaks detected by each metabolite in different samples based on the information of metabolite retention time and peak pattern. Thus, the accuracy of the qualitative and quantitative analysis was further ensured.
4.7. Sample Quality Control Analysis
The high stability of the instrument provided an important guarantee for the repeatability and reliability of the data. In order to test the stability of the instrument, one quality control sample was inserted into every 10 samples in the process of instrument analysis to monitor the repeatability of the analysis process, and the repeatability of metabolite extraction and detection was judged by overlapping the analysis of total ion flow maps of different quality control samples.
4.8. Statistical Analysis
Three biological replicates were performed in each experiment. Cluster analysis, PCA, and OPLS-DA were carried out by using R (http://www.r-project.org/) in accordance with previously described methods [38].
5. Conclusion
In this paper, the flavonoid metabolites in the peels of DHP and the other four citrus varieties were systematically analyzed and identified using a UPLC-ESI-MS/MS-based, widely targeted metabolome. A total of 252 flavonoid metabolites were detected, 117 of which were compounds shared by all samples, and 169 differential metabolites were observed in all the comparison groups, 8 of which were common differential metabolites. At the same time, a total of 11 unique metabolites were detected in all the samples, of which Tricin 4′-O-syringyl alcohol only existed in DHP and could be used as a marker to distinguish from the other four citrus varieties. Furthermore, the total flavonoids content of the peels from DHP was higher than all the other samples and 26 down-regulated differential metabolites displayed important biological activities in DHP. Hence, the peels from DHP have considerable potential for development and utilization in the future, such as citrus peel tea or health food.
Supplementary Materials
The supplementary materials are available online.
Author Contributions
Investigation, L.C. and H.C.; Methodology, S.C.; Writing-original draft, F.W.; Writing-review & editing, Y.L.
Funding
This study was supported by the National Natural Science Foundation of China (8140140928).
Acknowledgments
We thank LetPub (www.letpub.com) for its linguistic assistance during the preparation of this manuscript.
Conflicts of Interest
The authors declare no conflict of interest.
References
- Yu, X.; Zhang, Y.; Wang, D.; Jiang, L.; Xu, X. Identification of Three Kinds of Citri Reticulatae Pericarpium Based on Deoxyribonucleic Acid Barcoding and High-performance Liquid Chromatography-diode Array Detection-electrospray Ionization/Mass Spectrometry/Mass Spectrometry Combined with Chemometric Analysis. Pharmacogn. Mag. 2018, 14, 64–69. [Google Scholar] [PubMed]
- Li, Z.-Q.; Zhao, Z.-Y.; Zhou, Z.-Q. Simultaneous Separation and Purification of Five Polymethoxylated Flavones from “Dahongpao” Tangerine (Citrus tangerina Tanaka) Using Macroporous Adsorptive Resins Combined with Prep-HPLC. Molecules 2018, 23, 2660. [Google Scholar] [CrossRef] [PubMed]
- You, Y.-Y.; Li, C.; Zhang, D.; Zhang, J.; Liu, Z. Comparisons of Flavonoids Contents in Pericarpium Citri Reticulatae of Different Varieties. Food Sci. 2013, 34, 212–216. [Google Scholar]
- Luo, Y.; Zeng, W.; Huang, K.-E.; Li, D.-X.; Chen, W.; Yu, X.-Q.; Ke, X.-H. Discrimination of Citrus reticulata Blanco and Citrus reticulata ‘Chachi’ as well as the Citrus reticulata ‘Chachi’ within different storage years using ultra high performance liquid chromatography quadrupole/time-of-flight mass spectrometry based metabolomics approach. J. Pharm. Biomed. Anal. 2019, 171, 218–231. [Google Scholar] [PubMed]
- Hossain, M.K.; Dayem, A.A.; Han, J.; Yin, Y.; Kim, K.; Saha, S.K.; Yang, G.-M.; Choi, H.Y.; Cho, S.-G. Molecular Mechanisms of the Anti-Obesity and Anti-Diabetic Properties of Flavonoids. Int. J. Mol. Sci. 2016, 17, 569. [Google Scholar] [CrossRef] [PubMed]
- Tejada, S.; Pinya, S.; Martorell, M.; Capó, X.; Tur, J.A.; Pons, A.; Sureda, A. Potential Anti-inflammatory Effects of Hesperidin from the Genus Citrus. Curr. Med. Chem. 2018, 25, 4929–4945. [Google Scholar] [CrossRef] [PubMed]
- Ikarashi, N.; Toda, T.; Hatakeyama, Y.; Kusunoki, Y.; Kon, R.; Mizukami, N.; Kaneko, M.; Ogawa, S.; Sugiyama, K. Anti-Hypertensive Effects of Acacia Polyphenol in Spontaneously Hypertensive Rats. Int. J. Mol. Sci. 2018, 19, 700. [Google Scholar] [CrossRef]
- Green, C.-O.; Wheatley, A.-O.; Osagie, A.-U.; Zhang, M.; Morrison, E.Y.S.A.; Asemota, H.-N. Determination of polymethoxylated flavones in peels of selected Jamaican and Mexican citrus (Citrus spp.) cultivars by high-performance liquid chromatography. Biomed. Chromatogr. 2007, 21, 48–54. [Google Scholar] [CrossRef] [PubMed]
- Zhang, M.; Duan, C.; Zang, Y.; Huang, Z.; Liu, G. The flavonoid composition of flavedo and juice from the pummelo cultivar (Citrus grandis (L.) Osbeck) and the grapefruit cultivar (Citrus paradisi) from China. Food Chem. 2011, 129, 1530–1536. [Google Scholar] [CrossRef]
- Zhao, X.-J.; Xing, T.-T.; Li, Y.-F.; Jiao, B.-N.; Jiang, D. Efficient analysis of phytochemical constituents in the peel of Chinese wild Citrus Mangshanju (Citrus reticulata Blanco) by UHPLC-Q-TOF-MS. J. Sep. Sci. 2018, 41, 1947–1959. [Google Scholar] [CrossRef]
- Wen, W.; Li, D.; Li, X.; Gao, Y.; Li, W.; Li, H.; Liu, J.; Liu, H.; Chen, W.; Luo, J.; et al. Metabolome-based genome-wide association study of maize kernel leads to novel biochemical insights. Nat. Commun. 2014, 5, 3438. [Google Scholar] [CrossRef] [PubMed] [Green Version]
- Chen, W.; Gao, Y.; Xie, W.; Gong, L.; Lu, K.; Wang, W.; Li, Y.; Liu, X.; Zhang, H.; Dong, H.; et al. Genome-wide association analyses provide genetic and biochemical insights into natural variation in rice metabolism. Nat. Genet. 2014, 46, 714–721. [Google Scholar] [CrossRef] [PubMed]
- Chen, W.; Gong, L.; Guo, Z.; Wang, W.; Zhang, H.; Liu, X.; Yu, S.; Xiong, L.; Luo, J. A Novel Integrated Method for Large-Scale Detection, Identification, and Quantification of Widely Targeted Metabolites: Application in the Study of Rice Metabolomics. Mol. Plant 2013, 6, 1769–1780. [Google Scholar] [CrossRef] [PubMed] [Green Version]
- Dong, X.; Chen, W.; Wang, W.; Zhang, H.; Liu, X.; Luo, J. Comprehensive profiling and natural variation of flavonoids in rice. J. Integr. Plant Boil. 2014, 56, 876–886. [Google Scholar] [CrossRef] [PubMed]
- Xiong, C.; Luo, D.; Lin, A.; Zhang, C.; Shan, L.; He, P.; Li, B.; Zhang, Q.; Hua, B.; Yuan, Z.; et al. A tomato B-box protein SlBBX20 modulates carotenoid biosynthesis by directly activating PHYTOENE SYNTHASE1, and is targeted for 26S proteasome-mediated degradation. New Phytol. 2019, 221, 279–294. [Google Scholar] [CrossRef]
- Cho, K.; Cho, K.-S.; Sohn, H.-B.; Ha, I.J.; Hong, S.-Y.; Lee, H.; Kim, Y.-M.; Nam, M.H. Network analysis of the metabolome and transcriptome reveals novel regulation of potato pigmentation. J. Exp. Bot. 2016, 67, 1519–1533. [Google Scholar] [CrossRef] [PubMed] [Green Version]
- Zhu, G.; Wang, S.; Huang, Z.; Zhang, S.; Liao, Q.; Zhang, C.; Lin, T.; Qin, M.; Peng, M.; Yang, C.; et al. Rewiring of the Fruit Metabolome in Tomato Breeding. Cell 2018, 172, 249–261. [Google Scholar] [CrossRef]
- Paolo, B.; Saverio, O.; Mirko, M.; Matteo, B.; Lara, G.; Azeddine, S.-A. Gene expression and metabolite accumulation during strawberry (Fragaria × ananassa) fruit development and ripening. Planta 2018, 248, 1143–1157. [Google Scholar]
- Dong, T.; Han, R.; Yu, J.; Zhu, M.; Zhang, Y.; Gong, Y.; Li, Z. Anthocyanins accumulation and molecular analysis of correlated genes by metabolome and transcriptome in green and purple asparaguses (Asparagus officinalis, L.). Food Chem. 2019, 271, 18–28. [Google Scholar] [CrossRef]
- Manners, G.D. Citrus Limonoids: Analysis, Bioactivity, and Biomedical Prospects. J. Agric. Food Chem. 2007, 55, 8285–8294. [Google Scholar] [CrossRef]
- Santini, A.; Novellino, E. Nutraceuticals - shedding light on the grey area between pharmaceuticals and food. Expert Rev. Clin. Pharmacol. 2018, 11, 545–547. [Google Scholar] [CrossRef] [PubMed] [Green Version]
- Daliu, P.; Santini, A.; Novellino, E. From pharmaceuticals to nutraceuticals: Bridging disease prevention and management. Expert Rev. Clin. Pharmacol. 2019, 12, 1–7. [Google Scholar] [CrossRef] [PubMed]
- Santini, A.; Novellino, E.; Armini, V.; Ritieni, A. State of the art of Ready-to-Use Therapeutic Food: A tool for nutraceuticals addition to foodstuff. Food Chem. 2013, 140, 843–849. [Google Scholar] [CrossRef] [PubMed]
- Li, L.; Lv, Y.; Xu, L.; Zheng, Q. Quantitative efficacy of soy isoflavones on menopausal hot flashes. Br. J. Clin. Pharmacol. 2015, 79, 593–604. [Google Scholar] [CrossRef] [PubMed] [Green Version]
- Piegholdt, S.; Rimbach, G.; Wagner, A.E. The phytoestrogen prunetin affects body composition and improves fitness and lifespan in male Drosophila melanogaster. FASEB J. 2016, 30, 948–958. [Google Scholar] [CrossRef] [PubMed]
- Han, E.H.; Kim, J.Y.; Jeong, H.G. Effect of biochanin A on the aryl hydrocarbon receptor and cytochrome P450 1A1 in MCF-7 human breast carcinoma cells. Arch. Pharmacal Res. 2006, 29, 570–576. [Google Scholar] [CrossRef]
- Li, H.; Li, Q.; Liu, Z.; Yang, K.; Chen, Z.; Cheng, Q.; Wu, L. The Versatile Effects of Dihydromyricetin in Health. Evid. Based Complement. Alternat. Med. 2017. [Google Scholar] [CrossRef]
- Wei, L.; Sun, X.; Qi, X.; Zhang, Y.; Li, Y.; Xu, Y. Dihydromyricetin Ameliorates Cardiac Ischemia/Reperfusion Injury through Sirt3 Activation. Biomed. Res. Int. 2019. [Google Scholar] [CrossRef]
- Dong, S.; Ji, J.; Hu, L.; Wang, H. Dihydromyricetin alleviates acetaminophen-induced liver injury via the regulation of transformation, lipid homeostasis, cell death and regeneration. Life Sci. 2019, 227, 20–29. [Google Scholar] [CrossRef]
- Fan, L.; Zhao, X.; Tong, Q.; Zhou, X.; Chen, J.; Xiong, W.; Fang, J.; Wang, W.; Shi, C. Interactions of Dihydromyricetin, a Flavonoid from Vine Tea (Ampelopsis grossedentata) with Gut Microbiota. J. Food Sci. 2018, 83, 1444–1453. [Google Scholar] [CrossRef]
- Kedrina-Okutan, O.; Novello, V.; Hoffmann, T.; Hadersdorfer, J.; Occhipinti, A.; Schwab, W.; Ferrandino, A. Constitutive Polyphenols in Blades and Veins of Grapevine ( Vitis vinifera L.) Healthy Leaves. J. Agric. Food Chem. 2018, 66, 10977–10990. [Google Scholar] [CrossRef] [PubMed]
- Xie, S.; Zhao, T.; Meng, J.; Zhang, Z.-W. Reduction of Dihydrokaempferol by Vitis vinfera Dihydroflavonol 4-Reductase to Produce Orange Pelargonidin-Type Anthocyanins. J. Agric. Food Chem. 2018, 66, 3524–3532. [Google Scholar] [CrossRef] [PubMed]
- Silva, S.; Costa, E.-M.; Calhau, C.; Morais, R.-M.; Pintado, M.-E. Anthocyanin extraction from plant tissues: A review. Crit. Rev. Food Sci. Nutr. 2017, 57, 3072–3083. [Google Scholar] [CrossRef] [PubMed]
- Gómez, J.D.; Vital, C.E.; Oliveira, M.G.A.; Ramos, H.J.O. Broad range flavonoid profiling by LC/MS of soybean genotypes contrasting for resistance to Anticarsia gemmatalis (Lepidoptera: Noctuidae). PLoS ONE 2018, 13, e0205010. [Google Scholar] [CrossRef] [PubMed]
- Du, Z.; Sha, X. Demethoxycurcumin inhibited human epithelia ovarian cancer cells’ growth via up-regulating miR-551a. Tumor Boil. 2017, 39, 1010428317694302. [Google Scholar] [CrossRef] [PubMed]
- Wu, G.A.; Terol, J.; Ibañez, V.; López-García, A.; Pérez-Román, E.; Borredá, C.; Domingo, C.; Tadeo, F.R.; Carbonell-Caballero, J.; Alonso, R.; et al. Genomics of the origin and evolution of Citrus. Nature 2018, 554, 311–316. [Google Scholar] [CrossRef] [PubMed] [Green Version]
- Wang, A.; Li, R.; Ren, L.; Gao, X.; Zhang, Y.; Ma, Z.; Ma, D.; Luo, Y. A comparative metabolomics study of flavonoids in sweet potato with different flesh colors (Ipomoea batatas (L.) Lam). Food Chem. 2018, 260, 124–134. [Google Scholar] [CrossRef]
- Wang, S.; Tu, H.; Wan, J.; Chen, W.; Liu, X.; Luo, J.; Xu, J.; Zhang, H. Spatio-temporal distribution and natural variation of metabolites in citrus fruits. Food Chem. 2016, 199, 8–17. [Google Scholar] [CrossRef]
Sample Availability: Samples of the compounds are available from the authors. |
Figure 1.
Total flavonoid contents of all the samples in the experiment. The five-pointed star above the histogram indicates the statistical significance at the level of 0.05 (p < 0.05).
Figure 1.
Total flavonoid contents of all the samples in the experiment. The five-pointed star above the histogram indicates the statistical significance at the level of 0.05 (p < 0.05).

Figure 2.
Differential flavonoid metabolite analysis on the basis of principal component (PCA). (a) PCA score plot; (b) PCA 3D plot.
Figure 2.
Differential flavonoid metabolite analysis on the basis of principal component (PCA). (a) PCA score plot; (b) PCA 3D plot.

Figure 3.
Differential flavonoid metabolite analysis on the basis of orthogonal signal correction and partial least squares-discriminant analysis (OPLS-DA). (a–d) OPLS-DA model plots for the comparison group DHP versus BZH, DHP versus HZY, DHP versus TC, DHP versus YCC, respectively.
Figure 3.
Differential flavonoid metabolite analysis on the basis of orthogonal signal correction and partial least squares-discriminant analysis (OPLS-DA). (a–d) OPLS-DA model plots for the comparison group DHP versus BZH, DHP versus HZY, DHP versus TC, DHP versus YCC, respectively.


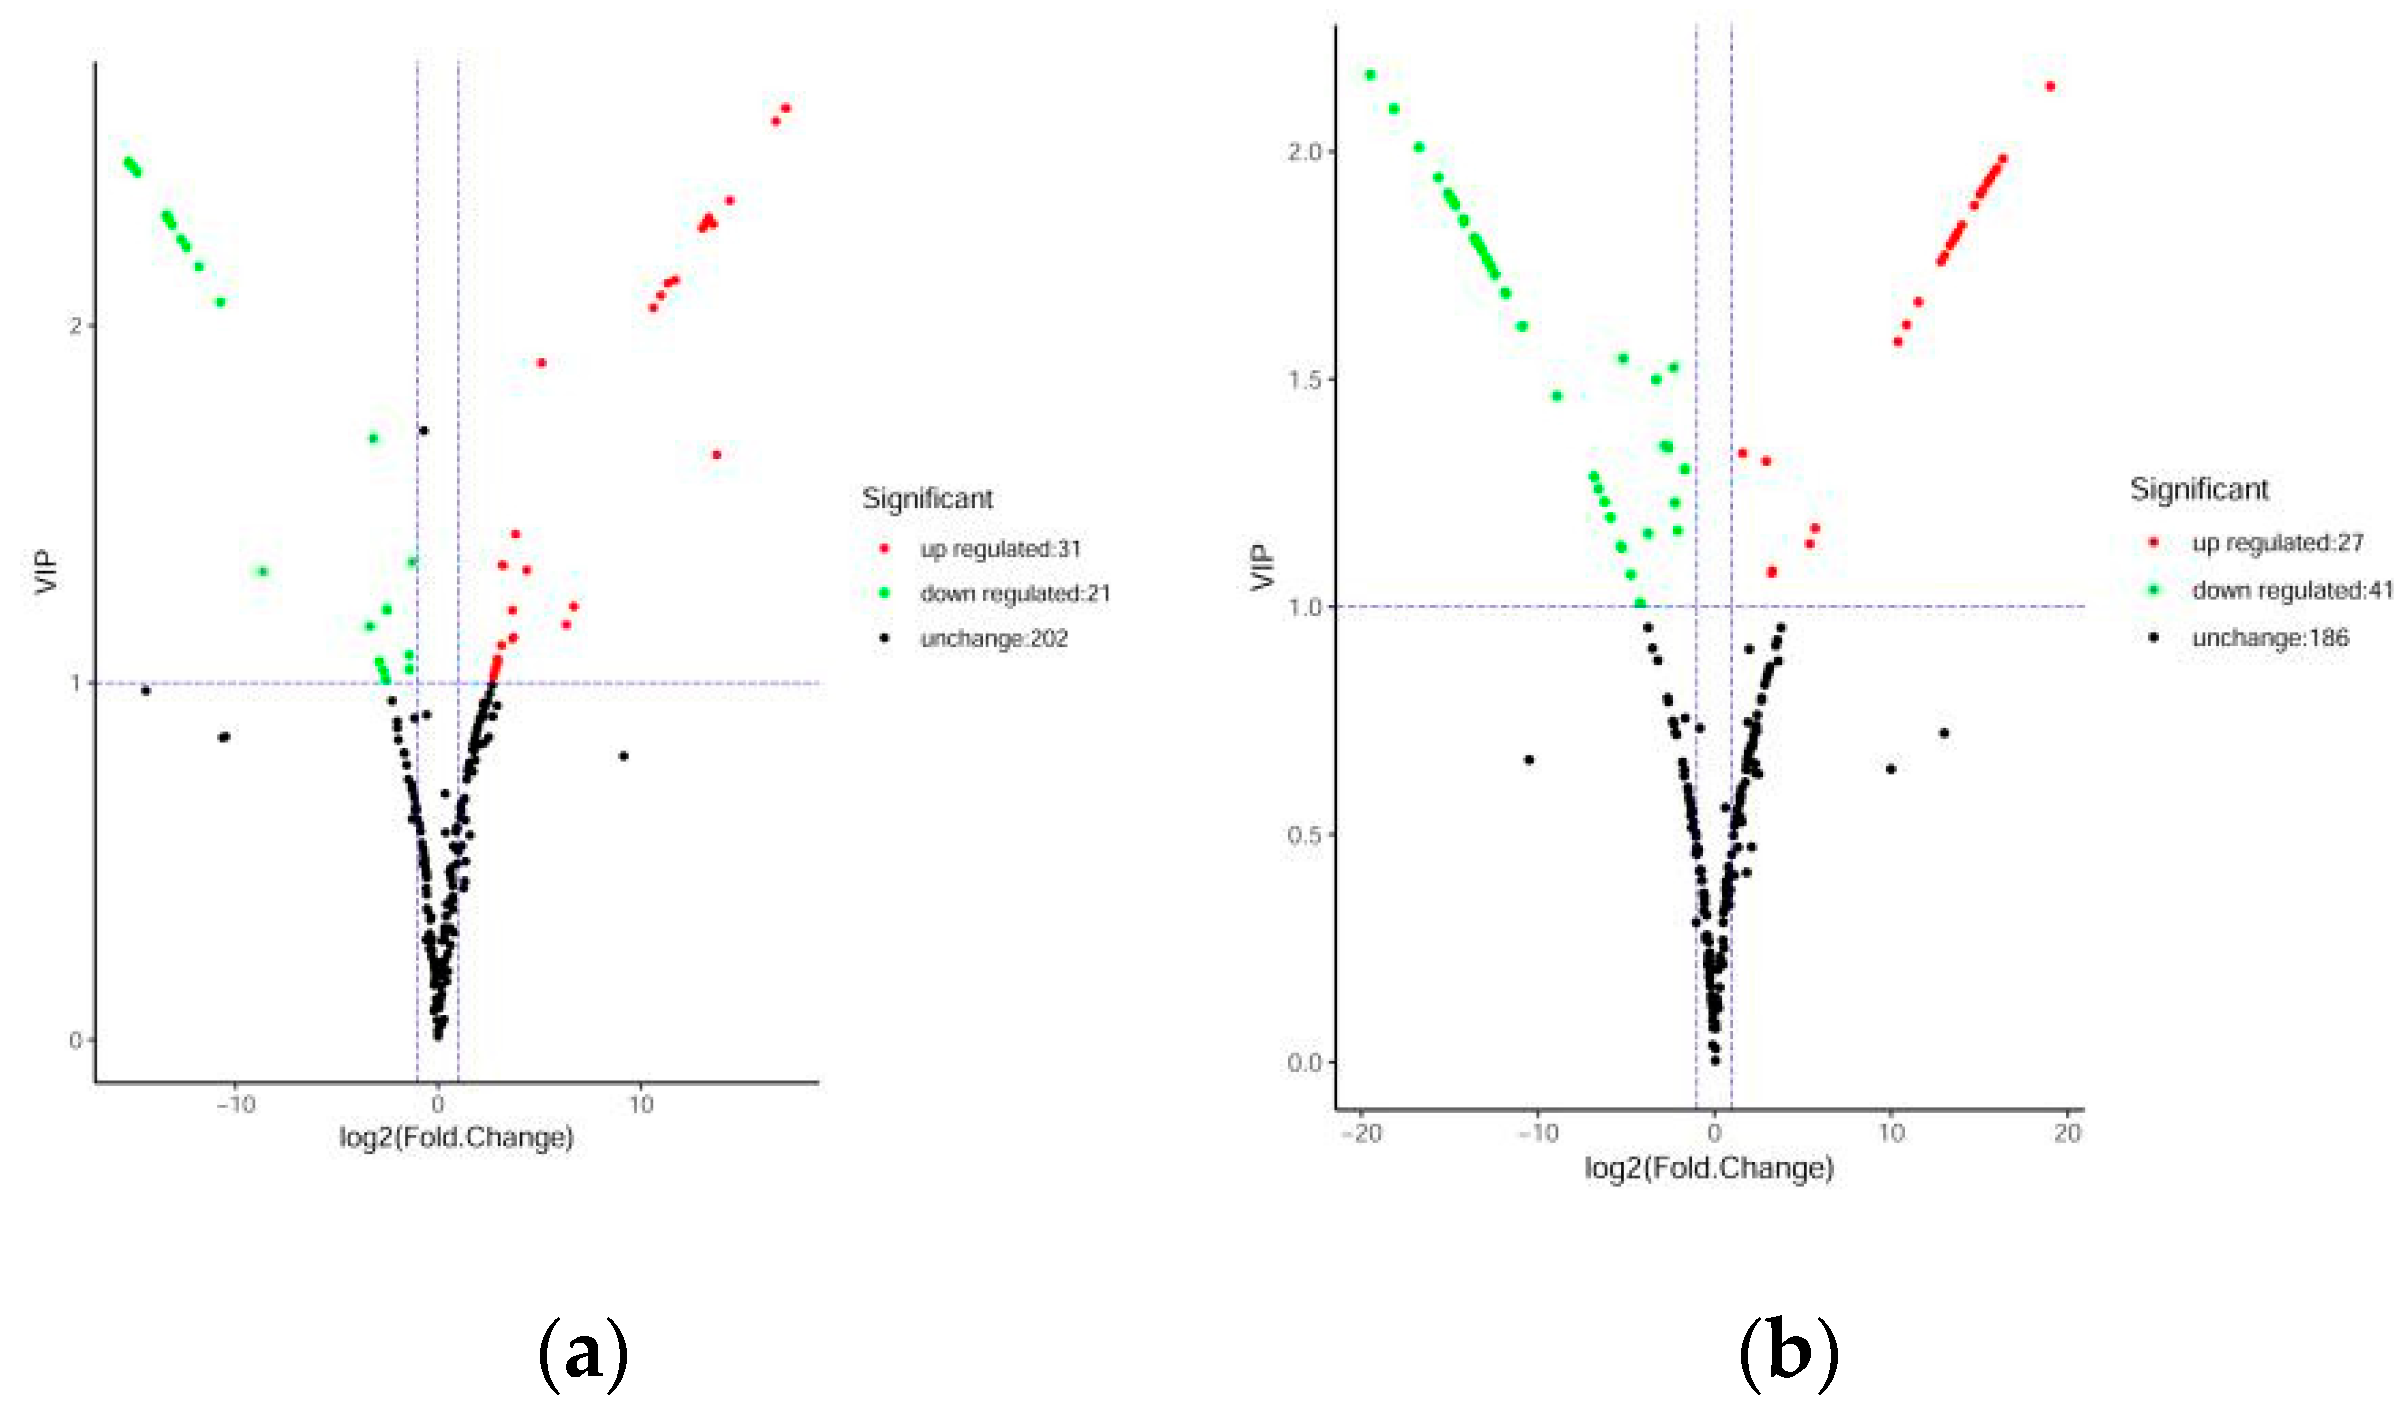
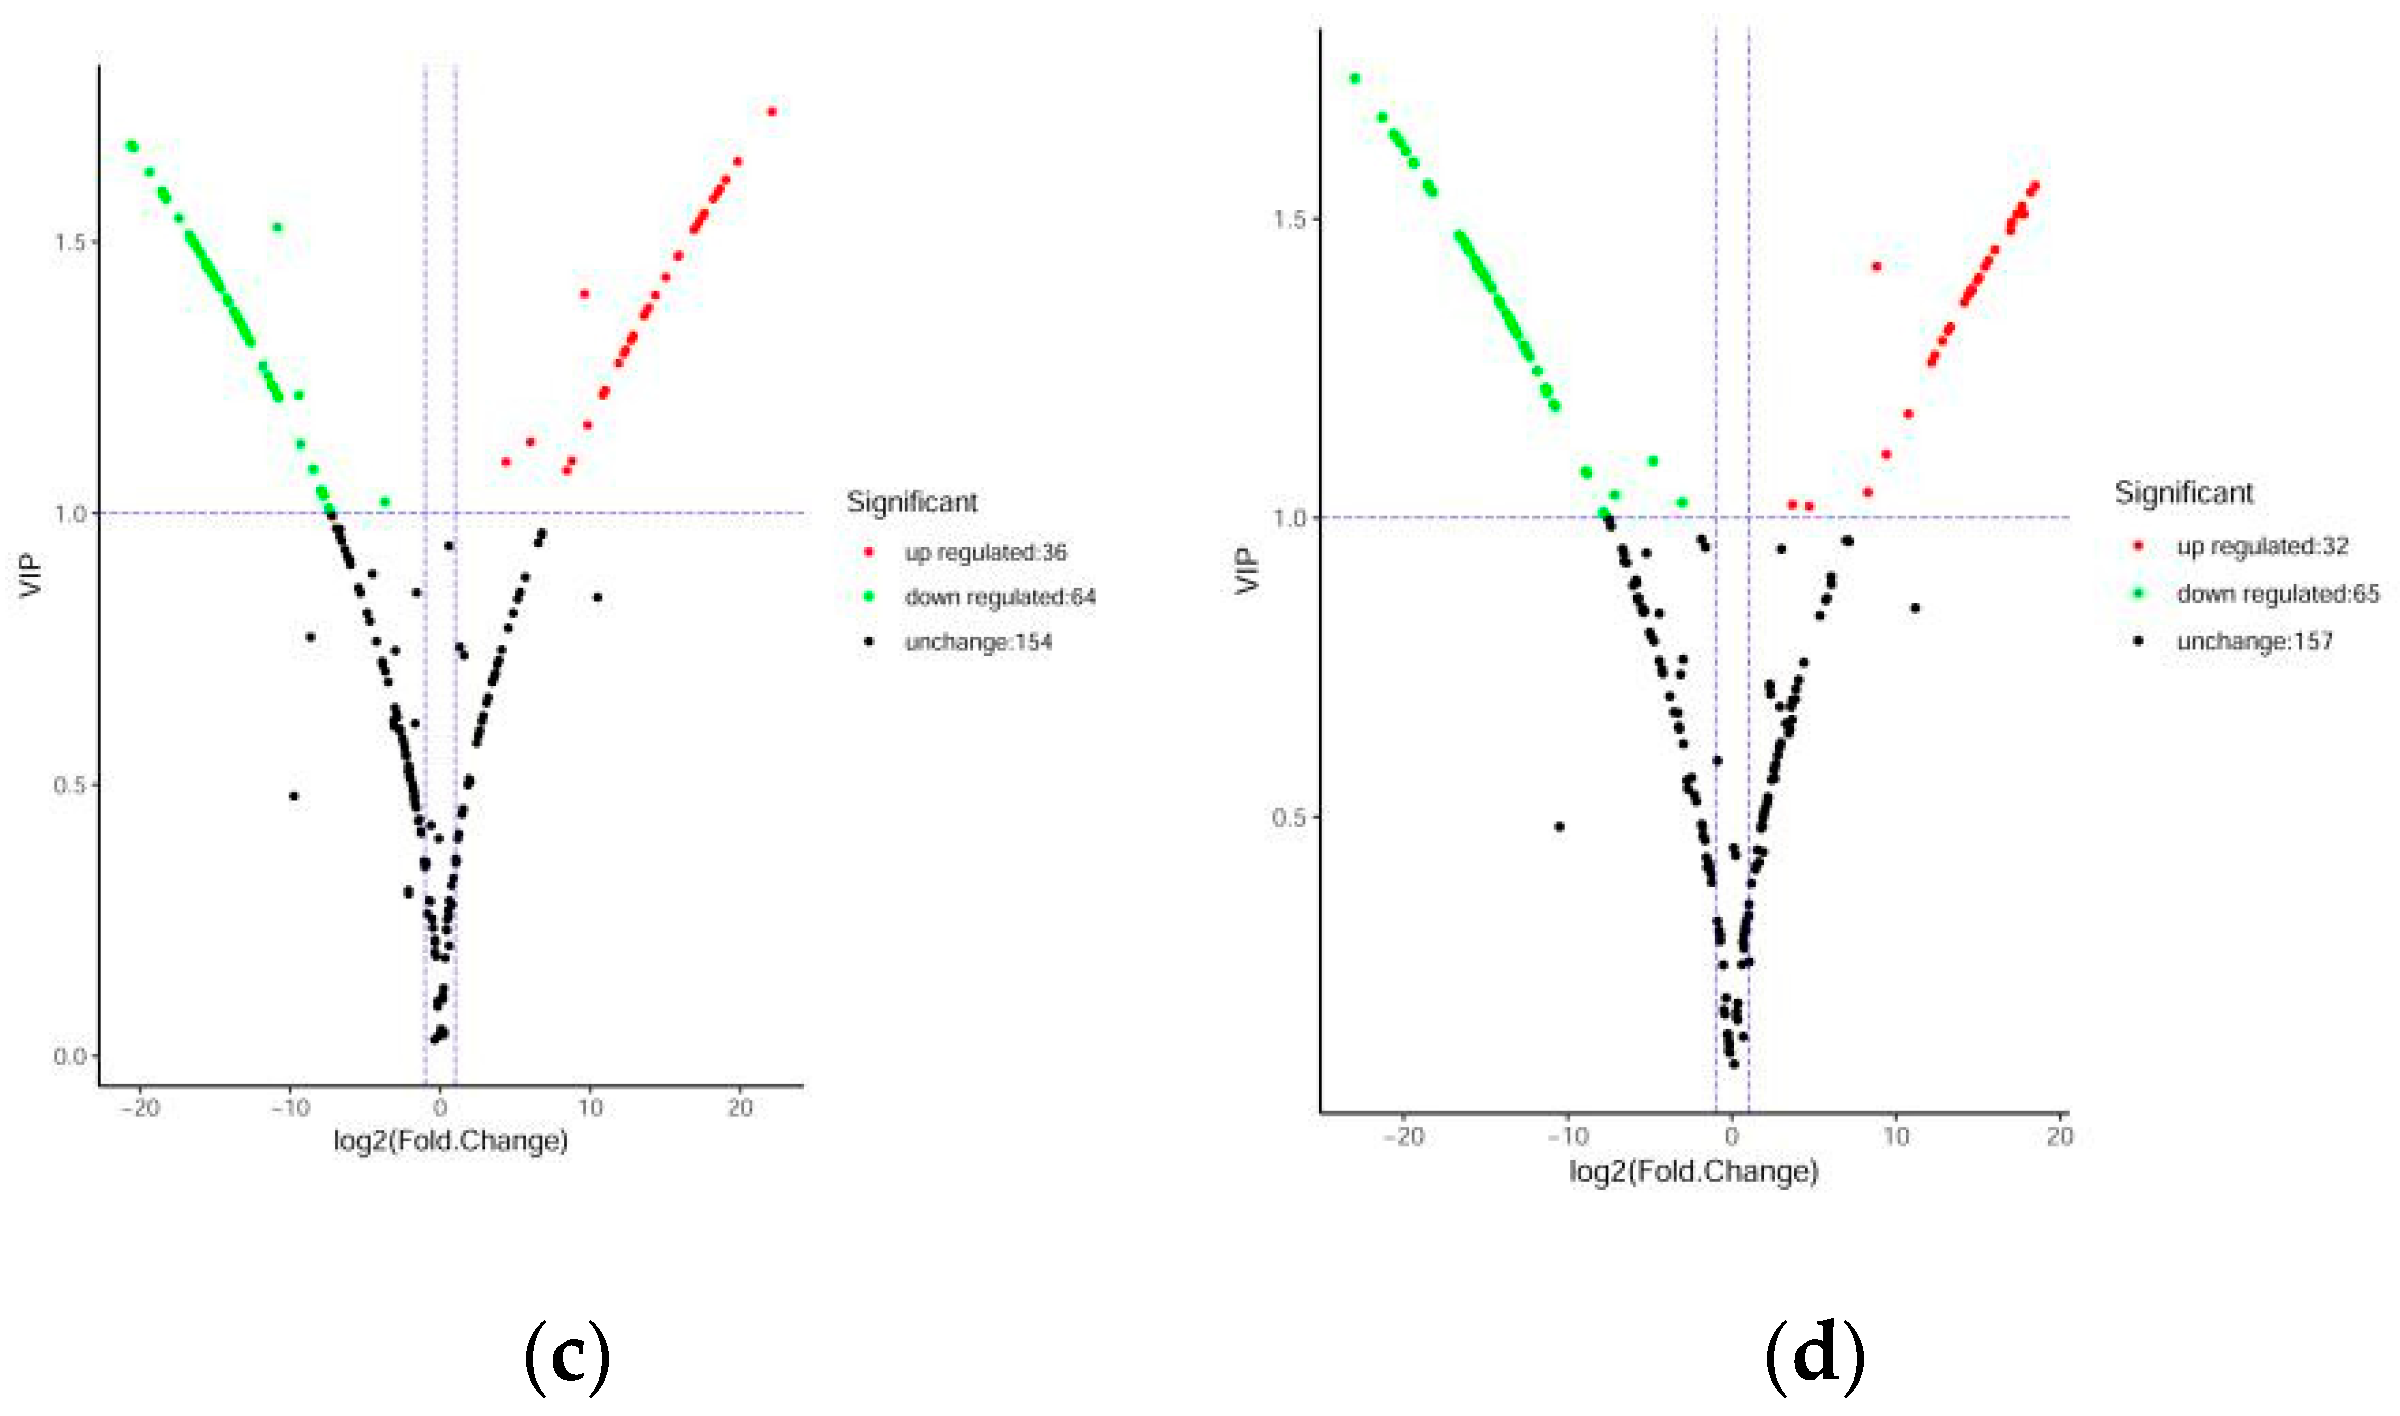
Figure 4.
Volcanic plots of differential metabolites. (a) DHP versus BZH; (b) DHP versus TC; (c) DHP versus HZY; (d) DHP versus YCC. Each point in the volcanic plot represents a metabolite, the abscissa represents the logarithm of the quantitative difference multiples of a metabolite in two samples, and the ordinate represents the variable importance in project (VIP) value. The larger the abscissa absolute value is, the more significant the differential expression is, and the more reliable the screened differential expression metabolites are. The green dots in the figure represent down-regulated differentially expressed metabolites, the red dots represent up-regulated differentially expressed metabolites, and the black dots represent metabolites detected but that are not significantly different.


Figure 5.
Venn diagram of differential flavonoid metabolites for each comparison group and Kyoto Encyclopedia of Genes and Genomes (KEGG) classification results. (a) Venn diagram shows the overlapping and unique differential metabolites amongst the comparison groups; (b) Venn diagram shows the overlapping and unique metabolites amongst the comparison groups; (c)–(f) The differential metabolites KEGG classification of the comparison group DHP versus BZH, DHP versus HZY, DHP versus TC, and DHP versus YCC, respectively.


Table 1.
A list of biologically active down-regulated flavonoid metabolites detected in “Dahongpao” (DHP).
Table 1.
A list of biologically active down-regulated flavonoid metabolites detected in “Dahongpao” (DHP).
| All_ID | Q1 (Da) | Q3 (Da) | Rt (min) | Molecular Weight (Da) | Compounds |
|---|---|---|---|---|---|
| pmb2850 | 329 | 314 | 5.73 | 330 | Tricin |
| pme0372 | 435.1 | 273 | 4.22 | 434.12 | Naringenin 7-O-glucoside (Prunin) |
| pme0379 | 271.1 | 153 | 5.63 | 270.05 | Apigenin |
| pme1399 | 355.2 | 178.5 | 8.4 | 354.15 | Xanthohumol |
| pme1562 | 441.3 | 169 | 3.89 | 442.3 | Epicatechin gallate (ECG) |
| pme2293 | 367.1 | 149 | 7.38 | 368.13 | Curcumin |
| pme2898 | 321.1 | 303 | 3.52 | 320.05 | Dihydromyricetin |
| pme2949 | 609.2 | 301 | 4.08 | 610.19 | Hesperetin 7-rutinoside (Hesperidin) |
| pmf0234 | 563.1 | 443.1 | 3.53 | 564.15 | Isoschaftoside |
| pmf0360 | 449.1 | 151 | 3.97 | 450.12 | Astilbin |
| pmf0381 | 563.1 | 353 | 3.5 | 564.15 | Vicenin-3 |
| pmf0417 | 595.2 | 287 | 3.7 | 596.17 | Eriocitrin |
| pmf0458 | 295.2 | 277 | 7.08 | 294.18 | 6-Gingerol |
| pmf0567 | 299.1 | 211 | 5.72 | 300.06 | Tectorigenin |
| pmf0584 | 437.1 | 275 | 4.37 | 436.14 | Phloridzin |
| pme0330 | 579.2 | 271 | 4.17 | 580.18 | Naringenin 7-O-neohesperidoside (Naringin) |
| pme0369 | 593.2 | 285 | 3.83 | 594.16 | Kaempferol 3-O-rutinoside (Nicotiflorin) |
| pme1541 | 283.1 | 268 | 7.06 | 284.07 | Acacetin |
| pme2977 | 347.3 | 285 | 6.66 | 346.25 | Troxerutin (Trihydroxyethyl rutin) |
| pme3212 | 465 | 303 | 3.87 | 464.1 | Quercetin 3-O-glucoside (Isotrifoliin) |
| pme3250 | 285 | 270 | 7 | 284.07 | Biochanin A |
| pme3292 | 283 | 268 | 6.97 | 284.07 | Prunetin |
| pmf0005 | 579.2 | 271 | 4.05 | 580.53 | Narirutin |
| pmf0208 | 465.1 | 303 | 3.9 | 464.1 | Isoquercitroside |
| pmf0236 | 563.1 | 241.2 | 4.68 | 564.13 | Theaflavin |
| pmf0549 | 607.2 | 299 | 4.14 | 608.17 | Diosmin |
© 2019 by the authors. Licensee MDPI, Basel, Switzerland. This article is an open access article distributed under the terms and conditions of the Creative Commons Attribution (CC BY) license (http://creativecommons.org/licenses/by/4.0/).
Share and Cite
MDPI and ACS Style
Wang, F.; Chen, L.; Chen, H.; Chen, S.; Liu, Y. Analysis of Flavonoid Metabolites in Citrus Peels (Citrus reticulata “Dahongpao”) Using UPLC-ESI-MS/MS. Molecules 2019, 24, 2680. https://doi.org/10.3390/molecules24152680
AMA Style
Wang F, Chen L, Chen H, Chen S, Liu Y. Analysis of Flavonoid Metabolites in Citrus Peels (Citrus reticulata “Dahongpao”) Using UPLC-ESI-MS/MS. Molecules. 2019; 24(15):2680. https://doi.org/10.3390/molecules24152680
Chicago/Turabian StyleWang, Fu, Lin Chen, Hongping Chen, Shiwei Chen, and Youping Liu. 2019. "Analysis of Flavonoid Metabolites in Citrus Peels (Citrus reticulata “Dahongpao”) Using UPLC-ESI-MS/MS" Molecules 24, no. 15: 2680. https://doi.org/10.3390/molecules24152680