
Protolysis and Complex Formation of Organophosphorus Compounds—Characterization by NMR-Controlled Titrations

Institute of Inorganic Chemistry and Structural Chemistry, Heinrich-Heine-University Düsseldorf, Universitätsstraße 1, D-40225 Düsseldorf, Germany
Molecules 2019, 24(18), 3238; https://doi.org/10.3390/molecules24183238
Submission received: 6 May 2019
/
Revised: 26 August 2019
/
Accepted: 2 September 2019
/
Published: 5 September 2019
(This article belongs to the Special Issue Organophosphorus Chemistry 2018)
Abstract
:Phosphonic acids, aminophosphonic acids, and phosphonocarboxylic acids are characterized by an advanced hyphenated technique, combining potentiometric titration with NMR spectroscopy. Automated measurements involving 13C, 19F and 31P nuclei lead to “pseudo 2D NMR” spectra, where chemical shifts or coupling constants are correlated with analytical parameters. Dissociation constants, stability constants, dynamic and specific chemical shifts are determined. Macroscopic and microscopic dissociation equilibria are discussed.

1. Introduction
NMR-controlled titration, also known as NMR titration, a useful tool combining NMR and analytical aspects, is based on fundamental observations in the dawn of NMR spectroscopy: “Early phosphorus NMR studies of condensed phosphates showed that raising the acidity of phosphate solutions increased the shielding of the phosphorus nucleus, causing a shift of the 31P resonances to higher fields by several ppm” [1]. “Later studies on the short chain condensed phosphates exhibited that the pH variations of the chemical shifts and spin-coupling constants where, when measured to sufficient precision, sensitive functions of the molecular structure and the bonding”. A first titration curve of H3PO4 shown as δP vs. pH was derived in this paper [2]. 13C-NMR measurements on linear aliphatic acids revealed that COOH groups in CnH2n+1COOH (n = 0 to 4) exhibit higher chemical shifts δC than COO− groups of corresponding anions CnH2n+1COO−. A characteristic downfield shift of δC ranging from 5.1 to 4.7 ppm was observed for deprotonation by addition of tetramethylammonium hydroxide to carboxylic acids [3].
In subsequent years, those phenomena attracted the attention of numerous studies dealing with inorganic and organic phosphorus chemistry. A higher level of sophistication was achieved by combining the analytical theory of protolysis and complex formation for acids and bases with advanced NMR technologies and expanding the range of sensor nuclei to 1H, 13C, 15N, 19F, 31P and spin active metal nuclei.
The first NMR titration curves for phosphonoacetic acid HOOC-CH2-PO3H2 using 13C and 31P NMR were reported as δC vs. pH and δP vs. pH functions. For the first time, a characteristic deprotonation sequence was established: HOOC-CH2-PO3H2 → HOOC-CH2-PO3H− → −OOC-CH2-PO3H− → −OOC-CH2-PO32−. In addition, 1JPC was related to the s-electron density around the central C-atom [4].
Several decades of creative work followed those early observations. Induced by synthetic, analytical, biological, or technical aspects, interests were concentrated on several classes of organophosphorus compounds. Particular attention was drawn towards analogues of amino acids, e.g., aminophosphonic acids and strong complexing agents like NTMP (N(CH2PO3H2)3) and EDTMP ((H2O3PCH2)2NCH2CH2N(CH2PO3H2)2), which are phospha analogues of the classical complexones NTA (N(CH2COOH)3) and EDTA ((HOOCCH2)2NCH2CH2N(CH2COOH)2). Dissociation constants, stability constants for protonation and metal complex formation were studied as quoted with a few selected key papers [5,6,7,8,9,10,11,12,13,14,15,16].
Further interests concentrated on phospha analogues of carboxylic acids, e.g., phosphonocarboxylic acids and geminal bisphosphonic acids. 31P- and 13C-NMR spectra of cyclohexyl- and phenylphosphonic acid showed that chemical shifts δP and δC including coupling constants nJPC (n = 1–4) of cyclohexanephosphonic acid and benzenephosphonic acid proved to be pH-dependent [17].
A key paper in understanding the NMR titration of geminal bisphosphonate structures described three asymmetric esters of chlodronic acid (HO)2(O)P-CCl2-P(O)(OiPr)OH, (HO)2(O)P-CCl2-P(O)(OiPr)2, and HO(iPrO)(O)P-CCl2-P(O)(OiPr)2. Proton coupled 31P-NMR titration spectra revealed the coupling constants 2JPP in a range between 15.6 and 17.9 Hz. This significant parameter is not accessible for the symmetric ester HO(iPrO)(O)P-CCl2-P(O)(OiPr)OH since this compound gives rise to a dynamic deceptively simple spectrum ranging from singlet to triplet as a result of the parent symmetric [AM6X]2 spin system [18]. 31P-NMR measurements at 202.5 MHz showed that the chemical shift δP of CH3C(OH)[P(O)(OH)2]2 (HEDP) is sensitive towards pH and the concentration of [(CH3)4N]+ when [(CH3)4N]Cl was used as an ion buffer [19].
The determination of high pK values (pK > 13) and low pK values (pK < 1) required specific, advanced techniques for NMR titration. Comments on measurements at high and low pH were reported [19,20]. 1H/31P NMR pH indicator series were used to eliminate the glass electrode in NMR spectroscopic pK determinations, leading to “electrodeless titrations” [21]. Comprehensive guidelines for NMR measurements for the determination of high and low pK values were given in a IUPAC Technical Report. Those sophisticated and detailed instructions should be followed for accurate analytical and NMR measurements, data evaluation and subsequent publications [22].
1.1. Developing Technical Setups for Automated NMR Titrations
In general, NMR titrations for various nuclei were performed in single sample techniques, which proved to be rather laborious and time consuming. For practical reasons, the number of data points were limited in those early titration curves. Hence, attempts were made to develop the technology of automated NMR titrations.
An innovative set up was constructed, which permitted the acquisition of spectra from spinning 20 mm NMR tubes, adding a solution of base under efficient mixing while monitoring the pH. This apparatus worked together with the wide-bore magnet of a Bruker CXP-300 spectrometer, yielding approximately 80 titration points within a couple of hours. This technology was successfully used to titrate H3PO4 vs. KOH and provided a smooth NMR titration curve [23].
Further progress for automated NMR titrations inside spinning 10 mm NMR tubes was described and the novel installation applied to monitor the complex formation between Tl(I)+ and Cl− in aqueous solutions. A Bruker CXP-100 spectrometer was used, operating at 51.9 MHz for 205Tl [24].
Very recently, an elegant low-cost construction was developed for a gravity-driven pH adjustment inside a 5 mm NMR tube. No hardware modifications of the NMR spectrometer were requested. This technique was applied to site-specific protein pK measurements [25]. It might be useful for future studies of organophosphorus compounds.
A different route to automated NMR titrations was chosen by the Düsseldorf group. We were intrigued by the technology of 2D NMR spectra and the graphical representation of such spectra by standard spectrometer software. Hence, a hyphenated technique was envisaged, replacing the f2 axis of 2D NMR spectra by analytical parameters.
Bypass constructions were developed in several generations of increasing accuracy. A 10 mm NMR tube was attached to a special homemade insert and used with a Bruker AM 200 SY NMR spectrometer operating at 81 MHz for 31P NMR. This insert acted as bypass to a precision titration equipment. A series of pH dependent 1D NMR spectra were recorded and processed (using standard spectrometer software) to yield instructive “pseudo 2D NMR” spectra (e.g., in analogy to COSY spectra). Chemical shift δP data were correlated with analytical data like pH or the degree of titration τ. The technical setup and two examples are shown in [26]. Phosphaalanine was used as an example where deprotonation and complex formation with Zn2+ cations were observed by titrations vs. tetramethylammonium hydroxide (TMAOH) [26].
This equipment was used to characterize a series of aminomethylphosphine oxides (CH3)3-n(CH2NH2)nPO (n = 1–3), adding n equivalents of HCl and back-titrating vs. NaOH. Ion-specific chemical shifts δP and pK data were obtained for those aminomethylphosphine oxide bases. In addition, technical details of NMR, analytics, software concepts and programs used were described [27].
A brief overview of “31P NMR controlled titrations of Phosphorus-Containing Acids and Bases in Protolysis and Complex Formation” reported about the 81 MHz 31P{1H} NMR titration of phosphonoacetic acid [28]. The hardware and software concepts were shown.
Typical “pseudo 2D NMR” spectra correlating the chemical shift δP vs. the degree of titration τ were obtained for the pair of isomers 1- and 2-aminoethanephosphonic acids CH3-CH(NH2)-PO3H2 and NH2-CH2-CH2-PO3H2 (α-Ala-P and β-Ala-P) and for diphosphaasparaginic acid H2O3P-CH(NH2)-CH2-PO3H2 (Asp-P2). Macroscopic dissociation constants and ion-specific chemical shifts are reported. The p-aminophenylene-substituted phosphonic acid p-NH2-C6H4-PO3H2 was compared [29]. Hardware and software concepts used in NMR titration were demonstrated. A subsequent UV-controlled titration revealed the microscopic dissociation scheme of p-NH2-C6H4-PO3H2. Corresponding deprotonation patterns were discussed [30].
In practice, 13C-NMR titrations in single sample techniques proved to be very time consuming. Hence, it seemed advisable to use the technology described above for automated 50.29 MHz 13C{1H} or 13C-NMR measurements. As practical examples, the pair of isomers 1- and 2-aminoethanephosphonic acids were titrated vs. NaOH. Within this context, CH3-CH(NH2)-PO3H2 and the fluorinated analogue CF3-CH(NH2)-PO3H2 were compared using 31P{1H} and 19F{1H} NMR titrations. Replacing the CH3 by a CF3 group reduces the basicity of the NH2 function, which is reflected in δP vs. τ and in the δF vs. τ correlations [31].
The experimental set up described above requested individual titrations for each nucleus wanted. Hence, multinuclear studies (e.g., 1H and 13C and 31P) demanded high spectrometer times.
At this stage, special probe heads were developed by Bruker for another hyphenated technique combining liquid chromatography with HR NMR. In our laboratory, a Bruker LC probe head LC-TXO-NMR was successfully introduced to a DRX 500 NMR spectrometer and used for advanced NMR titrations. It became routine to run consecutively 31P{1H}, 31P, and 1H-NMR spectra for each titration step, thus saving time, gaining higher sensitivity and reducing the necessary concentrations (and amounts) of titrands. Excellent spectra resulted with a high S/N ratio and high digital resolution in the chemical shift or frequency axis.
In addition, a special 19F-LC probe head was available, combining 19F and 1H-NMR techniques. The high field stability of the supercon magnet allowed measurements in H2O solutions (without D2O), thus avoiding the problems with “mixed” stability and dissociation constants resulting from D2O/H2O mixed solvents.
A comprehensive report about the technical designs of NMR and analytical components, software, data evaluation, error calculations and applications was written in 2002 and incorporated into the Bruker NMR Guide collection, freely accessible for Bruker spectrometer users [32] only. This detailed review is now open for free downloads to all interested readers: (a) https://www.theresonance.com/nmr-controlled-titration-download-the-paper/, (b) https://www.bruker.com/fileadmin/user_upload/8-PDF-Docs/MagneticResonance/NMR/NMR_controlled_titration.pdf.
NMR titrations using 200 MHz and 500 MHz spectrometers were described using geminal bisphosphonic acids, e.g., HEDP and Pamidronic acid, as model systems. The TXO-HPLC probe head improved the signal-to-noise ratio of “pseudo 2D NMR” spectra and reduced the concentration of titrand required by this procedure: The following concentrations for sensor nuclei are recommended: 1H: 0.25–0.01 mol/L, 13C: 0.50–0.005 mol/L, 19F: 0.01–0.005 mol/L, 31P: 0.01–0.001 mol/L, and 113Cd: 0.25–0.1 mol/L. 113Cd NMR was used when studying protolytic and complex formation equilibria of (H2O3P-CH2)2NCH2CH2N(CH2PO3H2)2 (EDTMP).
Within this context, a special computer program MultipleNMRGraphics was developed which is able to generate four characteristic “pseudo 2D NMR” plots, e.g., δP vs. pH or δP vs. τ either as contour or as stacked plots, in black-and-white or color design [33]. Those graphics have a lower storage demand than the previously used “pseudo 2D NMR” spectra generated by the routine Bruker spectrometer software.
Some examples relevant to phosphorous chemistry and organic chemistry dealt with in [32] are listed in Table 1:
A modification of our design for automated NMR titrations shown above was adjusted to the local conditions of a Bruker 250 MHz spectrometer and applied to study the complexation of Zn2+, Cd2+ and Pb2+ with diazacrown ethers substituted by phosphonate groups [34].
Particular attention was drawn towards microscopic dissociation constants going back to early studies on NH2-CH2-CH2-NH-CH2-COOH. 60 MHz and 100 MHz 1H-NMR titrations evaluated the pH dependence of a singlet for the methylene group NH-CH2-COOH, while the ethylene function N-CH2-CH2-N appeared with the spectral character, changing from a deceptively simple singlet towards an AA′BB′ ([AB]2) system. The analytical formalism and microscopic dissociation constants were derived [35]. For deeper reading, an up-to-date and comprehensive survey on the theory and practice of proton microspeciation based on NMR-pH titrations is recommended [36].
As an example, S-2-amino-4-(methylphosphinoyl)butyric acid (S-phosphinothricine, GLUFOSINATE) HOOC-CH(NH2)-CH2-CH2-P(CH3)(O)OH was characterized by 31P{1H}- and 1H-NMR titrations. Microscopic dissociation and intramolecular rotational equilibria were discussed [32,37]. Within this context, a program LAOTIT was developed, which is able to simulate series of pH-dependent second-order NMR spectra. A practical example for AFGMNQ3X spin systems of GLUFOSINATE in a pH range from 1 to 6 was shown in [37].
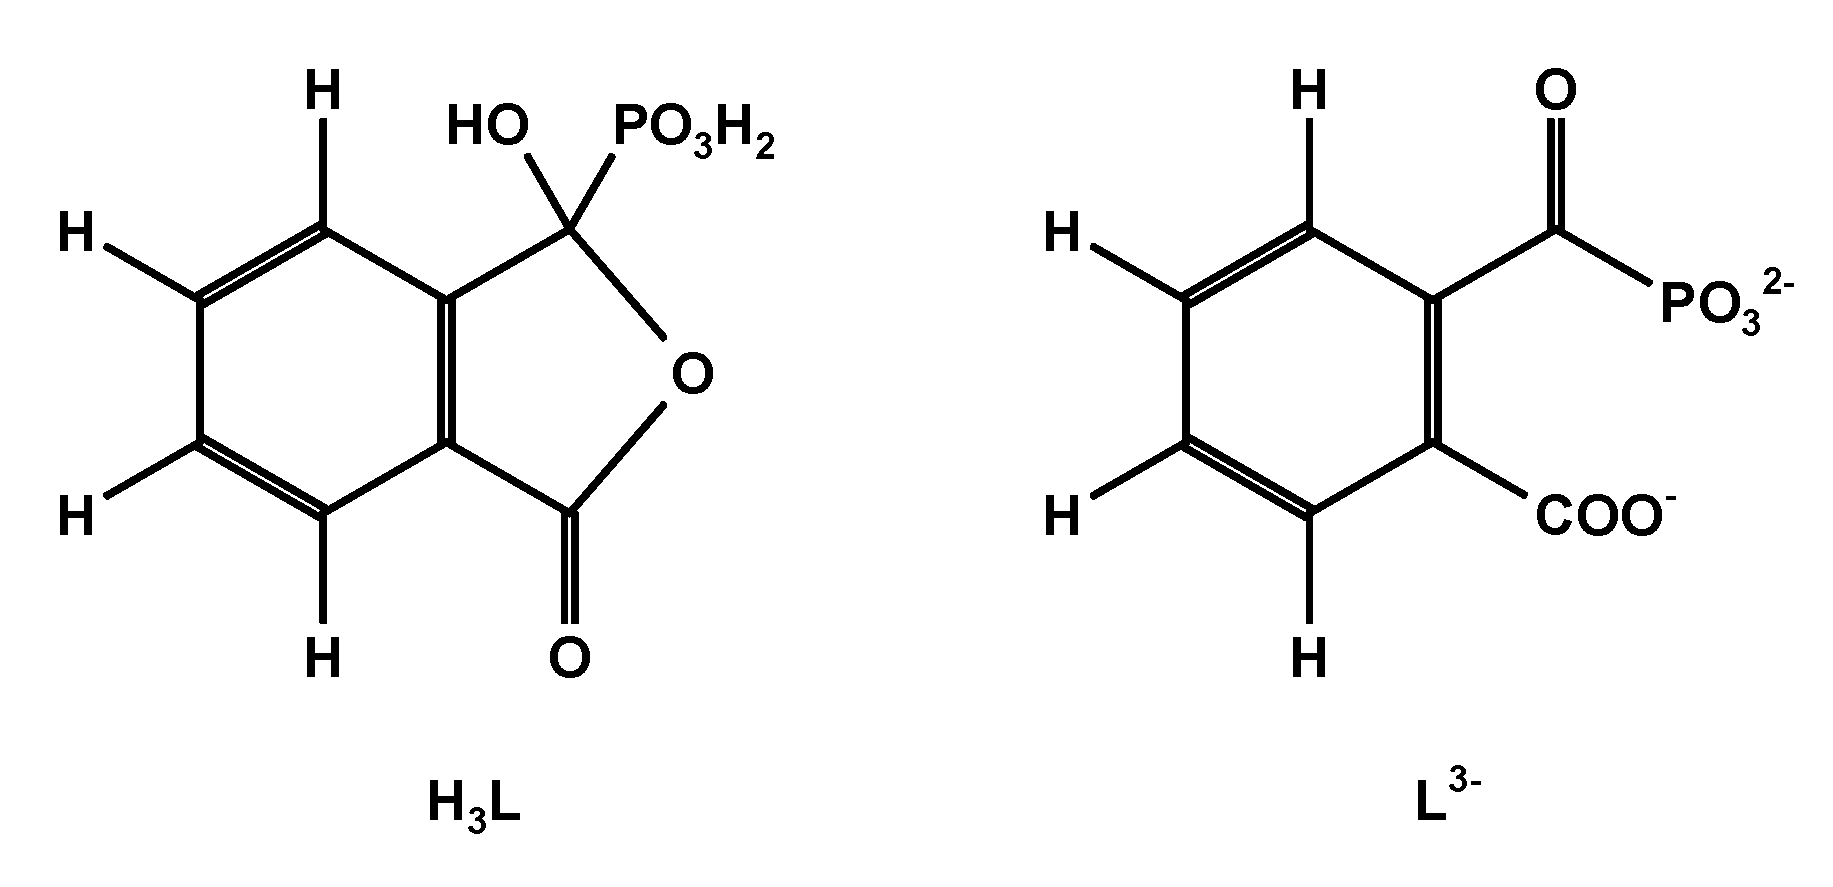
The ring-chain tautomerism and protolytic equilibria of an effectively three-basic 3-hydroxy-3-phosphonoisobenzofuranone was studied by 1H-, 13C{1H}- and 31P{1H}-NMR-controlled titrations. A complex pattern of macroscopic and microscopic deprotonation steps leading from the starting H3L to the final L3− (Scheme 1) was discussed.
The OPIUM program enabled the simultaneous evaluation of potentiometric, 31P{1H}- and 1H-NMR titrations using the four individual 1H signals from the ABCD system [38]. Macroscopic dissociation constants, pK1 = 0.445 ± 0.008, pK2 = 5.792 ± 0.003, pK3 = 6.486 ± 0.002. δH, δC, and δP of H3L (0.2510 mol/L in D2O) and L3− (0.1919 mol/L in 1 mol/L KOD), were determined. For details of the complex equilibrium system, see [39,40].
NMR-controlled titration was successfully used to analyze the mixture of diastereomers from 1-phosphonopropane-1,2,3-tricarboxylic acid, HOOC-CH2-CH(COOH)-CH(COOH)-PO3H2 (PPTC). The genuine product from synthesis consisted of 64% of the RS/SR and 36% of the RR/SS forms. 31P{1H}-NMR-controlled titration revealed two diastereospecific titration curves which were individually identified by additional 1D and 2D NMR studies using 1H, 31P and 13C nuclei. Dissociation constants and ion-specific chemical shifts δP were calculated for the pair of diastereomers [41,42,43]. It seems evident to use automated NMR titration for production control in research and industrial chemistry.
1.2. Some Comments on Macroscopic Protolytic Equilibria—Dissociation and Stability Constants
Organophosphorus compounds studied by potentiometric or NMR-controlled titrations may be described by two numerical indices: a, the number of acidic functions (e.g., P(O)OH, C(O)OH, etc.) and b, the number of basic functions (e.g., NH2, NHR, NR2, etc.). The minimal protonated species corresponds to the n-valent base L−a having a anionic centers and b neutral base centers in (0N)b-R-(O−)a. Total protonation leads to the n-valent acid HnLb+ (n = a + b) having a neutral centers and b cationic acid centers in (+HN)b-R-(OH0)a.
Protonation equilibria of the n-valent base are described by Equation (1):
and by brutto-stability constants following Equation (2):
Stepwise dissociation equilibria of the n-valent acid are described by Equation (3):
while corresponding dissociation constants Ki are given by Equation (4):
Stoichiometric stability constants and stoichiometric dissociation constants are connected by Equations (5) and (6):
This paper will use stoichiometric variables (containing concentrations instead of activities) in abbreviated forms: pKi—macroscopic acid dissociation constant; pki—microscopic acid dissociation constant; pKw—ion product of water. pH stands for the concentration-based pH = −lg(cH). Glass electrodes were calibrated by blank titration. The more complex situation of activities and activity-based parameters exceeds the scope of this paper and hence will not be discussed at this stage.
The molar fractions xi of protolytic species HiLi–a are derived from Equation (7):
Each protolytic species HiLi–a present in the equilibrium contributes specific NMR parameters δ(HiLi–a) in an exchange reaction, which is rapid on the NMR timescale. Effectively, only one signal is observed when monitoring NMR during the course of titrations. A dynamically averaged chemical shift δ follows Equation (8):
A gradient called the deprotonation shift Δi [ppm] is given by Equation (9):
This gradient defines the change of chemical shift for each deprotonation step. Signs and magnitudes of gradients are used to elucidate the deprotonation and protonation pathways of multifunctional acids, bases and ligands as shown in examples below.
As deduced above, the dynamically averaged chemical shift δ is a function of pH. Experimentally, the pH of solutions may be varied by titration with a strong univalent base or a strong univalent acid. While the experiment directly provides the well-known titration curve pH = f(VTitrator), it is more convenient to calculate the inverse function VTitrator = f(pH) with suitable computer programs. Within this paper, a reduced parameter τ, commonly called degree of titration, will be used to describe the status of a titration process. τ is a ratio defined by Equation (10):
The sign of τ is positive if nTitrator corresponds to the molar amount of a strong monovalent base (e.g., NaOH, KOH, TMAOH), but is negative for a strong monovalent acid (HCl, HNO3, HClO4). nTitrand corresponds to the molar amount of a n-basic acid HnL.
2. Results and Discussion
In the following sections, a few examples will be shown for automated NMR-controlled titrations using hardware and software concepts described above. Chemical shifts δC [ppm] quoted below were referenced vs. (CH3)3Si-CH2-CH2-SO3Na, while δP [ppm] was virtually referenced towards external H3PO4. Coupling constants nJXY are given in [Hz].
2.1. Phosphonic Acids
Methanephosphonic acid 1 and phenylphosphonic acid 2 shown in Scheme 2 were chosen from [31,44], which will be presented below:
2.1.1. Methanephosphonic Acid 1
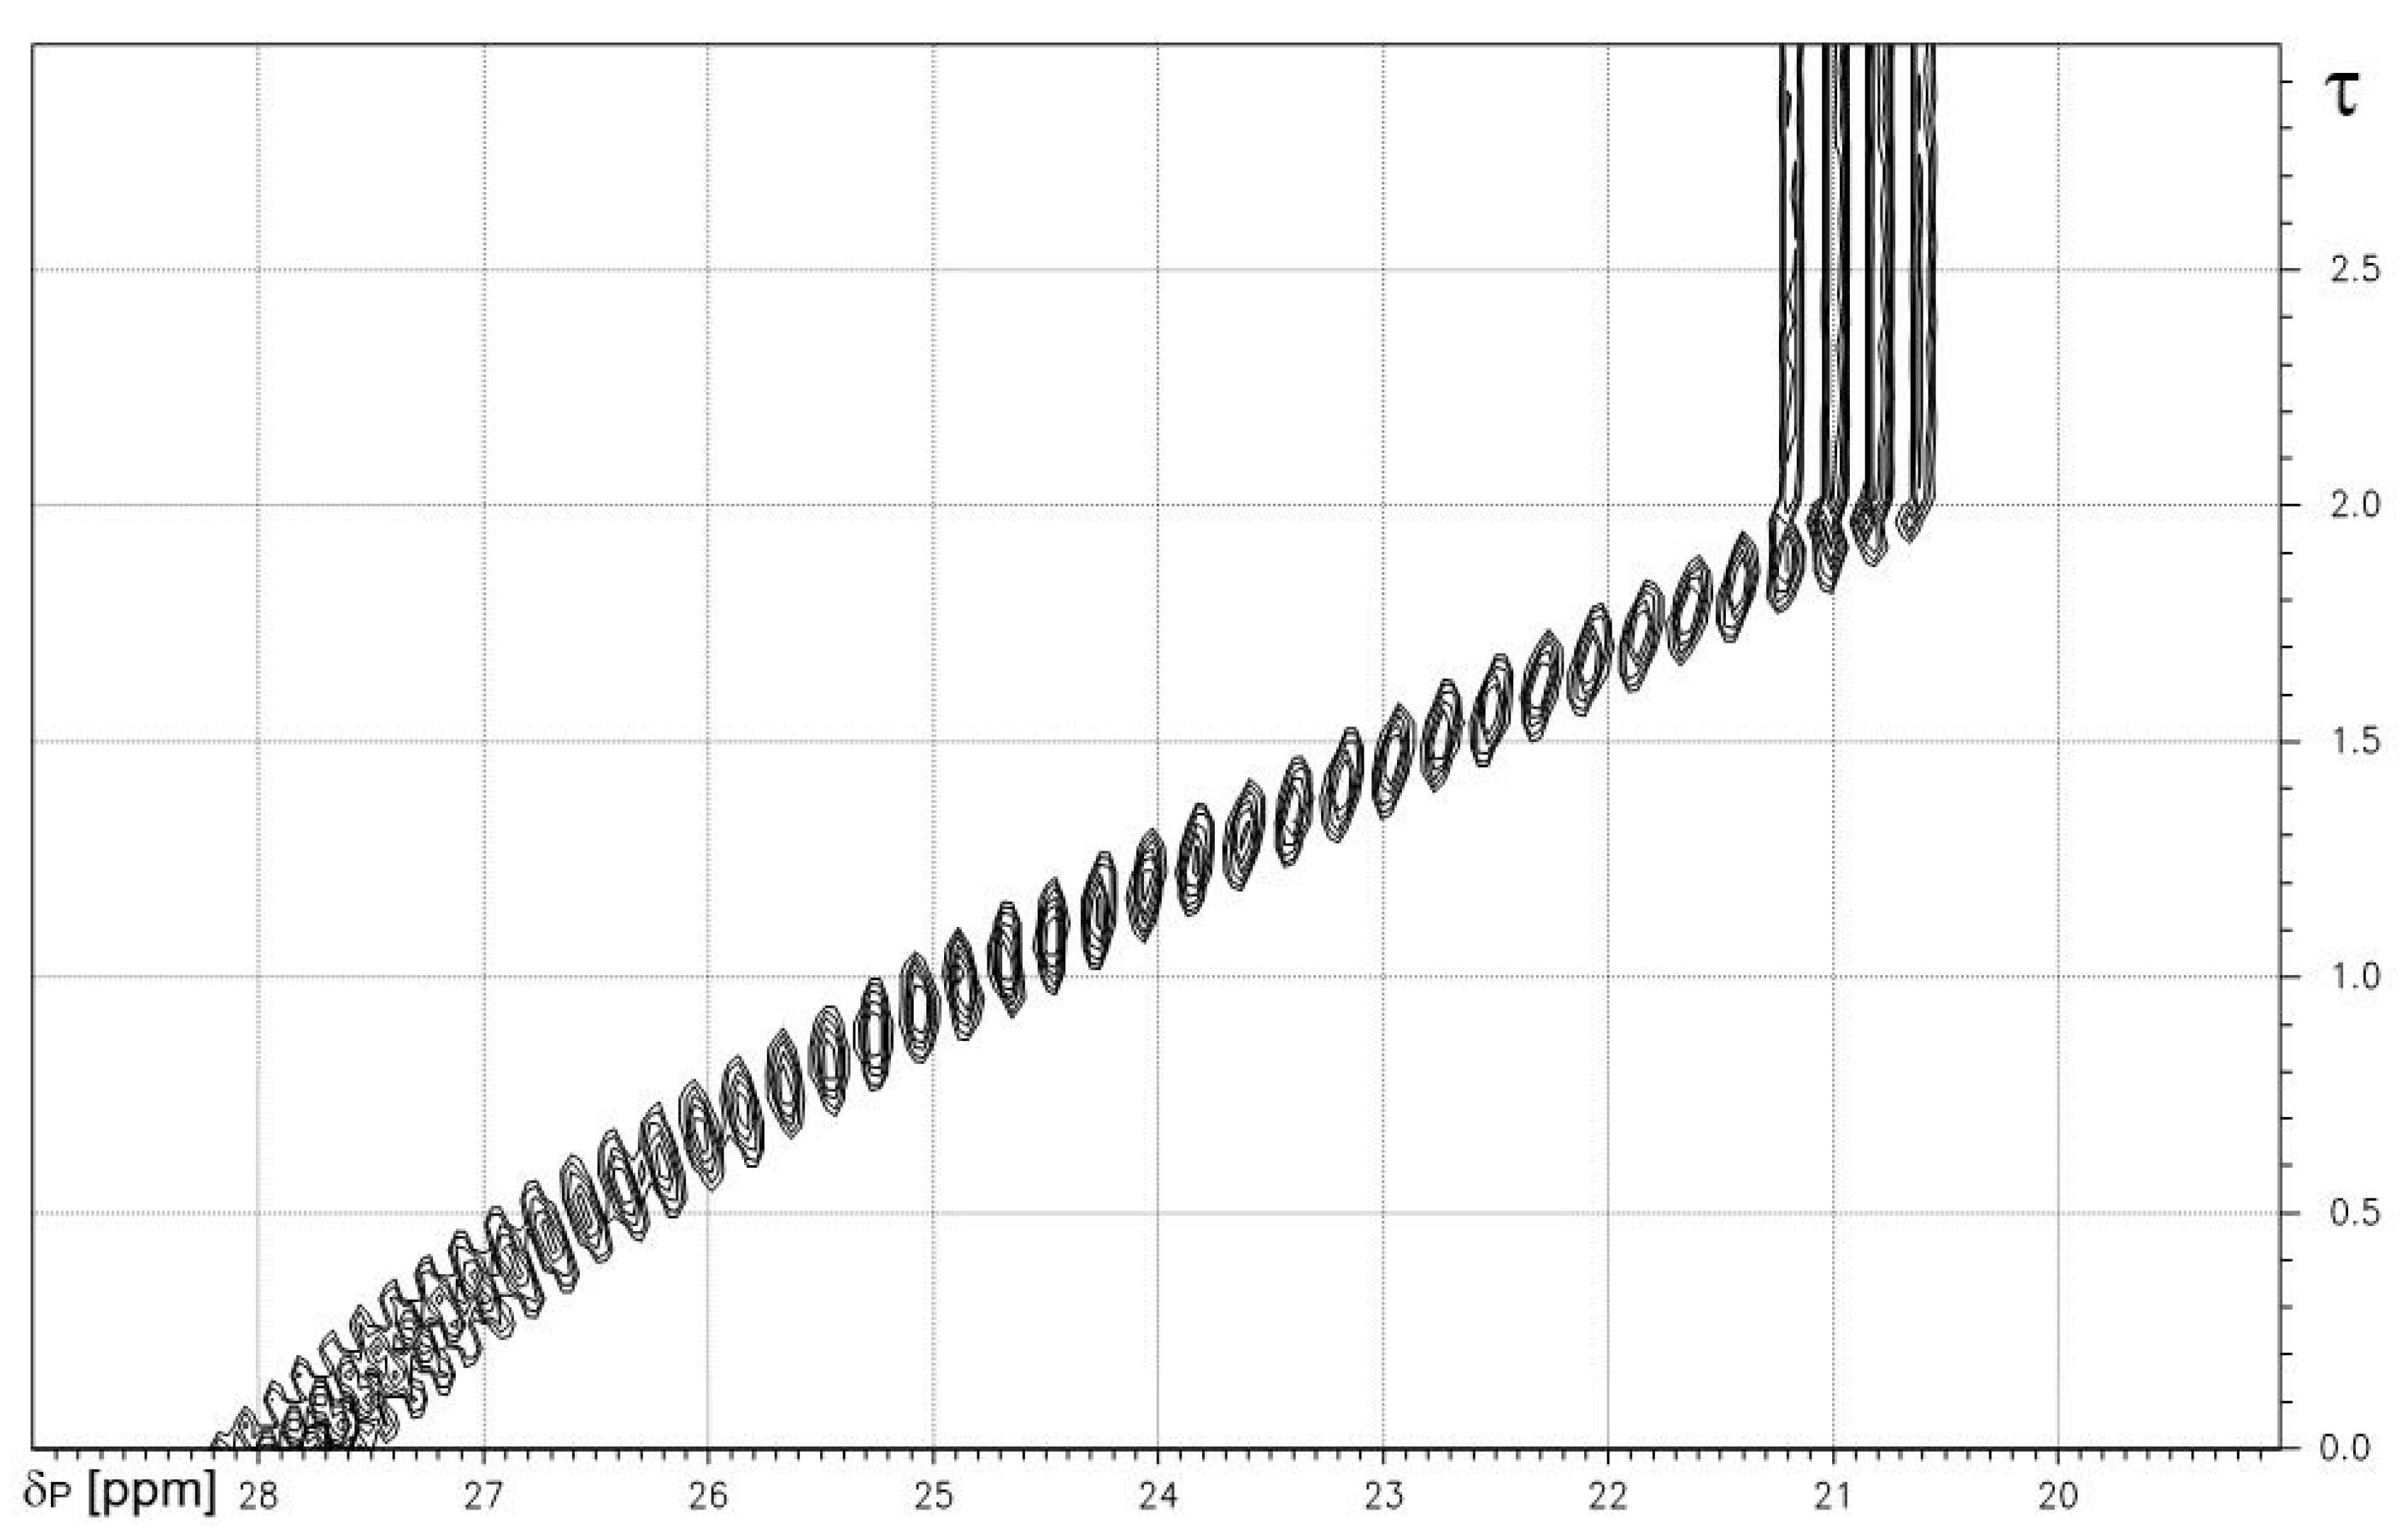
The results from a proton-coupled 31P-NMR-controlled titration of methanephosphonic acid 2 vs. NaOH are shown as a contour plot in Figure 1. A quartet structure from the parent A3X spin system of the P-CH3 fragment is recognized. Numerical results are given in Table 2. The deprotonation of both P-OH functions induces a decrease in chemical shifts δP and a decrease in the absolute values of 2JPH.
pKi values found are consistent with results from potentiometric titrations of CH3P(O)(OH)2 [46].
2.1.2. Phenylphosphonic Acid 2
Chemical shifts δP for protolytic species H2L, HL−, and L2− of phenylphosphonic acid 2 together with dissociation constants pK1 and pK2 are listed in Table 3. The deprotonation of both P-OH groups leads to characteristic high field shifts for δP as indicated by negative gradients Δ1 and Δ2.
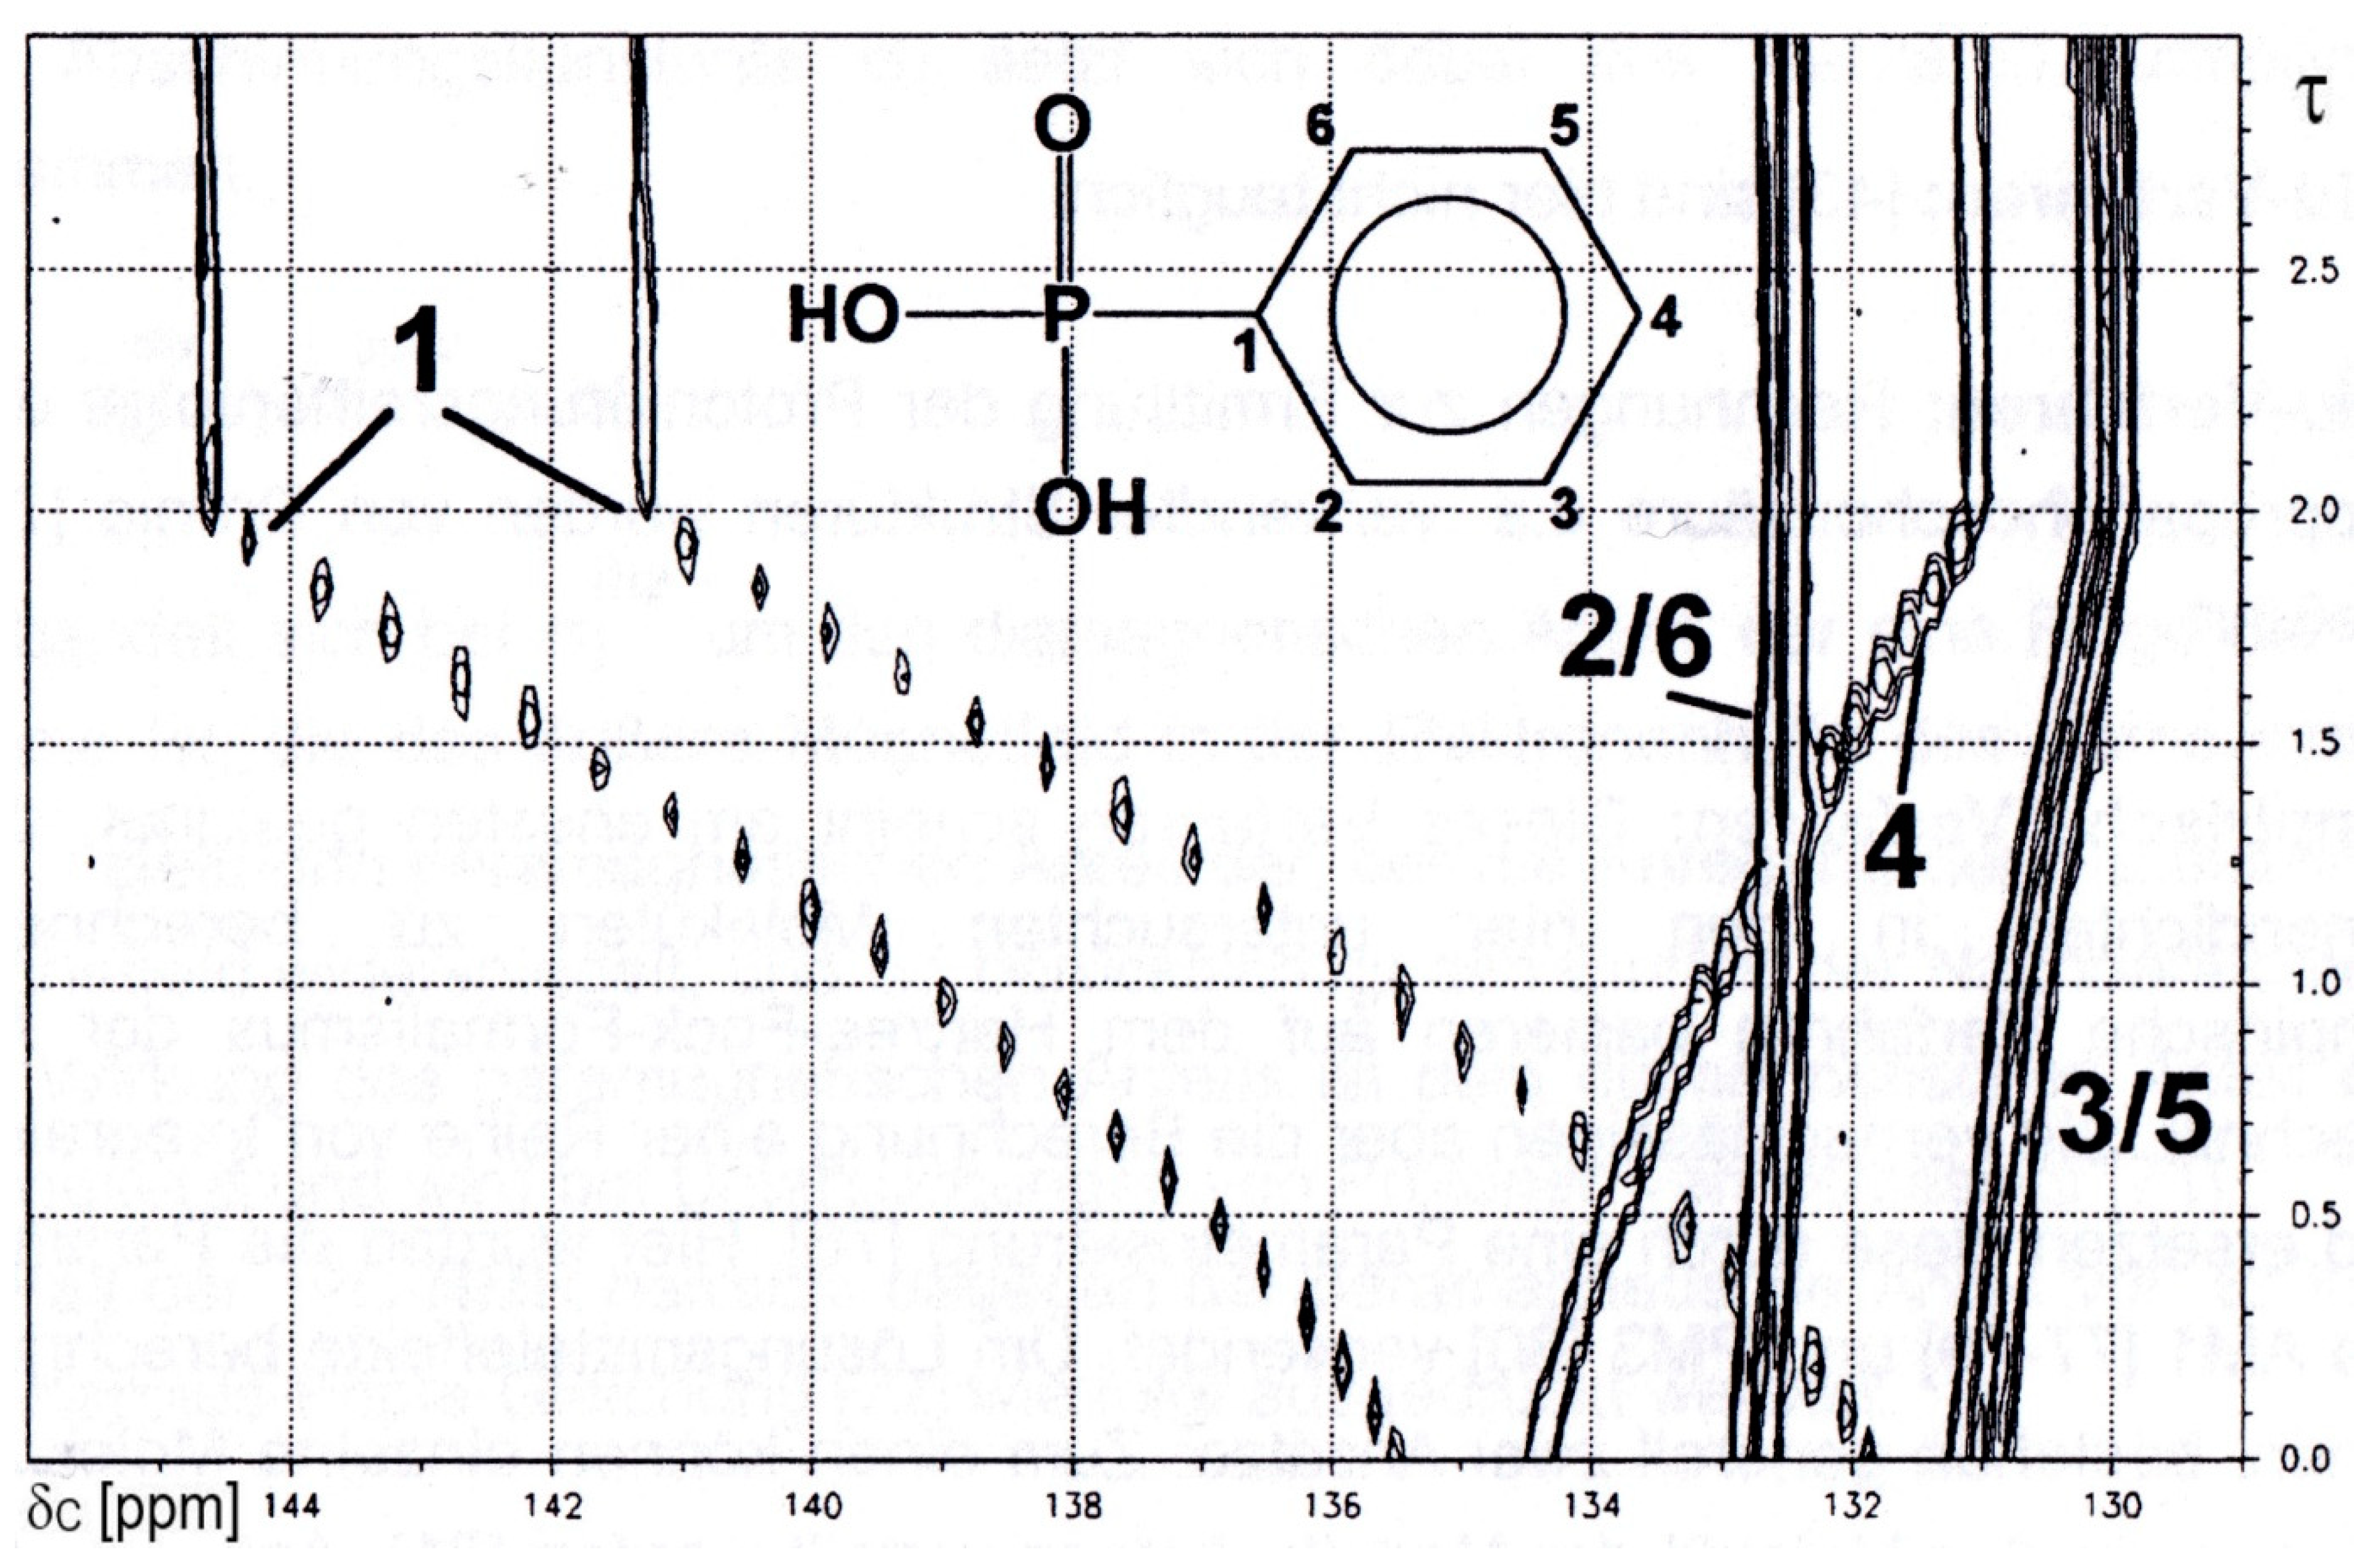
Higher concentrations are required for 13C{1H}-NMR-controlled titrations as shown for the titration of phenylphosphonic acid 2 vs. KOH in Figure 2:
The deprotonation of each of the two P-OH functions led to a strong low field shift for the ipso-C1 carbon. For the remaining carbons high field shifts are observed, an effect decreasing in the order para-C4 > meta-C3/5 > ortho-C2/5.
Semi-empirical calculations with VAMP 4.4 using parameter set AM1 showed that the electron density at C1 increases with deprotonation in the order PhPO3H2 < PhPO3H− < Ph-PO32−, while the electron density of C4 decreases in this order [44,47]. In addition, the deprotonation of P-OH led to a decrease for all nJPC (n = 1 to 4). Particularly indicative is 1JPC from the ipso-carbon C1, which reaches a minimum at total deprotonation. Numerical results for compound 2 are listed in Table 4:
Laborious and time-consuming single sample 31P{1H}- and 13C{1H}-NMR studies on phenylphosphonic acid 2 were performed, where δP, δC, and nJPC data are consistent with findings derived from the automated titrations presented in this paper [17].
2.2. Comparison of Aliphatic and Aromatic Aminophosphonic Acids
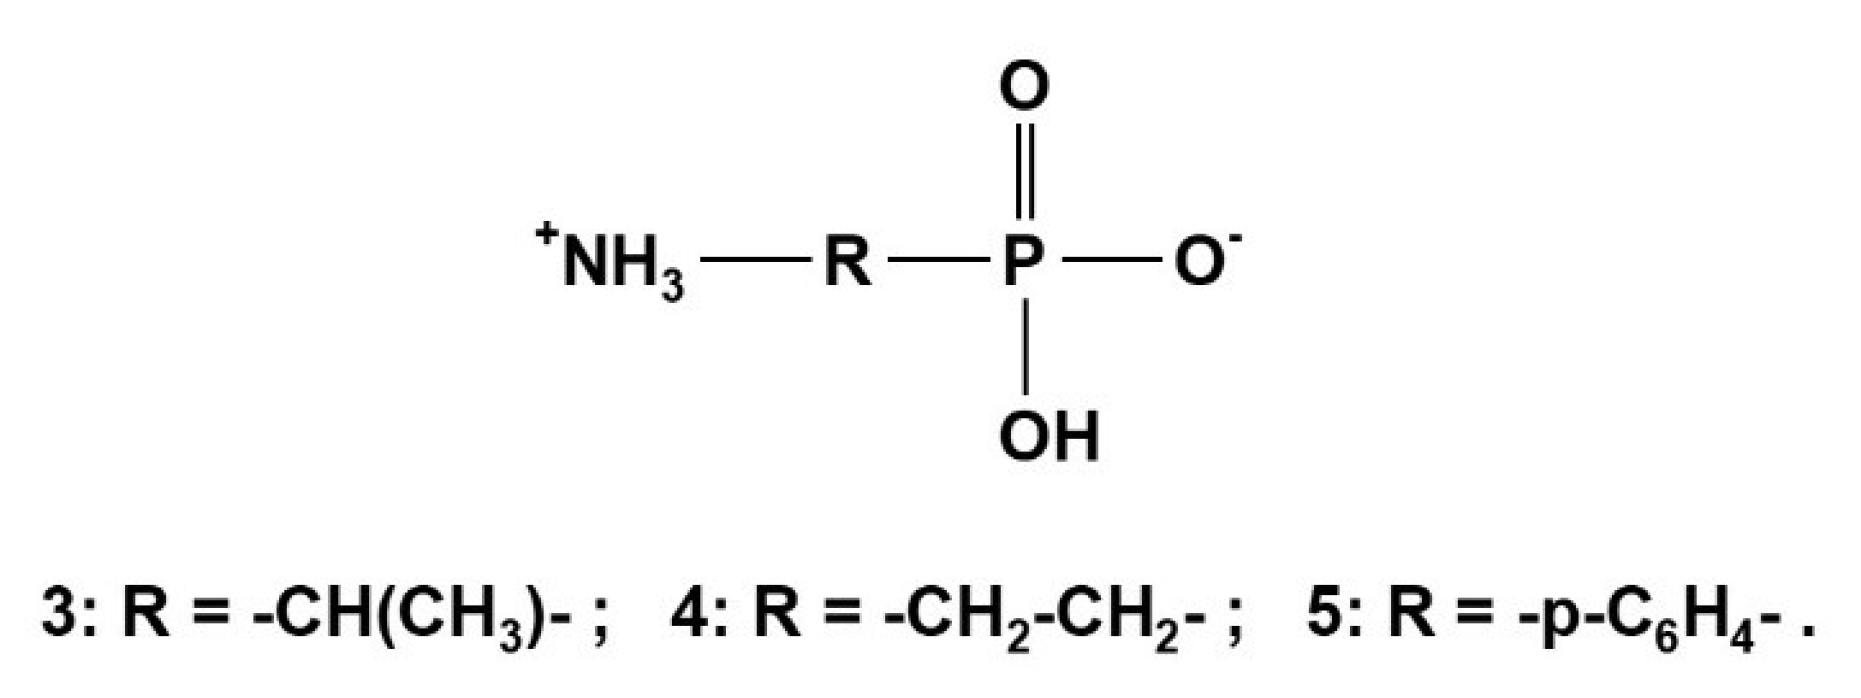
α-Aminoethylphosphonic acid (α-Ala-P) 3 [29,44], β-aminoethylphosphonic acid (β-Ala-P, CILIATIN) 4 [29], and p-aminophenylphosphonic acid 5 [29,30,43] shown in Scheme 3 will be studied as examples in the following section.
2.2.1. Aliphatic Aminophosphonic Acids
Aminophosphonic acids NH2-R-PO3H2, such as examples 3 to 5, exist as betainic forms +NH3-R-PO3H− in solid and in solution state. Protolytic equilibria of aminophosphonic acids are described by macroscopic and microscopic formalisms as shown in Table 5 below:
If R is aliphatic (e.g., in 3 and 4), the deprotonation takes place following route a): +NH3-R-PO3H2 → +NH3-R-PO3H− → +NH3-R-PO32− → NH2-R-PO32−. But if R is aromatic (e.g., in 5. R = p-C6H4-), the deprotonation dominantly will follow b): +NH3-R-PO3H2 → +NH3-R-PO3H− → NH2-R-PO3H− → NH2-R-PO32−. Consistent conclusions are supported by a combination of potentiometric titrations and 31P{1H}-NMR-controlled titrations as shown for examples 3 to 5, and in addition by 13C{1H}-NMR-controlled titrations for examples 3 and 4. Owing to its low solubility, 5 was not suitable for 13C{1H}-NMR-controlled titrations.
Macroscopic dissociation constants pKi of 3 and 4 are listed in Table 6. pKi data of compounds 4 and 5 were discussed in [44,45,48,49,50].
Specific chemical shifts δP and gradients Δ for compounds 3 to 5 obtained by 31P{1H}-NMR-controlled titrations are given in Table 7:
The deprotonation of the P-OH groups led to high field shifts for δP connected with negative gradients. The final deprotonation of the NH3+ group gave rise to a low field shift for δP. This effect is stronger in α-aminophosphonic acid 4 than in β-aminophosphonic acid 5. Earlier results for chemical shifts δP of H2L, HL− and L2− species of 3 and 4 were mentioned in [5,45]. In addition, δP of H3L+ was accessible for 4 but not for 3.
13C{1H}-NMR-controlled titrations of compounds 4 and 5 led to specific chemical shifts δC, coupling constants 1JPC, and gradients Δ as listed in Table 8:
NMR was used to monitor the complex formation of aminophosphonic acids with biorelevant cations in homogeneous solutions. An instructive example is the 31P{1H}-NMR-controlled titration of CILIATIN/Mg2+ vs. NaOH where the formation of [MgL] and [MgHL]+ was monitored [44].
2.2.2. Aromatic p-Aminophenylphosphonic Acid 5
The deprotonation of PO3H− in aliphatic aminophosphonic acids 3 and 4 is affiliated with a high field shift (gradients Δ2 are negative), while the deprotonation of the ammonium function +NH3 leads to a low field shift (gradients Δ3 are positive).
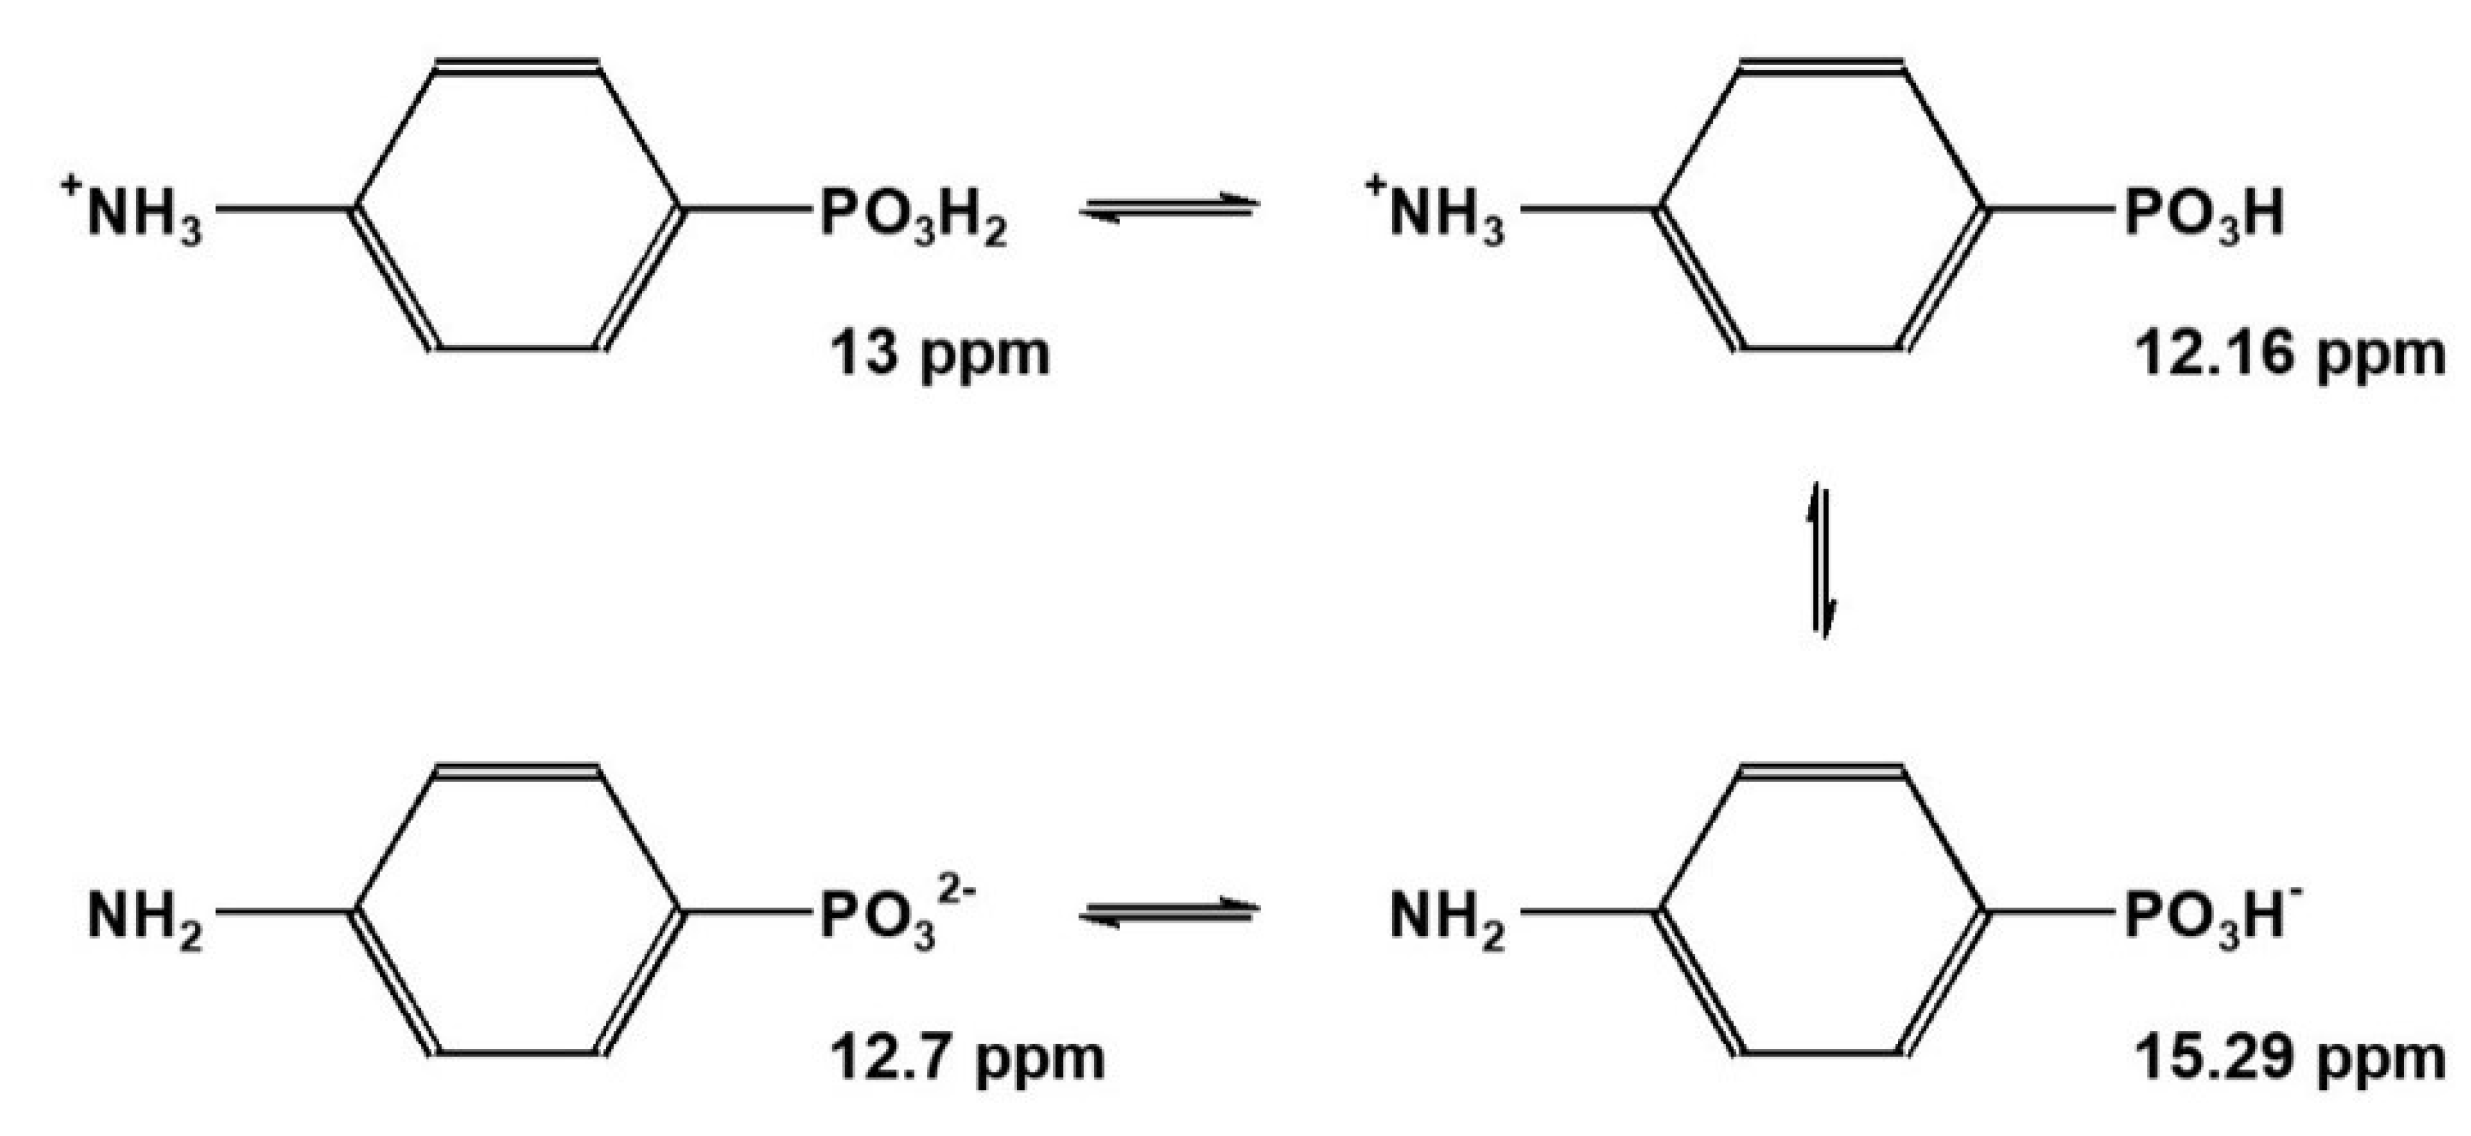
The aromatic p-aminophenylphosphonic acid 5 exhibits a different pattern: while gradient Δ2 is positive, Δ3 is negative (Scheme 4).
But is it sufficient to assume a simple first-order macroscopic dissociation scheme for compound 5? Deeper insight might be obtained from the microscopic dissociation scheme. In principle 13C{1H}-NMR-controlled titration should lead to specific chemical shifts and coupling constants nJPC indicative for microscopic dissociations species of 5. But p-aminophenylphosphonic acid 5 is less soluble in water than the aliphatic aminophosphonic acids 3 and 4. The S/N-ratio of 13C{1H}-NMR spectra of 5 is not sufficient to perform evaluable 13C{1H}-NMR-controlled titrations. In this situation, UV/VIS-controlled titration, which allows for lower concentrations suitable for conclusive measurements, will help to study both the macroscopic and the microscopic dissociation equilibrium of 5 [30]. In addition, the parent compounds C6H5PO3H2 2 and C6H5NH2*HCl 6 were compared. The following macroscopic pKi data were found by potentiometric titration and listed in Table 9:
Those data point towards a dominating deprotonation sequence for 5 following +NH3-R-PO3H2 → +NH3-R-PO3H− → NH2-R-PO3H− → NH2-R-PO32−. But is it justified to exclude the alternative route +NH3-R-PO3H2 → +NH3-R-PO3H− → +NH3-R-PO32− → NH2-R-PO32−? Evaluating the macroscopic dissociation constants of 5 shows that between pH = 1.5 and pH = 10, only three macroscopic species exist: H2L, HL−, and L2−. The UV/VIS-controlled titration of 5 [30] showed that the maximum concentration for macroscopic HL− is reached at pH = 5.75, consisting of two microdissociation species NH2-R-PO3H− and +NH3-R-PO32− in a ratio of 9:1. Thus, the results from the UV/VIS-controlled titration of 5 [30] confirm the dominance of NH2-R-PO3H− as previously assumed for the macroscopic deprotonation sequence derived from the 31P{1H}-NMR-controlled titration of 5 [44].
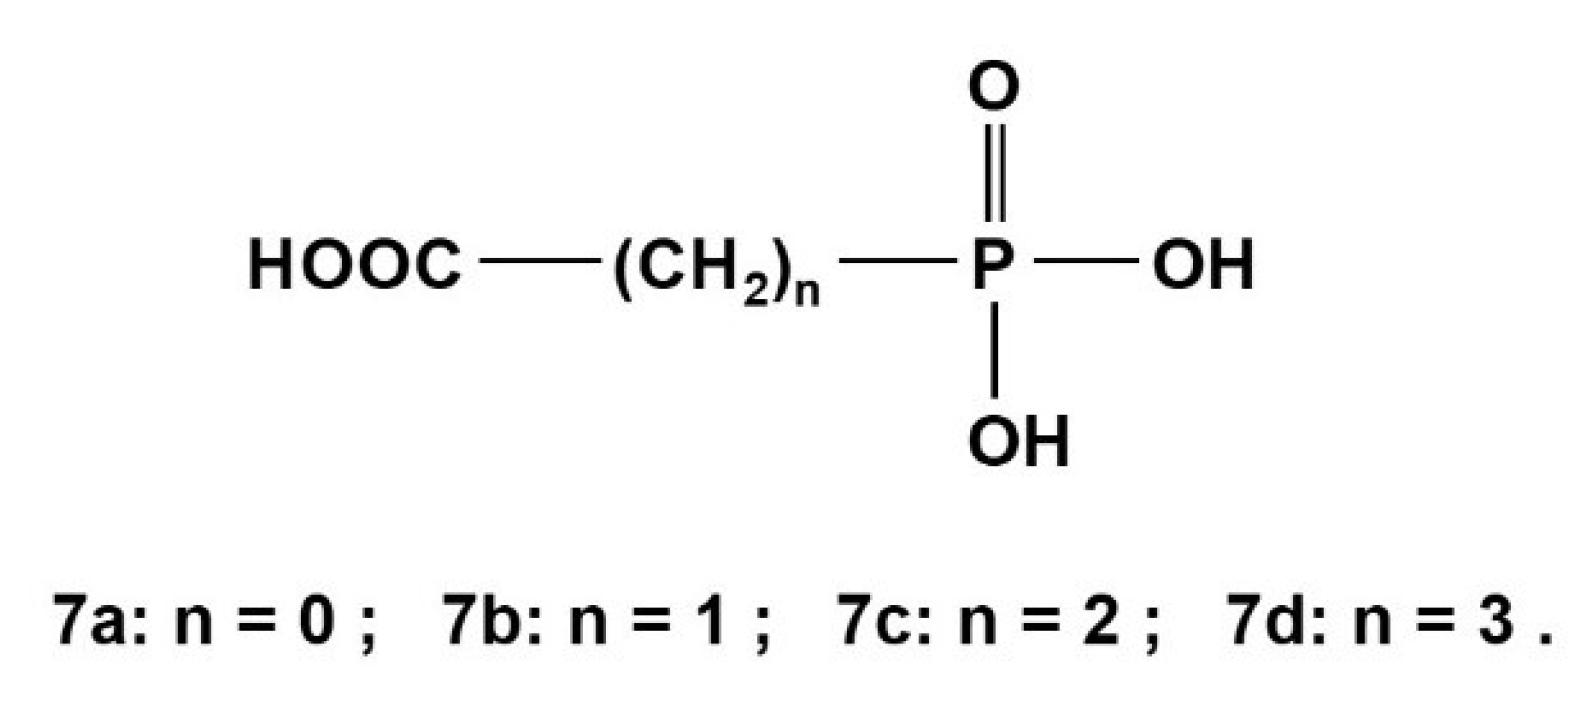
2.3. Phosphonocarboxylic Acids HOOC-(CH2)n-PO3H2 7a to 7d (n = 0 to 3)
Phosphonocarboxylic acids HOOC-(CH2)n-PO3H2 gave rise to potentiometrically [4,44] and NMR-controlled titrations [4,28,31,44]. Those neutral acids of type H3L deprotonate dominantly in a sequence: HOOC-(CH2)n-PO3H2 → −OOC-(CH2)n-PO3H− → −OOC-(CH2)n-PO32−. Corresponding dissociations constants for compounds shown in Scheme 5 are listed in Table 10 below:
13C{1H}-NMR-controlled titrations yielded the specific chemical shift δC and coupling constants nJPC (n = 1 to 3) of phosphonocarboxylic acids HOOC-(CH2)n-PO3H2 (n = 0 to 3) 7a to 7d as listed in Table 11a. Gradients are given in Table 11b. Note: The deprotonation of P-OH groups and of C-OH led to a low field shift for all carbon atoms. Some chemical shifts and coupling constants 1JPC of 7a and 7c were obtained and discussed in an early key paper [4].
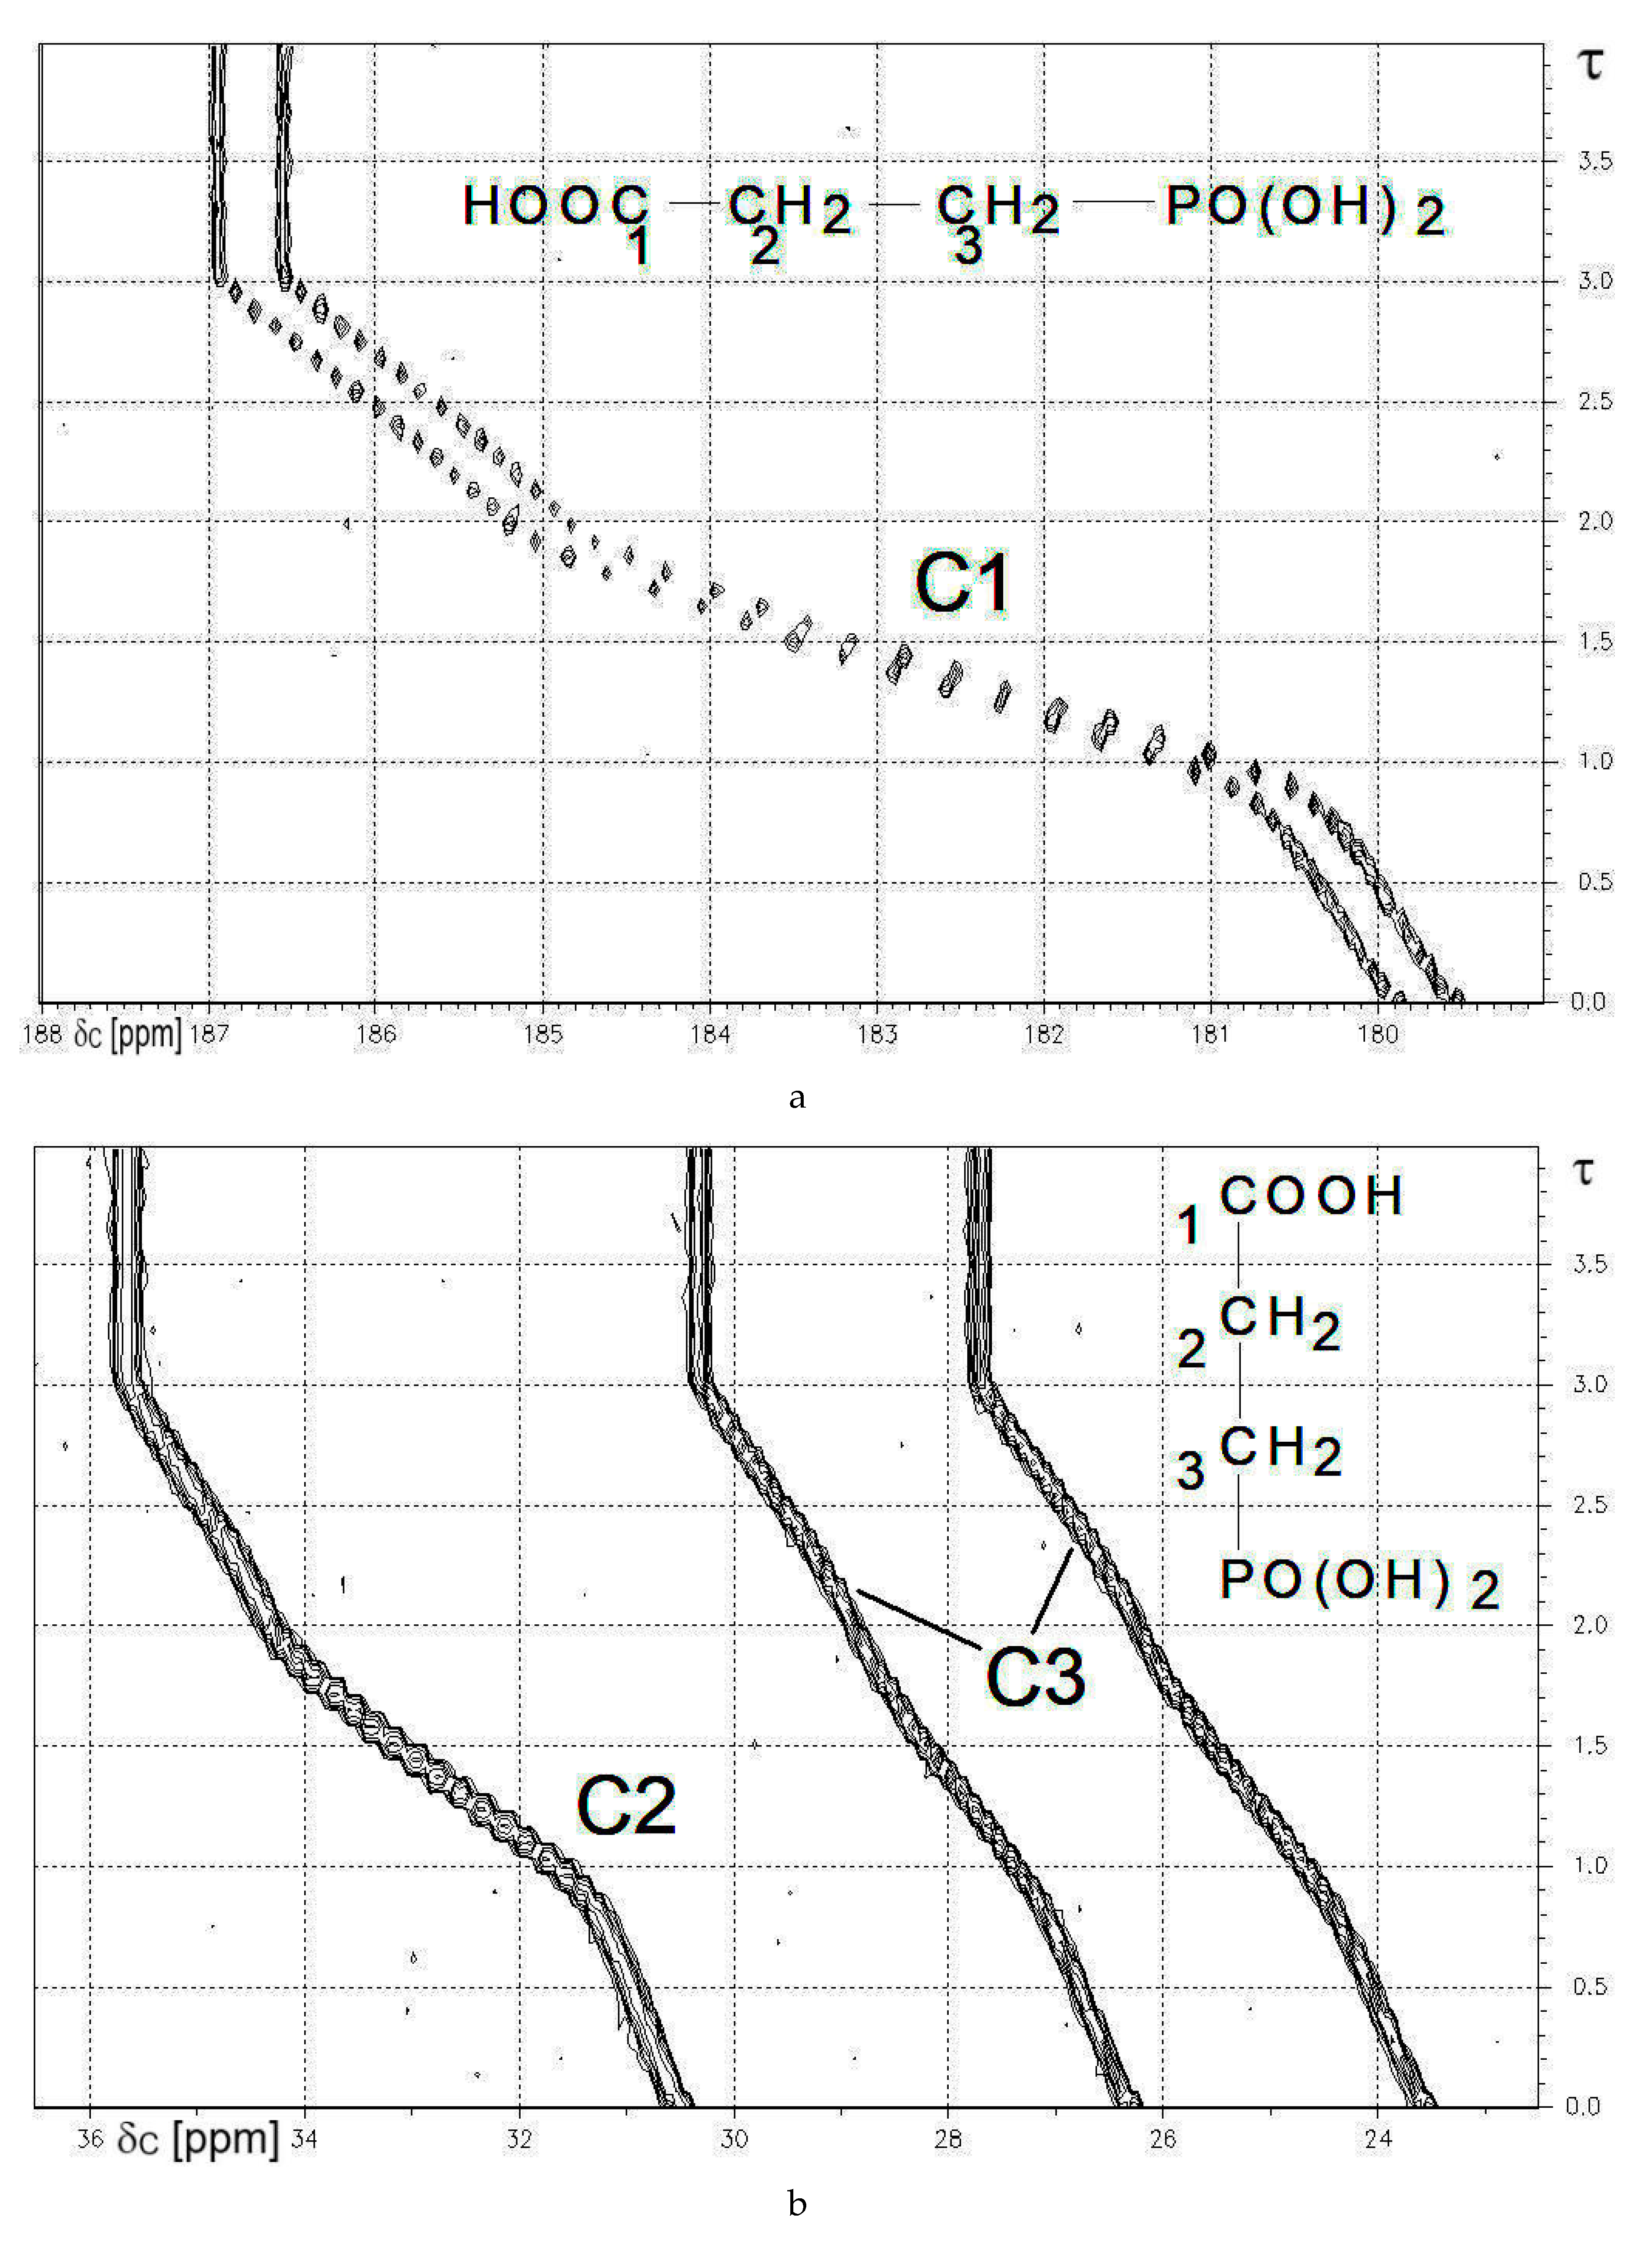
2.3.1. Compound 7c: 13C{1H}-NMR-Controlled Titration of 3-Phosphonopropionic Acid HOOC-CH2-CH2-PO3H2 7c.
3-Phosphonopropionic acid 7c was chosen as an example to show practical results from 13C{1H}-NMR-controlled titrations (see Figure 3a,b below). The deprotonation of C-OH and of both P-OH functions induces low field shifts for C1, C2, and C3. Hence, the corresponding gradients are negative. Lorentzian deconvolution of 13C{1H} signals yielded nJPC, where absolute values follow the sequence: 1JPC >> 3JPC > 2JPC. See Table 11a,b above.
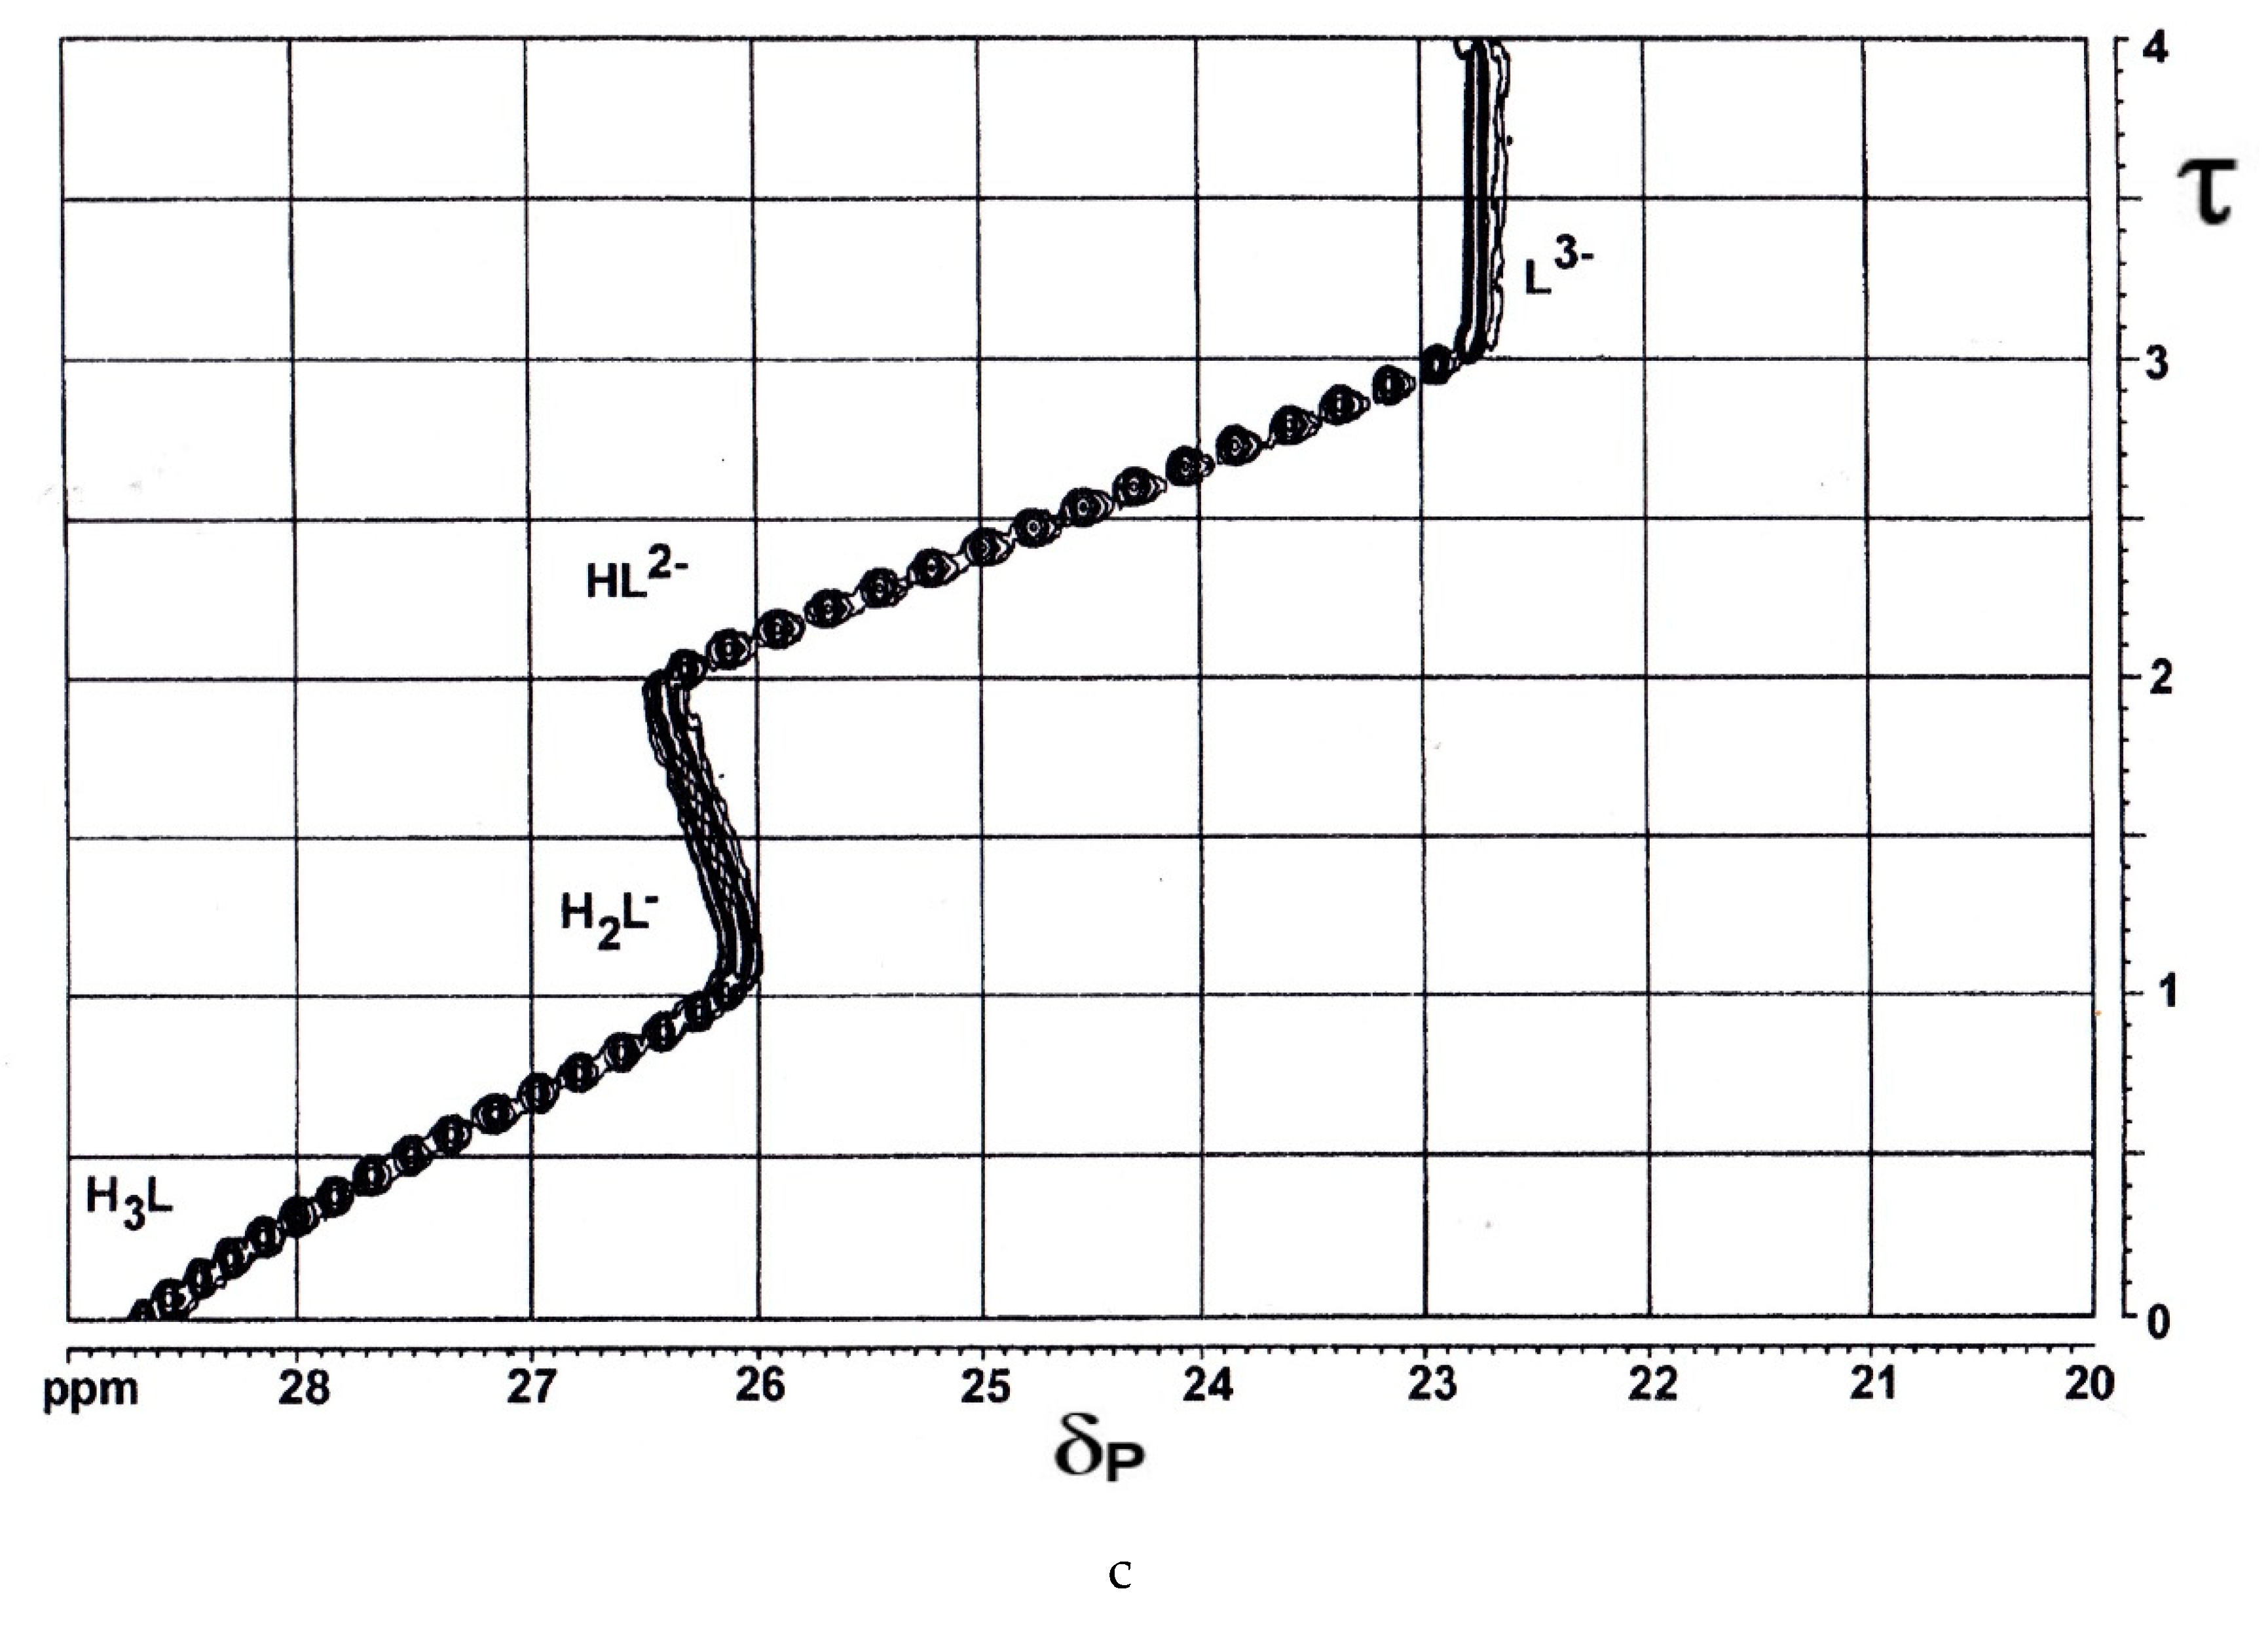
The 81 MHz 31P{1H}-NMR-controlled titration of 3-phosphonopropionic acid 7c vs. NaOH yielded Figure 3c. The deprotonation sequence reported in [4] corresponds to: HOOC-CH2-CH2-PO3H2 → HOOC-CH2-CH2-PO3H− → −OOC-CH2-CH2-PO3H− → −OOC-CH2-CH2-PO32−. Deprotonation at PO3H2 or PO3H− is affiliated with high field shifts of δP, while deprotonation at HOOC induces a low field shift for δP.
Specific chemical shifts δP for 7c and corresponding anions together with gradients are listed in Table 12.
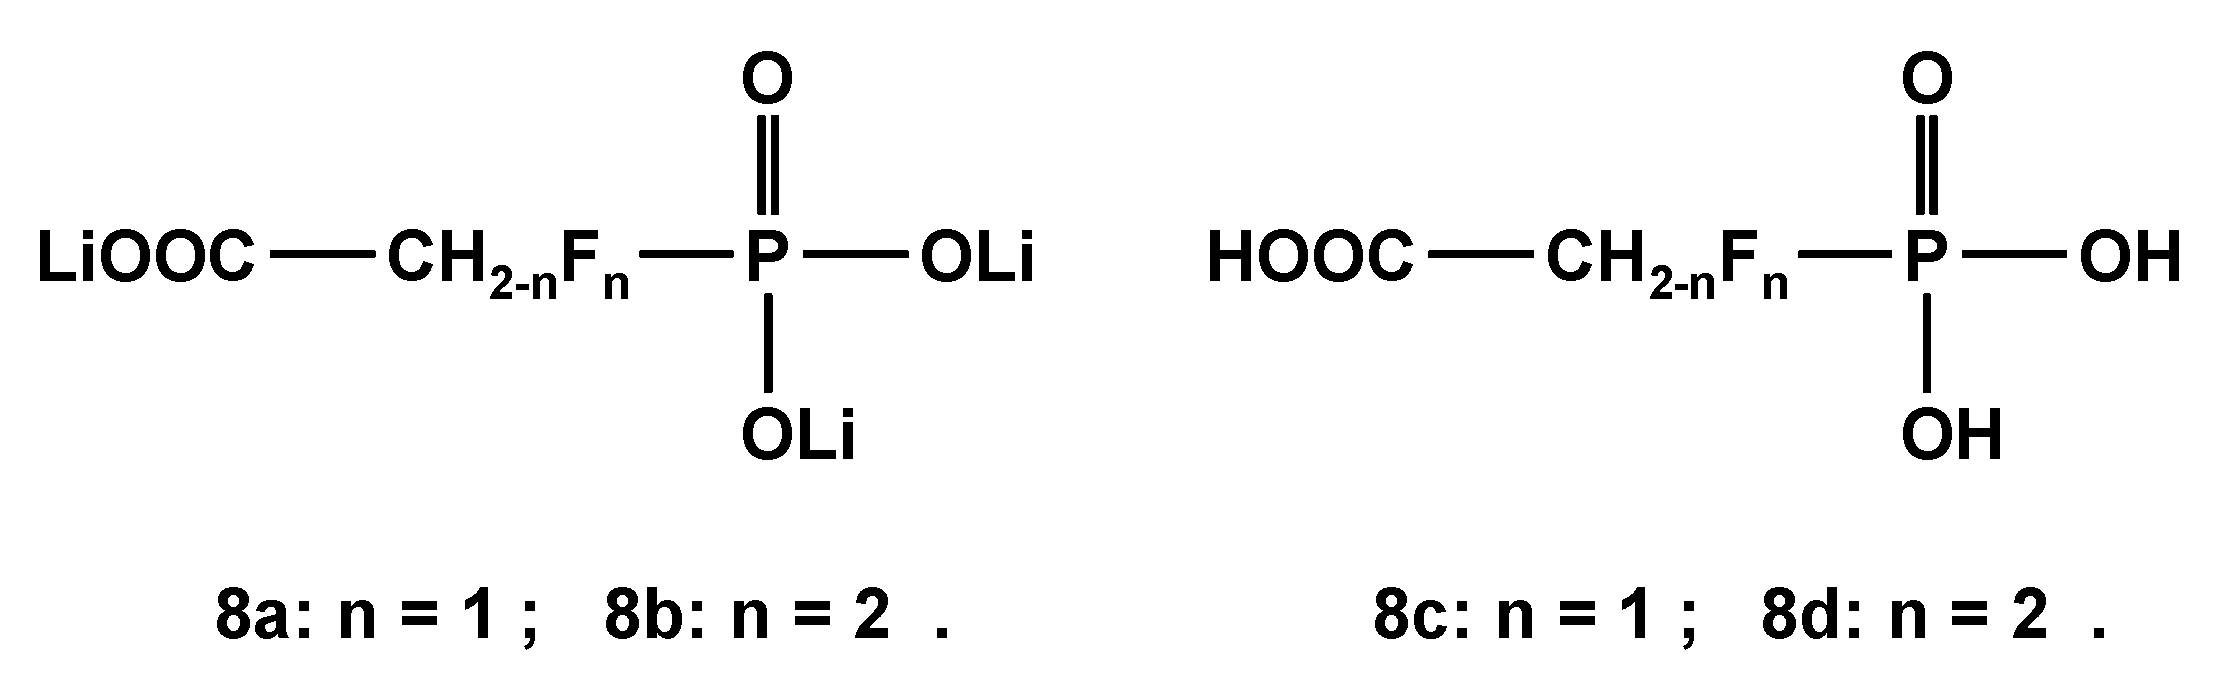
2.3.2. 19. F-NMR-Controlled Retro Titrations of Lithium Salts LiOOC-CH2-nFn-PO3Li2 8a and 8b
The trilithium salts LiOOC-CH2-nFn-PO3Li2 (8a and 8b; n = 1 and 2, Scheme 6) were used for retro titrations vs. HNO3, since the parent mono- and difluorophosphonoacetic acids 8c and 8d were not available for 19F-NMR- and 31P{1H}-NMR titrations. Corresponding dissociation constants pKi of 8c and 8d were calculated as listed in Table 13, while chemical shifts δF and δP and coupling constants 2JPF are given in Table 14. As expected, the introduction of fluorine into the skeleton of the parent phosphonoacetic acid led to lower pK1 and pK2 values. The deprotonation of P-OH groups induces a low field shift for δF in fluorinated phosphonic acids 8c and 8d.
2.3.3. 2,4-Diphosphonobutane-1,2-Dicarboxylic Acid (DPBDC) 9
Strong practical interests focused on polyfunctional phosphonocarboxylic acids, e.g., phosphonosuccinic acid (PBS), 1-phosphonopropane-1,2,3-tricarboxylic acid (PPTC), and 2-phosphonobutane-1,2,4-tricarboxylic acid (PBTC), which gave rise to analytical and NMR studies of protolytic and complex formation equilibria [42,43,44,53].
The following section will deal with 2,4-diphosphonobutane-1,2-dicarboxylic acid (DPBDC) 9 to demonstrate the potential of automated NMR titrations. Dissociation constants of this 6-valent acid DPBDC 9 were obtained from precision potentiometric [53] and by 13C{1H}-NMR-controlled titrations vs. NaOH [44].
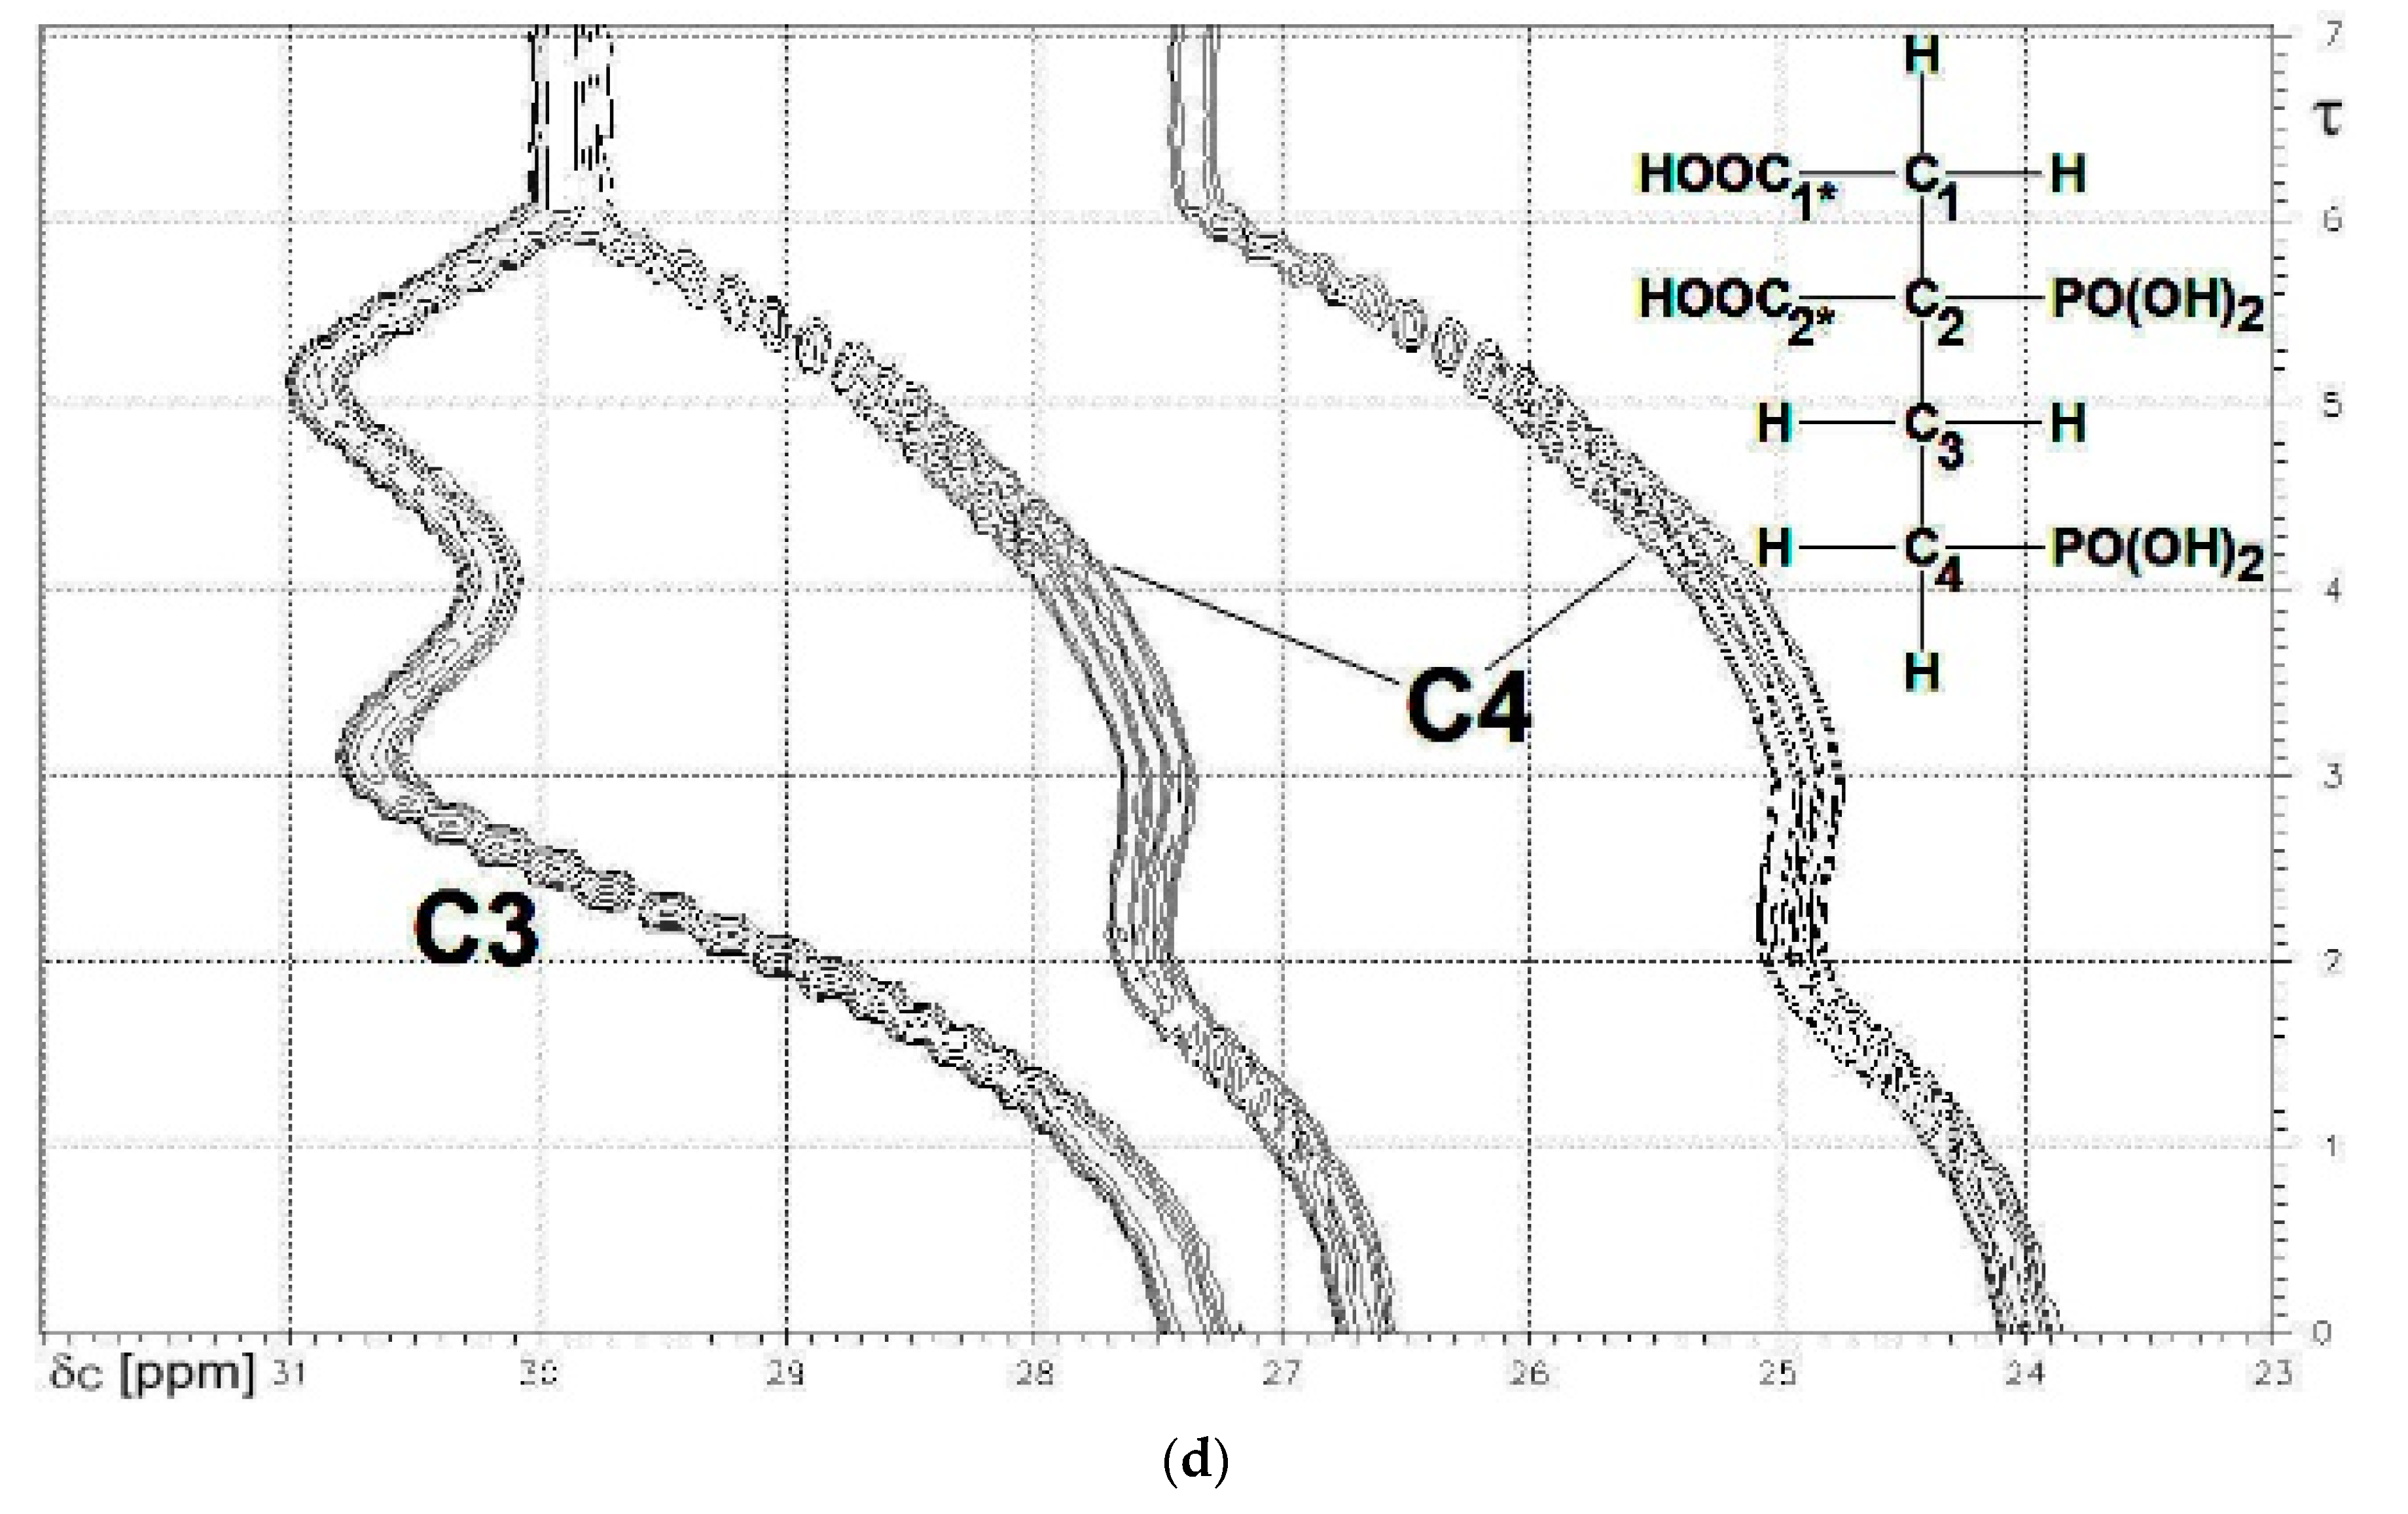
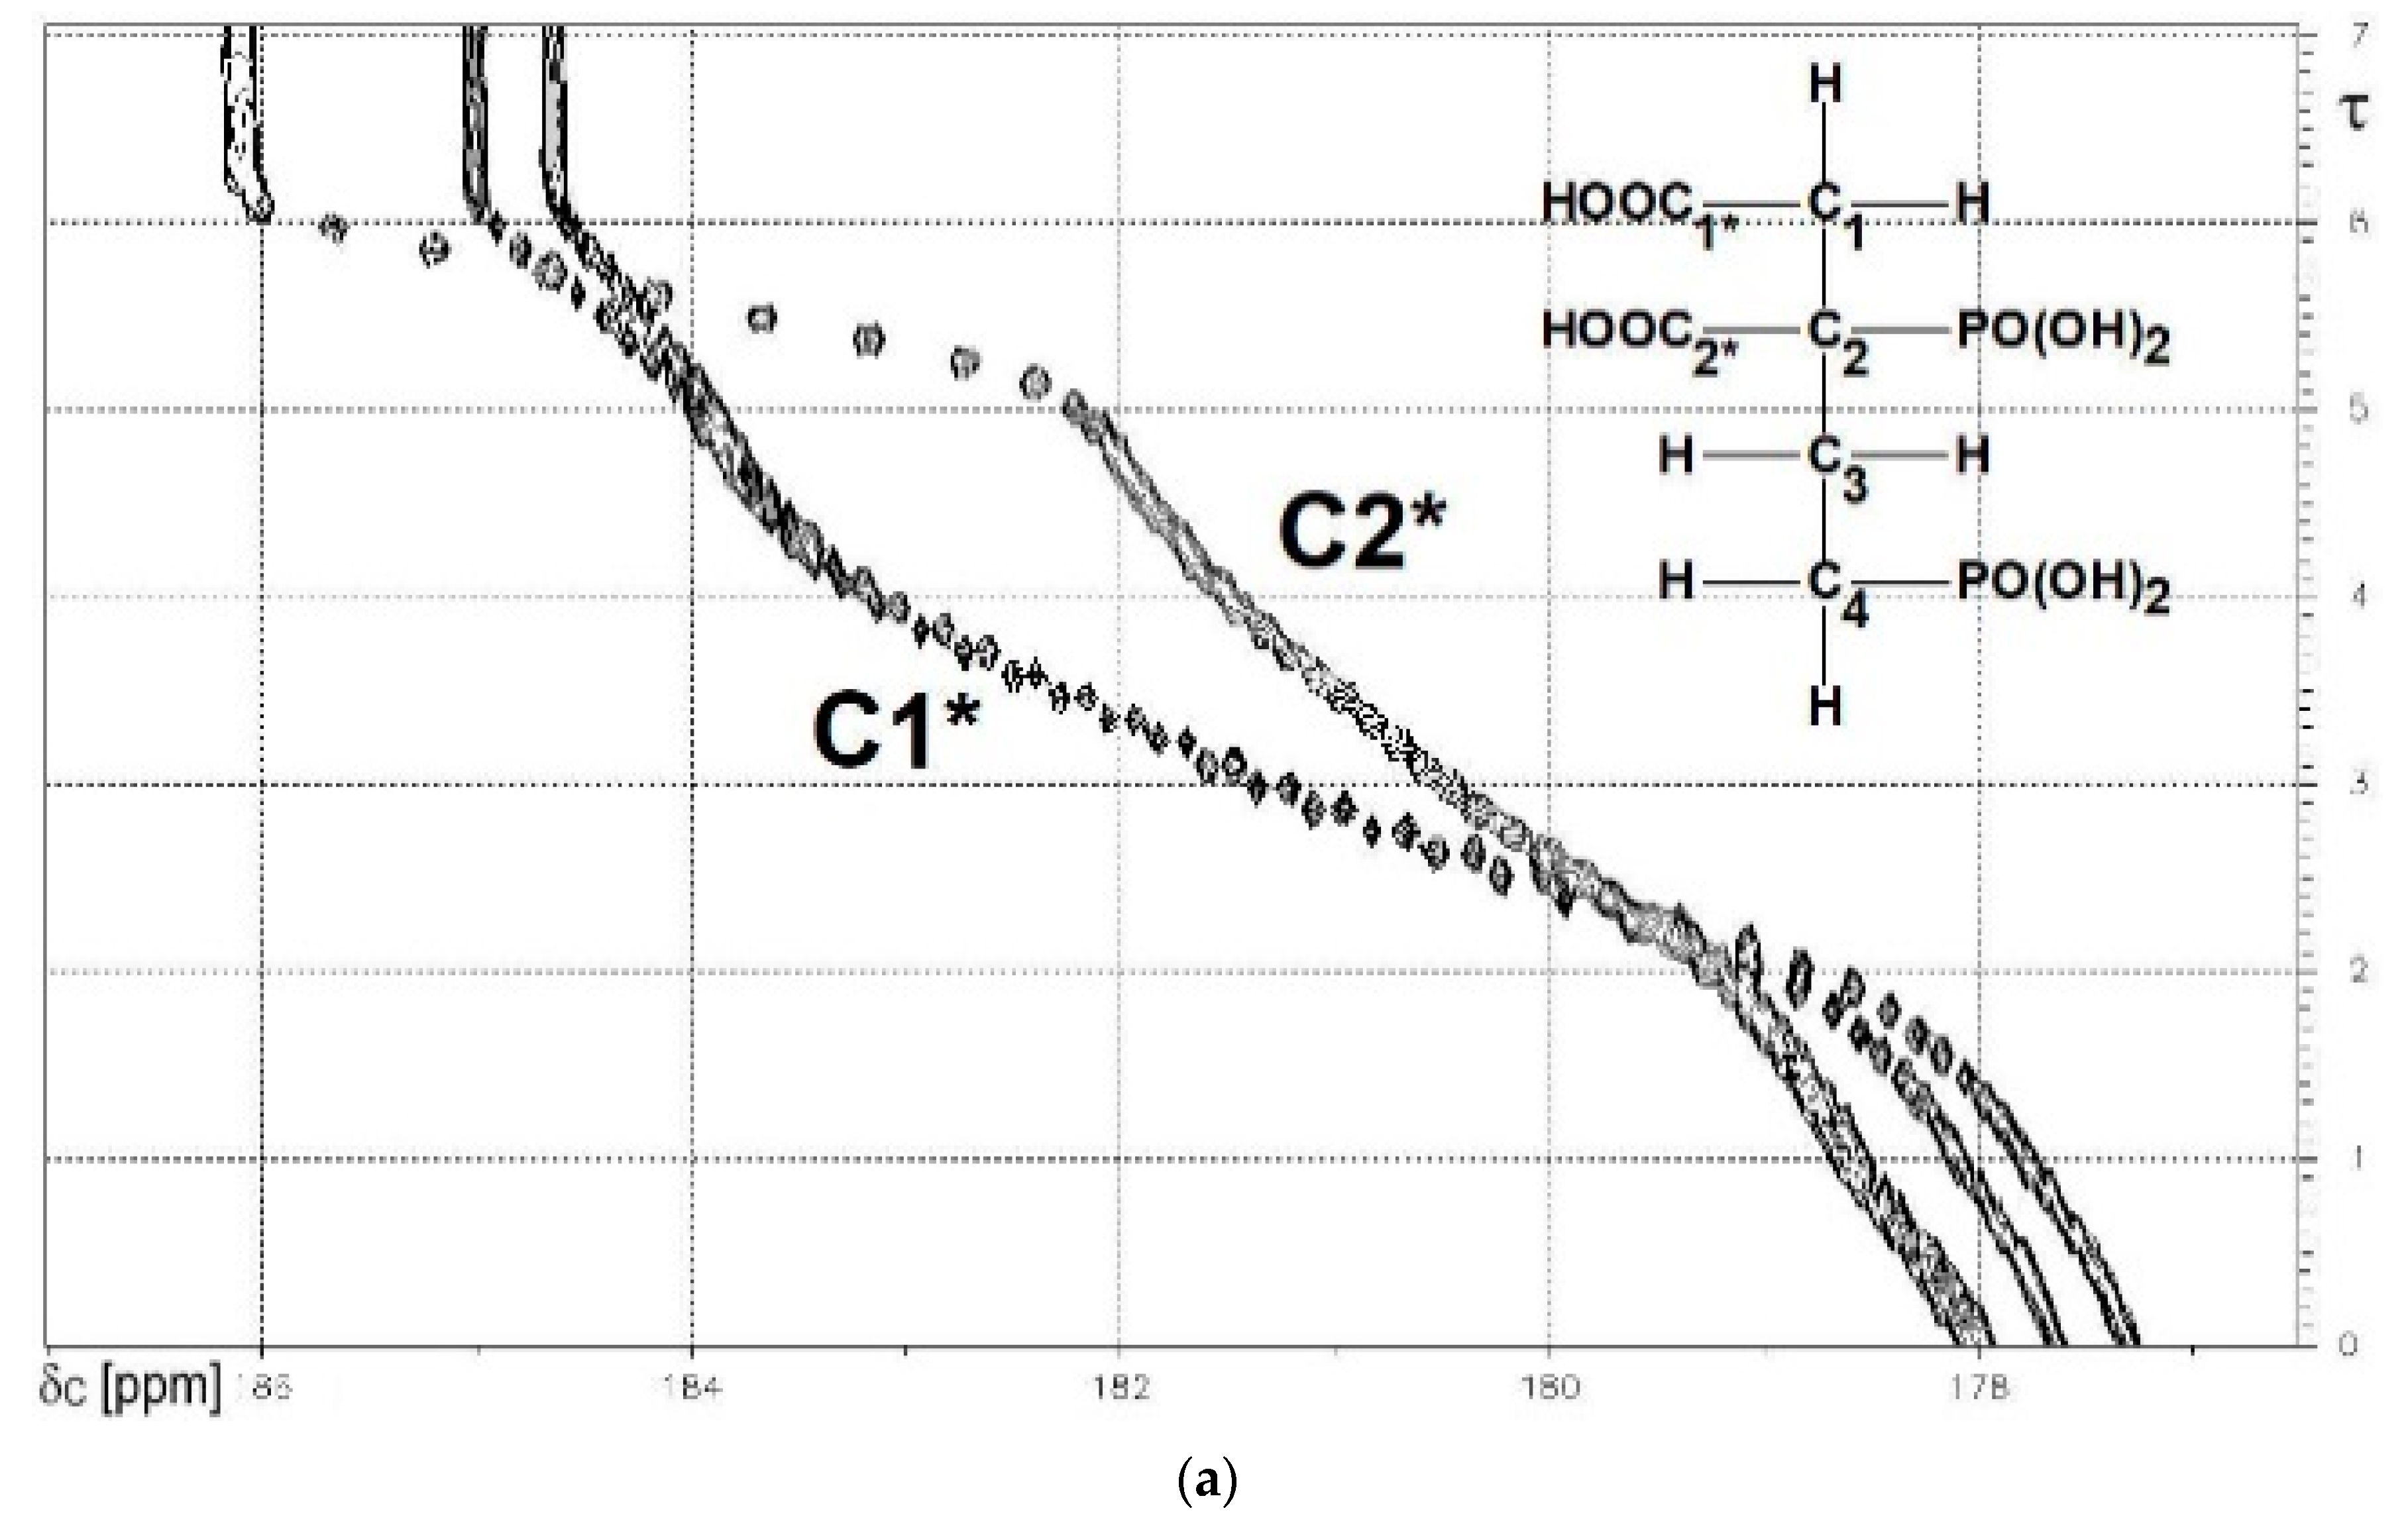
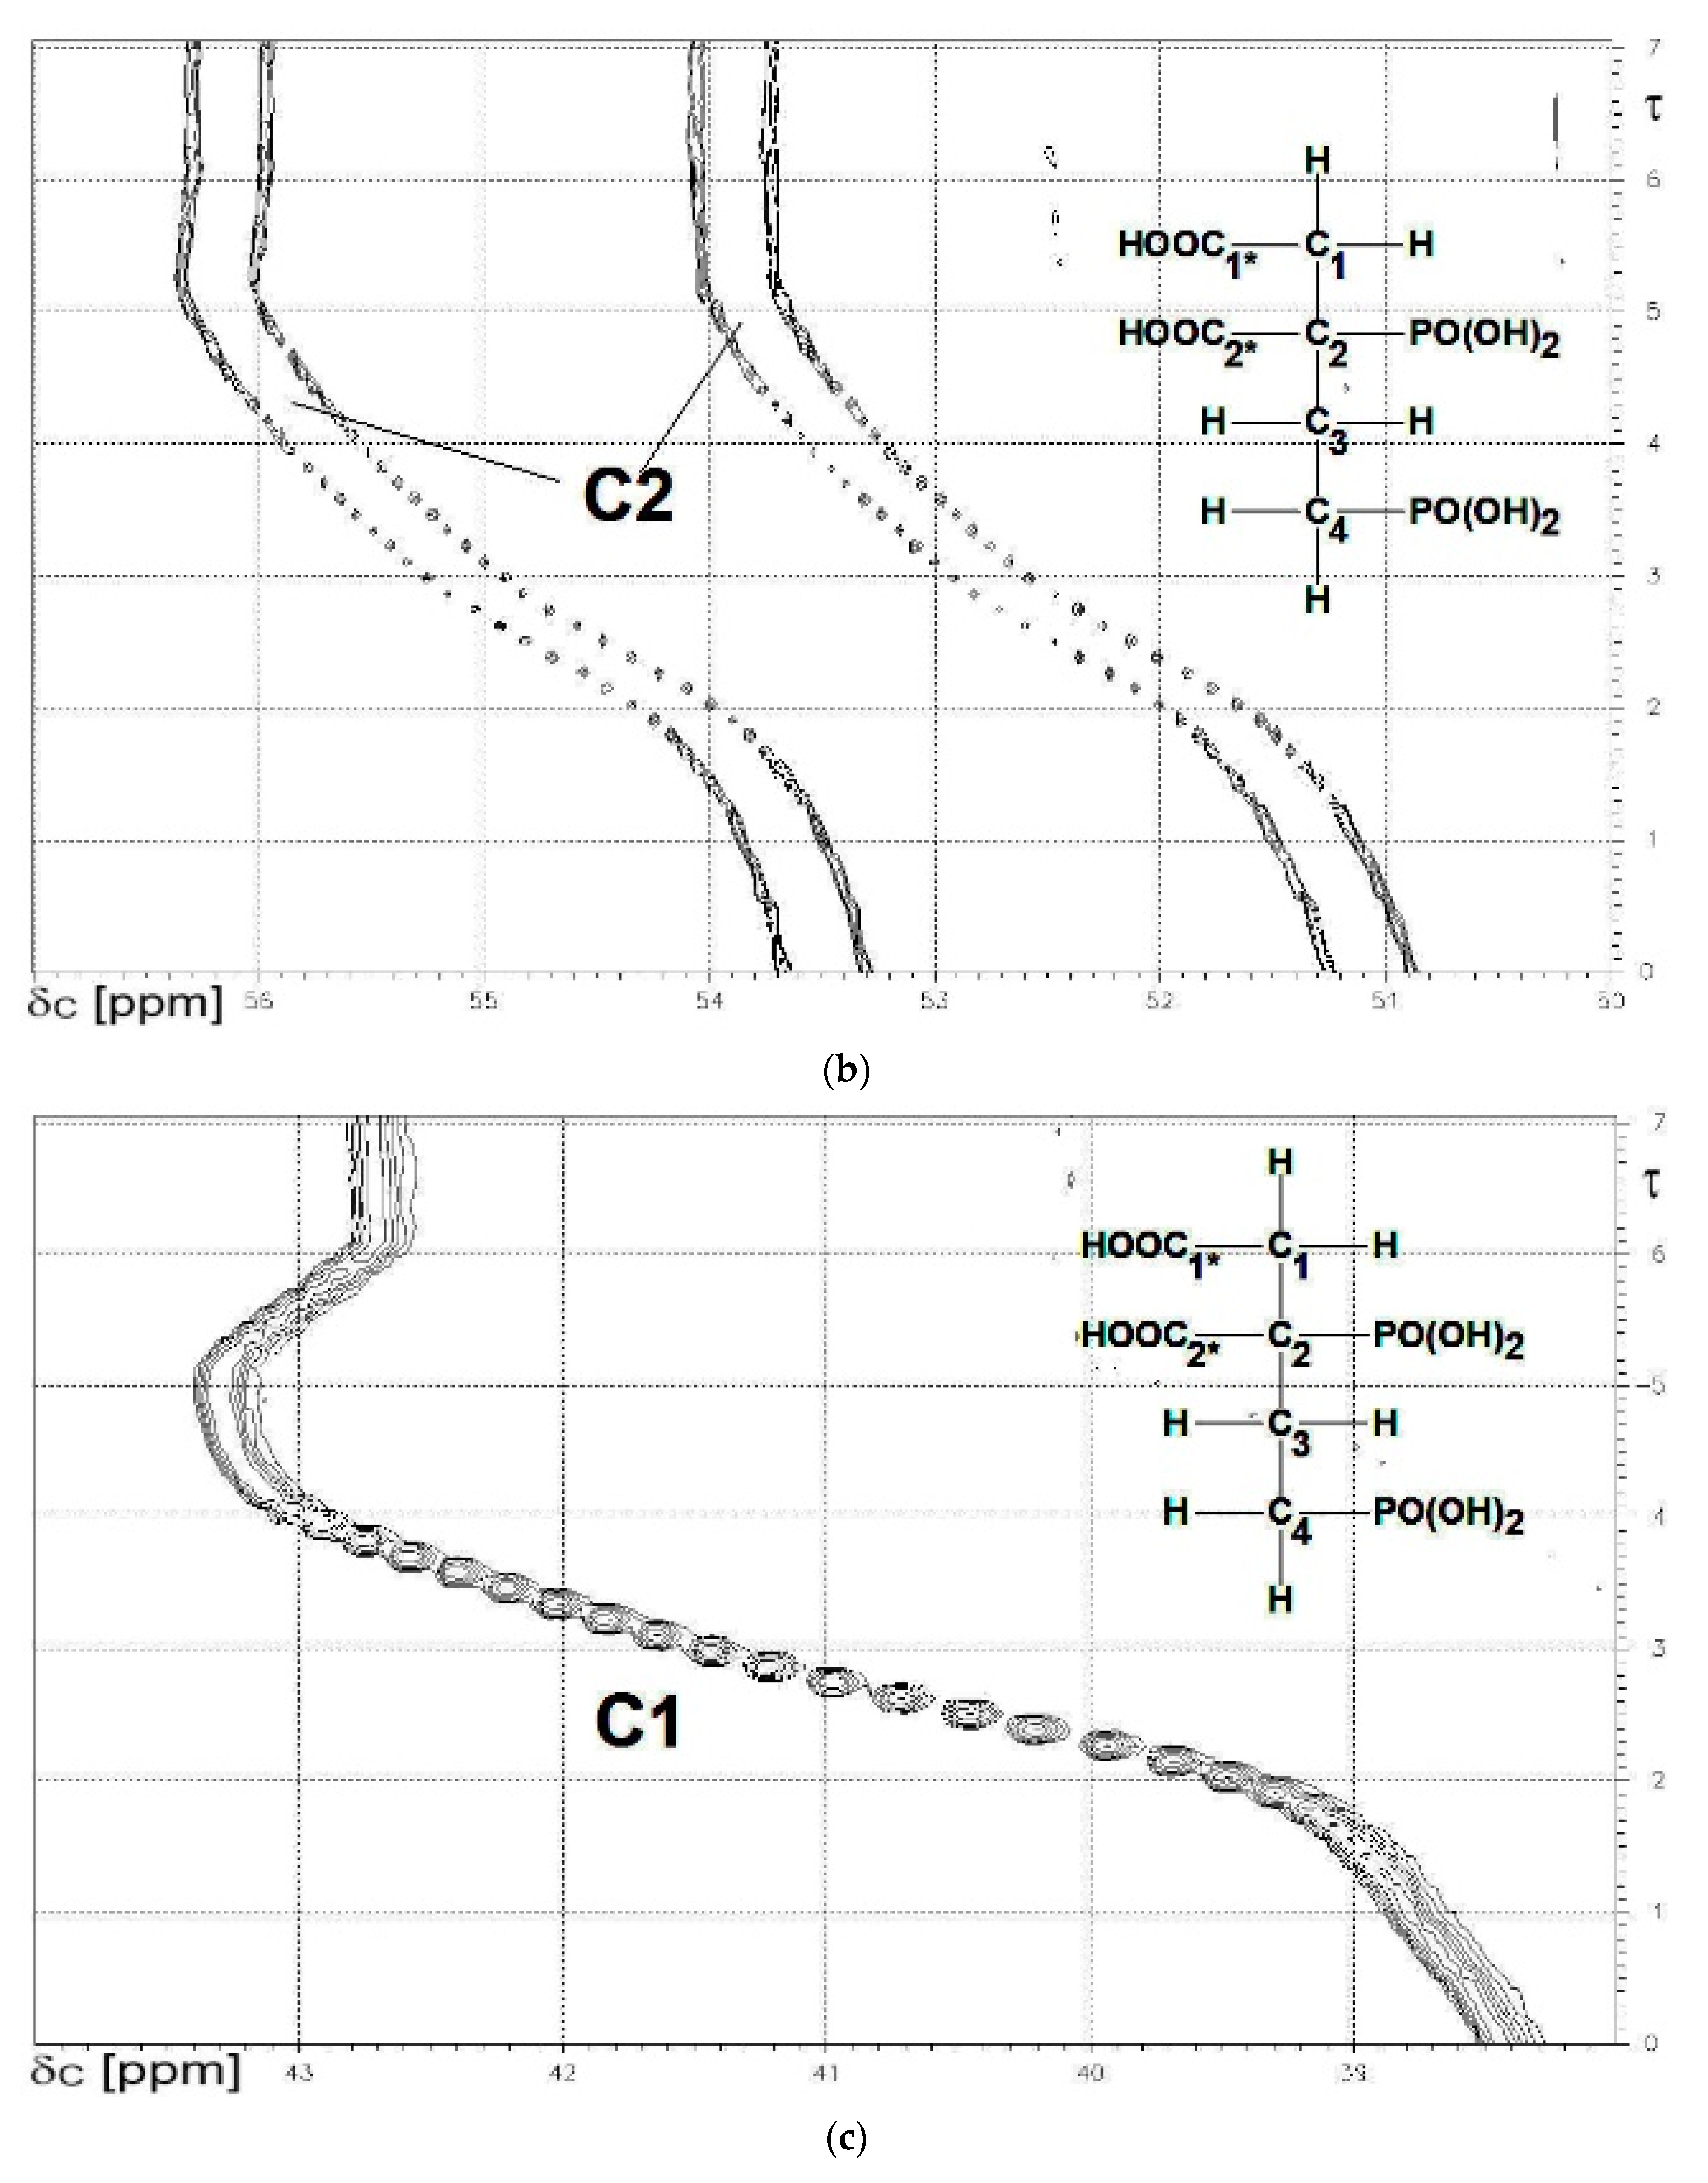
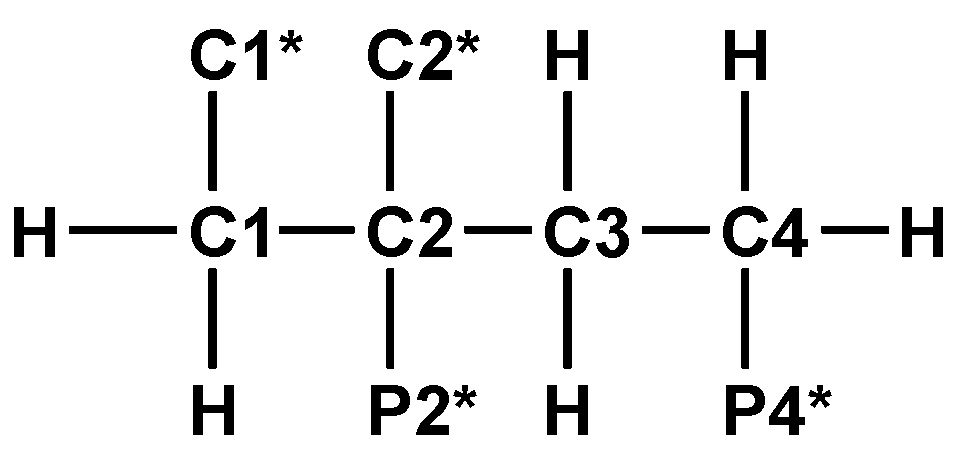
13C{1H}-technique yielded Figure 4a–d. The spin enumeration used in subsequent tables and figures is given in Scheme 7:
Results for those six carbon atoms C1*, C2*, and C1 to C4 will be presented as (δ,τ))-contour plots in four separate spectral ranges shown in Figure 4a–d. Numerical results including specific chemical shifts δC and coupling constants nJPC of DPBDC are listed in Table 15 and Table 16.
Some Comments on DPBDC 9
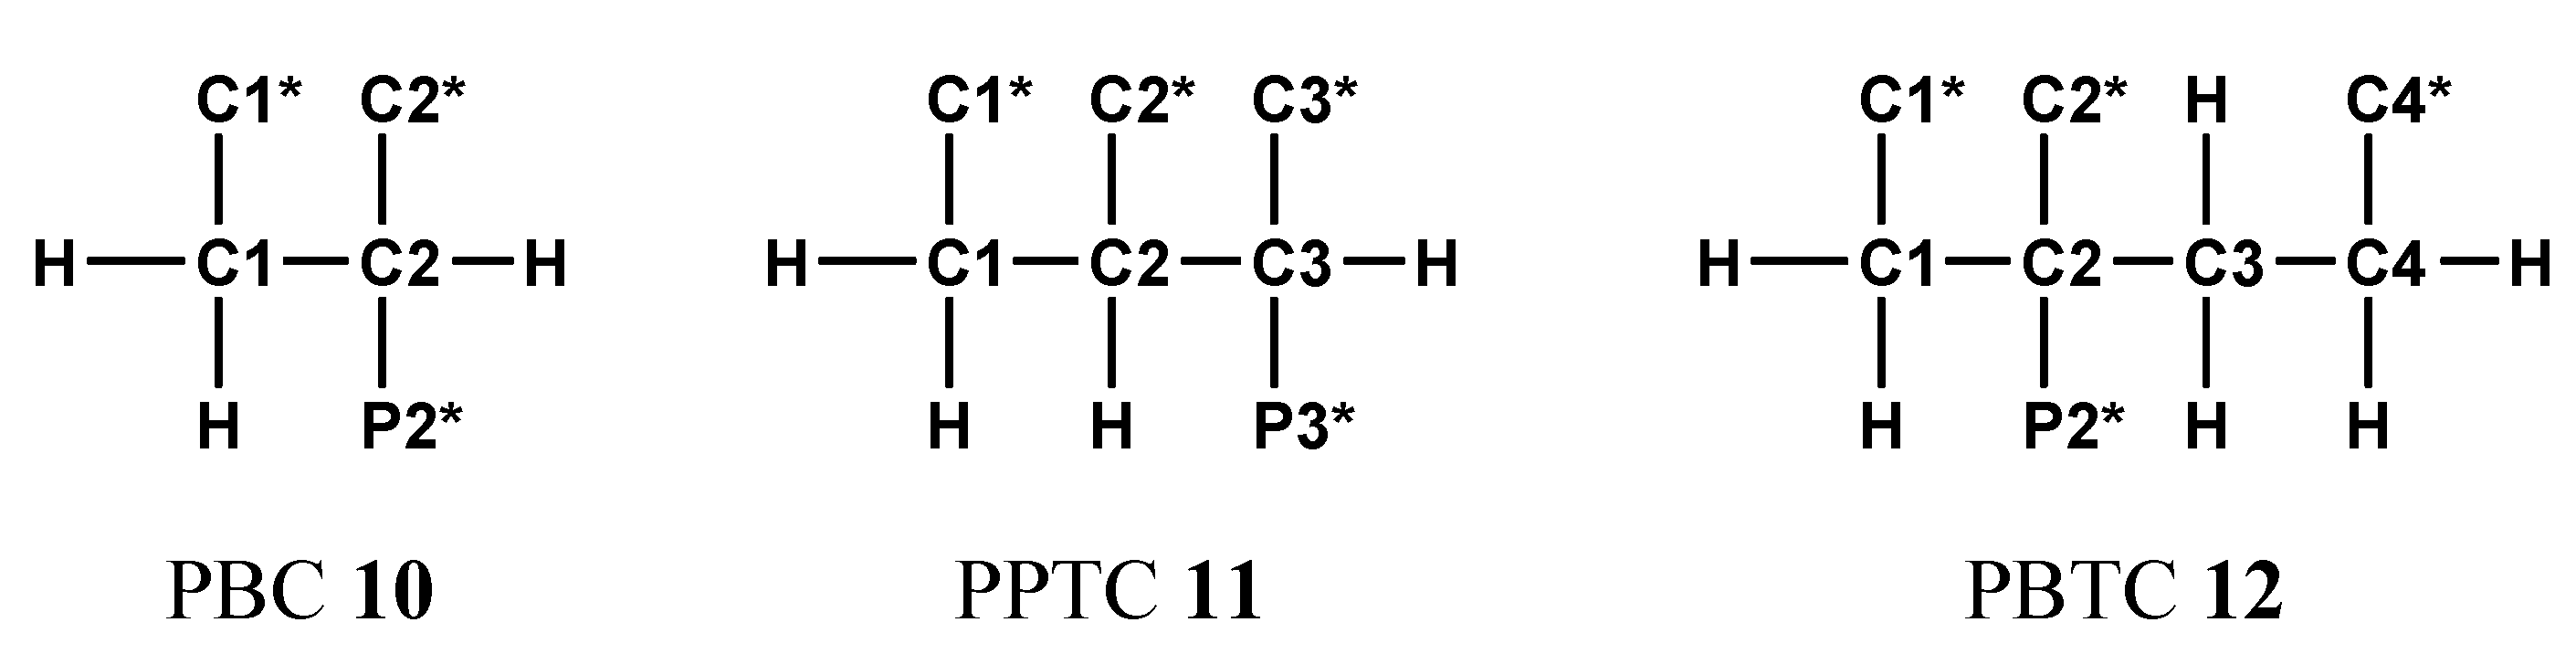
A complicated example for NMR-controlled titration which needs some discussion is 2,4-diphosphonobutane-1,2-dicarboxylic acid DPBDC 9. Measurements and data evaluation were performed according to the state of technique. But it is not possible to explain all the parameters found for compound 9 by comparison with data from analogous structural elements of HOOC-(CH2)n-PO3H2 (n = 1 to3) 7b to 7d, H2O3P-(CH2)3-PO3H2, and phosphonopolycarboxylic acids 10 to 12 shown in Scheme 8:
In a starting phase, 1D and 2D NMR techniques involving 1H-, 1H{31P}-, 13C-, 13C{1H}-, and C,H-COSY spectra were combined to assign the carbons C1*, C2*, C1 to C4 and phosphonate functions P2* and P4*.
For 13C{1H}-NMR-controlled titration, the deprotonation steps may be divided into three sections (see Table 15 and Figure 4a,d). For τ = 0 to 2 deprotonation PO3H2 → PO3H− takes place, first at P2* and then at P4*. In the second section for τ = 2 to 4, the carboxylic units C1* and C2* are deprotonated. Finally for τ = 4 to 6 the deprotonation PO3H− → PO32− takes place at P2* and P4*.
(1) Comments on Chemical Shifts δC of Carbon Atoms in DPBDC 9
The deprotonation of PO3H2, PO3H− and COOH functions in DPBDC 9 leads to a monotonous down field shift for δC C1* and C2* (see Figure 4a), while carbons C1 to C4 exhibit specific non-monotonous trends (see Figure 4b,d).
Since gradient Δ6 for δC (C1*) > Δ5 for δC (C1*), the final sixth deprotonation steps is affiliated with P2*. This conclusion is confirmed by Δ6 for δC (C2*) >> Δ5 for δC (C1*). Hence, the fifth deprotonation step of 9 is due to PO3H− → PO32− of P4*. Dynamic chemicals shifts δC of C1* span a range from 177.5 to 184.61 ppm, while δC of C2* is found from 178 to 185.1, as shown in Figure 4a.
A tentative explanation may be found using Δ3 for δC (C1*) > Δ4 for δC (C1*) and Δ3 for δC (C2*) < Δ4 for δC (C1*). These findings imply that the carboxylic function C1* is more acidic than C*2.
Similar arguments for the relative acidity of C1* and C2* may be derived from the chemical shift δC of the skeleton carbon C2 (see Figure 4b). δC (C2) of H6L corresponds to 52.2 ppm, while the totally deprotonated form L6− is found at 55 ppm. Deprotonation at C1* and C2* is characterized again by Δ3 of δC (C2) > Δ4 of δC (C2).
Chemical shifts δC of C3 span a range of 38.4 to 43.3 ppm. Surprisingly, the final deprotonation HL5− → L6−, due to PO3H− → PO32− of P2* reduces δC (C3) from 43.26 to 42.70 ppm. This is the first observation (within this context) of a negative gradient (Δ6 = −0.56 Hz) connected to deprotonation at a PO3H− unit.
The situation is even more complex for the chemical shift δC of C2 covering a range from 27.4 to 30.9 ppm (Figure 4d). Two negative gradients are observed: Δ4 = −0.97 ppm for H3L3− → H2L4− due to deprotonation at C2* and Δ6 = −1.12 ppm for HL5− → L6− induced by deprotonation at P2*. For simpler compounds CH3-(CH2)n-COOH (n = 0 to 3) and HOOC-(CH2)n-COOH (n = 1 to 3), solely positive gradients were described [54].
In addition, we did not observe negative gradients for compounds 7b to 7d and 10 (PBC), but in 11 (PPTC) and in 12 (PBTC) [43].
The major RR/SS diastereomer of PPTC 11 exhibited a negative gradient Δ5 (C1) = −0.44 ppm for the final deprotonation step PO3H− → PO32− at P3*. An upfield shift occurred, since δc (C1) of HL4− = 42.17 ppm and δc (C1) of L5− = 41.73 ppm. This effect might be due to opening of hydrogen bridges and conformational changes. In contrast here to is the minor RR/SS diastereomer of PPTC, it does not show a negative gradient Δ5 (C1) [42,44].
Weaker negative gradients Δ5 = −0.22 ppm are observed for chemical shifts δC of both carbons C1 and C3 in PBTC 12. The final deprotonation PO3H− → PO32− at P2* is affiliated with following data: δc (C1) of HL4− = 43.54 ppm, δc (C1) of L5− = 43.32 ppm, and δc (C3) of HL4− = 32.60 ppm, δc (C3) of L5− = 32.60 ppm. In contrast hereto carbons C2 and C4 in PBTC 12 exhibit positive gradients Δ5.
Those unexpected observations for chemical shifts δc in 9 and conformational aspects will be mentioned in the following section on coupling constants nJPC as well.
(2) Comments on Coupling Constants nJPC (n = 1 to 3) of DPBDC 9
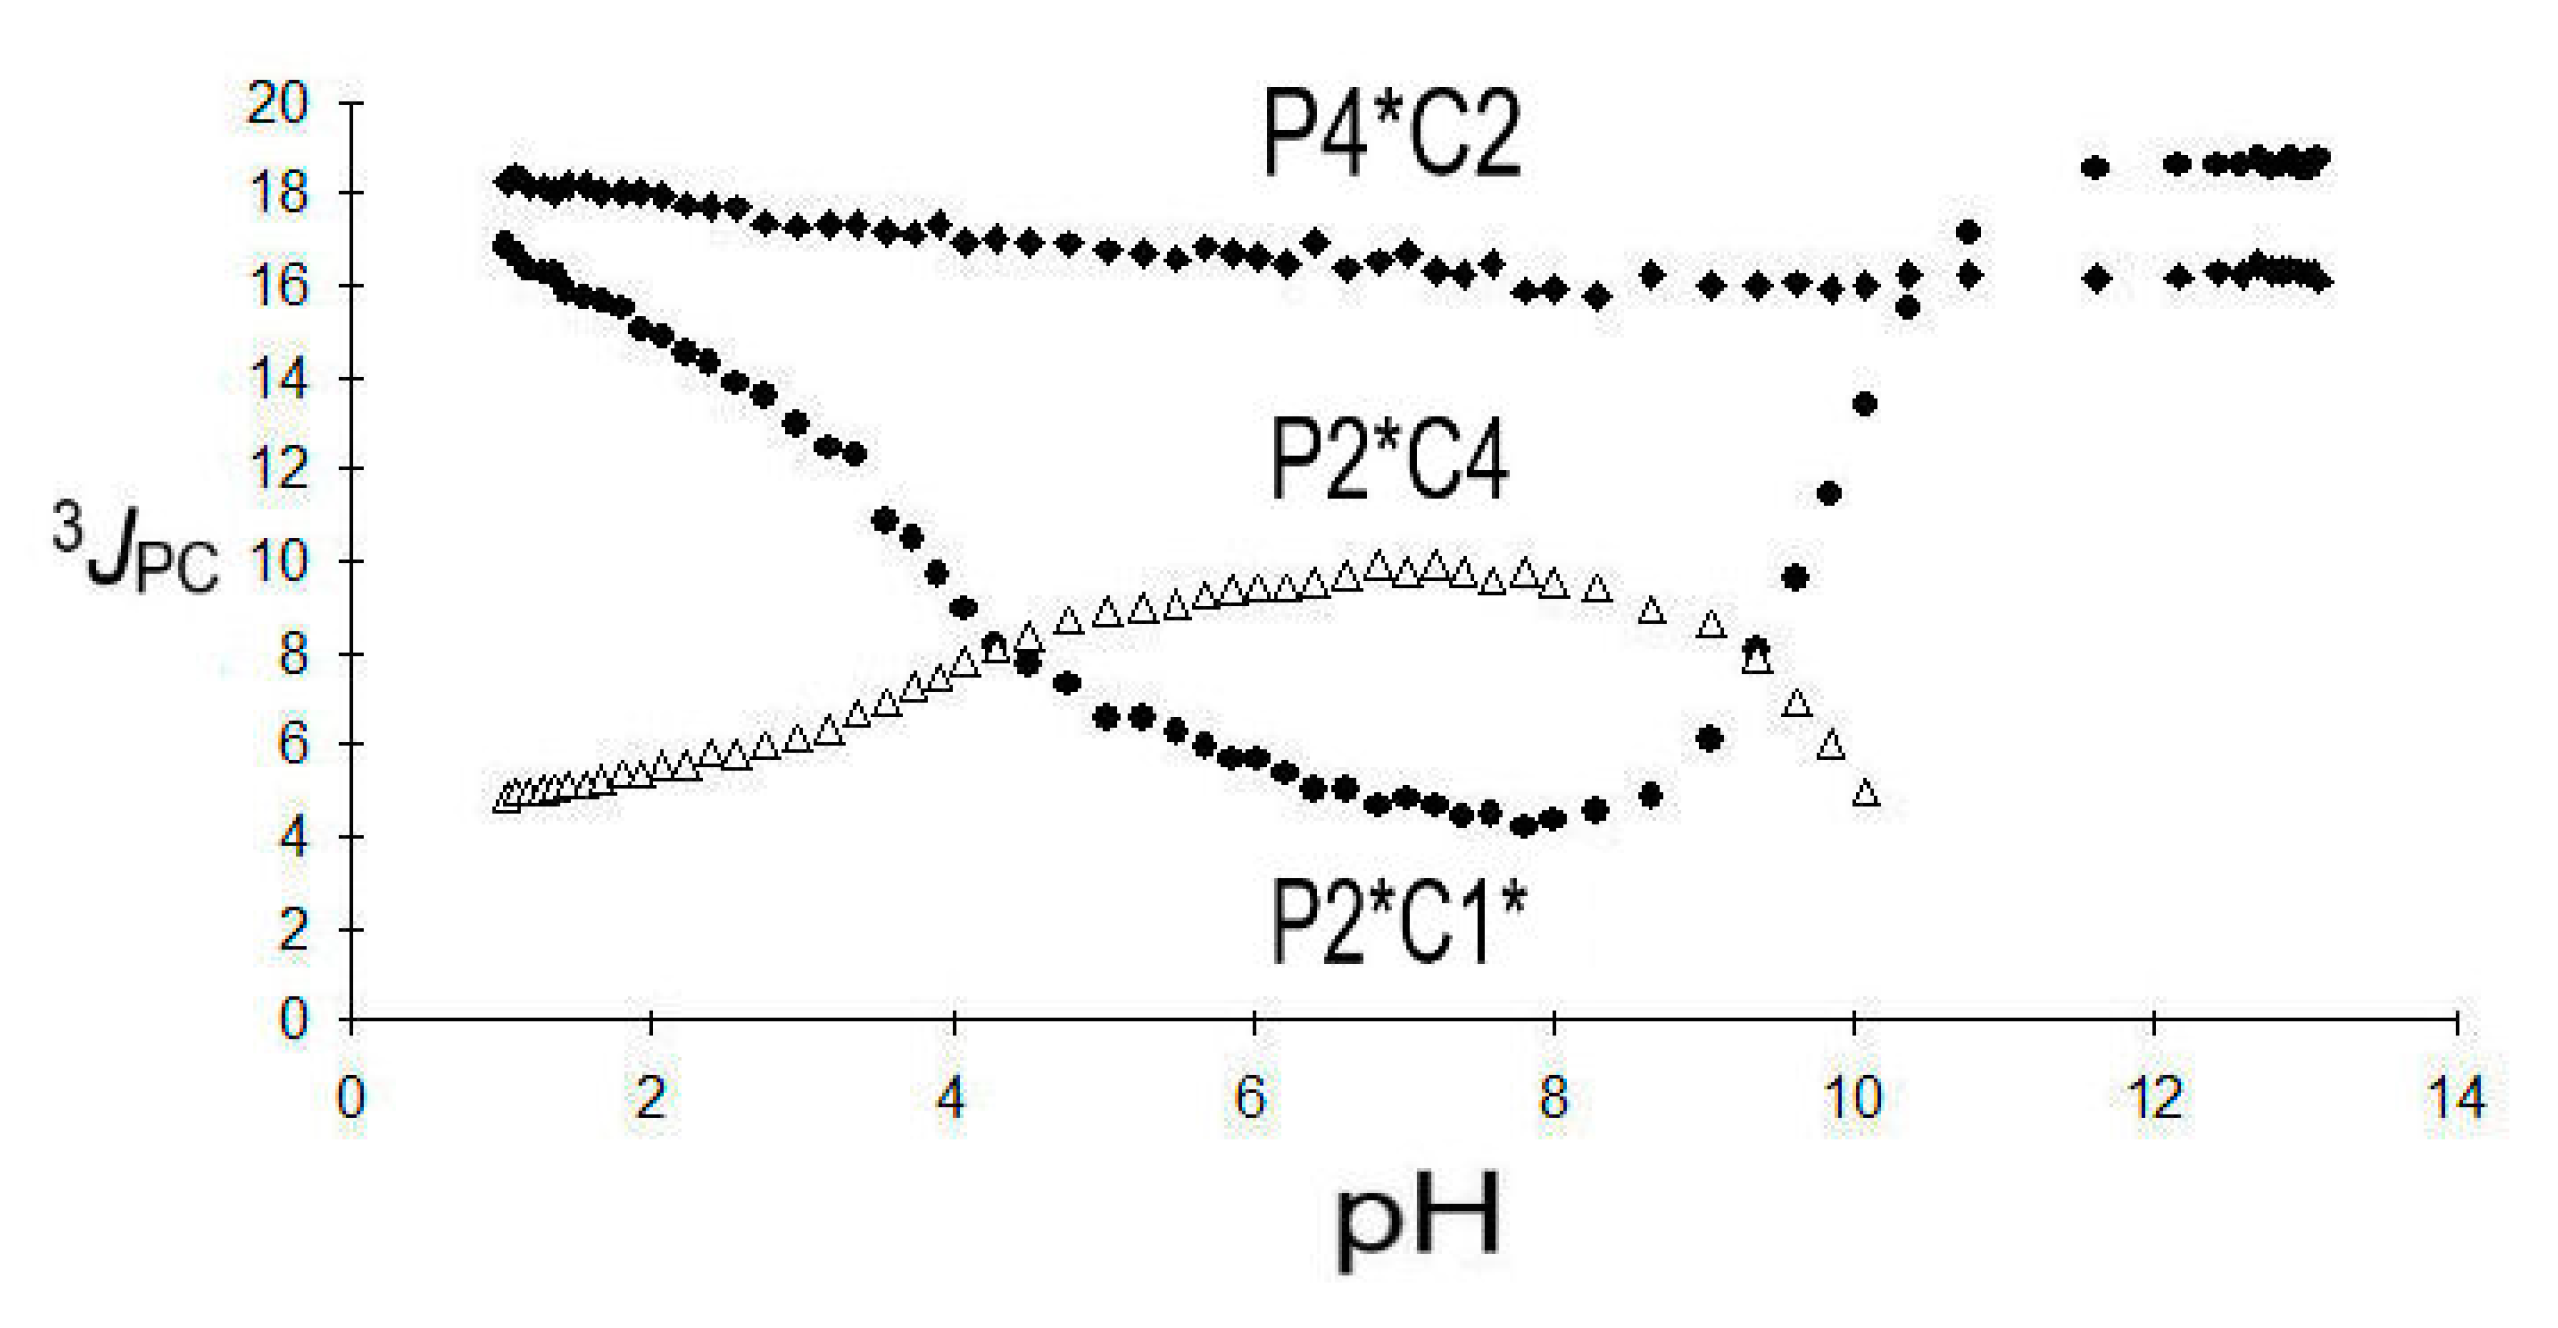
The vicinal coupling 3JPC (P2*C1*) is remarkably sensitive towards the protonation state (see Figure 5):
For the protolytic species H6L to H2L4− of 9, a decrease in 3JPC (P2*C1*) from 17.5 Hz down to a minimum of 4.3 Hz is observed, followed by an increase from 5.3 Hz to 18.6 Hz due to HL5− and finally L6−. Between pH = 7 and 8, a maximum of the protolytic species H2L4− is expected, while HL5− dominates around pH = 9. Those observations indicate changes of the dihedral angle of P2*-C2-C1-C1* possibly involving hydrogen bridges as indicated by Scheme 9 below:
A corresponding bridge -C1-P-O---H---O-P-C2- was discussed for the HL3− species of ethane-1,2-bisphosphonic acid [44].
2JPC (P2*C1), 2JPC (P2*C3), 2JPC (P2*C2*), and 2JPC (P4*C3) were not resolved in 13C{1H}-NMR spectra obtained by NMR-controlled titrations.
3JPC (P2*C4) shows a monotonous increase from 4.7 Hz to a maximum of 9.9 Hz for the sequence H6L to H2L4− followed by a decrease to 9.4 Hz for HL5−. This observation points towards an increase in the dihedral angle in P2*-C2-C3-C4.
3JPC (P4*C2) is less sensitive towards deprotonation but larger than 3JPC (P2*C4) and found in a range from 18.4 to 16.3 Hz possibly indicating a tendency towards trans-conformation of the fragment P4*-C4-C3-C2. For comparison, 3JPC in HOOC-(CH2)3-PO3H2 7d appeared in a corresponding range from 17.2 to 17.9 Hz.
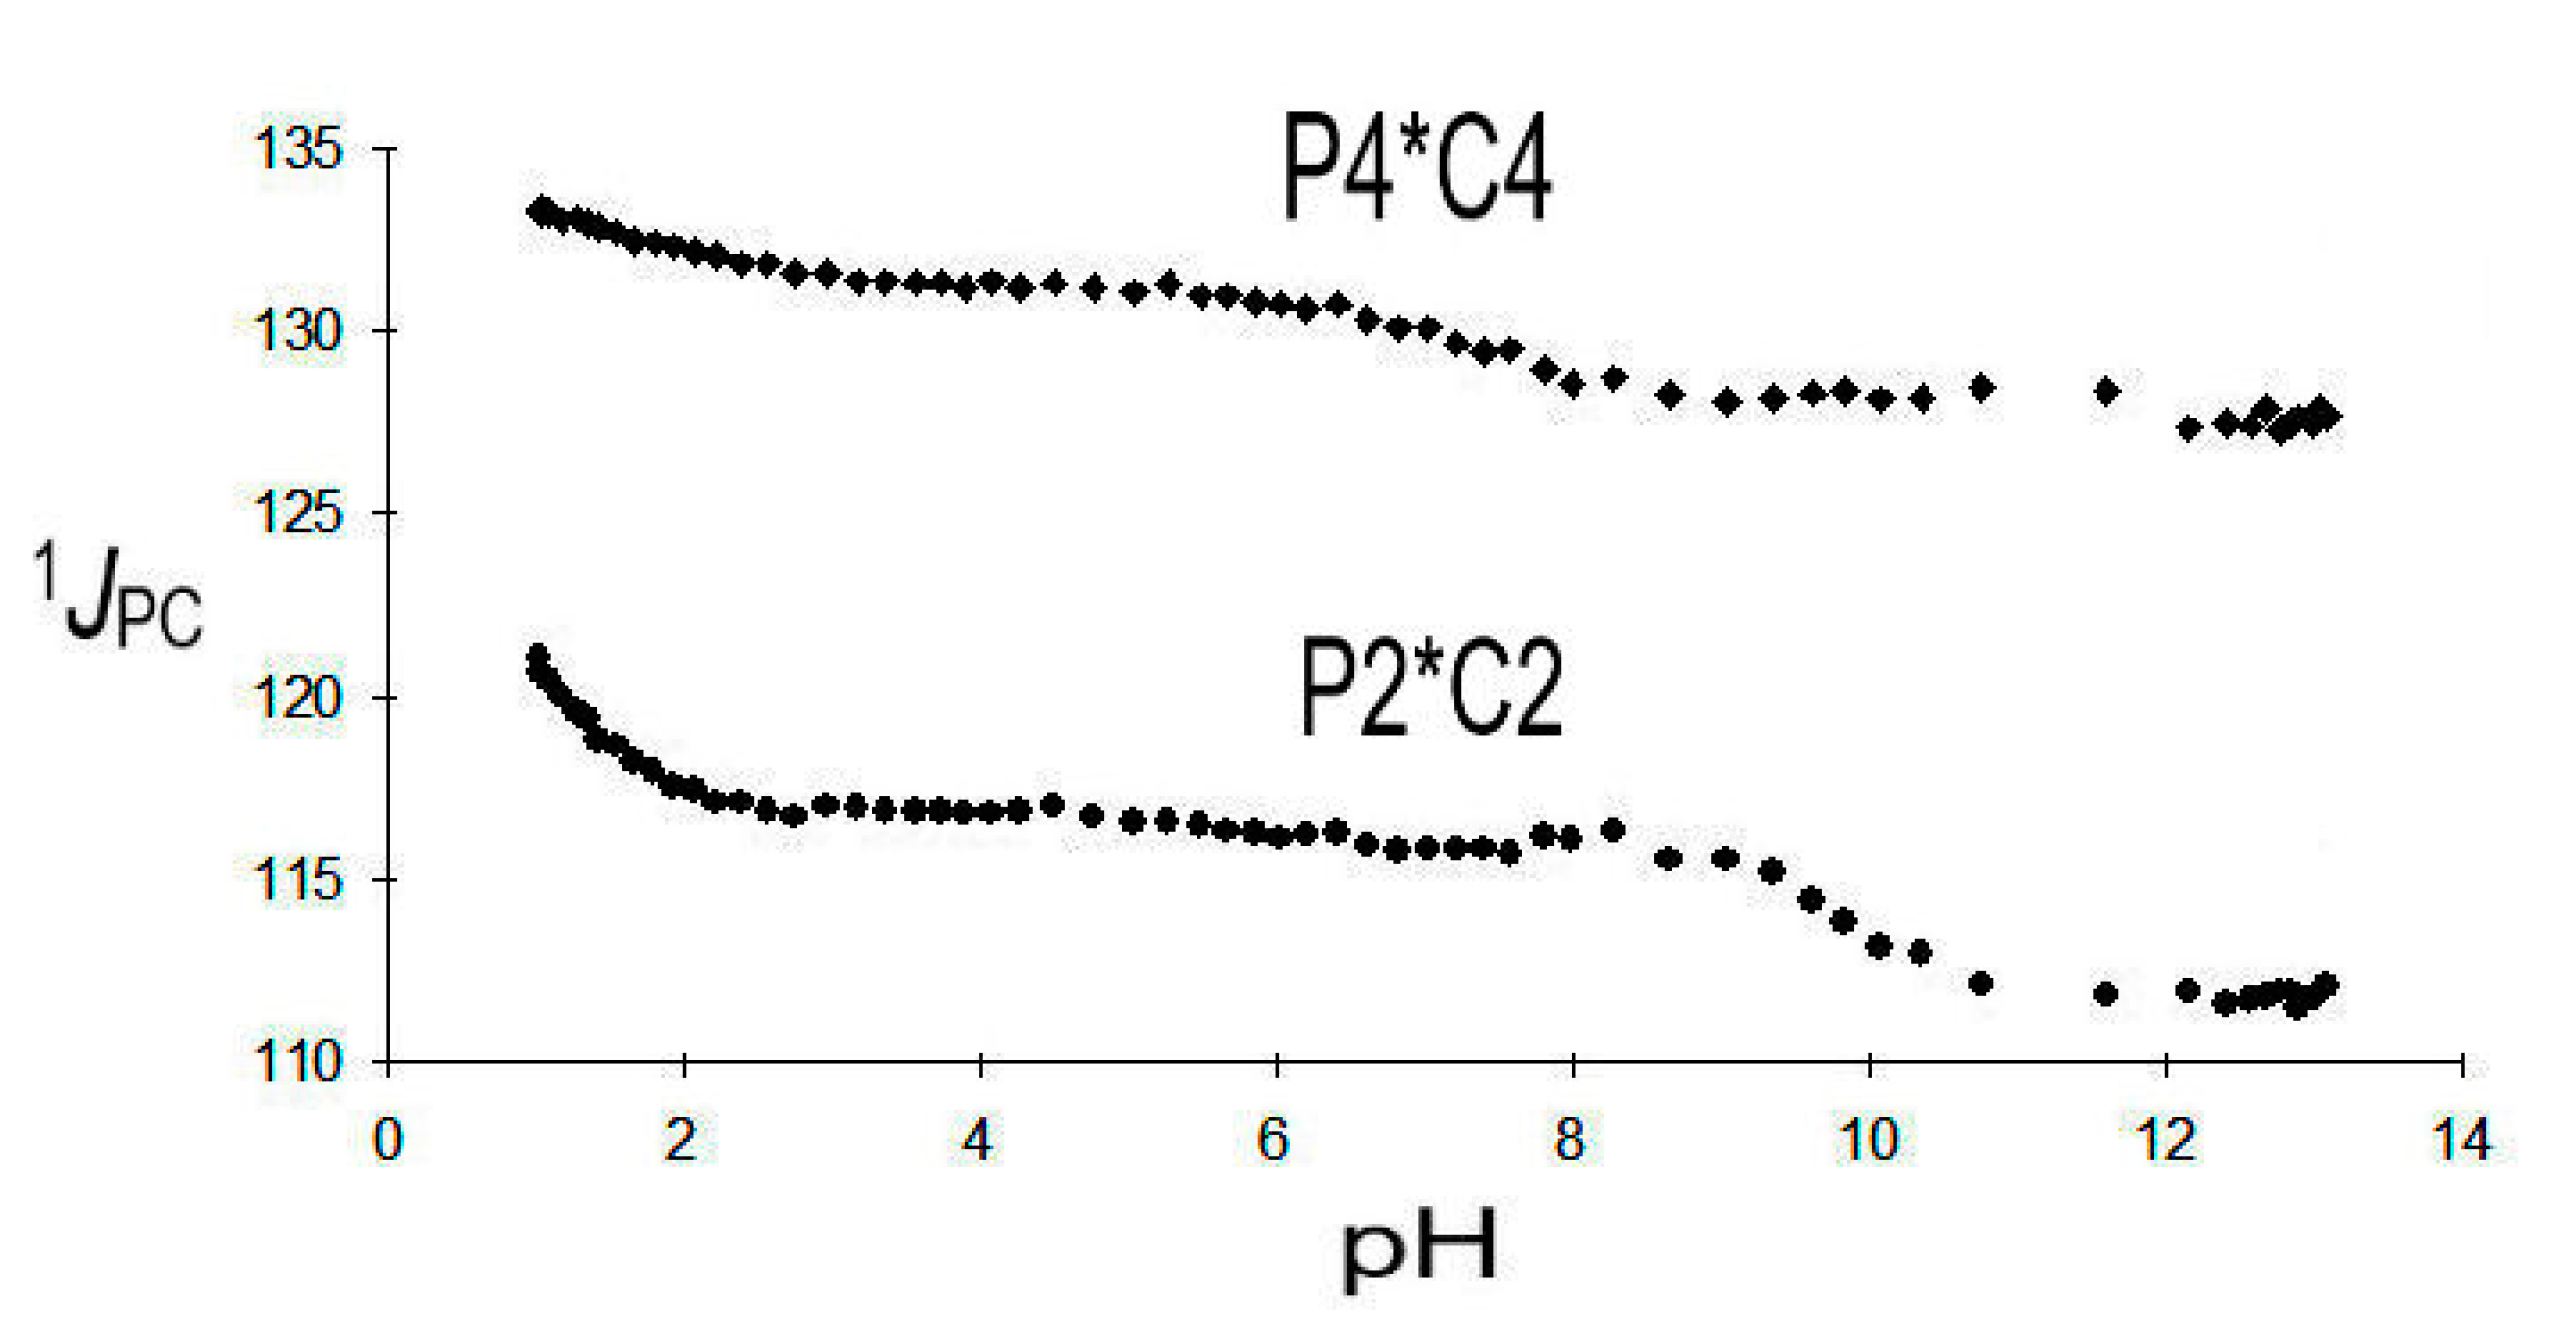
1JPC (P2*C2), ranging from 124.2 to 111.7 Hz, is markedly smaller than 1JPC (P4*C4), which is observed from 134.0 to 127.7 Hz. A 1JPC, pH diagram is given in Figure 6 below:
1JPC (P2*C2) is very indicative and selective for the deprotonation of the phosphonic functions PO3H2 → PO3H− and PO3H− → PO32−. It indicates that the first deprotonation (pK1 = 1.07) of DPBDC 9 takes place at P2* with a strong gradient Δ1 1JPC (P2*C2) = −7.4 Hz. The final deprotonation (pK6 = 11.62) is affiliated with P2* as well as indicated by Δ6 1JPC (P2*C2) = −4.1 Hz. This assignment leaves pK2 = 2.73 and pK5 = 8.95 to the deprotonation of P4*. Deprotonation at the carboxylic groups (pK3 = 4.62) and pK4 = 7.05) does not significantly affect 1JPC (P2*C2) and 1JPC (P4*C4).
Results on 1JPC (P2*C2) of 9 are consistent with observations on phosphonosuccinic acid 10, where 1JPC (P2*C2) is found in a range from 133.7 to 112.1 Hz. Strong gradients Δ1 = −17.1 Hz and Δ4 = −4.5 Hz are affiliated with the deprotonation of P2*, while deprotonations of C1* and C2* do not significantly influence 1JPC (P2*C2).
3. Conclusions
Automated NMR-controlled titrations efficiently combine 1H, 13C-, 19F-, and 31P-NMR spectroscopy with potentiometric titrations to determine dissociation constants, specific chemicals shifts and coupling constants. Results are presented in two-dimensional plots, where NMR parameters (chemical shifts, coupling constants) are correlated with analytical parameters (pH, degree of titration τ). High digital resolution and high S/N are achieved in time- and material-saving measurements. These hyphenated techniques are powerful instruments to identify the structure and purity of research and industrial compounds. Limitations of accuracy due to the nature of glass electrodes occur at very low and very high pH values, obscuring the lower and higher pKi values. In those situations, single sample NMR methods are recommended. 13C{1H}-NMR-controlled titrations may be used for conformational analysis. For more complicated structures, additional studies using pH-dependent high-resolution 1H- and 1H{31P}-NMR spectra, X-ray diffraction of selected salts and molecular modelling of acids and anions are needed to solve details of conformational problems. The latter topics are laborious and beyond the scope of this paper.
4. Experimental
Funding
Our research was supported by Fonds der Chemischen Industrie e. V. (VCI), Frankfurt am Main, Germany, and by the German-Israeli Foundation (GIF), Jerusalem, Israel, Research Grant I-316-186-05/93. Material and technical help was obtained from BRUKER Spectrospin, Rheinstetten, Germany, and from SCHOTT Geräte GmbH, Hofheim, Germany.
Acknowledgments
α-Ala-P 1 and β-Ala-P 2 were obtained from R. Tyka and P. Mastalerz, Wroclaw, Poland. E. Breuer, Jerusalem, Israel, provided LiOOC-CH2-nFn-PO3Li2 (n = 0 to 2). Technical compounds were obtained from BAYER AG, Leverkusen, Germany, (PBS, PPTC, PBTC, DPBDC, CH3-CH2-nFn-PO(O)(OMe)2), HENKEL AG, Düsseldorf, Germany (PPTC), BOZZETTO, Bergamo, Italy (NTMP, EDTMP, DETPMP), and via K. Kellner, Halle, Germany (FOSCARNET). T. Clark, Erlangen, Germany, kindly provided VAMP 4.4 for CONVEX 220 (1989). Special thanks are due to members of the Düsseldorf team, M. Grzonka, M. Batz, J. Peters, A. Bier, H. J. Majer, J. Ollig, I. Reimann, C. Arendt, S. Hermens, and Z. Szakács, for dedicated cooperation and discussions concerning preparative, analytical and NMR studies including development of novel hardware and software.
Conflicts of Interest
The author declares no conflict of interests.
References and Notes
- Van Wazer, J.R.; Callis, C.F.; Shoolery, J.N.; Jones, R.C. Principles of Phosphorus Chemistry. II. Nuclear Magnetic Resonance Measurements. J. Am. Chem. Soc. 1956, 78, 5715–5726. [Google Scholar] [CrossRef]
- Crutchfield, M.M.; Callis, C.F.; Irani, R.R.; Roth, G.C. Phosphorus Nuclear Magnetic Resonance Studies of Ortho and Condensed Phosphate. Inorg. Chem. 1962, 1, 813–817. [Google Scholar] [CrossRef]
- Hagen, R.; Roberts, J.D. Nuclear Magnetic Resonance Spectroscopy. 13C Spectra of Aliphatic Carboxylic Acids and Carboxylate Anions. J. Am. Chem. Soc. 1969, 91, 4504–4514. [Google Scholar] [CrossRef]
- Heubel, P.-H.; Popov, A.I.J. Acid Properties of Some Phosphonocarboxylic Acids. Sol. Chem. 1979, 8, 615–625. [Google Scholar] [CrossRef]
- Appleton, T.G.; Hall, R.J.; Harris, A.D.; Kimlin, H.A.; McMahon, I.J.N.M.R. Study of Acid-Base Equilibria of Aminoalkylphosphonic Acids, +NH3(CH2)nPO3H− (n = 1, 2, 3); Evidence for Cyclization in Solution. Austr. J. Chem. 1984, 37, 1833–1840. [Google Scholar] [CrossRef]
- Appleton, T.G.; Hall, R.J.; McMahon, I.J. NMR Spectra of Iminobis(methylenebisphosphonic acid), HN(CH2PO3H2)2 and Related Ligands and of Their Complexes with Platinum(II). Inorg. Chem. 1985, 25, 726–734. [Google Scholar] [CrossRef]
- Sawada, K.; Araki, T.; Suzuki, T. Complex Formation of Amino Polyphosphonates. 1. Potentiometric and Nuclear Magnetic Resonance Studies of Nitrilotris(methylenephosphonate) Complexes of the Alkaline Earth-Metal Ions. Inorg. Chem. 1987, 26, 1199–1204. [Google Scholar] [CrossRef]
- Sawada, K.; Araki, T.; Suzuki, T.; Doi, K. Complex Formation of Amino Polyphosphonates. 1. Stability and Structure of Nitrilotris(methylenephosphonate) Complexes of the Divalent Transitions-Metal Ions in Aqueous Solution. Inorg. Chem. 1989, 28, 2687–2688. [Google Scholar] [CrossRef]
- Sawada, K.; Kanda, T.; Naganuma, Y.; Suzuki, T. Formation and Protonation of Aminopolyphosphonate Complexes of Alkaline-earth and Divalent Transition-metal Ions in Aqueous Solution. J. Chem. Soc. Dalton Trans. 1993, 17, 2558–2562. [Google Scholar] [CrossRef]
- Sawada, K.; Myagawa, T.; Sakaguchi, T.; Doi, K. Structure and Thermodynamic Properties of Aminopolyphosphonate Complexes of the Alkaline-earth Metal Ions. J. Chem. Soc. Dalton Trans. 1993, 24, 3777–3784. [Google Scholar] [CrossRef]
- Sawada, K.; Ichikawa, T.; Uehara, K. Eight-membered chelate-ring complexes of cobalt(III)-polyamine complexes of aminopolyphosphonates in aqueous solution. J. Chem. Soc. Dalton Trans. 1996, 14, 3077–3085. [Google Scholar] [CrossRef]
- Matczak-Jon, E.; Kurzak, B.; Kamecka, A.; Sawka-Dobrowolska, W.; Kafarski, P.; Lejjczak, B. Zink(II) complexes of phosphonic acid analogues of glutamic acid. J. Chem. Soc. Dalton Trans. 1996, 3455–3464. [Google Scholar] [CrossRef]
- Matczak-Jon, E.; Kurzak, B.; Kamecka, A.; Sawka-Dobrowolska, W.; Kafarski, P. Interactions of zinc(II), magnesium(II) and calcium(II) with iminodimethylenediphosphonic acids in aqueous solutions. J. Chem. Soc. Dalton Trans. 1999, 20, 3627–3637. [Google Scholar] [CrossRef]
- Rohovec, J.; Kývala, M.; Vojtišek, P.; Hermann, P.; Lukeš, I. Synthesis, Crystal Structures, and Solution Properties of N-Methylene(phenyl)phosphinic Acid Derivatives of Cyclen and Cyclam. J. Inorg. Chem. 2000, 195–203. [Google Scholar] [CrossRef]
- Popov, K.; Popov, A.; Rönkkömäki, H.; Lajunen, L.H.J.; Hannu-Kuure, M.; Vendilo, A.; Tsirul’nikova, N. 31P, 23Na and 133Cs NMR equilibrium study of iminobis(methylenephosphonic acid) complexes with alkali metals. Inorg. Chimica Acta 2002, 344, 1–6. [Google Scholar] [CrossRef]
- Popov, A.; Rönkkömäki, H.; Popov, K.; Lajunen, L.H.J.; Vendilo, A. 31P NMR protonation equilibria study of iminobis(methylenphosphonic) acid and its derivatives at high pH. Inorg. Chimica Acta 2003, 353, 1–7. [Google Scholar] [CrossRef]
- Ohms, G.; Grossmann, G. Über die pH-Abhängigkeit der 31P- und 13C-NMR-Spektren von Cyclohexan-, Cyclohexen- und Benzenphosphonsäuren. Z. Anorg. Allg. Chem. 1987, 544, 232–240. [Google Scholar] [CrossRef]
- Rönkömäki, H.; Jokisaari, H.; Lajunen, L.H. 31P NMR and Potentiometric Studies on the Protonation of Isopropyl Esters of Chlodronic Acid. Acta Chem. Scand. 1993, 47, 331–337. [Google Scholar] [CrossRef]
- Popov, K.; Niskanen, E.; Rönkkömäki, H.; Lajunen, L.H.J. 31P NMR Study of organophosphonate protonation equilibrium at high pH. New J. Chem. 1999, 23, 1209–1213. [Google Scholar] [CrossRef]
- Szakács, Z.; Hägele, G. Accurate determination of low pK values by 1H NMR titration. Talanta 2004, 62, 819–825. [Google Scholar] [CrossRef]
- Szakács, Z.; Hägele, G.; Tyka, R. 1H/31P NMR pH indicator series to eliminate the glass electrode in NMR spectroscopic pKa determinations. Anal. Chim. Acta 2004, 522, 247–258. [Google Scholar] [CrossRef]
- Popov, K.; Rönkkömäki, H.; Lajunen, L.H. Guidelines for The NMR Measurements for Determination of High And Low pKa Values. Pure Appl. Chem. 2006, 78, 663–675. [Google Scholar] [CrossRef]
- Yesinowski, J.P.; Sunberg, R.J.; Benedict, J.J. pH Control and Rapid Mixing in Spinning NMR Samples. J. Magn. Res. 1982, 47, 85–90. [Google Scholar] [CrossRef]
- Glaser, J.; Henriksson, U.; Klason, T. A 205 TL NMR Titration Study of the Complex Formation between Tl(I) and Cl- in Aqueous Solution. Acta Chem. Scand. 1986, A40, 344–349. [Google Scholar] [CrossRef]
- Li, W. Gravity-driven pH adjustment for site-specific protein pKa measurement by solution-state NMR. Meas. Sci. Technol. 2017, 28. [Google Scholar] [CrossRef]
- Hägele, G.; Grzonka, M.; Kropp, H.-W.; Ollig, J.; Spiegl, H. Phosphonic and phosphinic acids: Monitoring protolytic and complex formation equilibria by titration dependent stopped-flow-NMR-techniques. Phosphorus Sulfur Silicon 1993, 77, 85–88. [Google Scholar] [CrossRef]
- Hägele, G.; Varbanov, S.; Ollig, J.; Kropp, H.-W. Aminomethylphosphine Oxides: Synthesis, Dissociation and Stability Constants, 31P{1H}-NMR-controlled Titration. Z. Anorg. Allg. Chemie 1994, 620, 914–920. [Google Scholar] [CrossRef]
- Hägele, G. 31P NMR controlled titrations of Phosphorus-Containing Acids and Bases in Protolysis and Complex Formation. In Phosphorus-31 NMR Spectral Properties in Compound Characterization and Structural Analysis; Quin, L.D., Verkade, J.G., Eds.; VCH Publishers: New York, NJ, USA, 1994; Chapter 30; pp. 395–409. [Google Scholar]
- Hägele, G.; Ollig, J. NMR-controlled titrations of phosphorus containing acids and bases. Comput. Chem. 1995, 19, 287–294. [Google Scholar]
- Ahrendt, C.; Hägele, G. The Photo-T-Concept: Hard- and software combination for the determination of macroscopic and microscopic dissociation constants. Comput. Chem. 1995, 19, 263–268. [Google Scholar] [CrossRef]
- Hägele, G.; Szakács, Z.; Ollig, J.; Hermens, S.; Pfaff, C. NMR-Controlled Titrations: Characterizing Aminophosphonates and Related Structures. Heteroat. Chem. 2000, 11, 562–582. [Google Scholar] [CrossRef]
- Hägele, G.; Grzonka, M.; Peters, J.; Spiegl, H.; Kropp, H.W.; Ollig, J.; Hermens, S.; Augner, S.; Uhlemann, C.; Pfaff, C.; et al. NMR-Controlled Titrations—Principles and Progress: Monitoring Protonation and Complex Formation Equilibria in Aqueous Solutions. Available online: https://www.theresonance.com/nmr-controlled-titration-download-the-paper/ (accessed on 2 September 2019).
- Pfaff, C.G. Softwareentwicklung zur Auswertung und Visualisierung Kernresonanzspektroskopisch Kontrollierter Titrationen. Ph.D. Thesis, Heinrich-Heine-Universität, Düsseldorf, Germany, 2002. [Google Scholar]
- Peters, M.; Siegfried, L.; Kaden, T.A. pH-metric and NMR studies of complexation of Zn2+, Cd2+ and Pb2+ with diazacrown ethers having dangling phosphonate groups. J. Chem. Soc. Dalton Trans. 2000, 24, 4664–4668. [Google Scholar] [CrossRef]
- Rabenstein, D.L.; Sayer, T.L. Determination of Microscopic Acid Dissociation Constants by Nuclear Magnetic Resonance Spectrometry. Anal. Chem. 1976, 48, 1141–1146. [Google Scholar] [CrossRef]
- Szakacs, Z.; Kraszni, M.; Noszal, B. Determination of microscopic acid-base parameters from NMR-pH titrations. Anal. Bioanal. Chem. 2004, 378, 1428–1448. [Google Scholar] [CrossRef]
- Szakacs, Z. NMR-Titrationen und neue Auswertekonzepte zur Aufklärung der Mikroskopischen Dissoziation und der pH-abhängigen Konformation von Biorelevanten Phophinsäuren und Carnosinderivaten. Ph.D. Thesis, Heinrich-Heine-Universität, Düsseldorf, Germany, 2002. [Google Scholar]
- Kývala, M.; Lukeš, I. Chemometrics 95. In Book of Abstracts, Proceedings of the 4th International Chemometrics Conference of the Czech Chemical Society, Pardubice, Czech Republic, 3–7 July 1995; University of Pardubice: Pardubice, Czech Republic, 1995; p. 63. [Google Scholar]
- Augner, S.; Kehler, J.; Szakács, Z.; Breuer, E.; Hägele, G. Ring-chain tautomerism and protolytic equilibria of 3-hydroxy-3-phosphonoisobenzo-furanone studied by 1H-, 13C-, and 31P-NMR-controlled titrations. New J. Chem. 2008, 32, 1608–1616. [Google Scholar] [CrossRef]
- Augner, S. Neue Entwicklungen zur Durchführung automatisierter NMR-Kontrollierter Titrationen von Phosphon- und Phosphinsäuren. Ph.D. Thesis, Heinrich-Heine-Universität, Düsseldorf, Germany, 2002. [Google Scholar]
- Kropp, H.-W.; Hägele, G. Unpublished results from my student Kropp. Interested readers may contact G. Hägele. Unpublished work. 1994. [Google Scholar]
- Lindner, A. 1-Phosphonopropan-1,2,3-tricarbonsäure—NMR- und Konformationsanalytische Untersuchungen. Ph.D. Thesis, Heinrich-Heine-Universität, Düsseldorf, Germany, 2000. [Google Scholar]
- Hägele, G. NMR-controlled titrations characterizing organophosphorus compounds. Phosphorus Sulfur Silicon Relat. Elem. 2019, 194, 361–363. [Google Scholar]
- Ollig, J. Untersuchungen zur Titrationsabhängigen Kernresonanzspektroskopie. Ph.D. Thesis, Heinrich-Heine-Universität, Düsseldorf, Germany, 1996. [Google Scholar]
- Robitaille, P.-M.L.; Robitaille, P.A.; Brown, G.G., Jr.; Brown, G.G. An Analysis of the pH-Dependent Chemical-Shift Behavior of Phosphorus-Containing Metabolites. J. Magn. Res. 1991, 91, 73–84. [Google Scholar] [CrossRef]
- Popov, K.; Rönkkömäki, H.; Lajunen, L.J.J. Critical evaluation of stability constants of phosphonic acids. Pure Appl. Chem. 2001, 73, 1641–1677. [Google Scholar] [CrossRef]
- Clark, T.; Alex, A.; Beck, B.; Chandrasekhar, J.; Gedeck, P.; Horn, A.H.C.; Hutter, M.; Martin, B.; Rauhut, G.; Sauer, W.; et al. VAMP 4.4; Universität Erlangen-Nürnberg: Erlangen, Germany, 1990. [Google Scholar]
- Wozniak, M.; Nowogrocky, G. Acidites et complexes des acides (alkyl- et aminoalkyl-) phosphoniques—I: Determination potentiometrique des constantes d’acidite par affinement multiparametrique: Prise en compte de l’impurete carbonate. Talanta 1979, 26, 1135–1141. [Google Scholar] [CrossRef]
- Mohan, M.S.; Abbott, E.H. Metal complexes of biologically occurring aminophosphonic acids. J. Coord. Chem. 1978, 8, 175–182. [Google Scholar] [CrossRef]
- Kiss, T.; Balla, J.; Nagy, G.; Kozzlowski, H.; Kowalik, J. Complexes of aminophosphonates. I. Transition metal complexes of aminophosphonic acid analogues of α-alanine, β-alanine, phenylalanine and tyrosine. Inorg. Chim. Acta 1987, 138, 25–30. [Google Scholar] [CrossRef]
- Kropp, H.-W.; Hägele, G. Analytische und NMR-spektroskopische Untersuchungen an Organophosphorsäuren. Unpublished work.
- Burton, D.J.; Sprague, L.G.; Pietrzyk, D.J.; Edelmuth, S.H. A Facile Synthesis of Difluorophosphonoacetic Acid. J. Org. Chem. 1984, 49, 3437–3438. [Google Scholar] [CrossRef]
- Bier, A. Computereinsatz in der Analytischen Chemie zur Untersuchung von Protolyse- und Komplexbildungs-Gleichgewichten am Beispiel der Phosphonocarbonsäuren. Ph.D. Thesis, Heinrich-Heine-Universität, Düsseldorf, Germany, 1993. [Google Scholar]
- Rabenstein, D.L.; Sayer, T.L. Carbon-13 Chemical Shift parameters for Amines, Carboxylic Acids, and Amino Acids. J. Magn. Res. 1978, 24, 27–39. [Google Scholar] [CrossRef]
Scheme 1.
Showing 3-hydroxy-3-phosphonoisobenzofuranone H3L and its terminal anion L3−.

Scheme 2.
Phosphonic acids: methanephosphonic 1 and phenylphosphonic acid 2.
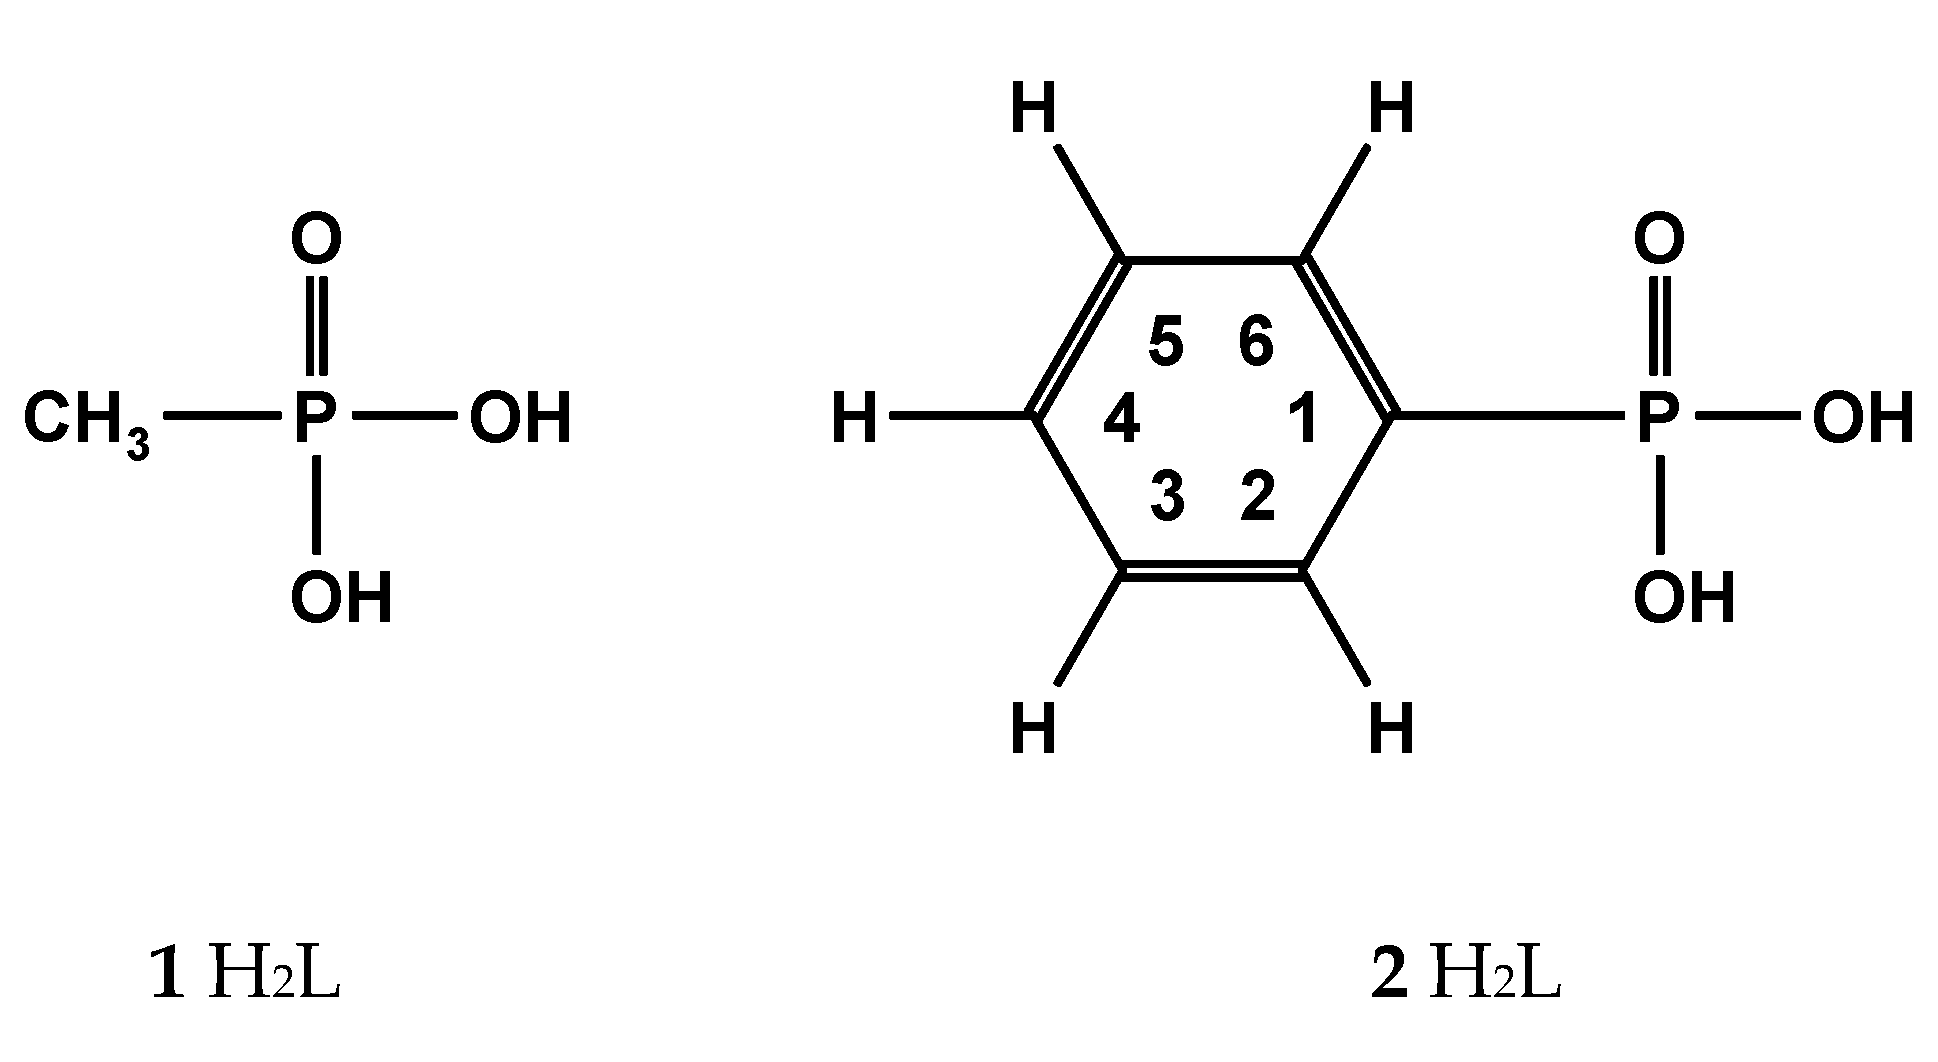
Figure 1.
1H-coupled 31P-NMR-controlled titration of methanephosphonic acid 1 vs. NaOH. Note: quartet fine structure from X-part of AX3 system of P-CH3 fragment. X-axis: δP [ppm]. Y-axis: degree of titration τ.
Figure 1.
1H-coupled 31P-NMR-controlled titration of methanephosphonic acid 1 vs. NaOH. Note: quartet fine structure from X-part of AX3 system of P-CH3 fragment. X-axis: δP [ppm]. Y-axis: degree of titration τ.

Figure 2.
13C{1H}-NMR-controlled titration of phenylphosphonic acid 2 vs. KOH yielded a contour plot for chemical shift δC as a function of the degree of titration τ. X-axis: δC [ppm]. Y-axis: degree of titration τ.
Figure 2.
13C{1H}-NMR-controlled titration of phenylphosphonic acid 2 vs. KOH yielded a contour plot for chemical shift δC as a function of the degree of titration τ. X-axis: δC [ppm]. Y-axis: degree of titration τ.

Scheme 3.
Aminophosphonic acids 3 to 5.

Scheme 4.
Specific chemical shifts δP [ppm] derived from the 31P{1H}-NMR-controlled retro titration of p-aminophenylphosphonic acid 5. Δ2 = +3.13 ppm. Δ3 = −2.59 ppm.
Scheme 4.
Specific chemical shifts δP [ppm] derived from the 31P{1H}-NMR-controlled retro titration of p-aminophenylphosphonic acid 5. Δ2 = +3.13 ppm. Δ3 = −2.59 ppm.

Scheme 5.
Phosphonocarboxylic acids 7a to 7d.

Figure 3.
(a) 13C{1H}-NMR-controlled titration of 3-phosphonopropionic acid 7c vs. NaOH. Contour plot showing the range of the carboxylic carbon C1. For experimental data, see Table 10. X-axis: δC [ppm]. Y-axis: degree of titration τ; (b) 13C{1H}-NMR-controlled titration of 3-phosphonopropionic acid 7c vs. NaOH. Contour plot showing the range of the aliphatic carbons C2 and C3. For experimental data, see Table 10. X-axis: δC [ppm]. Y-axis: degree of titration τ; (c) 81 MHz 31P{1H}-NMR-controlled titration of 3-phosphonopropionic acid 7c vs. NaOH X-axis: δP [ppm]. Y-axis: degree of titration τ. CTitrand: 0.010 mol/L of 7c. CTitrator: 0.10 mol/L TMAOH. Digital resolution: 0.6 Hz/point in x-axis. [51].


Scheme 6.
Trilithium salts LiOOC-CH2-nFn-PO3Li2 8a and 8b and free acids HOOC-CH2-nFn-PO3H2 8c and 8d.
Scheme 6.
Trilithium salts LiOOC-CH2-nFn-PO3Li2 8a and 8b and free acids HOOC-CH2-nFn-PO3H2 8c and 8d.
Scheme 7.
Spin enumeration in DPBDC 9 used for 13C{1H}-NMR C1* and C2* = COOH, COO−. P2* and P4* = PO3H2, PO3H−, PO32−.
Scheme 7.
Spin enumeration in DPBDC 9 used for 13C{1H}-NMR C1* and C2* = COOH, COO−. P2* and P4* = PO3H2, PO3H−, PO32−.

Figure 4.
(a) The carboxylate functions C1* (note: 3JPC) and C2*. δC = 186 to 177 ppm; (b) The skeleton carbon C2 (note: 1JPC and 3JPC). δC = 56 to 50 ppm.; (c) The skeleton carbon C1. δC = 44 to 38 ppm; (d) The skeleton carbons C3 and C4 (note: 1JPC). δC = 32 to 23 ppm.
Figure 4.
(a) The carboxylate functions C1* (note: 3JPC) and C2*. δC = 186 to 177 ppm; (b) The skeleton carbon C2 (note: 1JPC and 3JPC). δC = 56 to 50 ppm.; (c) The skeleton carbon C1. δC = 44 to 38 ppm; (d) The skeleton carbons C3 and C4 (note: 1JPC). δC = 32 to 23 ppm.


Scheme 8.
Phosphonopolycarboxylic acids 10 to 12 used for comparative 13C{1H}-NMR-controlled titrations.
Scheme 8.
Phosphonopolycarboxylic acids 10 to 12 used for comparative 13C{1H}-NMR-controlled titrations.

Figure 5.
Three coupling constants 3JPC (P2*C1*), 3JPC (P2*C4), and 3JPC (P4*C12) in DPBDC 9.
Scheme 9.
Tentative hydrogen bridges for protolytic species H3L3− to HL5−.
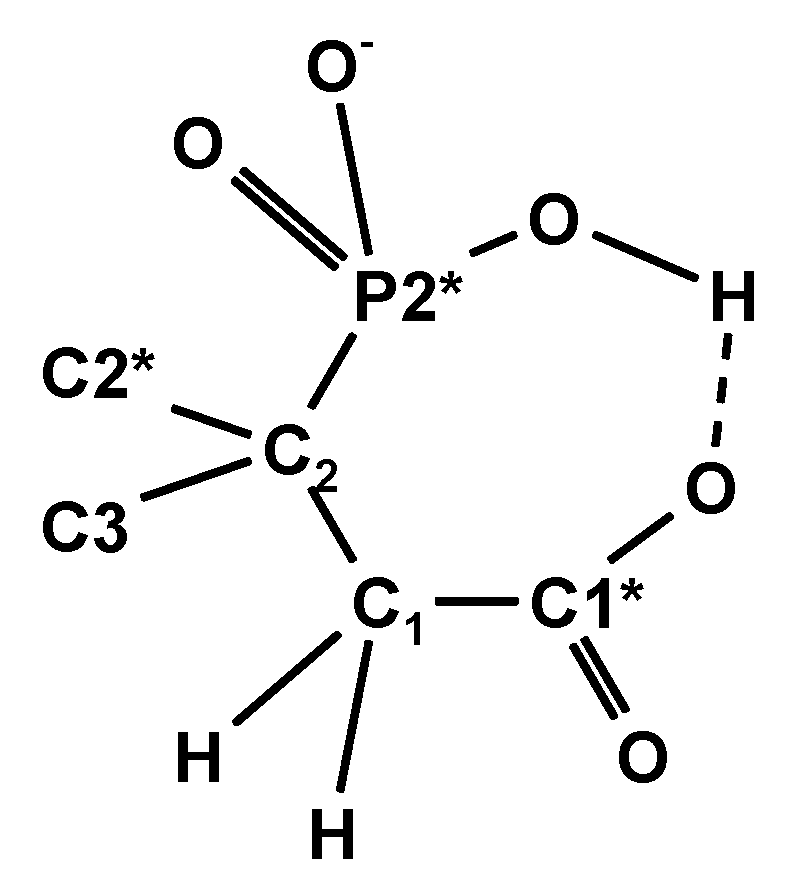
Figure 6.
1JPC (P2*C2) and 1JPC (P4*C4) of DPBDC 9.


Table 1.
Some examples for NMR-controlled titrations of phosphonic acids, phosphinic acids, and carboxylic acids as discussed in [32]. 1) Retro titration; 2) Micro dissociation; 3) Second-order 1H-NMR spin systems.
Table 1.
Some examples for NMR-controlled titrations of phosphonic acids, phosphinic acids, and carboxylic acids as discussed in [32]. 1) Retro titration; 2) Micro dissociation; 3) Second-order 1H-NMR spin systems.
| Examples | NMR | Remarks |
|---|---|---|
| Phosphonic acids | ||
| CH3P(O)(OH)2 | 31P{1H} | |
| LiOOC-CH2-P(O)(OLi)2 | 31P{1H} | 1) |
| (HO)2(O)P-CH2-CH2-P(O)(OH)2 | 13C{1H} | |
| CH3-C(OH)[P(O)(OH)2]2, HEDP, etidronic acid | 31P{1H} | |
| NH2-CH2-CH2-C(OH)(P(O)(OH)2)2, pamidronic acid | 31P{1H} | |
| HOOC-CH2-CH(COOH)-CH(COOH)-P(O)(OH)2, PPTC | 31P{1H} | |
| Phosphinic acids | ||
| (CH3)2P(O)OH | 31P{1H} | |
| HOOC-CH2-CH2-P(CH3)(O)OH | 13C{1H}, 1H | 2) |
| HO(O)(CH3)P-CH2-CH2-P(CH3)(O)OH | 13C{1H} | |
| HO(O)(CH3)P-CH2-CH2-C(H)(NH2)COOH | 1H | 2, 3) |
| Carboxylic acids | ||
| CH3COOH | 13C{1H} | |
| CH(CH3)2-CH2-CH(NH2)-C(O)-NH-CH(CH3)-COOH, peptide Leu-Ala | 13C{1H} | |
| CH2=CF-CH2-C(CH3)(NH2)-COOH | 19F |
Table 2.
Specific chemical shifts δC, δP and coupling constants 1JPC and 2JPH of methanephosphonic acid 1 were obtained by 13C{1H}-, 31P{1H}-, and 31P-NMR-controlled titrations in H2O. Δi = δ(Hn-iL) − δ(Hn+1-iL) or Δi = nJPC(Hn-iL) − nJPC(Hn+1-iL), respectively. i = 1 to n. n = 2. Experimental data: CTitrand: a) 0.269 mol/L. b) 0.01220 mol. c) 0.0095 mol/L. CTitrator: a) 4.82 mol/L KOH. b) 0.0971 mol/L NaOH. c) 0.0971 mol/L NaOH. d) Early data from results from titration vs. KOH [45].
| 1 in H2O | ||||||
|---|---|---|---|---|---|---|
| Method | 13C{1H} | 31P{1H} | 31P | 31P{1H} | ||
| Exp. | a) | b) | c) | d) | ||
| Species | δC | 1JPC | δP | δP | 2JPH | δP |
| [ppm] | [Hz] | [ppm] | [ppm] | [Hz] | [ppm] | |
| H2L | 14.27 | 135.92 | 33.03 | 33.03 | −17.65 | 31.76 |
| HL− | 15.53 | 133.82 | 24.79 | 24.79 | −16.52 | 24.94 |
| L2− | 16.61 | 129.95 | 21.08 | 21.08 | −15.52 | 20.94 |
| Gradients | δC | 1JPC | δP | δP | 2JPH | δP |
| Δ1 | 1.26 | −2.10 | −8.24 | −8.24 | 1.13 | |
| Δ2 | 1.08 | −3.87 | −3.71 | −3.71 | 1.00 | |
| pKi | ||||||
| pK1 | 2.27 | 2.06 | 2.00 | 2.33 | ||
| pK2 | 7.85 | 7.66 | 7.68 | 7.78 | ||
Table 3.
Specific chemical shifts δP [ppm], gradients [ppm] and dissociation constants pKi from 31P{1H}-NMR-controlled titration of phenylphosphonic acid 2 vs. TMAOH and NaOH. Exp.: CTitrator: a) 0.09894 mol/L TMAOH. b) 0.09925 mol/L NaOH. CTitrand: a) 0.02 mol/L 3. b) 0.008 mol/L 2. Shifts and gradients given in ppm.
| Phenylphosphonic Acid 2 | ||
|---|---|---|
| vs. TMAOH | vs. NaOH | |
| a) | b) | |
| δP(H2L) | 18.39 | 17.77 |
| δP(HL−) | 13.77 | 13.75 |
| δP(L2−) | 11.69 | 11.72 |
| Δ1 | −4.62 | −4.02 |
| Δ2 | −2.08 | −2.03 |
| pK1 | 1.74 | 1.86 |
| pK2 | 7.28 | 7.16 |
Table 4.
Specific chemical shifts δC [ppm] and coupling constants nJPC (n = 1 to 4) [Hz] for the 13C{1H}-NMR-controlled titration of phenylphosphonic acid 2 vs. KOH. pK1 = 1.75. pK2 = 6.92. Experimental data: CTitrand: a) 0.237 mol/L 2. CTitrator: 4.53 mol/L KOH.
Table 4.
Specific chemical shifts δC [ppm] and coupling constants nJPC (n = 1 to 4) [Hz] for the 13C{1H}-NMR-controlled titration of phenylphosphonic acid 2 vs. KOH. pK1 = 1.75. pK2 = 6.92. Experimental data: CTitrand: a) 0.237 mol/L 2. CTitrator: 4.53 mol/L KOH.
| δC and nJPC for Species | Gradients | ||||
|---|---|---|---|---|---|
| Parameters | H2L | HL− | L2− | Δ1 | Δ2 |
| δC C1 | 133.66 | 138.15 | 143.83 | +4.48 | +5.69 |
| δC C2/6 | 133.68 | 133.45 | 133.43 | −0.24 | −0.02 |
| δC C3/5 | 131.99 | 131.59 | 130.95 | −0.40 | −0.64 |
| δC C4 | 135.66 | 134.03 | 131.98 | −1.58 | −2.06 |
| 1JPC | 183.48 | 177.02 | 167.32 | −6.46 | −9.70 |
| 2JPC | 10.51 | 9.72 | 8.79 | −0.79 | −0.93 |
| 3JPC | 14.84 | 13.90 | 12.65 | −0.94 | −1.25 |
| 4JPC | 3.08 | 2.91 | 2.74 | −0.17 | −0.17 |
Table 5.
Macroscopic and microscopic dissociation species of aminophosphonic acids.
| Dissociation Species | ||
|---|---|---|
| Macroscopic | Microscopic | |
| H3L+ | +NH3-R-PO3H2 | |
| H2L | +NH3-R-PO3H− | NH2-R-PO3H2 |
| HL− | +NH3-R-PO32− | NH2-R-PO3H− |
| L2− | NH2-R-PO32− | |
Table 6.
Macroscopic dissociation constants pKi of compounds α-Ala-P 3 and β-Ala-P 4 obtained by 13C{1H}- and 31P{1H}-NMR-controlled titrations and by potentiometric titrations [4a]. Note: pK3 − pK2 > 3 and pK2 − pK1 > 3 for compounds 3 and 4. Exp.: 3: CTitrand: a) 0.0867 mol/L 3 + 0.0834 mol/L HNO3. b) and c) 0.005 mol/L 3 + 0.00476 HNO3 + 0.0917 mol/L NaNO3. CTitrator: a) 3.98 mol/L NaOH. b) and c): 0.100 mol/L NaOH. 4: CTitrand: d) 0.139 mol/L 4 + 0.139 mol/L HNO3. e) 0.010 mol/L 4 + 0.010 mol/L HNO3. f) 0.010 mol/L 4 + 9.747 mmol/L HNO3. g) 0.005 mol/L 4 + 0.005 mol/L HNO3 + 0.100 mol/L TMACl. CTitrator: d) 0.98 mol/L NaOH. e): 0.0991 mol/L TMAOH. f): 0.0993 mol/L NaOH. g): 0.099 mol/L TMAOH.
| 3 | 4 | ||||||
|---|---|---|---|---|---|---|---|
| 13C{1H} a | 31P{1H} b | Pot. c | 13C{1H} d | 31P{1H} e | 31P{1H} f | Pot. g | |
| NaOH | NaOH | NaOH | NaOH | TMAOH | NaOH | TMAOH | |
| pK1 | 0.70 | 0.31 | 0.3 | 1.02 | 1.22 | 1.26 | 1.14 |
| pK2 | 5.72 | 5.63 | 5.58 | 6.38 | 6.23 | 6.24 | 6.34 |
| pK3 | 10.64 | 10.21 | 10.28 | 11.50 | 11.06 | 11.08 | 11.06 |
Table 7.
Specific chemical shift δP [ppm] and gradients Δ [ppm] for compounds 3 to 5 [44]. *) Not iterated. Experimental details for 3 and 4 are given in Table 6. Titrator: a) NaOH; b) TMAOH; c) for 5 were used: CTitrand = 1.6953 mol/L 5 and 3.6935 mol/L TMAOH. Titrator = 0.09993 mol/L HCl.
| 3 | 4 | 5 | ||
|---|---|---|---|---|
| 31P{1H} a | 31P{1H} b | 31P{1H} a | 31P{1H} c | |
| Species | δP | δP | δP | δP |
| H3L+ | 15 * | 22.9 | 23.4 | 13 * |
| H2L | 14.92 | 19.29 | 19.36 | 12.16 |
| HL− | 13.08 | 16.80 | 16.81 | 15.29 |
| L2− | 22.25 | 19.39 | 19.72 | 12.70 |
| Gradients | ||||
| Δ1 | −0.08 | −3.61 | −4.04 | −0.84 |
| Δ2 | −1.84 | −2.49 | −2.55 | +3.13 |
| Δ3 | +9.17 | +2.59 | +3.91 | −2.59 |
Table 8.
Specific chemical shifts δC [ppm], coupling constants 1JPC [Hz], and corresponding gradients Δ for α-aminoethanephosphonic acid (α-Ala-P) 3 and β-aminoethanephosphonic acid (β-Ala-P, CILIATIN) 4. Spin enumerations: 3: C2-C1(N)-P; 4: (N)C2-C1-P. 1JPC shows a minimum for species HL− of 3 and 4. 2JPC was not resolved for compounds 3 and 4.
| 3 in H2O | 4 in H2O | |||||
|---|---|---|---|---|---|---|
| Species | δC(C1) | 1JPC | δC(C2) | δC(C1) | 1JPC | δC(C2) |
| H3L+ | 46.80 | 151.5 | 16.0 | 27.50 | 137.4 | 37.09 |
| H2L | 47.70 | 143.8 | 16.43 | 28.73 | 131.4 | 38.22 |
| HL− | 49.07 | 134.5 | 17.23 | 29.47 | 124.8 | 39.28 |
| L2− | 48.15 | 138.0 | 19.79 | 35.45 | 126.5 | 39.76 |
| Gradients | ||||||
| Δ1 | +0.9 | −8.7 | +0.43 | +1.23 | −6.0 | +1.13 |
| Δ2 | +1.37 | +9.3 | +0.80 | +0.74 | −6.6 | +1.04 |
| Δ3 | −0.92 | +3.5 | +2.55 | +5.98 | +1.3 | +0.47 |
Table 9.
Dissociation constants of compounds p-aminophenylphosphonic acid 5, phenylphosphonic acid 2, and anilinium hydrochloride 6.
Table 9.
Dissociation constants of compounds p-aminophenylphosphonic acid 5, phenylphosphonic acid 2, and anilinium hydrochloride 6.
| 5 | 2 | 6 | |
|---|---|---|---|
| pK1 | 0.44 | 1.88 | 4.68 |
| pK2 | 3.95 | 7.15 | |
| pK3 | 7.56 |
Table 10.
Dissociation constants of phosphonocarboxylic acids HOOC-(CH2)n-PO3H2 (n = 0 to 3) 7a to 7d [8,44]. Experimental data: a) CTitrand: 0.153 mol/L FOSCARNET (trisodium phosphonoformate hexahydrate), CTitrator: 2.002 mol/L HNO3, retro titration; b) CTitrand: 0.220 mol/L 7b, CTitrator: 0.980 mol/L NaOH. c) CTitrand: 0.200 mol/L 7c, CTitrator: 3.986 mol/L NaOH. d) CTitrand: 0160 mol/L 7d, CTitrator: 3.986 mol/L NaOH.
| HOOC-(CH2)n-PO3H2 | ||||||
|---|---|---|---|---|---|---|
| 7a | 7a [4] | 7b | 7c | 7c [4] | 7d | |
| n = 0 a | n = 0 | n = 1 b | n = 2 b | n = 2 | n = 3 b | |
| pK1 | 0.78 | 1.7 ± 0.1 | 1.22 ± 0.166 | 2.58 ± 0.013 | 2.26 ± 0.04 | 2.276 ± 0.006 |
| pK2 | 3.60 | 3.59 ± 0.02 | 4.942 ± 0.004 | 4.633 ± 0.004 | 4.63 ± 0.02 | 4.776 ± 0.004 |
| pK3 | 7.57 | 7.56 ± 0.02 | 8.099 ± 0.003 | 7.738 ± 0.003 | 7.75 ± 0.02 | 7.969 ± 0.003 |
Table 11.
(a). Specific chemical shifts δC [ppm] and coupling constants nJPC [Hz] of phosphonocarboxylic acids HOOC-(CH2)n-PO3H2 (n = 0 to 3) 7a to 7d. For experimental data, see preceding Table 10. Remarks: n. r. = not resolved; (b). Gradients Δi of specific chemical shifts δC [ppm] and coupling constants nJPC [Hz] of phosphonocarboxylic acids HOOC-(CH2)n-PO3H2 (n = 0 to 3) 7a to 7d. For experimental data, see preceding Table 10.
| (a) | ||||||||||
| 7 | n | Species | δC(C1) | δC(C2) | δC(C3) | δC(C4) | 1JPC | 2JPC | 3JPC | 4JPC |
| a | 0 | H3L | 176.8 | 246.6 | ||||||
| H2L− | 178.7 | 236.7 | ||||||||
| HL2− | 181.8 | 231.8 | ||||||||
| L3− | 187.3 | 220.0 | ||||||||
| b | 1 | H3L | 172.91 | 37.68 | 128.6 | n. r. | ||||
| H2L− | 175.44 | 39.30 | 117.8 | n. r. | ||||||
| HL2− | 178.85 | 41.64 | 119.2 | n. r. | ||||||
| L3− | 181.74 | 43.50 | 112.6 | n. r. | ||||||
| c | 2 | H3L | 179.25 | 30.09 | 24.51 | 138.5 | 3.6 | 17.3 | ||
| H2L− | 180.68 | 31.40 | 25.91 | 135.1 | 3.2 | 17.8 | ||||
| HL2− | 185.01 | 34.27 | 27.50 | 133.0 | 4.1 | 18.7 | ||||
| L3− | 186.71 | 35.61 | 28.99 | 130.3 | 3.6 | 19.8 | ||||
| d | 3 | H3L | 180.38 | 36.67 | 20.44 | 28.19 | 135.2 | 4.0 | 17.4 | n. r. |
| H2L− | 181.12 | 37.46 | 21.58 | 29.74 | 133.5 | 3.8 | 17.2 | n. r. | ||
| HL2− | 185.86 | 41.45 | 23.13 | 30.46 | 132.5 | 3.9 | 17.7 | n. r. | ||
| L3− | 186.41 | 42.01 | 24.08 | 31.92 | 130.1 | 3.4 | 17.9 | n. r. | ||
| (b) | ||||||||||
| 7 | n | Gradients | δC(C1) | δC(C2) | δC(C3) | δC(C4) | 1JPC | 2JPC | 3JPC | |
| a | 0 | Δ1 | +1.9 | −9.9 | ||||||
| Δ2 | +3.1 | −4.9 | ||||||||
| Δ3 | +5.5 | −11.8 | ||||||||
| b | 1 | Δ1 | +2.53 | +1.62 | −10.8 | |||||
| Δ2 | +3.41 | +2.34 | +1.4 | |||||||
| Δ3 | +2.89 | +1.86 | −6.6 | |||||||
| c | 2 | Δ1 | +1.43 | +1.31 | +1.40 | −3.4 | −0.3 | 0.5 | ||
| Δ2 | +4.33 | +2.87 | +1.59 | −2.1 | 0.9 | 0.9 | ||||
| Δ3 | +1.70 | +1.34 | +1.49 | −2.7 | −0.5 | 1.1 | ||||
| d | 3 | Δ1 | +0.74 | +0.79 | +1.14 | 1.56 | −1.7 | −0.2 | −0.2 | |
| Δ2 | +4.74 | +3.99 | +1.55 | 0.72 | −1.0 | 0.1 | 0.5 | |||
| Δ3 | +0.55 | +0.56 | +0.95 | 1.46 | −2.4 | −0.5 | 0.2 | |||
Table 12.
Gradients Δi of specific chemical shifts δP [ppm] of 7c. Experimental data: CTitrand: 0.010 mol/L of 7c. CTitrator: 0.10 mol/L TMAOH.
Table 12.
Gradients Δi of specific chemical shifts δP [ppm] of 7c. Experimental data: CTitrand: 0.010 mol/L of 7c. CTitrator: 0.10 mol/L TMAOH.
| Shifts | δP | Error |
|---|---|---|
| H3L | 29.93 | ±0.25 |
| H2L− | 24.56 | ±0.02 |
| HL2− | 25.88 | ±0.01 |
| L3− | 22.06 | ±0.01 |
| Gradients | ||
| Δ1 | −5.37 | |
| Δ2 | +1.32 | |
| Δ3 | −3.82 |
Table 13.
Dissociation constants of fluorinated phosphonocarboxylic acids HOOC-CH2-nFn-PO3H2 (8c and 8d; n = 1 and 2) obtained by the retro titration of LiOOC-CH2-nFn-PO3Li2 (8a and 8b; n = 1 and 2) vs. HClO4. Experimental data: CTitrand: 0.85 mol/L 8a or 8b resp. CTitrator: 0.3928 mol/L HClO4. No ion buffer.
| HOOC-CH2-nFn-PO3H2 | |||
|---|---|---|---|
| 8c n = 1 | 8d n = 2 | ||
| [44] | [44] | [52] | |
| pK1 | 1.05 | 0.52 | 1.30 |
| pK2 | 3.43 | 2.22 | 1.95 |
| pK3 | 7.08 | 6.36 | 6.16 |
Table 14.
Chemical shifts δF [ppm], coupling constants 2JPF [Hz] and corresponding gradients of fluorinated phosphonocarboxylic acids HOOC-CH2-nFn-PO3H2 (8c and 8d, n = 1 and 2) obtained by 19F-NMR-controlled titrations vs. HNO3 of LiOOC-CH2-nFn-PO3Li2 (8c and 8d, n = 1 and 2). For experimental data, see Table 13. δF is virtually referenced to δF(CF35Cl237Cl) = 0 ppm.
| HOOC-CH2-nFn-PO3H2 | ||||
|---|---|---|---|---|
| 8c | 8d | 8c | 8d | |
| n = 1 | n = 2 | n = 1 | n = 2 | |
| 19F | 19F | |||
| Species | δF | δF | 2JPF | 2JPF |
| H3L | −38.27 | 44.24 | 67.8 | 76.5 |
| H2L− | −38.72 | 50.24 | 65.5 | 88.6 |
| HL2− | −29.31 | 53.05 | 70.3 | 92.8 |
| L3− | −27.15 | 55.24 | 63.4 | 82.0 |
| Gradients | ||||
| Δ1 | −0.45 | +6.00 | −2.3 | +12.1 |
| Δ2 | −9.41 | +2.81 | +4.8 | +4.2 |
| Δ3 | −8.16 | +2.19 | −6.9 | −10.8 |
Table 15.
Dissociation constants of 2,4-diphosphonobutane-1,2-dicarboxylic acid (DPBDC) as obtained from 13C{1H}-NMR-controlled and potentiometric titrations vs. NaOH. * Concentrations given in mol/L.
Table 15.
Dissociation constants of 2,4-diphosphonobutane-1,2-dicarboxylic acid (DPBDC) as obtained from 13C{1H}-NMR-controlled and potentiometric titrations vs. NaOH. * Concentrations given in mol/L.
| 13C{1H} NMR [44] | Potentiometric [44] | Potentiometric [53] | |
|---|---|---|---|
| pK1 | 1.07 | 0.6 | 1.806 ± 0.066 |
| pK2 | 2.73 | 2.42 | 2.250 ± 0.021 |
| pK3 | 4.82 | 4.32 | 4.078 ± 0.005 |
| pK4 | 7.05 | 6.46 | 6.562 ± 0.004 |
| pK5 | 8.95 | 8.18 | 8.664 ± 0.006 |
| pK6 | 11.62 | 10.75 | 12.839 ± 0.007 |
| CTitrand | 0.262 (DPBDC) * | 0.0050 (DPBDC) * | 0.01119 (DPBDC) * |
| CTitrator | 3.986 (NaOH) * | 0.0975 (NaOH) * | 0.09863 (TMAOH) * |
| CIon buffer | 0 | 0.1 (NaCl) * | 0.09863 (TMANO3) * |
Table 16.
Specific chemical shifts δC [ppm], coupling constants nJPC [Hz] and gradients Δi [ppm] of 2,4-diphosphonobutane-1,2-dicarboxylic acid DPBDC 9. For experimental data, see Table 15.
Table 16.
Specific chemical shifts δC [ppm], coupling constants nJPC [Hz] and gradients Δi [ppm] of 2,4-diphosphonobutane-1,2-dicarboxylic acid DPBDC 9. For experimental data, see Table 15.
| C1 | C2 | C3 | C4 | C1* | C2* | ||||||
|---|---|---|---|---|---|---|---|---|---|---|---|
| Species | δC | δC | 1JPC | 3JPC | δC | δC | 1JPC | 3JPC | δC | 3JPC | δC |
| H6L | 38.29 | 52.19 | 124.2 | 18.4 | 27.26 | 25.11 | 134.0 | 4.7 | 177.23 | 17.5 | 177.53 |
| H5L− | 38.70 | 52.42 | 116.8 | 18.2 | 27.51 | 25.56 | 132.4 | 5.1 | 177.82 | 15.9 | 178.66 |
| H4L2− | 39.38 | 52.98 | 116.9 | 17.3 | 29.09 | 26.34 | 131.3 | 6.3 | 178.85 | 12.5 | 179.18 |
| H3L3− | 41.78 | 54.06 | 116.7 | 16.8 | 30.95 | 26.15 | 131.3 | 9.0 | 181.69 | 6.4 | 180.70 |
| H2L4− | 43.28 | 54.66 | 115.9 | 16.6 | 29.98 | 26.54 | 130.3 | 9.9 | 183.46 | 4.3 | 181.53 |
| HL5− | 43.26 | 55.04 | 115.8 | 15.9 | 30.99 | 27.51 | 128.3 | 9.4 | 184.08 | 5.3 | 182.53 |
| L6− | 42.70 | 55.01 | 111.7 | 16.3 | 29.87 | 28.65 | 127.7 | - | 184.82 | 18.9 | 186.15 |
| Gradients | |||||||||||
| Δ1 | +0.41 | +0.23 | −7.4 | −0.2 | +0.25 | +0.45 | −1.6 | +0.4 | +0.59 | −1.6 | +1.13 |
| Δ2 | +0.68 | +0.56 | +0.1 | −0.9 | +1.58 | +0.78 | −1.1 | +1.2 | +1.03 | −3.4 | +0.52 |
| Δ3 | +1.40 | +1.08 | −0.2 | −0.5 | +1.86 | −0.19 | 0.0 | +2.7 | +2.84 | −6.1 | +1.52 |
| Δ4 | +1.50 | +0.60 | −0.8 | −0.2 | −0.97 | +0.39 | −1.0 | +0.9 | +1.77 | −2.1 | +0.83 |
| Δ5 | −0.02 | +0.38 | −0.1 | −0.7 | +1.01 | +0.97 | −2.0 | −0.5 | +0.62 | +1.0 | +1.00 |
| Δ6 | −0.56 | −0.03 | −4.1 | +0.4 | −1.12 | +1.14 | −0.6 | - | +0.74 | +13.6 | +3.62 |
© 2019 by the author. Licensee MDPI, Basel, Switzerland. This article is an open access article distributed under the terms and conditions of the Creative Commons Attribution (CC BY) license (http://creativecommons.org/licenses/by/4.0/).
Share and Cite
MDPI and ACS Style
Hägele, G. Protolysis and Complex Formation of Organophosphorus Compounds—Characterization by NMR-Controlled Titrations. Molecules 2019, 24, 3238. https://doi.org/10.3390/molecules24183238
AMA Style
Hägele G. Protolysis and Complex Formation of Organophosphorus Compounds—Characterization by NMR-Controlled Titrations. Molecules. 2019; 24(18):3238. https://doi.org/10.3390/molecules24183238
Chicago/Turabian StyleHägele, Gerhard. 2019. "Protolysis and Complex Formation of Organophosphorus Compounds—Characterization by NMR-Controlled Titrations" Molecules 24, no. 18: 3238. https://doi.org/10.3390/molecules24183238