
Concentration of Mercury in the Livers of Small Terrestrial Rodents from Rural Areas in Poland

 ,
,
Abstract
:
1. Introduction
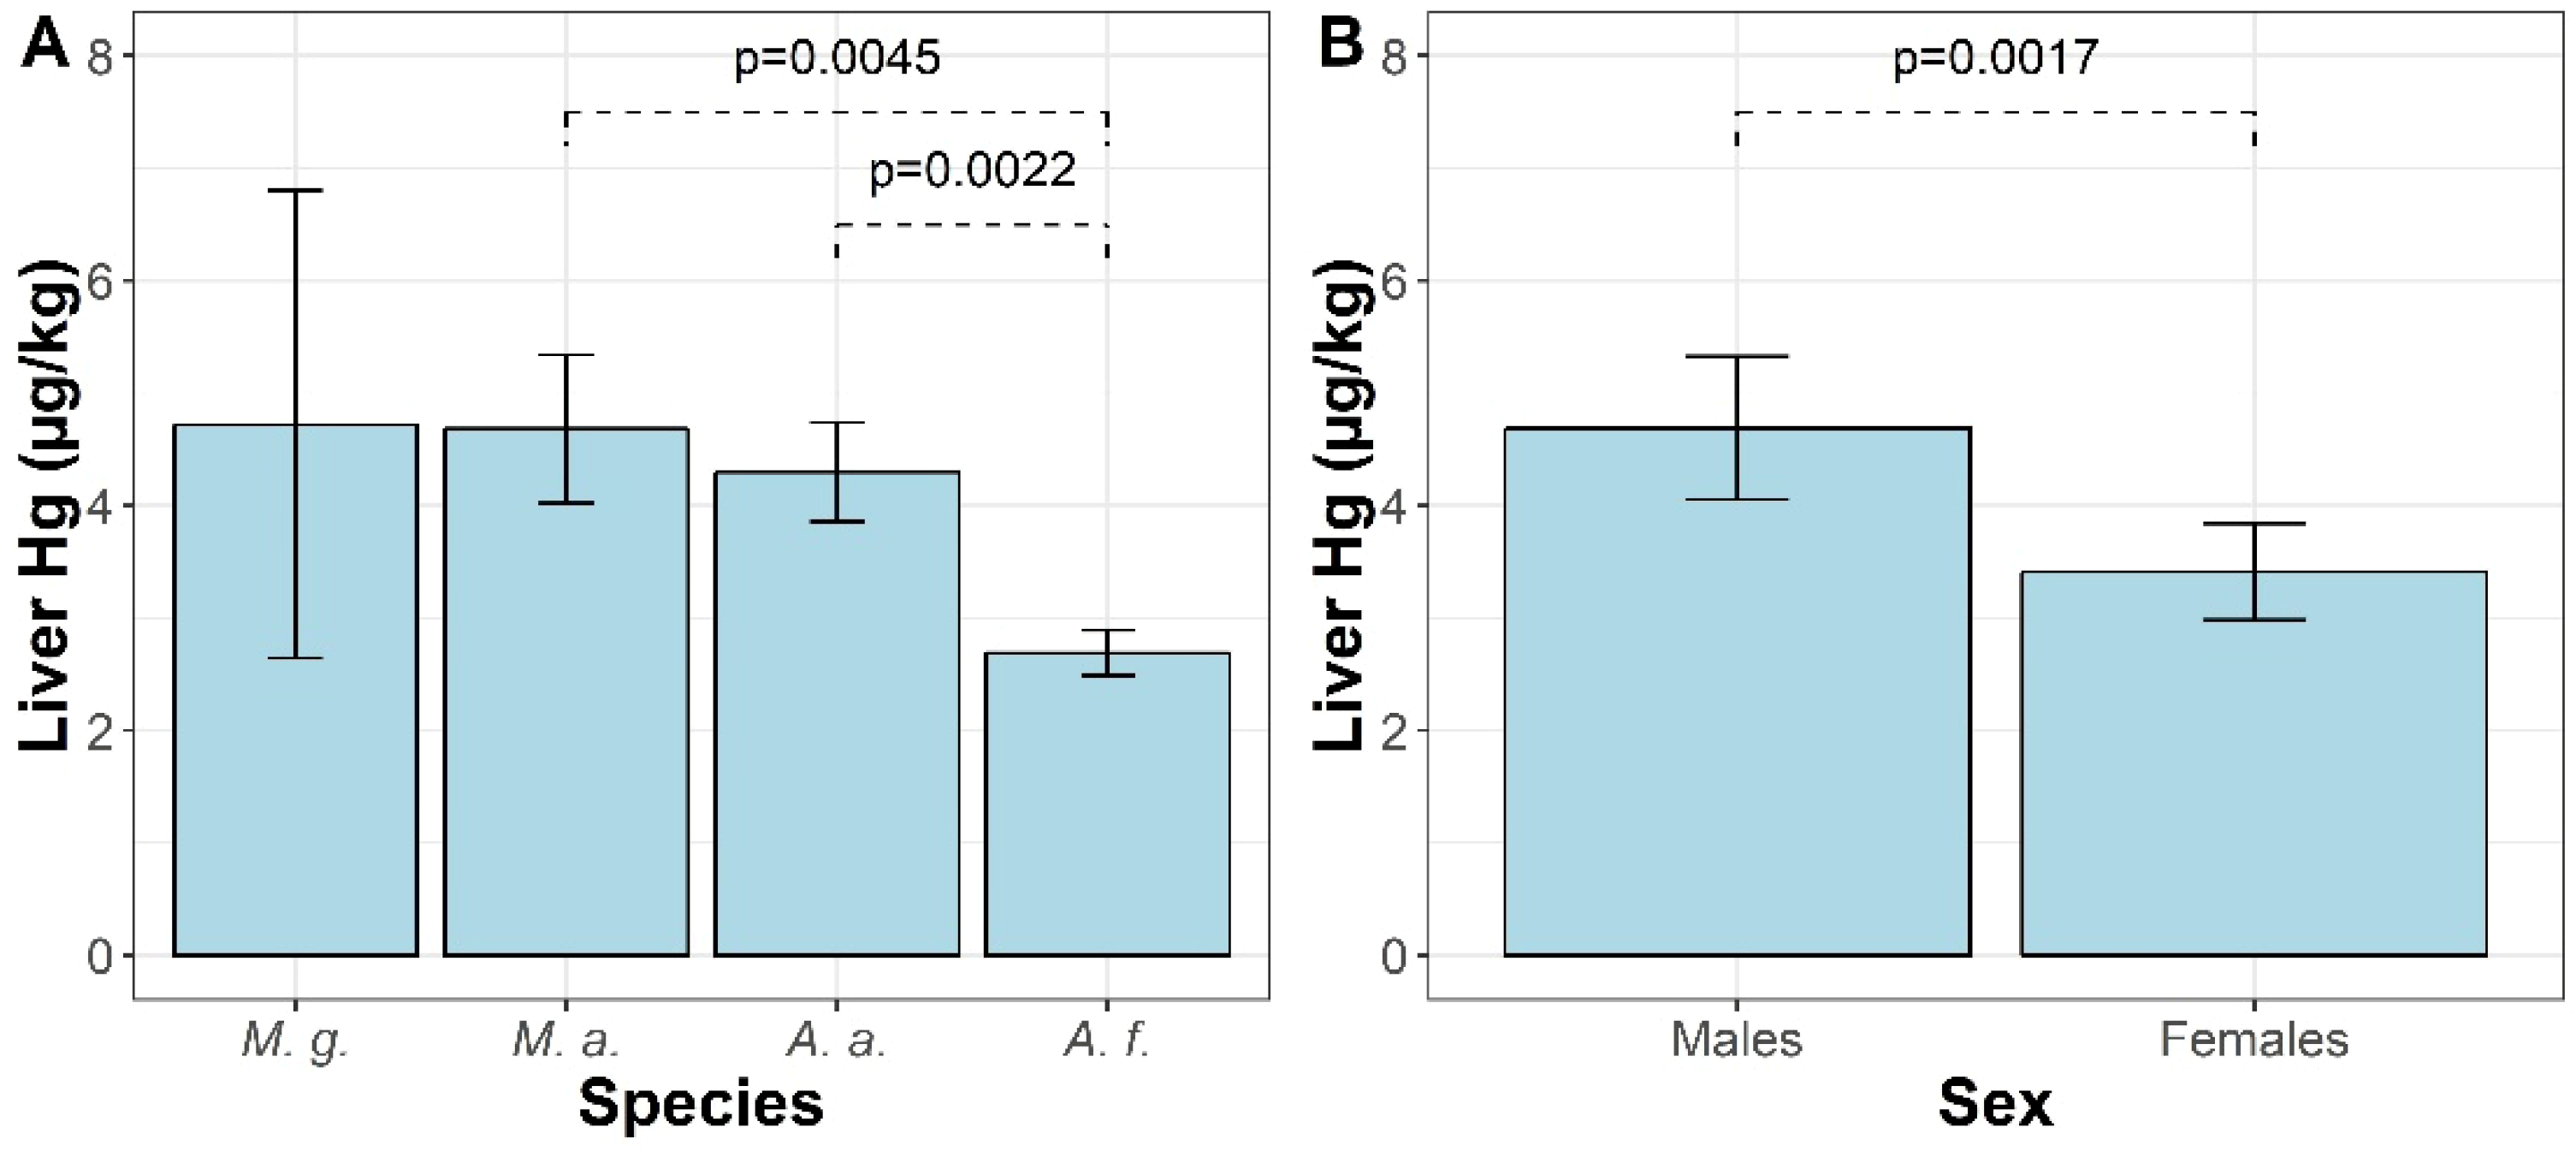
2. Results
3. Discussion
4. Materials and Methods
4.1. Sampling
4.2. Mercury Analysis
4.3. Statistical Analysis
Supplementary Materials
Author Contributions
Funding
Acknowledgments
Conflicts of Interest
References
- Driscoll, C.T.; Mason, R.P.; Chan, H.M.; Jacob, D.J.; Pirrone, N. Mercury as a Global Pollutant: Sources, Pathways, and Effects. Environ. Sci. Technol. 2013, 47, 4967–4983. [Google Scholar] [CrossRef] [PubMed]
- Clarkson, T.W.; Magos, L. The toxicology of mercury and its chemical compounds. Crit. Rev. Toxicol. 2006, 36, 609–662. [Google Scholar] [CrossRef] [PubMed]
- Boening, D.W. Ecological effects, transport, and fate of mercury: A general review. Chemosphere 2000, 40, 1335–1351. [Google Scholar] [CrossRef]
- UN Environment. Global Mercury Assessment 2018; UN Environment Programme Economy Division Chemicals and Health Branch International Environment House: Geneva, Switzerland, 2019; pp. 1–62. [Google Scholar]
- KOBiZE. Poland’s Informative Inventory Rreport 2018. Submission under the UN ECE Convention on Long-Range Transboundary Air Pollution and the DIRECTIVE (EU) 2016/2284; National Centre for Emission Management (KOBiZE) at the Institute of Environmental Protection—National Research Institute: Warsaw, Poland, 2018; pp. 1–286. [Google Scholar]
- Pyka, I.; Wierzchowski, K. Estimated mercury emissions from coal combustion in the households sector in Poland. J. Sustain. Min. 2016, 15, 66–72. [Google Scholar] [CrossRef]
- Xu, J.; Buck, M.; Eklöf, K.; Ahmed, O.O.; Schaefer, J.K.; Bishop, K.; Skyllberg, U.; Björn, E.; Bertilsson, S.; Bravo, A.G. Mercury methylating microbial communities of boreal forest soils. Sci. Rep. 2019, 9, 1–13. [Google Scholar] [CrossRef] [PubMed]
- Tsz-Ki Tsui, M.; Liu, S.; Brasso, R.L.; Blum, J.D.; Kwon, S.Y.; Ulus, Y.; Nollet, Y.H.; Balogh, S.J.; Eggert, S.L.; Finlay, J.C. Controls of Methylmercury Bioaccumulation in Forest Floor Food Webs. Environ. Sci. Technol. 2019, 53, 2434–2440. [Google Scholar] [CrossRef]
- Rodríguez Álvarez, C.; Jiménez-Moreno, M.; Guzmán Bernardo, F.J.; Rodríguez Martín-Doimeadios, R.C.; Berzas Nevado, J.J. Using species-specific enriched stable isotopes to study the effect of fresh mercury inputs in soil-earthworm systems. Ecotoxicol. Environ. Saf. 2018, 147, 192–199. [Google Scholar] [CrossRef]
- Abeysinghe, K.S.; Yang, X.-D.; Goodale, E.; Anderson, C.W.N.; Bishop, K.; Cao, A.; Feng, X.; Liu, S.; Mammides, C.; Meng, B.; et al. Total mercury and methylmercury concentrations over a gradient of contamination in earthworms living in rice paddy soil. Environ. Toxicol. Chem. 2017, 36, 1202–1210. [Google Scholar] [CrossRef]
- Ortiz, C.; Weiss-Penzias, P.S.; Fork, S.; Flegal, A.R. Total and Monomethyl Mercury in Terrestrial Arthropods from the Central California Coast. Bull. Environ. Contam. Toxicol. 2015, 94, 425–430. [Google Scholar] [CrossRef]
- Zheng, D.; Liu, X.; Jin, D.; Li, H.; Li, X. Mercury bioaccumulation in arthropods from typical community habitats in a zinc-smelting area. Environ. Geochem. Health 2018, 40, 1329–1337. [Google Scholar] [CrossRef]
- Janiga, M.; Haas, M. Alpine accentors as monitors of atmospheric long-range lead and mercury pollution in alpine environments. Environ. Sci. Pollut. Res. 2019, 26, 2445–2454. [Google Scholar] [CrossRef] [PubMed]
- Jackson, A.K.; Evers, D.C.; Adams, E.M.; Cristol, D.A.; Eagles-Smith, C.; Edmonds, S.T.; Gray, C.E.; Hoskins, B.; Lane, O.P.; Sauer, A.; et al. Songbirds as sentinels of mercury in terrestrial habitats of eastern North America. Ecotoxicology 2015, 24, 453–467. [Google Scholar] [CrossRef] [PubMed]
- Costa, R.A.; Eeva, T.; Eira, C.; Vaqueiro, J.; Vingada, J.V. Assessing heavy metal pollution using Great Tits (Parus major): Feathers and excrements from nestlings and adults. Environ. Monit. Assess. 2013, 185, 5339–5344. [Google Scholar] [CrossRef] [PubMed]
- Korstian, J.M.; Chumchal, M.M.; Bennett, V.J.; Hale, A.M. Mercury contamination in bats from the central United States. Environ. Toxicol. Chem. 2018, 37, 160–165. [Google Scholar] [CrossRef]
- Sánchez-Chardi, A.; López-Fuster, M.J.; Nadal, J. Bioaccumulation of lead, mercury, and cadmium in the greater white-toothed shrew, Crocidura russula, from the Ebro Delta (NE Spain): Sex- and age-dependent variation. Environ. Pollut. 2007, 145, 7–14. [Google Scholar] [CrossRef]
- Komov, V.T.; Ivanova, E.S.; Poddubnaya, N.Y.; Gremyachikh, V.A. Mercury in soil, earthworms and organs of voles Myodes glareolus and shrew Sorex araneus in the vicinity of an industrial complex in Northwest Russia (Cherepovets). Environ. Monit. Assess. 2017, 189, 104. [Google Scholar] [CrossRef]
- Antonova, E.P.; Ilyukha, V.A.; Komov, V.T.; Khizhkin, E.A.; Sergina, S.N.; Gremyachikh, V.A.; Kamshilova, T.B.; Belkin, V.V.; Yakimova, A.E. The Mercury Content and Antioxidant System in Insectivorous Animals (Insectivora, Mammalia) and Rodents (Rodentia, Mammalia) of Various Ecogenesis Conditions. Biol. Bull. 2017, 44, 1272–1277. [Google Scholar] [CrossRef]
- Kalisinska, E.; Lisowski, P.; Kosik-Bogacka, D.I. Red Fox Vulpes vulpes (L, 1758) as a Bioindicator of Mercury Contamination in Terrestrial Ecosystems of North-Western Poland. Biol. Trace Elem. Res. 2012, 145, 172–180. [Google Scholar] [CrossRef]
- Kalisinska, E.; Lisowski, P.; Salicki, W.; Kucharska, T.; Kavetska, K. Mercury in wild terrestrial carnivorous mammals from north-western Poland and unusual fish diet of red fox. Acta Theriol. 2009, 54, 345–356. [Google Scholar] [CrossRef]
- Kalisińska, E.; Łanocha-Arendarczyk, N.; Kosik-Bogacka, D.I. Mercury, Hg. In Mammals and Birds as Bioindicators of Trace Element Contaminations in Terrestrial Environments; Springer International Publishing: Cham, Switzerland, 2019; pp. 593–653. [Google Scholar]
- Wren, C.D. Mammals as biological monitors of environmental metal levels. Environ. Monit. Assess. 1986, 6, 127–144. [Google Scholar] [CrossRef]
- Talmage, S.S.; Walton, B.T. Small mammals as monitors of environmental contaminants. Rev. Environ. Contam. Toxicol. 1991, 119, 47–145. [Google Scholar] [PubMed]
- Mazurkiewicz, M. Factors influencing the distribution of the bank vole in forest habitats. Acta Theriol. 1994, 39, 113–126. [Google Scholar] [CrossRef]
- Butet, A.; Delettre, Y.R. Diet differentiation between European arvicoline and murine rodents. Acta Theriol. 2011, 56, 297. [Google Scholar] [CrossRef]
- Lundrigan, B.; Mueller, M. Myodes glareolus (On-line), Animal Diversity Web. Available online: https://animaldiversity.org/site/accounts/information/Myodes_glareolus.html (accessed on 1 October 2019).
- Noble, S. “Microtus arvalis” (On-line), Animal Diversity Web. Available online: https://animaldiversity.org/accounts/Microtus_arvalis/ (accessed on 1 October 2019).
- Jacob, J.; Manson, P.; Barfknecht, R.; Fredricks, T. Common vole (Microtus arvalis) ecology and management: Implications for risk assessment of plant protection products. Pest Manag. Sci. 2014, 70, 869–878. [Google Scholar] [CrossRef]
- Kowalski, K.; Pucek, Z.; Ruprecht, A.L. Rząd: Gryzonie—Rodentia. In Klucz do Oznaczania Ssaków Polski; Pucek, Z., Ed.; PWN: Warsaw, Poland, 1984; pp. 149–240. [Google Scholar]
- Gortat, T.; Barkowska, M.; Gryczyńska-Siemiątkowska, A.; Pieniążek, A.; Kozakiewicz, A.; Kozakiewicz, M. The Effects of Urbanization—Small Mammal Communities in a Gradient of Human Pressure in Warsaw City, Poland. Polish J. Ecol. 2014, 62, 163–172. [Google Scholar] [CrossRef]
- Zielonka, U.; Hlawiczka, S.; Fudala, J.; Wängberg, I.; Munthe, J. Seasonal mercury concentrations measured in rural air in Southern Poland: Contribution from local and regional coal combustion. Atmos. Environ. 2005, 39, 7580–7586. [Google Scholar] [CrossRef]
- Pyta, H.; Rosik-Dulewska, C.; Czaplicka, M. Speciation of Ambient Mercury in the Upper Silesia Region, Poland. Water. Air. Soil Pollut. 2009, 197, 233–240. [Google Scholar] [CrossRef]
- Al Sayegh Petkovšek, S.; Kopušar, N.; Kryštufek, B. Small mammals as biomonitors of metal pollution: A case study in Slovenia. Environ. Monit. Assess. 2014, 186, 4261–4274. [Google Scholar] [CrossRef]
- Yavuz, M.; Aktas, O. Heavy metal accumulation in the Microtus guentheri (Danford and Alston, 1880) living near the mines as biomonitor. Fresenius Environ. Bull. 2017, 26, 1104–1121. [Google Scholar]
- Bull, K.R.; Roberts, R.D.; Inskip, M.J.; Goodman, G.T. Mercury concentrations in soil, grass, earthworms and small mammals near an industrial emission source. Environ. Pollut. 1977, 12, 135–140. [Google Scholar] [CrossRef]
- Ángel Fernández, J.; Aboal, J.R.; González, X.I.; Carballeira, A. Transfer and bioaccumulation variability of Cd, Co, Cr, Hg, Ni and Pb in trophic compartments of terrestrial ecosystems in Northern Spain. Fresenius Environ. Bull. 2012, 21, 3527–3532. [Google Scholar]
- Adachi, T.; Yasutake, A.; Eto, K.; Hirayama, K. Influence of dietary protein levels on the acute toxicity of methylmercury in mice. Toxicology 1996, 112, 11–17. [Google Scholar] [CrossRef]
- Rowland, I.R.; Robinson, R.D.; Doherty, R.A. Effects of diet on mercury metabolism and excretion in mice given methylmercury: Role of gut Flora. Arch. Environ. Health 1984, 39, 401–408. [Google Scholar] [CrossRef] [PubMed]
- Martiniaková, M.; Omelka, R.; Grosskopf, B.; Jančová, A. Yellow-necked mice (Apodemus flavicollis) and bank voles (Myodes glareolus) as zoomonitors of environmental contamination at a polluted area in Slovakia. Acta Vet. Scand. 2010, 52, 58. [Google Scholar] [CrossRef] [Green Version]
- Čepelka, L.; Heroldová, M.; Jánová, E.; Suchomel, J. The dynamics of nitrogenous substances in rodent diet in a forest environment. Mammalia 2014, 78, 327–333. [Google Scholar] [CrossRef]
- Ozaki, S.; Fritsch, C.; Valot, B.; Mora, F.; Cornier, T.; Scheifler, R.; Raoul, F. How Do Richness and Composition of Diet Shape Trace Metal Exposure in a Free-Living Generalist Rodent, Apodemus sylvaticus. Environ. Sci. Technol. 2019, 53, 5977–5986. [Google Scholar] [CrossRef]
- Falandysz, J.; Krasińska, G.; Pankavec, S.; Nnorom, I.C. Mercury in certain boletus mushrooms from Poland and Belarus. J. Environ. Sci. Health B 2014, 49, 690–695. [Google Scholar] [CrossRef]
- Falandysz, J.; Szymczyk, K.; Ichihashi, H.; Bielawski, L.; Gucia, M.; Frankowska, A.; Yamasaki, S.I. ICP/MS and ICP/AES elemental analysis (38 elements) of edible wild mushrooms growing in Poland. Food Addit. Contam. 2010, 18, 503–513. [Google Scholar] [CrossRef]
- Rieder, S.R.; Brunner, I.; Horvat, M.; Jacobs, A.; Frey, B. Accumulation of mercury and methylmercury by mushrooms and earthworms from forest soils. Environ. Pollut. 2011, 159, 2861–2869. [Google Scholar] [CrossRef]
- Blaschke, H.; Bäumler, W. Mycophagy and spore dispersal by small mammals in bavarian forests. For. Ecol. Manag. 1989, 26, 237–245. [Google Scholar] [CrossRef]
- Kataržytė, M.; Kutorga, E. Small mammal mycophagy in hemiboreal forest communities of Lithuania. Cent. Eur. J. Biol. 2011, 6, 446–456. [Google Scholar] [CrossRef]
- Wada, H.; Yates, D.E.; Evers, D.C.; Taylor, R.J.; Hopkins, W.A. Tissue mercury concentrations and adrenocortical responses of female big brown bats (Eptesicus fuscus) near a contaminated river. Ecotoxicology 2010, 19, 1277–1284. [Google Scholar] [CrossRef] [PubMed]
- Gerstenberger, S.L.; Cross, C.L.; Divine, D.D.; Gulmatico, M.L.; Rothweiler, A.M. Assessment of mercury concentrations in small mammals collected near Las Vegas, Nevada, USA. Environ. Toxicol. 2006, 21, 583–589. [Google Scholar] [CrossRef]
- Levengood, J.M.; Heske, E.J. Heavy metal exposure, reproductive activity, and demographic patterns in white-footed mice (Peromyscus leucopus) inhabiting a contaminated floodplain wetland. Sci. Total Environ. 2008, 389, 320–328. [Google Scholar] [CrossRef]
- Vucetich, L.; Vucetich, J.; Cleckner, L.; Gorski, P.; Peterson, R. Mercury concentrations in deer mouse (Peromyscus maniculatus) tissues from Isle Royale National Park. Environ. Pollut. 2001, 114, 113–118. [Google Scholar] [CrossRef]
- Sánchez-Chardi, A.; López-Fuster, M.J. Metal and metalloid accumulation in shrews (Soricomorpha, Mammalia) from two protected Mediterranean coastal sites. Environ. Pollut. 2009, 157, 1243–1248. [Google Scholar] [CrossRef]
- Adamczewska-Andrzejewska, K.A. Methods of age determination in Apodemus agrarius (Pallas 1771). Ann. Zool. Fenn. 1971, 8, 68–71. [Google Scholar]
- Szkoda, J.; Zmudzki, J.; Grzebalska, A. Determination of total mercury in biological material by atomic absorption spectrometry method. Bull. Vet. Inst. Pulawy 2006, 50, 363–366. [Google Scholar]
- International Standard Organization ISO/IEC 17025 General requirements for the competence of testing and calibration laboratories. Int. Stand. 2005, 2005, 1–36.
- R Core Team. R: A Language and Environment for Statistical Computing. Version 3.6.0. Available online: http://www.r-project.org/ (accessed on 1 October 2019).
- Wickham, H.; Romain, F.; Lionel, H.; Müller, K. dplyr: A Grammar of Data Manipulation. R Package Version 0.8.1. Available online: https://cran.r-project.org/package=dplyr (accessed on 1 October 2019).
- Yap, B.W.; Sim, C.H. Comparisons of various types of normality tests. J. Stat. Comput. Simul. 2011, 81, 2141–2155. [Google Scholar] [CrossRef]
- Zuur, A.F.; Ieno, E.N.; Walker, N.; Saveliev, A.A.; Smith, G.M. Mixed Effects Models and Extensions in Ecology with R; Krämer, A., Kretzschmar, M., Krickeberg, K., Eds.; Statistics for Biology and Health; Springer: New York, NY, USA, 2009; pp. 1–574. [Google Scholar]
- Lenth, R. emmeans: Estimated Marginal Means, aka Least-Squares Means. R Package Version 1.4.1. Available online: https://cran.r-project.org/package=emmeans (accessed on 1 October 2019).
- Wickham, H. ggplot2: Elegant Graphics for Data Analysis, 2nd ed.; Springer: New York, NY, USA, 2016; pp. 1–260. [Google Scholar]
- Team, Q.D. QGIS Geographic Information System. Open Source Geospatial Foundation Project. Version 3.8. Available online: http://qgis.osgeo.org/ (accessed on 1 October 2019).
Sample Availability: Samples of the compounds and biological material used in this study are not available from the authors. |


| Species | Country | Site | N | Mean (Min–Max) | Reference |
|---|---|---|---|---|---|
| Apodemus flavicollis | Slovenia | lead smelter | 7 | 100.3 (39.5–249.3) * | [34] |
| main road | 23 | 6.1 (3–21.3) * | |||
| thermal power plant | 30 | 42.6 (3–173.3) * | |||
| reference area | 13 | 18.2 (3–36.5) * | |||
| Apodemu sylvaticus | Great Britain | chlor-alkali plant | 6 | 230 (90–530) | [36] |
| reference area | 10 | 40 (10–70) | |||
| Spain | Galicia, different areas | 372 | 53 (17–110) | [37] | |
| Chaetidypus penicillatus | NV, USA | Las Vegas Wash | 32 | 3.3 (0.9–24.3) | [49] |
| Dipodomys merriami | 8 | 3.7 (0.7–20.6) | |||
| Microtus arvalis | Slovenia | thermal power plant | 4 | 3 (<LOQ–10) * | [34] |
| main road | 3 | 3 * | |||
| Microtus guentheri | Turkey | marble mining area | 68 | 231 (221.9–240.1) * | [35] |
| reference area | 24 | 200.6 (145.9–240.1) * | |||
| Mus musculus | NV, USA | Las Vegas Wash | 2 | 2.3 (1.5–3.0) | [49] |
| Myodes glareolus | Slovenia | lead smelter | 21 | 9.1* | [34] |
| main road | 13 | 3 (3–6.1) * | |||
| thermal power plant | 4 | 97.3 (3–231) * | |||
| reference area | 15 | 18.2 (3–36.5) * | |||
| Russia | metallurgical plant | 50 | 4.3 * | [18] | |
| Great Britain | chlor-alkali plant | 7 | 150 (60–340) | [36] | |
| reference area | 6 | 60 (30–130) | |||
| Neotoma lepida | NV, USA | Las Vegas Wash | 16 | 6.8 (2.0–20.8) | [49] |
| Peromyscus leucopus | IL, USA | contaminated wetland | 36 | 11 (2–23) | [50] |
| reference area 1 | 84 | 10 (1–21) | |||
| reference area 2 | 43 | 8 (1–20) | |||
| reference area 3 | 43 | 15 (3–35) | |||
| Peromyscus maniculatus | MI, USA | outside Sargent Lake watershed | 15 | 29.98 | [51] |
| inside Sargent Lake watershed | 15 | 10.99 | |||
| mainland | 4 | 21.41 | |||
| Peromyscus eremicus | NV, USA | Las Vegas Wash | 46 | 10.9 (0.9–85.3) | [49] |
© 2019 by the authors. Licensee MDPI, Basel, Switzerland. This article is an open access article distributed under the terms and conditions of the Creative Commons Attribution (CC BY) license (http://creativecommons.org/licenses/by/4.0/).
Share and Cite
Durkalec, M.; Nawrocka, A.; Żmudzki, J.; Filipek, A.; Niemcewicz, M.; Posyniak, A. Concentration of Mercury in the Livers of Small Terrestrial Rodents from Rural Areas in Poland. Molecules 2019, 24, 4108. https://doi.org/10.3390/molecules24224108
Durkalec M, Nawrocka A, Żmudzki J, Filipek A, Niemcewicz M, Posyniak A. Concentration of Mercury in the Livers of Small Terrestrial Rodents from Rural Areas in Poland. Molecules. 2019; 24(22):4108. https://doi.org/10.3390/molecules24224108
Chicago/Turabian StyleDurkalec, Maciej, Agnieszka Nawrocka, Jacek Żmudzki, Aleksandra Filipek, Marcin Niemcewicz, and Andrzej Posyniak. 2019. "Concentration of Mercury in the Livers of Small Terrestrial Rodents from Rural Areas in Poland" Molecules 24, no. 22: 4108. https://doi.org/10.3390/molecules24224108