
Getting the Most Out of Your Crystals: Data Collection at the New High-Flux, Microfocus MX Beamlines at NSLS-II

 , , , ,
Abstract
:1. Introduction
2. Results
2.1. Single Crystal Vector Data Collection
2.1.1. Akt1
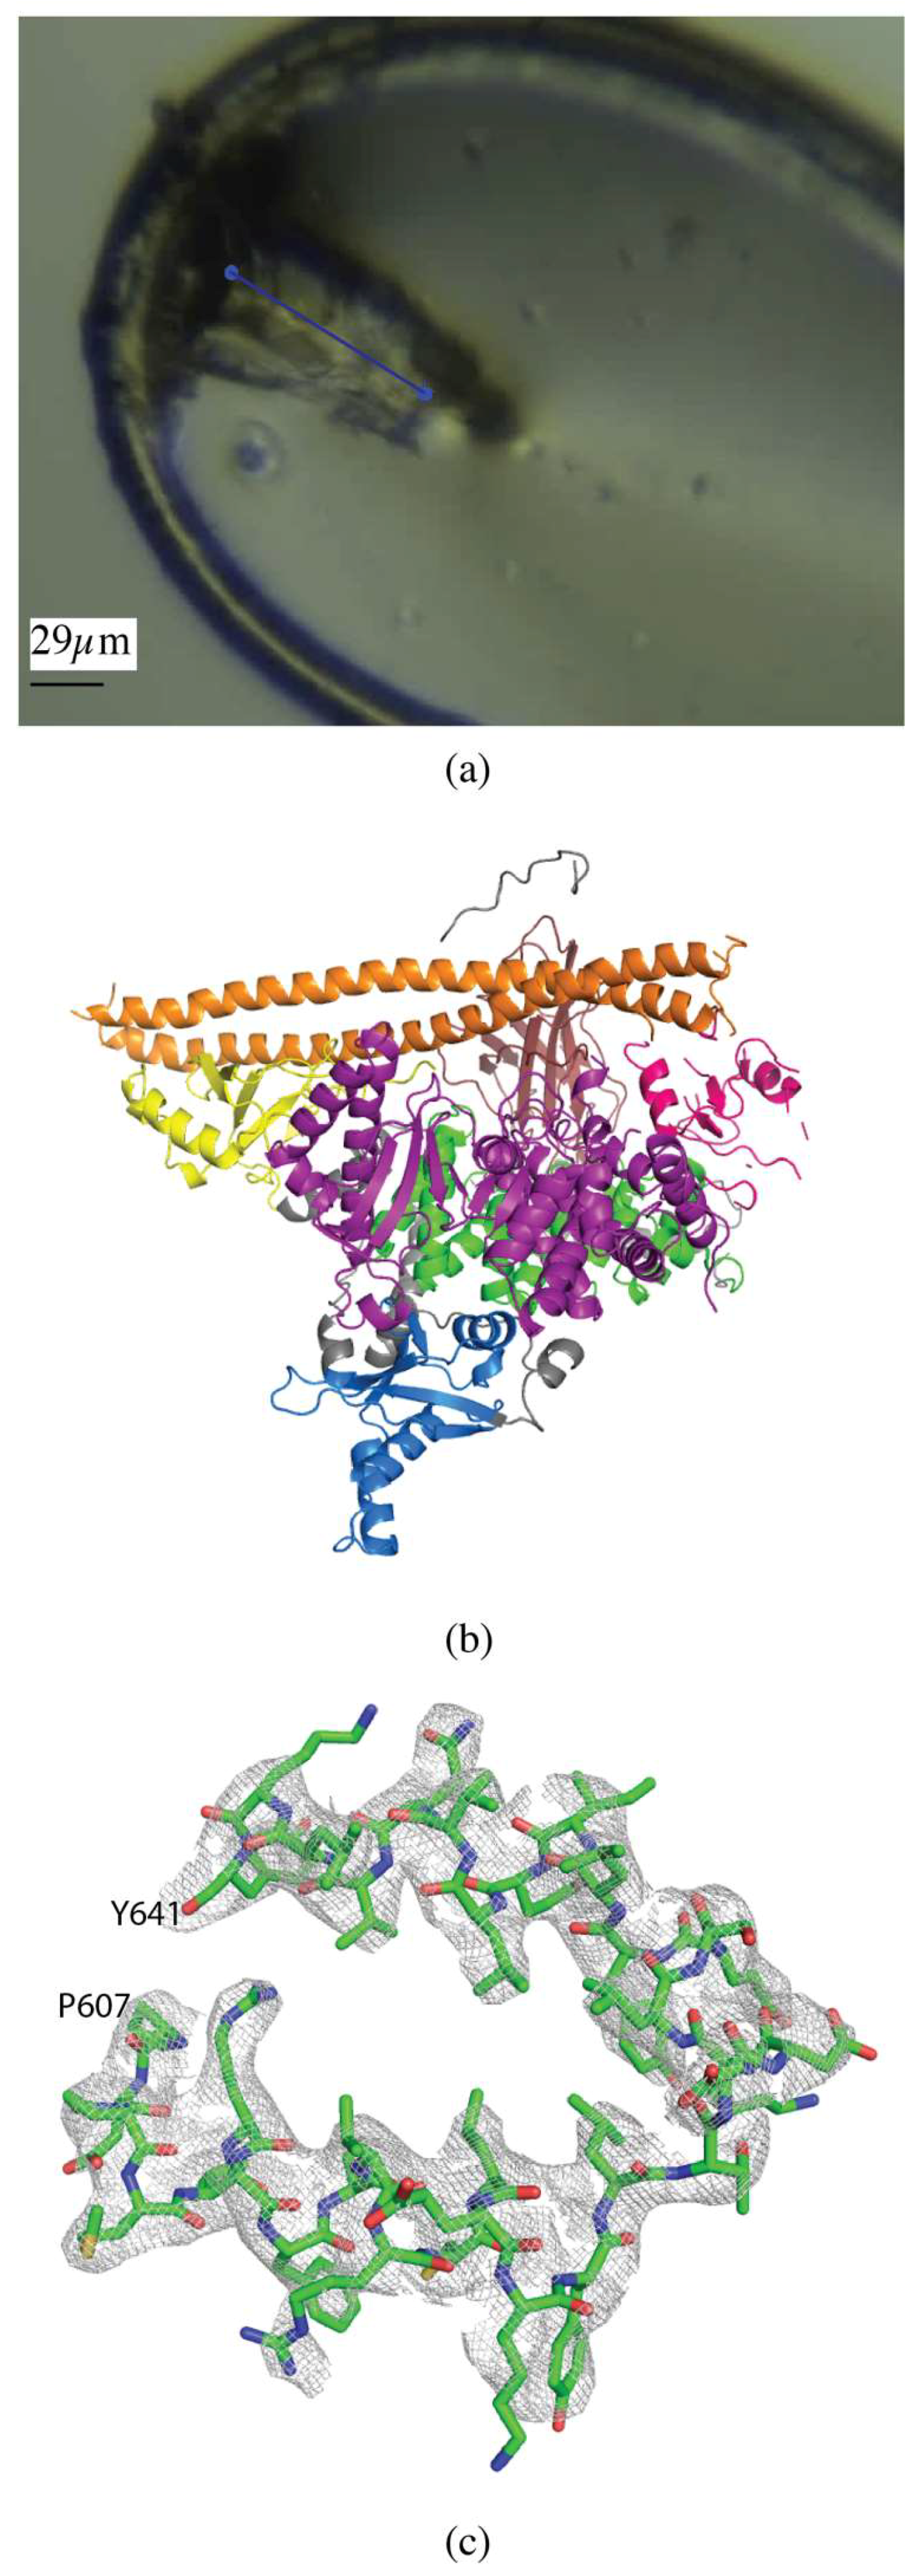
2.1.2. PI3Kα
2.1.3. CDP-Chase
2.2. Multicrystal Data Collection
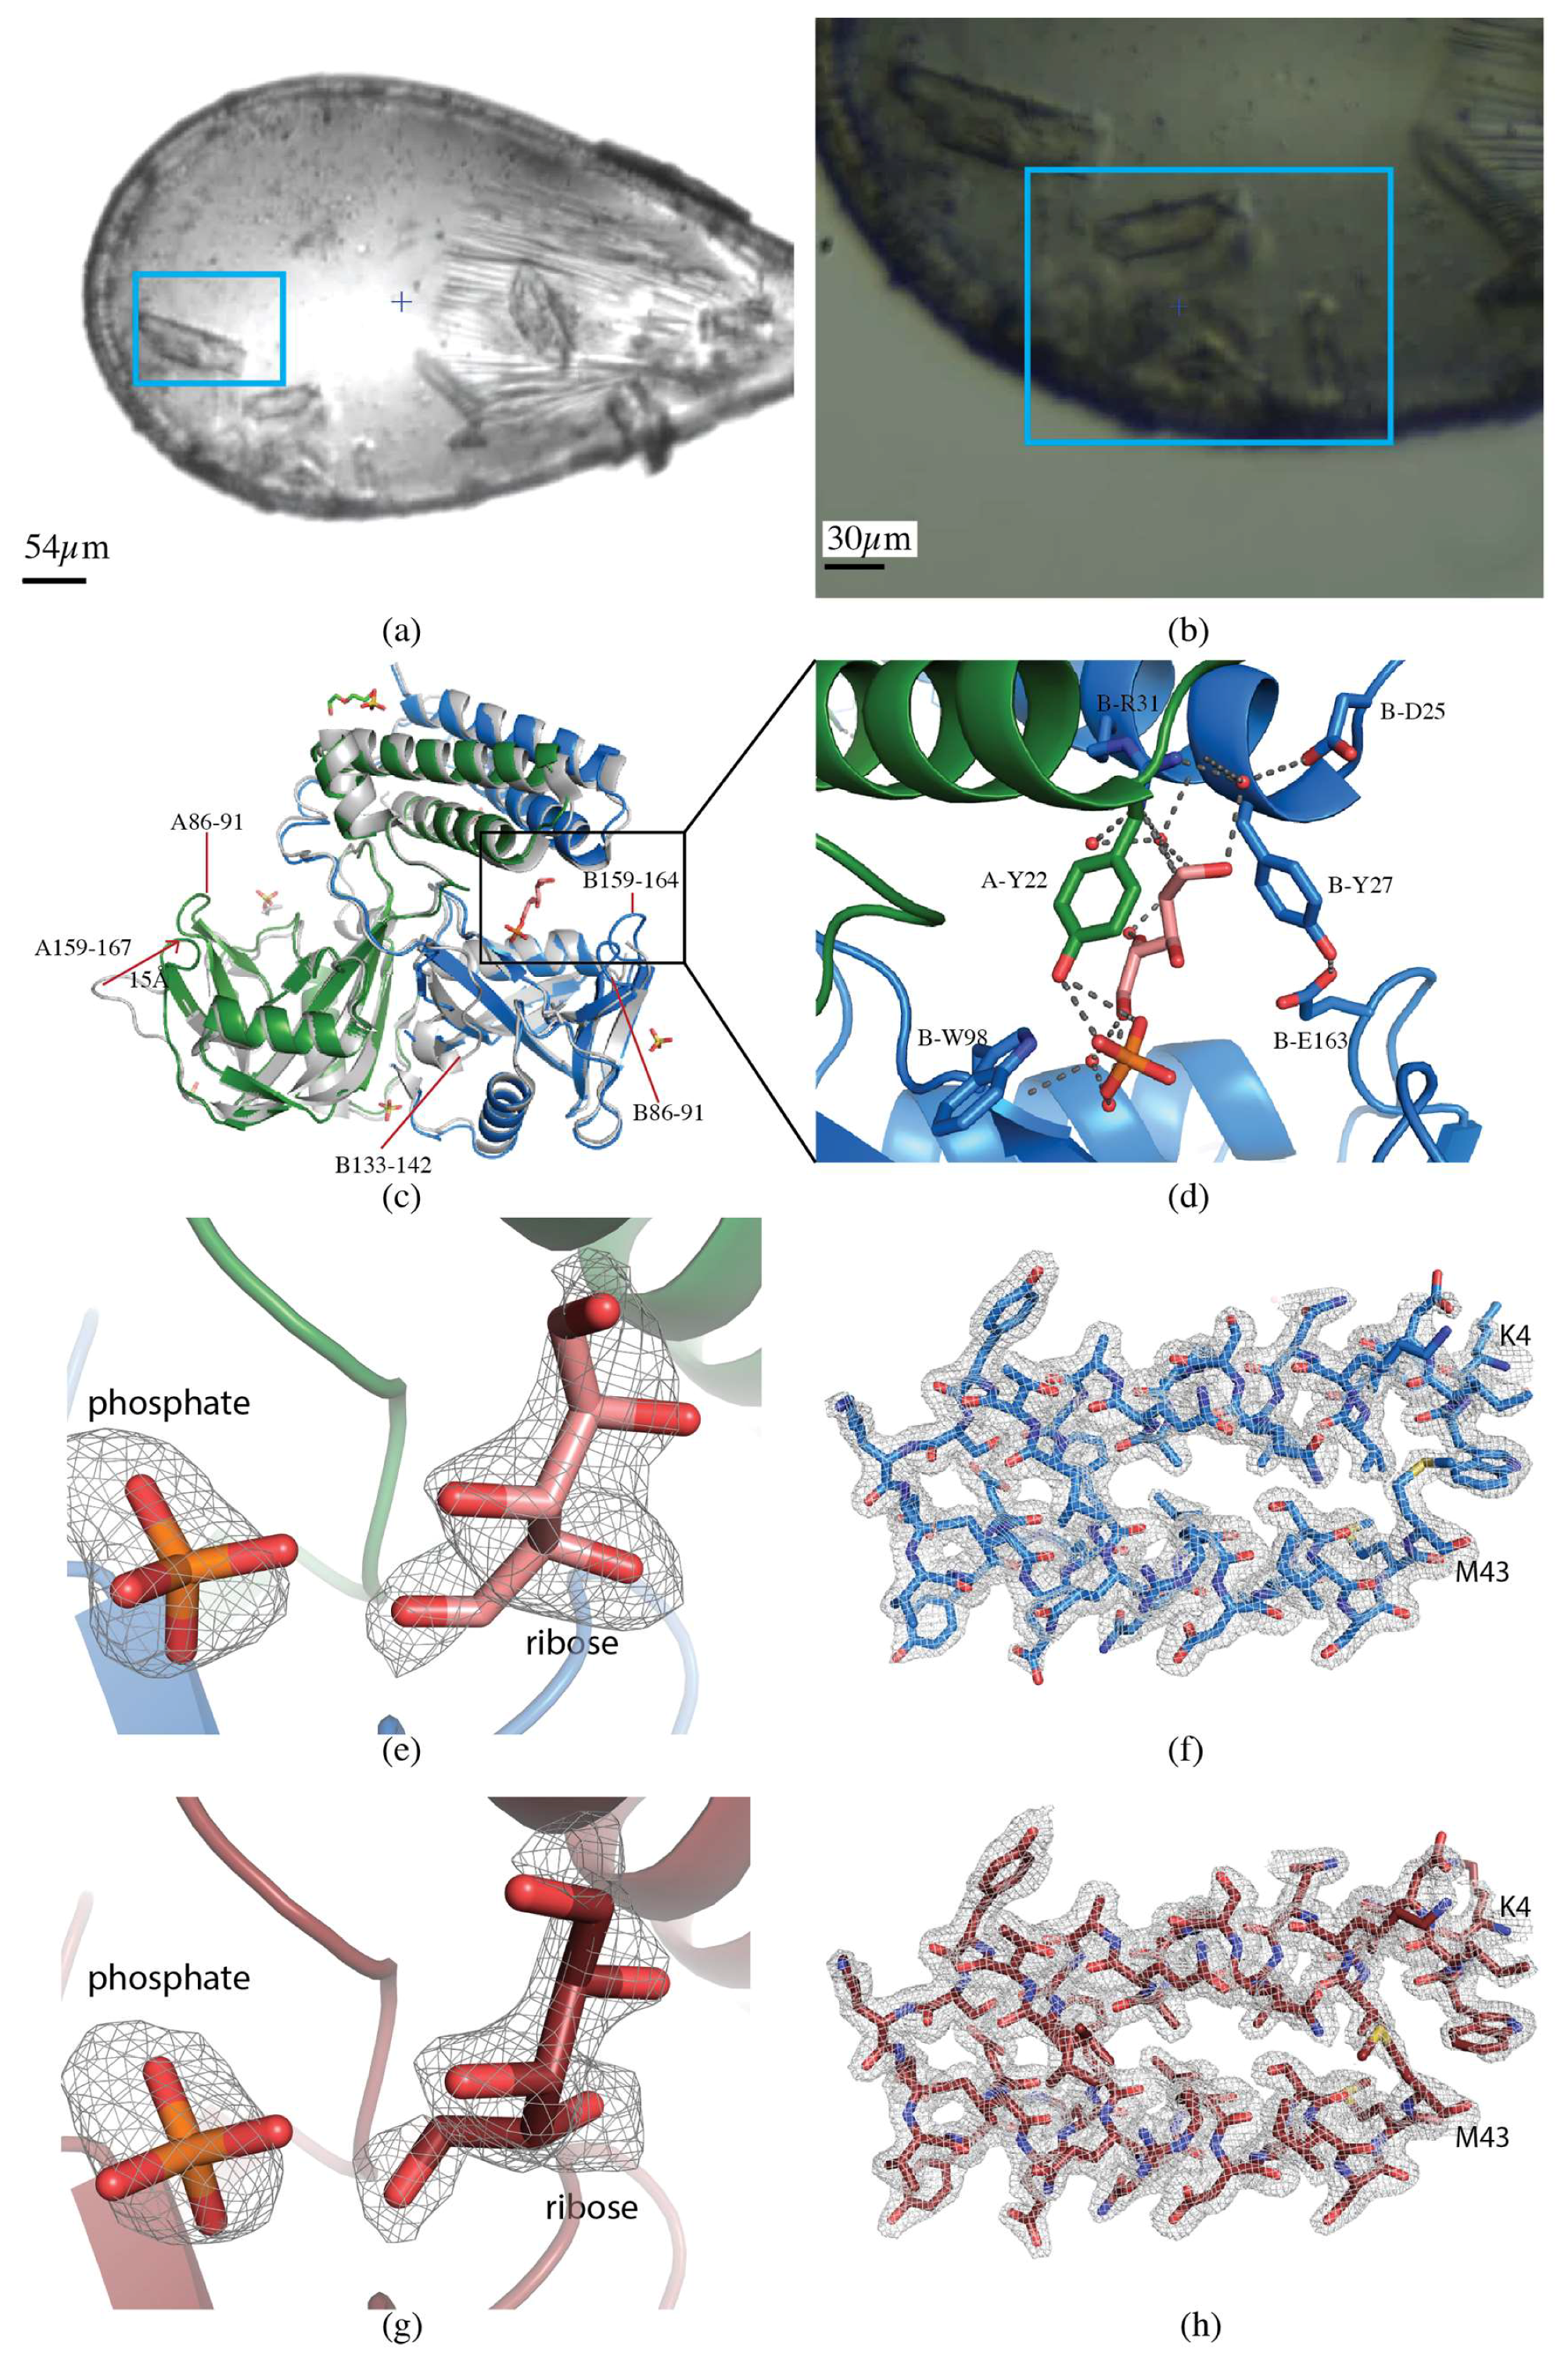
2.2.1. CDP-Chase
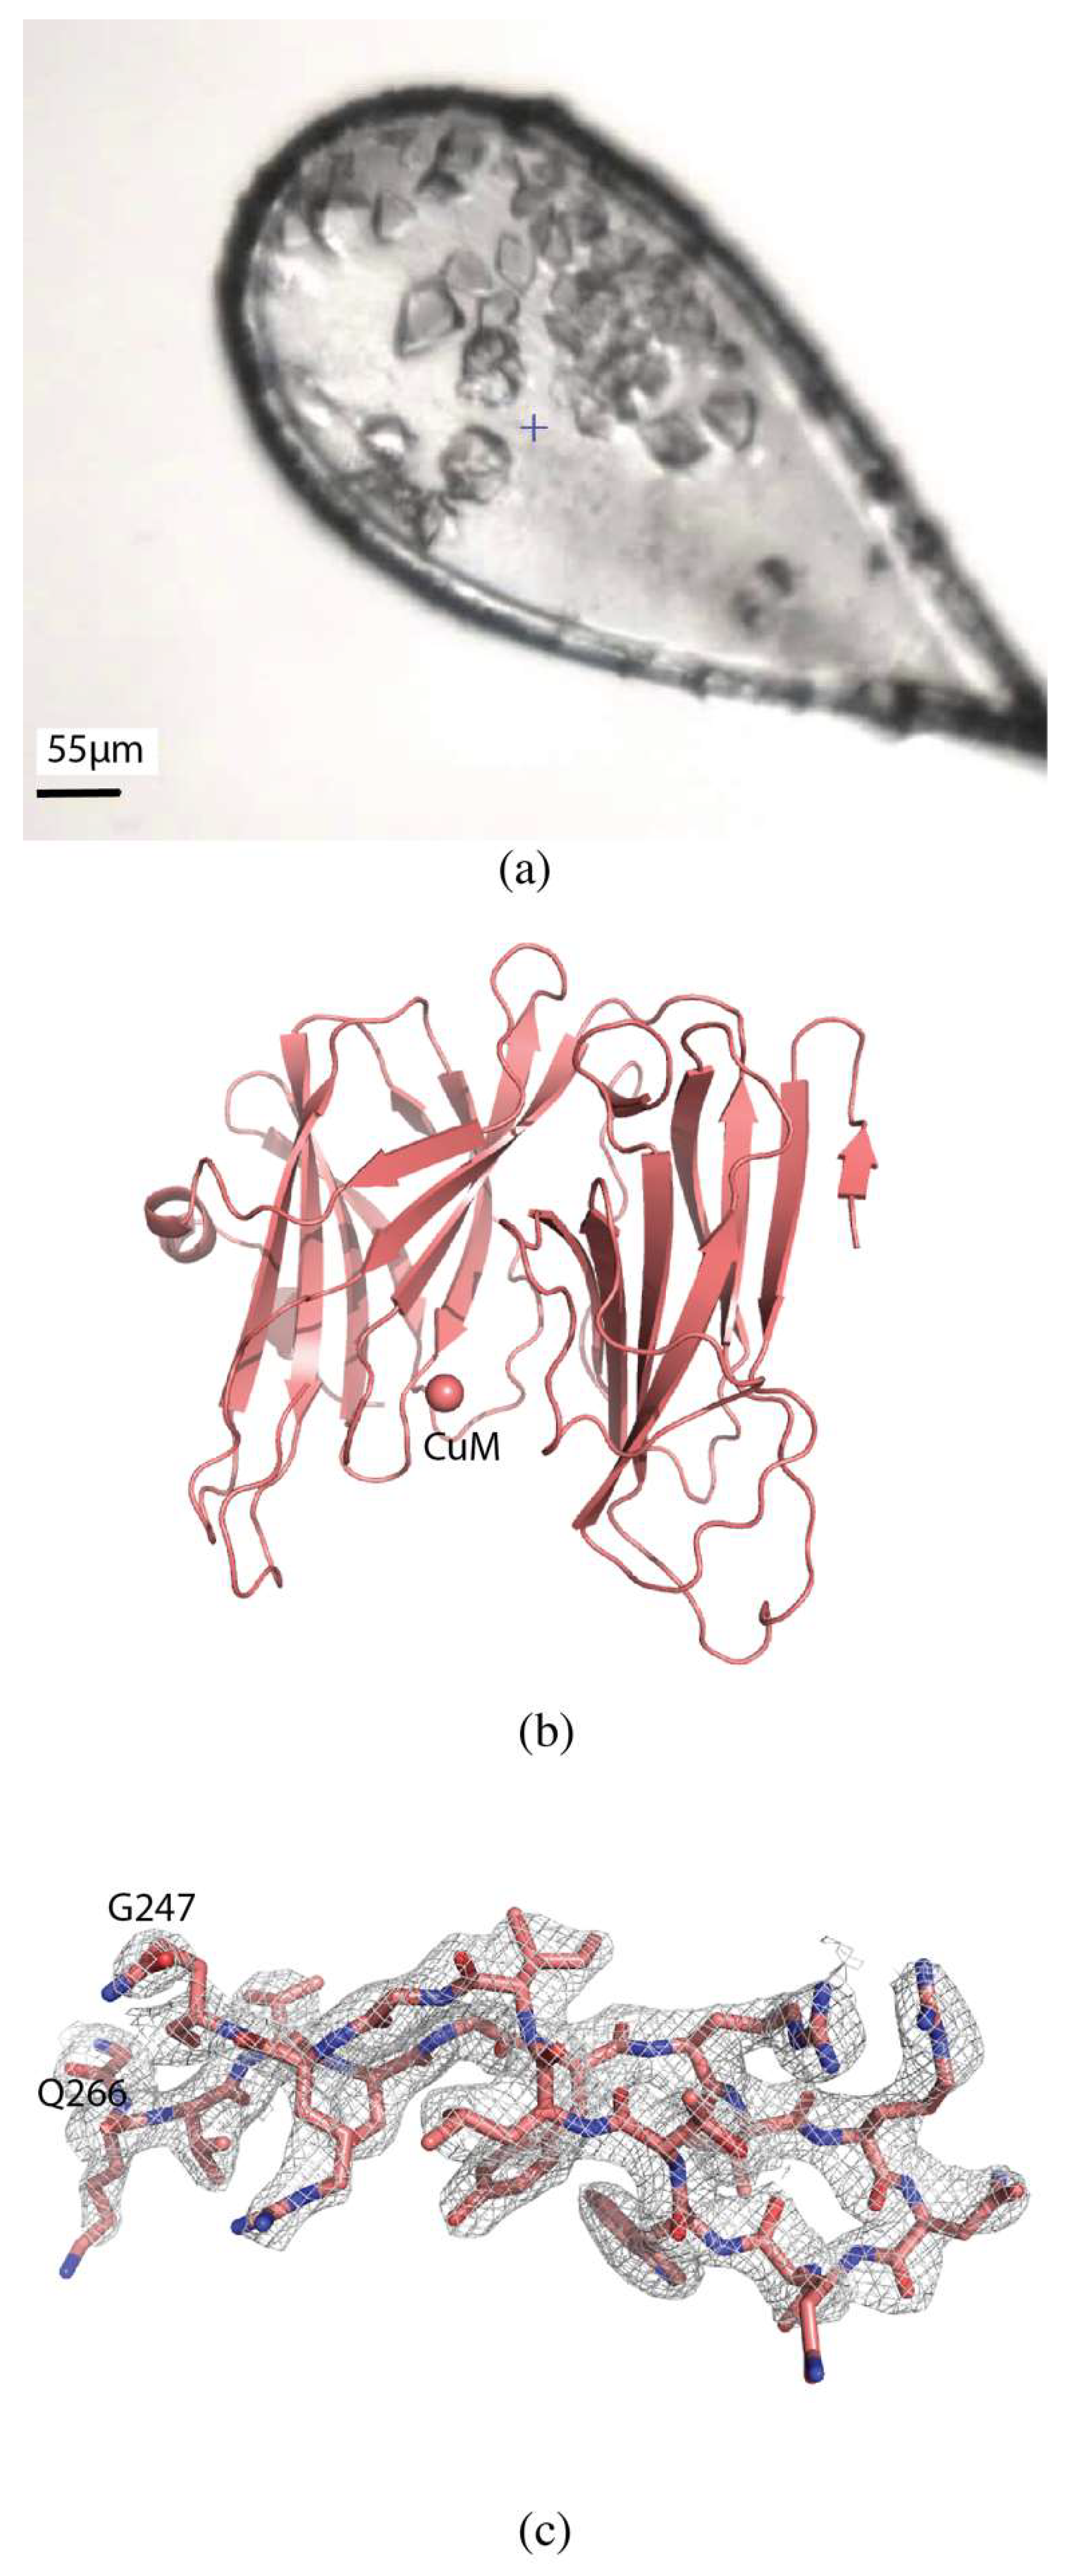
2.2.2. H108A-PHM
3. Discussion
3.1. Biological Insights
3.2. Data Collection Strategies
4. Materials and Methods
4.1. Protein Expression, Purification, and Crystallization
4.2. Data Collection
4.3. Accession Codes
Author Contributions
Funding
Acknowledgments
Conflicts of Interest
References
- Smith, J.L.; Fischetti, R.F.; Yamamoto, M. Micro-crystallography comes of age. Curr. Opin. Struct. Biol. 2012, 22, 602–612. [Google Scholar] [CrossRef] [Green Version]
- Yamamoto, M.; Hirata, K.; Yamashita, K.; Hasegawa, K.; Ueno, G.; Ago, H.; Kumasaka, T. Protein microcrystallography using synchrotron radiation. IUCrJ 2017, 4, 529–539. [Google Scholar] [CrossRef] [PubMed] [Green Version]
- Fuchs, M.R.; Bhogadi, D.K.; Jakoncic, J.; Myers, S.; Sweet, R.M.; Berman, L.E.; Skinner, J.; Idir, M.; Chubar, O.; McSweeney, S.; et al. NSLS-II biomedical beamlines for micro-crystallography, FMX, and for highly automated crystallography, AMX: New opportunities for advanced data collection. AIP Conf. Proc. 2016, 1741, 030006. [Google Scholar] [Green Version]
- Cherezov, V.; Hanson, M.A.; Griffith, M.T.; Hilgart, M.C.; Sanishvili, R.; Nagarajan, V.; Stepanov, S.; Fischetti, R.F.; Kuhn, P.; Stevens, R.C. Rastering strategy for screening and centring of microcrystal samples of human membrane proteins with a sub-10 microm size X-ray synchrotron beam. J. R. Soc. Interface 2009, 6, S587–S597. [Google Scholar] [CrossRef] [PubMed]
- Aishima, J.; Owen, R.L.; Axford, D.; Shepherd, E.; Winter, G.; Levik, K.; Gibbons, P.; Ashton, A.; Evans, G. High-speed crystal detection and characterization using a fast-readout detector. Acta Crystallogr. D 2010, 66, 1032–1035. [Google Scholar] [CrossRef] [PubMed]
- Bowler, M.W.; Guijarro, M.; Petitdemange, S.; Baker, I.; Svensson, O.; Burghammer, M.; Mueller-Dieckmann, C.; Gordon, E.J.; Flot, D.; McSweeney, S.M.; et al. Diffraction cartography: Applying microbeams to macromolecular crystallography sample evaluation and data collection. Acta Crystallogr. D 2010, 66, 855–864. [Google Scholar] [CrossRef] [PubMed]
- Hilgart, M.C.; Sanishvili, R.; Ogata, C.M.; Becker, M.; Venugopalan, N.; Stepanov, S.; Makarov, O.; Smith, J.L.; Fischetti, R.F. Automated sample-scanning methods for radiation damage mitigation and diffraction-based centering of macromolecular crystals. J. Synchrotron Rad. 2011, 18, 717–722. [Google Scholar] [CrossRef] [Green Version]
- Winter, G.; Waterman, D.G.; Parkhurst, J.M.; Brewster, A.S.; Gildea, R.J.; Gerstel, M.; Fuentes-Montero, L.; Vollmar, M.; Michels-Clark, T.; Young, I.D.; et al. DIALS: Implementation and evaluation of a new integration package. Acta Crystallogr. D 2018, 74, 85–97. [Google Scholar] [CrossRef]
- Zander, U.; Bourenkov, G.; Popov, A.N.; de Sanctis, D.; Svensson, O.; McCarthy, A.A.; Round, E.; Gordeliy, V.; Mueller-Dieckmann, C.; Leonard, G.A. MeshAndCollect: An automated multi-crystal data-collection workflow for synchrotron macromolecular crystallography beamlines. Acta Crystallogr. D Biol. Crystallogr. 2015, 71, 2328–2343. [Google Scholar] [CrossRef] [PubMed]
- Melnikov, I.; Svensson, O.; Bourenkov, G.; Leonard, G.; Popov, A. The complex analysis of X-ray mesh scans for macromolecular crystallography. Acta Crystallogr. D 2018, 74, 355–365. [Google Scholar] [CrossRef]
- Polsinelli, I.; Savko, M.; Rouanet-Mehouas, C.; Ciccone, L.; Nencetti, S.; Orlandini, E.; Stura, E.A.; Shepard, W. Comparison of helical scan and standard rotation methods in single-crystal X-ray data collection strategies. J. Synchrotron Rad. 2017, 24, 42–52. [Google Scholar] [CrossRef] [PubMed]
- Owen, R.L.; Rudiño-Piñera, E.; Garman, E.F. Experimental determination of the radiation dose limit for cryocooled protein crystals. Proc. Natl. Acad. Sci. USA 2006, 103, 4912–4917. [Google Scholar] [CrossRef] [PubMed]
- Kendrew, J.C.; Dickerson, R.E.; Strandberg, B.E.; Hart, R.G.; Davies, D.R.; Phillips, D.C.; Shore, V.C. Structure of Myoglobin: A Three-Dimensional Fourier Synthesis at 2 Å. Resolution. Nature 1960, 185, 422–427. [Google Scholar] [CrossRef] [PubMed]
- Boutet, S.; Lomb, L.; Williams, G.J.; Barends, T.R.M.; Aquila, A.; Doak, R.B.; Weierstall, U.; DePonte, D.P.; Steinbrener, J.; Shoeman, R.L.; et al. High-Resolution Protein Structure Determination by Serial Femtosecond Crystallography. Science 2012, 337, 362–364. [Google Scholar] [CrossRef] [PubMed] [Green Version]
- Guo, G.; Fuchs, M.R.; Shi, W.; Skinner, J.; Berman, E.; Ogata, C.M.; Hendrickson, W.A.; McSweeney, S.; Liu, Q. Sample manipulation and data assembly for robust microcrystal synchrotron crystallography. IUCrJ 2018, 5, 238–246. [Google Scholar] [CrossRef] [PubMed] [Green Version]
- Gao, Y.; Xu, W.; Shi, W.; Soares, A.; Jakoncic, J.; Myers, S.; Martins, B.; Skinner, J.; Liu, Q.; Bernstein, H.; et al. High-speed raster-scanning synchrotron serial microcrystallography with a high-precision piezo-scanner. J. Synchrotron Rad. 2018, 25, 1362–1370. [Google Scholar] [CrossRef]
- Bury, C.S.; Brooks-Bartlett, J.C.; Walsh, S.P.; Garman, E.F. Estimate your dose: RADDOSE-3D. Protein Sci. 2018, 27, 217–228. [Google Scholar] [CrossRef]
- Grosse-Kunstleve, R.W.; Sauter, N.K.; Moriarty, N.W.; Adams, P.D. The Computational Crystallography Toolbox: Crystallographic algorithms in a reusable software framework. J. Appl. Crystallogr. 2002, 35, 126–136. [Google Scholar] [CrossRef]
- Kabsch, W. Integration, scaling, space-group assignment and post-refinement. Acta Crystallogr. D 2010, 66, 133–144. [Google Scholar] [CrossRef] [Green Version]
- Winter, G.; McAuley, K.E. Automated data collection for macromolecular crystallography. Methods 2011, 55, 81–93. [Google Scholar] [CrossRef]
- Winn, M.D.; Ballard, C.C.; Cowtan, K.D.; Dodson, E.J.; Emsley, P.; Evans, P.R.; Keegan, R.M.; Krissinel, E.B.; Leslie, A.G.W.; McCoy, A.; et al. Overview of the CCP4 suite and current developments. Acta Crystallogr. D 2011, 67, 235–242. [Google Scholar] [CrossRef] [PubMed]
- Vagin, A.; Teplyakov, A. Molecular replacement with MOLREP. Acta Crystallogr. D 2010, 66, 22–25. [Google Scholar] [CrossRef] [PubMed]
- Chu, N.; Salguero, A.L.; Liu, A.Z.; Chen, Z.; Dempsey, D.R.; Ficarro, S.B.; Alexander, W.M.; Marto, J.A.; Li, Y.; Amzel, L.M.; et al. Akt Kinase Activation Mechanisms Revealed Using Protein Semisynthesis. Cell 2018, 174, 897–907.e14. [Google Scholar] [CrossRef] [PubMed]
- Vagin, A.A.; Steiner, R.A.; Lebedev, A.A.; Potterton, L.; McNicholas, S.; Long, F.; Murshudov, G.N. REFMAC5 dictionary: Organization of prior chemical knowledge and guidelines for its use. Acta Crystallogr. D 2004, 60, 2184–2195. [Google Scholar] [CrossRef] [PubMed]
- Emsley, P.; Cowtan, K. Coot: Model-building tools for molecular graphics. Acta Crystallogr. D 2004, 60, 2126–2132. [Google Scholar] [CrossRef] [PubMed]
- Miller, M.S.; Schmidt-Kittler, O.; Bolduc, D.M.; Brower, E.T.; Chaves-Moreira, D.; Allaire, M.; Kinzler, K.W.; Jennings, I.G.; Thompson, P.E.; Amzel, L.M.; et al. Structural basis of nSH2 regulation and lipid binding in PI3Kα. Oncotarget 2014, 5, 5198–5208. [Google Scholar] [CrossRef] [PubMed] [Green Version]
- Duong-Ly, K.C.; Gabelli, S.B.; Xu, W.; Dunn, C.A.; Schoeffield, A.J.; Bessman, M.J.; Amzel, L.M. The Nudix hydrolase CDP-chase, a CDP-choline pyrophosphatase, is an asymmetric dimer with two distinct enzymatic activities. J. Bacteriol. 2011, 193, 3175–3185. [Google Scholar] [CrossRef] [PubMed]
- Fruman, D.A.; Chiu, H.; Hopkins, B.D.; Bagrodia, S.; Cantley, L.C.; Abraham, R.T. The PI3K Pathway in Human Disease. Cell 2017, 170, 605–635. [Google Scholar] [CrossRef] [PubMed]
- Manning, B.D.; Toker, A. AKT/PKB Signaling: Navigating the Network. Cell 2017, 169, 381–405. [Google Scholar] [CrossRef] [PubMed] [Green Version]
- Miller, M.S.; Maheshwari, S.; McRobb, F.M.; Kinzler, K.W.; Amzel, L.M.; Vogelstein, B.; Gabelli, S.B. Identification of allosteric binding sites for PI3Kα oncogenic mutant specific inhibitor design. Bioorg. Med. Chem. 2017, 25, 1481–1486. [Google Scholar] [CrossRef] [PubMed] [Green Version]
- Huang, C.H.; Mandelker, D.; Schmidt-Kittler, O.; Samuels, Y.; Velculescu, V.E.; Kinzler, K.W.; Vogelstein, B.; Gabelli, S.B.; Amzel, L.M. The structure of a human p110α/p85α complex elucidates the effects of oncogenic PI3Kα mutations. Science 2007, 318, 1744–1748. [Google Scholar] [CrossRef] [PubMed]
- Prigge, S.T.; Mains, R.E.; Eipper, B.A.; Amzel, L.M. New insights into copper monooxygenases and peptide amidation: Structure, mechanism and function. Cell. Mol. Life Sci. 2000, 57, 1236–1259. [Google Scholar] [CrossRef] [PubMed]
- Maheshwari, S.; Shimokawa, C.; Rudzka, K.; Kline, C.D.; Eipper, B.A.; Mains, R.E.; Gabelli, S.B.; Blackburn, N.; Amzel, L.M. Effects of copper occupancy on the conformational landscape of peptidylglycine α-hydroxylating monooxygenase. Commun. Biol. 2018, 1, 74–84. [Google Scholar] [CrossRef] [PubMed]
- Bessman, M.J.; Frick, D.N.; O’Handley, S.F. The MutT Proteins or “Nudix” Hydrolases, a Family of Versatile, Widely Distributed, “Housecleaning” Enzymes. J. Biol. Chem. 1996, 271, 25059–25062. [Google Scholar] [CrossRef] [PubMed]
- Mildvan, A.S.; Xia, Z.; Azurmendi, H.F.; Saraswat, V.; Legler, P.M.; Massiah, M.A.; Gabelli, S.B.; Bianchet, M.A.; Kang, L.-W.; Amzel, L.M. Structures and mechanisms of Nudix hydrolases. Arch. Biochem. Biophys. 2005, 433, 129–143. [Google Scholar] [CrossRef] [PubMed]
- Owen, R.L.; Juanhuix, J.; Fuchs, M. Current advances in synchrotron radiation instrumentation for MX experiments. Arch. Biochem. Biophys. 2016, 602, 21–31. [Google Scholar] [CrossRef] [PubMed] [Green Version]
- Dauter, Z. Efficient use of synchrotron radiation for macromolecular diffraction data collection. Prog. Biophys. Mol. Biol. 2005, 89, 153–172. [Google Scholar] [CrossRef]
- Evans, G.; Axford, D.; Owen, R.L. The design of macromolecular crystallography diffraction experiments. Acta Crystallogr. D 2011, 67, 261–270. [Google Scholar] [CrossRef] [Green Version]
- Dauter, Z. Collection of X-Ray Diffraction Data from Macromolecular Crystals. Methods Mol. Biol. 2017, 1607, 165–184. [Google Scholar] [Green Version]
- Garman, E.F. Radiation damage in macromolecular crystallography: What is it and why should we care? Acta Crystallogr. D 2010, 66, 339–351. [Google Scholar] [CrossRef]
- Nave, C. Matching X-ray source, optics and detectors to protein crystallography requirements. Acta Crystallogr. D 1999, 55, 1663–1668. [Google Scholar] [CrossRef] [PubMed] [Green Version]
- Svensson, O.; Gilski, M.; Nurizzo, D.; Bowler, M.W. Multi-position data collection and dynamic beam sizing: Recent improvements to the automatic data-collection algorithms on MASSIF-1. Acta Crystallogr. D 2018, 74, 433–440. [Google Scholar] [CrossRef] [PubMed]
- Holton, J.M. A beginner’s guide to radiation damage. J. Synchrotron Rad. 2009, 16, 133–142. [Google Scholar] [CrossRef] [PubMed]
- Hausmann, J.; Christodoulou, E.; Kasiem, M.; De Marco, V.; van Meeteren, L.A.; Moolenaar, W.H.; Axford, D.; Owen, R.L.; Evans, G.; Perrakis, A. Mammalian cell expression, purification, crystallization and microcrystal data collection of autotaxin/ENPP2, a secreted mammalian glycoprotein. Acta Crystallogr. F 2010, 66, 1130–1135. [Google Scholar] [CrossRef] [PubMed]
- Liu, Q.; Dahmane, T.; Zhang, Z.; Assur, Z.; Brasch, J.; Shapiro, L.; Mancia, F.; Hendrickson, W.A. Structures from Anomalous Diffraction of Native Biological Macromolecules. Science 2012, 336, 1033–1037. [Google Scholar] [CrossRef] [PubMed] [Green Version]
- Giordano, R.; Leal, R.M.F.; Bourenkov, G.P.; McSweeney, S.; Popov, A.N. The application of hierarchical cluster analysis to the selection of isomorphous crystals. Acta Crystallogr. D 2012, 68, 649–658. [Google Scholar] [CrossRef] [PubMed]
- Foadi, J.; Aller, P.; Alguel, Y.; Cameron, A.; Axford, D.; Owen, R.L.; Armour, W.; Waterman, D.G.; Iwata, S.; Evans, G. Clustering procedures for the optimal selection of data sets from multiple crystals in macromolecular crystallography. Acta Crystallogr. D 2013, 69, 1617–1632. [Google Scholar] [CrossRef]
- Weiss, M.S. Global indicators of X-ray data quality. J. Appl. Crystallogr. 2001, 34, 130–135. [Google Scholar] [CrossRef] [Green Version]
- Karplus, P.A.; Diederichs, K. Linking Crystallographic Model and Data Quality. Science 2012, 336, 1030–1033. [Google Scholar] [CrossRef] [Green Version]
- Holton, J.M.; Frankel, K.A. The minimum crystal size needed for a complete diffraction data set. Acta Crystallogr. D 2010, 66, 393–408. [Google Scholar] [CrossRef]
- Maheshwari, S.; Miller, M.S.; O’Meally, R.; Cole, R.N.; Amzel, L.M.; Gabelli, S.B. Kinetic and structural analyses reveal residues in phosphoinositide 3-kinase α that are critical for catalysis and substrate recognition. J. Biol. Chem. 2017, 292, 13541–13550. [Google Scholar] [CrossRef] [PubMed]
Sample Availability: Expression vectors for PI3K (p110α-16644; p85α-niSH2-17744) and CDP-Chase (73161) have been deposited in Addgene. The expression vector for Akt1 is available from P.A.C ([email protected]). |


| Akt1 6NPZ | PI3Kα 6NCT | CDP-Chase/ADP-Ribose (Single) 6NCI | CDP-Chase/ADP-Ribose (Multi) 6NCH | H108A-PHM 6NCK | |
|---|---|---|---|---|---|
| Data Collection | |||||
| Diffraction source | NSLS-II X17-ID-1 | NSLS-II X17-ID-1 | NSLS-II X17-ID-2 | NSLS-II X17-ID-2 | NSLS-II X17-ID-1 |
| Wavelength (Å) | 0.99962 | 0.919909 | 0.97934 | 0.97934 | 0.918394 |
| Beam size (µm) | 8 × 6 | 7 × 5 | 5 × 6 | 5 × 6 | 7 × 5 |
| Temperature (K) | 100 | 100 | 100 | 100 | 100 |
| Detector | Dectris Eiger 9M | Dectris Eiger 9M | Dectris Eiger 16M | Dectris Eiger 16M | Dectris Eiger 9M |
| Rotation range per image (°) | 0.2 | 0.2 | 0.2 | 0.2 | 0.2 |
| Total rotation range (°) | 180 | 140 | 280 | 119 | 140 |
| Space group | p21 | p212121 | p212121 | p212121 | p212121 |
| a, b, c (Å) | 86.32, 56.09, 92.02 | 115.36, 117.72, 151.33 | 61.77, 67.01, 111.43 | 61.71, 67.20, 111.29 | 59.31, 65.88, 69.75 |
| α, β, γ (°) | 90.00, 104.56, 90.00 | 90.00, 90.00, 90.00 | 90.00, 90.00, 90.00 | 90.00, 90.00, 90.00 | 90.00, 90.00, 90.00 |
| Resolution range (Å) | 29.82–2.12 (2.17–2.12) | 49.54–3.35 (3.47–3.35) | 29.47–2.08 (2.13–2.08) | 19.76–2.00 (2.05–2.00) | 47.89–2.70 (2.80–2.70) |
| Total no. of observations | 326,363 | 159,060 | 369,062 | 213,498 | 38,364 |
| No. of unique observations | 48,316 | 29,228 | 28,297 | 30,674 | 7872 |
| Completeness (%) | 98.5 (81.8) | 96.4 (97.2) | 98.8 (84.5) | 96.6 (96.8) | 99.6 (99.3) |
| Redundancy | 6.8 (6.6) | 5.4 (5.4) | 13.0 (11.2) | 7.0 (7.0) | 4.9 (4.2) |
| 〈I/σ(I)〉 | 11.3 (2.0) | 11.8 (1.5) | 14.4 (2.6) | 4.3 (1.8) | 8.2 (2.8) |
| Rmerge | 0.101 (0.760) | 0.104 (0.935) | 0.136 (0.942) | 0.357 (1.11) | 0.130 (0.580) |
| Rp.i.m. | 0.042 (0.314) | 0.046 (0.418) | 0.039 (0.280) | 0.137 (0.425) | 0.062 (0.309) |
| CC1/2 | 0.996 (0.849) | 0.998 (0.685) | 0.998 (0.818) | 0.941 (0.608) | 0.991 (0.830) |
| Refinement | |||||
| Resolution range (Å) | 89.07–2.12 (2.17–2.12) | 49.54–3.35 (3.44–3.35) | 29.47–2.08 (2.13–2.08) | 19.76–2.00 (2.05–2.00) | 44.08–2.70 (2.77–2.70) |
| No. of reflections, working set | 45,932 | 27,765 | 26,741 | 29,211 | 7477 |
| No. of reflections, test set | 2364 | 1462 | 1502 | 1461 | 394 |
| Rwork/Rfree | 0.185/0.241 (0.249/0.316) | 0.199/0.270 (0.314/0.343) | 0.171/0.222 (0.241/0.291) | 0.200/0.261 (0.276/0.334) | 0.219/0.294 (0.322/0.342) |
| No. of non-H atoms | |||||
| Protein | 5406 | 10,462 | 3288 | 3311 | 2350 |
| Ligand/ion | 178 | 31 | 52 | 25 | 2 |
| Water | 475 | 0 | 255 | 366 | 20 |
| R.m.s. deviations | |||||
| Bonds (Å) | 0.016 | 0.013 | 0.009 | 0.008 | 0.008 |
| Angles (°) | 2.06 | 1.95 | 1.51 | 1.45 | 1.54 |
| Average B factors (Å2) | |||||
| Protein | 41.7 | 133.8 | 35.7 | 27.6 | 58.9 |
| Ligand/ion | 56.2 | 189.2 | 78.0 | 51.8 | 109.4 |
| Water | 45.8 | n/a | 40.9 | 34.7 | 41.6 |
| Ramachandran (%) | |||||
| Favorable | 96.4 | 95.1 | 97.2 | 96.9 | 95.6 |
| Allowed | 2.0 | 4.5 | 2.6 | 3.1 | 4.4 |
| Disallowed | 1.6 | 0.4 | 0.2 | 0 | 0 |
© 2019 by the authors. Licensee MDPI, Basel, Switzerland. This article is an open access article distributed under the terms and conditions of the Creative Commons Attribution (CC BY) license (http://creativecommons.org/licenses/by/4.0/).
Share and Cite
Miller, M.S.; Maheshwari, S.; Shi, W.; Gao, Y.; Chu, N.; Soares, A.S.; Cole, P.A.; Amzel, L.M.; Fuchs, M.R.; Jakoncic, J.; et al. Getting the Most Out of Your Crystals: Data Collection at the New High-Flux, Microfocus MX Beamlines at NSLS-II. Molecules 2019, 24, 496. https://doi.org/10.3390/molecules24030496
Miller MS, Maheshwari S, Shi W, Gao Y, Chu N, Soares AS, Cole PA, Amzel LM, Fuchs MR, Jakoncic J, et al. Getting the Most Out of Your Crystals: Data Collection at the New High-Flux, Microfocus MX Beamlines at NSLS-II. Molecules. 2019; 24(3):496. https://doi.org/10.3390/molecules24030496
Chicago/Turabian StyleMiller, Michelle S., Sweta Maheshwari, Wuxian Shi, Yuan Gao, Nam Chu, Alexei S. Soares, Philip A. Cole, L. Mario Amzel, Martin R. Fuchs, Jean Jakoncic, and et al. 2019. "Getting the Most Out of Your Crystals: Data Collection at the New High-Flux, Microfocus MX Beamlines at NSLS-II" Molecules 24, no. 3: 496. https://doi.org/10.3390/molecules24030496