Study on Speciation of As, Cr, and Sb in Bottled Flavored Drinking Water Samples Using Advanced Analytical Techniques IEC/SEC-HPLC/ICP-DRC-MS and ESI-MS/MS

 , , and
Abstract
: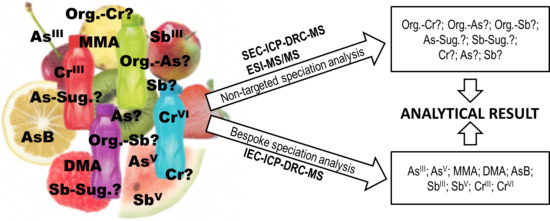
1. Introduction
2. Results and Discussion
2.1. Validation
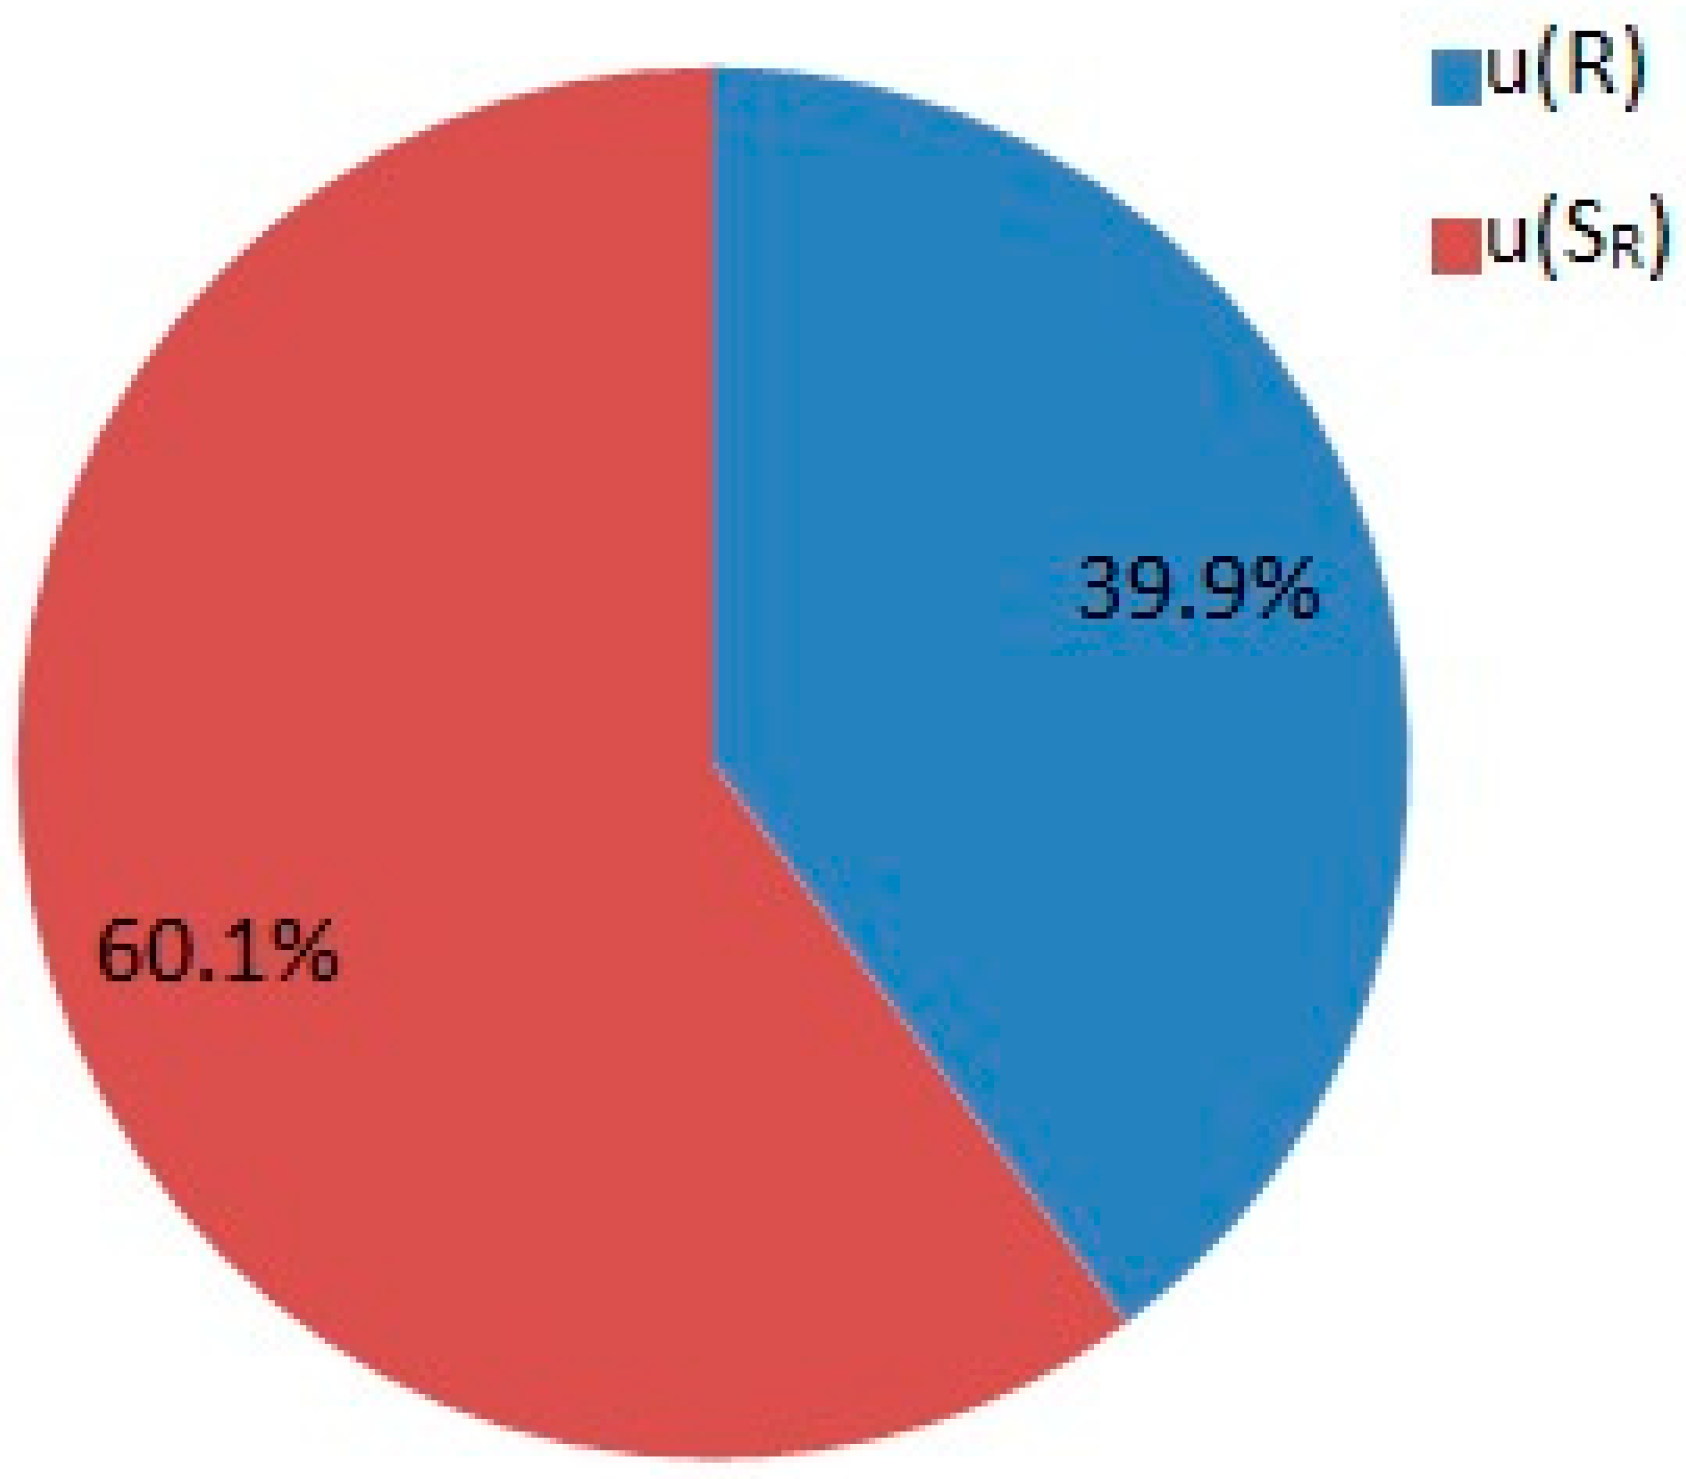
2.2. Uncertainty Budget Estimation
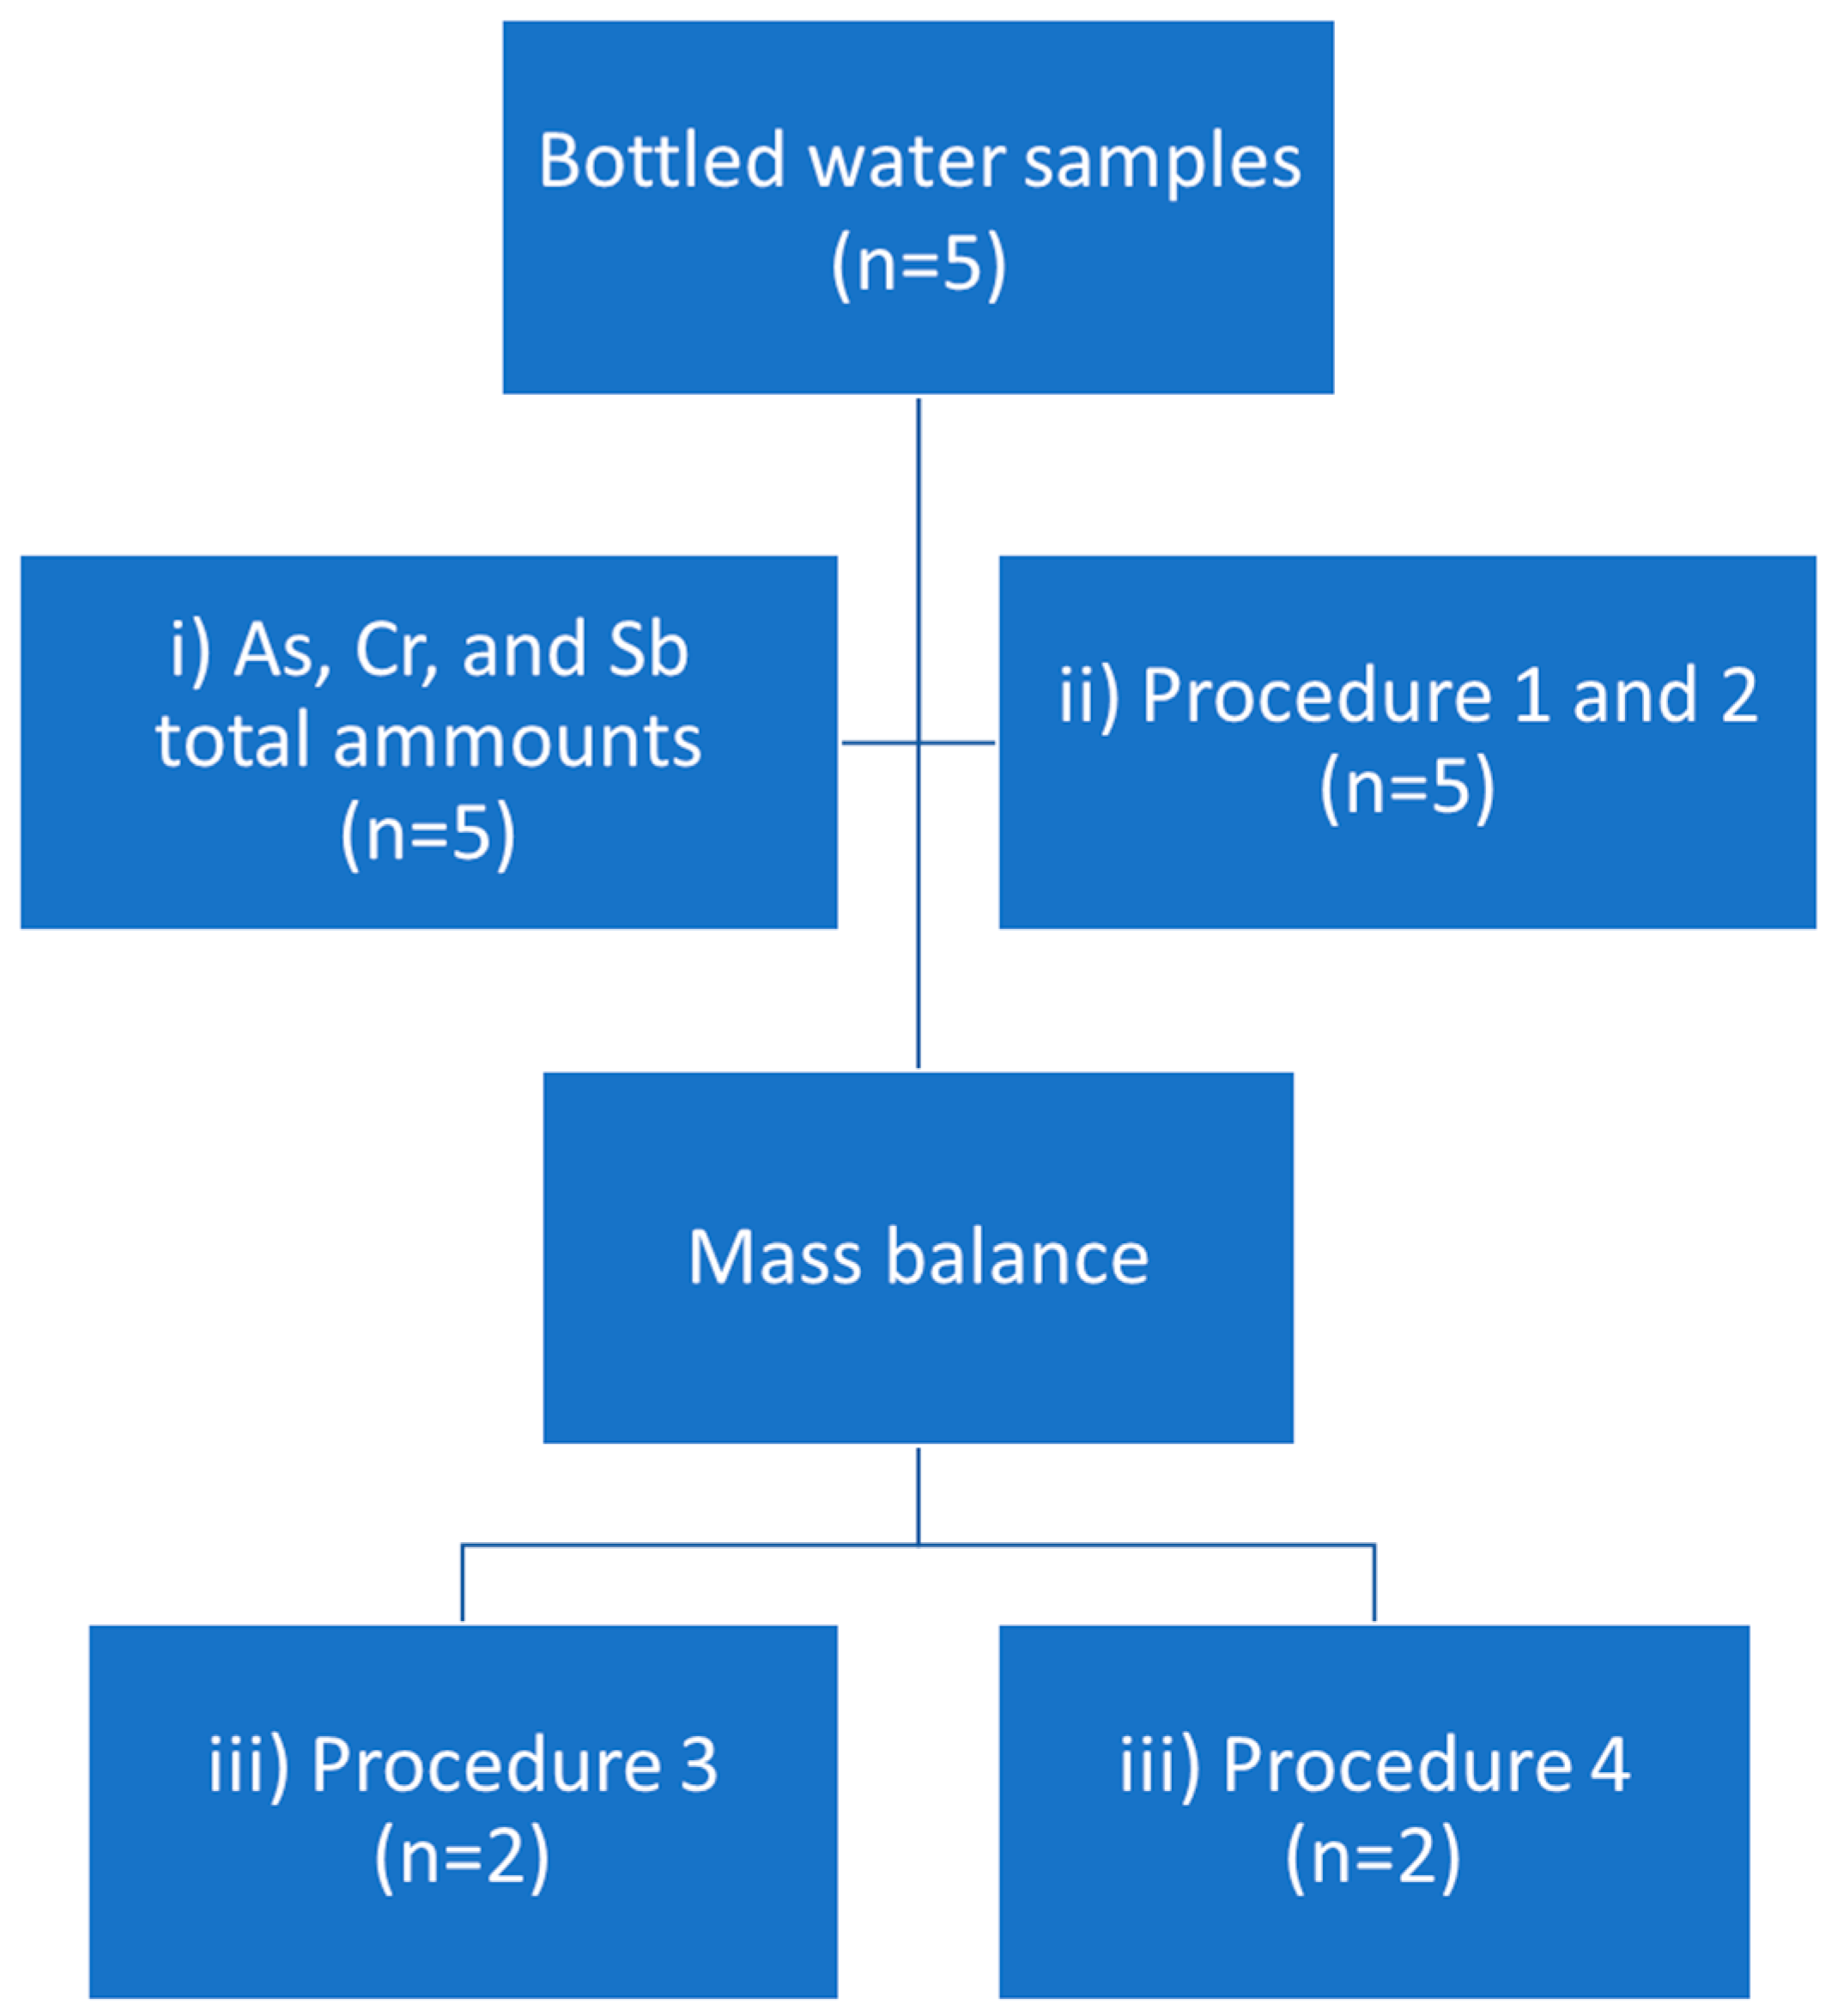
2.3. Results for Real Samples
2.3.1. Procedures 1 and 2
2.3.2. Procedures 3 and 4
3. Materials and Methods
3.1. Instrumentation
3.2. Analytical Procedures
3.2.1. Procedure 1
3.2.2. Procedure 2
3.2.3. Procedure 3
3.2.4. Procedure 4
3.3. Sample Collection and Preparation
3.4. Chemicals and Reagents
3.4.1. As, Cr, and Sb Working Solutions
3.4.2. Mobile Phases
3.4.3. Other Reagents
3.5. Calibration
3.6. Analytical Procedure Validation
3.6.1. Linearity
3.6.2. Limits of Detection
3.6.3. Precision
3.6.4. Trueness
3.7. Measurement Uncertainty
4. Conclusions
Supplementary Materials
Author Contributions
Funding
Conflicts of Interest
List of Abbreviations
References
- Cidu, R.; Frau, F.; Tore, P. Drinking water quality: Comparing inorganic components in bottled water and Italian tap water. J. Food Compos. Anal. 2011, 24, 184–193. [Google Scholar] [CrossRef]
- Etale, A.; Jobin, M.; Siegrist, M. Tap versus bottled water consumption: The influence of social norms, affect and image on consumer choice. Appetite 2018, 121, 138–146. [Google Scholar] [CrossRef] [PubMed]
- Mandlate, J.S.; Soares, B.M.; Seeger, T.S.; Dalla Vecchia, P.; Mello, P.A.; Flores, E.M.M.; Duarte, F.A. Determination of cadmium and lead at sub-ppt level in soft drinks: An efficient combination between dispersive liquid-liquid microextraction and graphite furnace atomic absorption spectrometry. Food Chem. 2017, 221, 907–912. [Google Scholar] [CrossRef] [PubMed]
- Reimann, C.; Birke, M.; Filzmoser, P. Bottled drinking water: Water contamination from bottle materials (glass, hard PET, soft PET), the influence of colour and acidification. Appl. Geochem. 2010, 25, 1030–1046. [Google Scholar] [CrossRef] [Green Version]
- Chapa-Martínez, C.A.; Hinojosa-Reyes, L.; Hernández-Ramírez, A.; Ruiz-Ruiz, E.; Maya-Treviño, L.; Guzmán-Mar, J.L. An evaluation of the migration of antimony from polyethylene terephthalate (PET) plastic used for bottled drinking water. Sci. Total Environ. 2016, 565, 511–518. [Google Scholar] [CrossRef]
- Reimann, C.; Birke, M.; Filzmoser, P. Temperature-dependent leaching of chemical elements from mineral water bottle materials. Appl. Geochem. 2012, 27, 1492–1498. [Google Scholar] [CrossRef]
- Marcinkowska, M.; Lorenc, W.; Barałkiewicz, D. Study of the impact of bottles material and color on the presence of AsIII, AsV, SbIII, SbV and CrVI in matrix-rich mineral water—Multielemental speciation analysis by HPLC/ICP-DRC-MS. Microchem. J. 2017, 132, 1–7. [Google Scholar] [CrossRef]
- Bach, C.; Dauchy, X.; Chagnon, M.-C.; Etienne, S. Chemical compounds and toxicological assessments of drinking water stored in polyethylene terephthalate (PET) bottles: A source of controversy reviewed. Water Res. 2012, 46, 571–583. [Google Scholar] [CrossRef]
- Sánchez-Martínez, M.; Pérez-Corona, T.; Cámara, C.; Madrid, Y. Migration of antimony from PET containers into regulated EU food simulants. Food Chem. 2013, 141, 816–822. [Google Scholar] [CrossRef]
- Carneado, S.; Hernández-Nataren, E.; López-Sánchez, J.F.; Sahuquillo, A. Migration of antimony from polyethylene terephthalate used in mineral water bottles. Food Chem. 2015, 166, 544–550. [Google Scholar] [CrossRef] [Green Version]
- Mihucz, V.G.; Záray, G. Occurrence of antimony and phthalate esters in polyethylene terephthalate bottled drinking water. Appl. Spectrosc. Rev. 2016, 51, 183–209. [Google Scholar] [CrossRef]
- Shotyk, W.; Krachler, M.; Chen, B. Contamination of Canadian and European bottled waters with antimony from PET containers. J. Environ. Monit. 2006, 8, 288. [Google Scholar] [CrossRef] [PubMed]
- Bach, C.; Dauchy, X.; Severin, I.; Munoz, J.-F.; Etienne, S.; Chagnon, M.-C. Effect of temperature on the release of intentionally and non-intentionally added substances from polyethylene terephthalate (PET) bottles into water: Chemical analysis and potential toxicity. Food Chem. 2013, 139, 672–680. [Google Scholar] [CrossRef] [PubMed]
- Bach, C.; Dauchy, X.; Severin, I.; Munoz, J.-F.; Etienne, S.; Chagnon, M.-C. Effect of sunlight exposure on the release of intentionally and/or non-intentionally added substances from polyethylene terephthalate (PET) bottles into water: Chemical analysis and in vitro toxicity. Food Chem. 2014, 162, 63–71. [Google Scholar] [CrossRef] [PubMed]
- Shotyk, W.; Krachler, M. Contamination of Bottled Waters with Antimony Leaching from Polyethylene Terephthalate (PET) Increases upon Storage. Environ. Sci. Technol. 2007, 41, 1560–1563. [Google Scholar] [CrossRef] [PubMed]
- Hansen, C.; Tsirigotaki, A.; Bak, S.A.; Pergantis, S.A.; Gammelgaard, B.; Usz Hansen, H. Elevated antimony concentrations in commercial juices. J. Environ. Monit. 2010, 12, 822–824. [Google Scholar] [CrossRef] [PubMed]
- Ruz Hansen, H.; Pergantis, S.A. Detection of antimony species in citrus juices and drinking water stored in PET containersw. J. Anal. At. Spectrom. 2006, 8, 731–733. [Google Scholar]
- Komorowicz, I.; Barałkiewicz, D. Determination of total arsenic and arsenic species in drinking water, surface water, wastewater, and snow from Wielkopolska, Kujawy-Pomerania, and Lower Silesia provinces, Poland. Environ. Monit. Assess. 2016, 188, 504. [Google Scholar] [CrossRef]
- Westerhoff, P.; Prapaipong, P.; Shock, E.; Hillaireau, A. Antimony leaching from polyethylene terephthalate (PET) plastic used for bottled drinking water. Water Res. 2008, 42, 551–556. [Google Scholar] [CrossRef]
- Fiket, Ž.; Mikac, N.; Kniewald, G. Determination of trace elements in wines by high resolution inductively coupled plasma mass spectrometry. At. Spectrosc. 2010, 31, 44–55. [Google Scholar]
- Misund, A.; Frengstad, B.; Siewers, U.; Reimann, C. Variation of 66 elements in European bottled mineral waters. Sci. Total Environ. 1999, 243–244, 21–41. [Google Scholar] [CrossRef]
- Dabeka, R.W.; Conacher, H.B.S.; Lawrence, J.F.; Newsome, W.H.; McKenzie, A.; Wagner, H.P.; Chadha, R.K.H.; Pepper, K. Survey of bottled drinking waters sold in Canada for chlorate, bromide, bromate, lead, cadmium and other trace elements. Food Addit. Contam. 2002, 19, 721–732. [Google Scholar] [CrossRef] [PubMed]
- Hadiani, M.R.; Dezfooli-manesh, S.; Shoeibi, S.; Ziarati, P.; Mousavi Khaneghah, A. Trace elements and heavy metals in mineral and bottled drinking waters on the Iranian market. Food Addit. Contam. Part B 2015, 8, 18–24. [Google Scholar] [CrossRef] [PubMed]
- El-Hadri, F.; Morales-Rubio, A.; de la Guardia, M. Determination of total arsenic in soft drinks by hydride generation atomic fluorescence spectrometry. Food Chem. 2007, 105, 1195–1200. [Google Scholar] [CrossRef]
- Bruna, B.; Francisco, A.; Brum, D.M.; Cassella, R.J. Determination of metals in soft drinks packed in different materials by ETAAS. Food Chem. 2015, 185, 488–494. [Google Scholar] [Green Version]
- Garcıa, E.M.; Cabrera, C.; Sanchez, J.; Lorenzo, M.L.; Lopez, M.C. Chromium levels in potable water, fruit juices and soft drinks: Influence on dietary intake. Sci. Total Environ. 1999, 241, 143–150. [Google Scholar] [CrossRef]
- Tvermoes, B.E.; Banducci, A.M.; Devlin, K.D.; Kerger, B.D.; Abramson, M.M.; Bebenek, I.G.; Monnot, A.D. Screening level health risk assessment of selected metals in apple juice sold in the United States. Food Chem. Toxicol. 2014, 71, 42–50. [Google Scholar] [CrossRef]
- Rowell, C.; Kuiper, N.; Preud’homme, H. Is container type the biggest predictor of trace element and BPA leaching from drinking water bottles? Food Chem. 2016, 202, 88–93. [Google Scholar] [CrossRef]
- Marcinkowska, M.; Barałkiewicz, D. Multielemental speciation analysis by advanced hyphenated technique – HPLC/ICP-MS: A review. Talanta 2016, 161, 177–204. [Google Scholar] [CrossRef]
- Antimony in Drinking-Water Background Document for Development of WHO Guidelines for Drinking-Water Quality. Available online: http://www.who.int/water_sanitation_health/dwq/chemicals/antimony.pdf (accessed on 16 February 2018).
- Tchounwou, P.B.; Yedjou, C.G.; Patlolla, A.K.; Sutton, D.J. Heavy metal toxicity and the environment. EXS 2012, 101, 133–164. [Google Scholar]
- Zhitkovich, A. Chromium in Drinking Water: Sources, Metabolism, and Cancer Risks. Chem. Res. Toxicol. 2011, 24, 1617–1629. [Google Scholar] [CrossRef] [PubMed]
- European Commission Directive Council Directive 98/83/EC of 3 November 1998 on the Quality of Water Intended for Human Consumption. Available online: https://eur-lex.europa.eu/legal-content/EN/TXT/PDF/?uri=CELEX:31998L0083&from=EN (accessed on 30 January 2019).
- Nearing, M.M.; Koch, I.; Reimer, K.J. Complementary arsenic speciation methods: A review. Spectrochim. Acta Part B At. Spectrosc. 2014, 99, 150–162. [Google Scholar] [CrossRef]
- Chantada-Vázquez, M.P.; Moreda-Piñeiro, A.; Barciela-Alonso, M.C.; Bermejo-Barrera, P. Spectrometric-based techniques for metal-binding protein assessment in clinical, environmental, and food samples. Appl. Spectrosc. Rev. 2017, 52, 145–174. [Google Scholar] [CrossRef]
- Marcinkowska, M.; Komorowicz, I.; Barałkiewicz, D. New procedure for multielemental speciation analysis of five toxic species: As(III), As(V), Cr(VI), Sb(III) and Sb(V) in drinking water samples by advanced hyphenated technique HPLC/ICP-DRC-MS. Anal. Chim. Acta 2016, 920, 102–111. [Google Scholar] [CrossRef] [PubMed]
- Komorowicz, I.; Barałkiewicz, D. Arsenic speciation in water by high-performance liquid chromatography/inductively coupled plasma mass spectrometry-method validation and uncertainty estimation. Rapid Commun. Mass Spectrom. 2014, 28, 159–168. [Google Scholar] [CrossRef] [PubMed]
- Komorowicz, I.; Barałkiewicz, D. Arsenic and its speciation in water samples by high performance liquid chromatography inductively coupled plasma mass spectrometry—Last decade review. Talanta 2011, 84, 247–261. [Google Scholar] [CrossRef] [PubMed]
- Feldmann, J.; Raab, A.; Krupp, E.M. Importance of ICPMS for speciation analysis is changing: Future trends for targeted and non-targeted element speciation analysis. Anal. Bioanal. Chem. 2018, 410, 661–667. [Google Scholar] [CrossRef]
- Zheng, J.; Iijima, A.; Furuta, N. Complexation effect of antimony compounds with citric acid and its application to the speciation of antimony(III) and antimony(V) using HPLC-ICP-MS. J. Anal. At. Spectrom. 2001, 16, 812–818. [Google Scholar] [CrossRef]
- Shoeib, T.; Mester, Z. Towards the characterization of metal binding proteins in metal enriched yeast. Microchem. J. 2007, 85, 329–340. [Google Scholar] [CrossRef]
- Joint Committee for Guides in Metrology International Vocabulary of Metrology—Basic and General Concepts and Associated Terms (VIM). Available online: https://www.bipm.org/utils/common/documents/jcgm/JCGM_200_2012.pdf (accessed on 25 January 2018).
- King, B. The practical realization of the traceability of chemical measurements standards. Accredit. Qual. Assur. 2000, 5, 429–436. [Google Scholar] [CrossRef]
- Ruggieri, F.; Alimonti, A.; Bocca, B. Full validation and accreditation of a method to support human biomonitoring studies for trace and ultra-trace elements. TrAC Trends Anal. Chem. 2016, 80, 471–485. [Google Scholar] [CrossRef]
- Raposo, F. Evaluation of analytical calibration based on least-squares linear regression for instrumental techniques: A tutorial review. TrAC Trends Anal. Chem. 2016, 77, 167–185. [Google Scholar] [CrossRef]
- Belter, M.; Sajnóg, A.; Barałkiewicz, D. Over a century of detection and quantification capabilities in analytical chemistry—Historical overview and trends. Talanta 2014, 129, 606–616. [Google Scholar] [CrossRef]
- Currie, L.A. Detection and quantification limits: Origins and historical overview. Anal. Chim. Acta 1999, 391, 127–134. [Google Scholar] [CrossRef]
- International Conference on Harmonisation Validation of Analytical Procedures: Text and Methodology Q2 (R1). Available online: http://www.ich.org/fileadmin/Public_Web_Site/ICH_Products/Guidelines/Quality/Q2_R1/Step4/Q2_R1__Guideline.pdf (accessed on 25 January 2018).
- Thompson, M.; Ellison, S.L.R.; Fajgelj, A.; Willetts, P.; Wood, R. Harmonized guidelines for the use of recovery information in analytical measurement. Pure Appl. Chem. 1999, 71, 337–348. [Google Scholar] [CrossRef]
- Murtas, S.; Gaggioli, A.; von Hunolstein, C. Quantifying uncertainty in determination of polysaccharides in glycoconjugate vaccines based on in-house validation data. Accredit. Qual. Assur. 2012, 17, 177–182. [Google Scholar] [CrossRef]
- Barwick, V.; Ellison, S. Development and Harmonisation of Measurement Uncertainty Principles; Technical Report for Protocol for uncertainty evaluation from validation data; Department of Trade and Industry as part of the National Measurement Systems Valid Analytical Measurement (VAM) Programme: Teddington, UK, 2000. [Google Scholar]
Sample Availability: Not available. |


| Analytical Procedure Parameter | Analyte | ||||
|---|---|---|---|---|---|
| Procedure 1 | AsIII | AsV | CrVI | SbIII | SbV |
| Retention time [min] | 1.4 | 2.0 | 7.2 | 4.4 | 1.7 |
| Linear range [µg L−1] | 0.2–5.0 | 0.2–5.0 | 0.5–5.0 | 0.5–5.0 | 0.1–5.0 |
| Determination coefficient range | 0.997–0.9999 | 0.996–0.9999 | 0.998–1.0000 | 0.999–0.9999 | 0.997–1.0000 |
| LOD [µg L−1] | 0.058 | 0.051 | 0.12 | 0.090 | 0.046 |
| Recovery at 0.5 µg L−1 [%] | 101 | 99 | 109 | 97 | 103 |
| Intermediate precision [%] | 4.3 | 5.5 | 2.5 | 3.1 | 5.5 |
| Expanded uncertainty (k = 2) [% of analyte concentration] | 9.4 | 9.2 | 6.1 | 6.6 | 6.2 |
| Procedure 2 | AsB | AsIII | DMA | MMA | AsV |
| Retention time [min] | 1.5 | 1.8 | 2.1 | 4.0 | 5.8 |
| Linear range [µg L−1] | 0.5–10.0 | 0.5–10.0 | 0.5–10.0 | 0.5–10.0 | 0.5–10.0 |
| Determination coefficient range | 0.995–0.999 | 0.995–0.9999 | 0.996–0.9999 | 0.997–0.9999 | 0.996–0.9999 |
| LOD [µg L−1] | 0.054 | 0.081 | 0.053 | 0.10 | 0.080 |
| Recovery at 1 µg L−1 [%] | 106 | 99 | 102 | 104 | 100 |
| Intermediate precision [%] | 3.6 | 4.8 | 3.9 | 7.2 | 4.4 |
| Expanded uncertainty (k = 2) [% of analyte concentration] | 9.8 | 9.9 | 8.7 | 9.0 | 7.4 |
| Procedure 3 | Conalbumin 75 kDa | Ovalbumin 43 kDa | Carbonic anhydrase 29 kDa | Ribonuclease A 13.7 kDa | Aprotinin 6.5 kDa |
| Retention Time [min] | 17.2 | 18.8 | 21.5 | 25.0 | 35.0 |
| Sample | Total Amounts (Concentration of Analytes ± U [μg L−1]) | ||||
|---|---|---|---|---|---|
| As | Cr | Sb | |||
| A.1 | 0.0078 ± 0.0011 | 0.0115 ± 0.0014 | 0.1857 ± 0.0059 | ||
| A.2 | 0.318 ± 0.020 | 0.0740 ± 0.0066 | 0.503 ± 0.015 | ||
| B.1 | 8.37 ± 0.52 | 0.525 ± 0.027 | 0.643 ± 0.037 | ||
| C.1 | 0.933 ± 0.014 | 0.3225 ± 0.0012 | 0.2541 ± 0.0019 | ||
| C.2 | 2.446 ± 0.096 | 0.1785 ± 0.0015 | 0.2287 ± 0.0012 | ||
| Procedure 1 (Concentration of Analytes ± U [μg L−1]) | |||||
| AsIII | AsV | SbIII | SbV | CrVI | |
| A.1 | <LOD | <LOD | <LOD | 0.201 ± 0.012 | <LOD |
| A.2 | 0.327 ± 0.031 | <LOD | <LOD | 0.524 ± 0.032 | <LOD |
| B.1 | 0.414 ± 0.039 | 3.26 ± 0.300 | <LOD | <LOD | <LOD |
| C.1 | <LOD | 0.900 ± 0.083 | <LOD | <LOD | <LOD |
| C.2 | 0.286 ± 0.027 | 1.68 ± 0.15 | <LOD | <LOD | <LOD |
| Procedure 2 (Concentration of Analytes ± U [μg L−1]) | |||||
| AsB | AsIII | DMA | MMA | AsV | |
| A.1 | <LOD | <LOD | <LOD | <LOD | <LOD |
| A.2 | <LOD | 0.317 ± 0.031 | <LOD | <LOD | <LOD |
| B.1 | 0.554 ± 0.054 | 0.432 ± 0.043 | <LOD | <LOD | 3.16 ± 0.234 |
| C.1 | <LOD | <LOD | <LOD | <LOD | 0.957 ± 0.071 |
| C.2 | 0.0541 ± 0.0053 | 0.302 ± 0.030 | <LOD | <LOD | 1.72 ± 0.13 |
| Sample | Procedure 3 | ||
|---|---|---|---|
| As | Cr | Sb | |
| B.1 | One peak: ** tR1 = 32 min | - | - |
| C.2 | Two peaks: tR1 = 32 min tR2 = 34 min | Three peaks: tR1 = 31 min tR2 = 34 min tR3 = 36 min | One peak: tR1 = 31 min |
| Procedure 4 | |||
| Ion Formula | m/zexp (m/ztheo) | ||
| AsV standard solution | * [H2AsO3]− | 140.9163 (140.9161) | |
| [AsO3]− | 122.9048 (122.9054) | ||
| [AsO2]− | 106.9109 (106.9104) | ||
| MMA standard solution | * [CH3AsO3]− | 138.9366 (138.9368) | |
| [H3AsO]− | 123.9125 (123.9129) | ||
| [CH2AsO2]− | 120.9258 (120.9260) | ||
| [AsO2]− | 106.9103 (106.9101) | ||
| DMA standard solution | * [(CH3)2AsO2]− | 136.9574 (138.9574) | |
| [CH3AsO2]− | 121.9344 (121.9338) | ||
| [AsO2]− | 106.9109 (106.9104) | ||
| Sample | Flavor | pH | Mineralization [mg L−1] | Bottle Color | Composition Stated by Manufacturer |
|---|---|---|---|---|---|
| A.1 | Unflavored | 6.52 | 1670.9 | Colorless | - |
| A.2 | Lemon | 5.91 | 1670.9 | Light Blue | Mineral water, natural lemon flavor with other natural flavors |
| B.1 | Apple | 3.42 | 775.2 | Green | Mineral water, sugar, apple juice from concentrate, grape juice from concentrate, flavor, citric acid, ascorbic acid |
| C.1 | Unflavored | 7.05 | - | Light Blue | - |
| C.2 | Strawberry | 3.47 | - | Light Blue | Mineral water, glucose-fructose syrup, sugar, citric acid, natural strawberry flavor with other natural flavors, sweeteners (acesulfame K, sucralose) |
© 2019 by the authors. Licensee MDPI, Basel, Switzerland. This article is an open access article distributed under the terms and conditions of the Creative Commons Attribution (CC BY) license (http://creativecommons.org/licenses/by/4.0/).
Share and Cite
Lorenc, W.; Markiewicz, B.; Kruszka, D.; Kachlicki, P.; Barałkiewicz, D. Study on Speciation of As, Cr, and Sb in Bottled Flavored Drinking Water Samples Using Advanced Analytical Techniques IEC/SEC-HPLC/ICP-DRC-MS and ESI-MS/MS. Molecules 2019, 24, 668. https://doi.org/10.3390/molecules24040668
Lorenc W, Markiewicz B, Kruszka D, Kachlicki P, Barałkiewicz D. Study on Speciation of As, Cr, and Sb in Bottled Flavored Drinking Water Samples Using Advanced Analytical Techniques IEC/SEC-HPLC/ICP-DRC-MS and ESI-MS/MS. Molecules. 2019; 24(4):668. https://doi.org/10.3390/molecules24040668
Chicago/Turabian StyleLorenc, Wiktor, Barbara Markiewicz, Dariusz Kruszka, Piotr Kachlicki, and Danuta Barałkiewicz. 2019. "Study on Speciation of As, Cr, and Sb in Bottled Flavored Drinking Water Samples Using Advanced Analytical Techniques IEC/SEC-HPLC/ICP-DRC-MS and ESI-MS/MS" Molecules 24, no. 4: 668. https://doi.org/10.3390/molecules24040668