Article

Photoexcitation of Ge9 Clusters in THF: New Insights into the Ultrafast Relaxation Dynamics and the Influence of the Cation

by
Nadine C. Michenfelder
1,
Christian Gienger
2,
Melina Dilanas
1,
Andreas Schnepf
2,* and
Andreas-Neil Unterreiner
1,*
1
Institut für Physikalische Chemie, Karlsruher Institut für Technologie (KIT), Kaiserstr. 12, 76131 Karlsruhe, Germany
2
Institut für Anorganische Chemie, Universität Tübingen, Auf der Morgenstelle 18, 72076 Tübingen, Germany
*
Authors to whom correspondence should be addressed.
Molecules 2020, 25(11), 2639; https://doi.org/10.3390/molecules25112639
Submission received: 16 April 2020 / Revised: 15 May 2020 / Accepted: 3 June 2020 / Published: 5 June 2020

Abstract

:
We present a comprehensive femtosecond (fs) transient absorption study of the [Ge9(Hyp)3] (Hyp = Si(SiMe3)3) cluster solvated in tetrahydrofuran (THF) with special emphasis on intra- and intermolecular charge transfer mechanisms which can be tuned by exchange of the counterion and by dimerization of the cluster. The examination of the visible and the near infrared (NIR) spectral range reveals four different processes of cluster dynamics after UV (267/258 nm) photoexcitation related to charge transfer to solvent and localized excited states in the cluster. The resulting transient absorption is mainly observed in the NIR region. In the UV-Vis range transient absorption of the (neutral) cluster core with similar dynamics can be observed. By transferring concepts of: (i) charge transfer to the solvent known from solvated Na in THF and (ii) charge transfer in bulk-like materials on metalloid cluster systems containing [Ge9(Hyp)3] moieties, we can nicely interpret the experimental findings for the different compounds. The first process occurs on a fs timescale and is attributed to localization of the excited electron in the quasi-conduction band/excited state which competes with a charge transfer to the solvent. The latter leads to an excess electron initially located in the vicinity of the parent cluster within the same solvent shell. In a second step, it can recombine with the cluster core with time constants in the picosecond (ps) timescale. Some electrons can escape the influence of the cluster leading to a solvated electron or after interaction with a cation to a contact pair both with lifetimes exceeding our experimentally accessible time window of 1 nanosecond (ns). An additional time constant on a tens of ps timescale is pronounced in the UV-Vis range which can be attributed to the recombination rate of the excited state or quasi conduction band of Ge9. In the dimer, the excess electron cannot escape the molecule due to strong trapping by the Zn cation that links the two cluster cores.

Graphical Abstract

Academic Editors: Constantina Papatriantafyllopoulou and George E. Kostakis

1. Introduction

The observation/tracking of electrons in photoexcited molecules, nanoclusters or particles is a very interesting research field in chemistry involving intra- and intermolecular electron transfer, conduction mechanisms or magnetic properties of molecules with regard to photochemical reactions and photocatalysis [1,2,3,4,5,6,7,8,9,10]. Transient absorption spectroscopy is a versatile tool to investigate photophysical and chemical mechanisms and processes, for example (bi-)radical lifetimes [11] or electron transfer [12]. Within inorganic chemistry, it was also used to understand the redox photochemistry of a molybdenum(II) cluster [13] or to find appropriate building units for photoactive metal-organic-frameworks (MOFs) [14]. Charged compounds offer good access via charge transfer transitions to their electronic structure in the excited state [15]. A charge transfer can occur intra- or intermolecularly or as a charge transfer to the solvent, when working in solution [16,17]. Most excited inorganic clusters and complexes show intramolecular charge transfer [8,12,18,19] or triplet state dynamics [20,21,22,23,24]. The metalloid cluster [Ge9(Hyp)3] (Hyp = Si(SiMe3)3) [25] (see Figure 1) with its high-yield synthesis, high stability under inert conditions and good solubility in organic solvents was used for, among others, build up reactions which give access to cluster aggregates and chain compounds with definite compositions [25,26,27,28,29,30,31,32,33]. The Ge9 entity can be linked, for example, by transition metal ions like Cu+, Ag+, Au+ [26] or Zn2+, Cd2+, Hg2+ [27] to build up a neutral dimer in the latter case. The chemical variety of this compound opens up a large playground to understand its chemical and physical properties. This cluster differs from most inorganic clusters as it can probably completely abstract an electron from the cluster core [2] which allows both intra- and intermolecular charge transfer. This approach gives access to different photo induced reactions simultaneously. To observe the processes after photoexcitation, e.g., the detachment of an electron from the cluster, fs transient absorption (TA) spectroscopy was applied. In solution, such an abstracted electron can dissolve as a so-called solvated electron [34]. In presence of a cation a contact pair with the solvated electron forms [35,36]. The well-known absorption spectra of the solvated electron (λmax = 2120 nm) [37] and the cation-electron contact pairs (e.g., [Na+,e]THF: (λmax = 890 nm) [38], [Li+,e]THFmax = 1180 nm) [39] and [K+,e]THFmax = 1125 nm) [40]) peak in the NIR spectral range. The Ge9 cluster moiety can be excited in the UV-Vis range as presented in reference [2]. With single wavelength probing in the near infrared (NIR) region, indications for excess electron formation were found whereas in the UV-Vis regime cluster dynamics were observed [2]. In another publication, we also investigated a neutral complex [Ge9(Hyp)3FeCp(CO)2] which gave new insights into ultrafast dynamics of this cluster-type [5]. Surprisingly, no long-lived excited states exceeding lifetimes of more than several hundreds of picoseconds were observed, which was attributed to the special role of cationic iron.
In this contribution, we present a comprehensive study on the [Ge9(Hyp)3] cluster dynamics after photoexcitation with special emphasis on the influence of different counter ions like K(crypt)+ (crypt = [2.2.2]cryptant) (K(crypt)Ge9) in comparison to Li+ (LiGe9) or K+ (KGe9). Complementing studies on [(Hyp)3Ge9ZnGe9(Hyp)3] [27,33] (Ge9ZnGe9) show a strong influence of dimerization on the long timescale dynamics of the cluster which is crucial for the understanding of possible relaxation pathways. This study also includes results obtained from a new experimental setup [5,41] that now allows long timescale (1 ns) broadband probe in the UV-Vis as well as in the NIR spectral range. This should allow the observation of at least a section of the high-energy tail of the solvated electron spectrum in THF, which still peaks (ca. 2100 nm) beyond our experimentally accessible range of 1400 nm. The analysis results in a concept for the charge transfer processes after photoexcitation of the metalloid [Ge9(Hyp)3] cluster and the role of counter ions and dimerization.

2. Results and Discussion

2.1. Steady State Spectroscopy in Solution

Stationary absorption spectra for K(crypt)Ge9, Ge9ZnGe9, LiGe9 and KGe9 are shown in Figure 2 and Figure S1 in the Supplementary Information (SI). For the monomers, a spectral broad absorption band in the UV spectral region was observed, which extends into the Vis regime. No absorption bands could be found in the near infrared (NIR) spectral range. The results nicely match the known spectrum of the LiGe9 cluster [2], whereby the spectrum does not significantly differ with K+ or K(crypt)+ as counterion. As known from time dependent density functional theory (TD-DFT) calculations using a grid-based projector-augmented wave code [2], the transitions in the visible region primarily originate from atomic orbital contributions of the Ge9 cluster core. For the Ge9ZnGe9 cluster, enhanced bands around 390 nm and 490 nm were observed [33]. Known from TD-DFT calculations in the gas phase, the transitions from the HOMO1 to the LUMO were found at 500 nm. Around 400 nm multiple transitions from the HOMO4, HOMO3 and HOMO5 to the LUMO+2, LUMO+3, LUMO+4 and LUMO+5 contribute to the peak [33].

2.2. Transient Absorption Spectroscopy in Solution

2.2.1. Dynamics of the Monomer

After excitation into the UV band (267 nm) of K(crypt)Ge9, where K+ is trapped by a [2.2.2]cryptand, TA spectra as shown in Figure 3 were obtained. For this compound, a spectral broad TA band extending from the visible to the NIR range was observed. In the UV region, it is superimposed by the ground state bleach (GSB), which leads to negative transient response around 400 nm. Ground state population does not recover within the experimental time window (1 ns). Comparably long-lived absorption bands dominate throughout the blue to the NIR spectral region. The transient response on a longer timescale shows a steady increase from visible to NIR, which can be interpreted as a blue tailing end of an absorption band that will be discussed below.
This can be further visualized by inspecting single transients at different wavelengths (see Figure 4). Due to different techniques, the time resolution of the UV-Vis excited experiments is considerably shorter than in the NIR region as observable by a faster rise of the corresponding transients on an ultrashort timescale. The transients for the highest wavelengths tend to be among those with highest induced absorption while showing a continuous increase in the NIR on a long timescale.
To get a closer look on the dynamics and time constants of the processes, global analysis was done with an in-house written program in the MATLAB environment. The transients were fitted (see SI Fit function) with four time constants, which were essential to reproduce the data adequately and are given in Table 1 for all compounds and the corresponding amplitudes are presented as decay associated spectra (DAS) (see Figure 5 for K(crypt)Ge9). The DAS show the absorption spectra of the excited states, which correspond to the respective time constant.
The short timescale dynamics, which are pronounced mainly in the visible part of the spectrum can be attributed to the cluster core dynamics [2]. A more detailed analysis is challenging as suitable reference systems are unknown and theoretical calculations do not provide dynamic information. On the other hand, absorption bands of long-lived species in the NIR are often triplet states or charge transfer species like solvated electrons. Triplet states in this system are unlikely to be populated as previous calculations did not show energies of triplet states that may be accessible under our experimental conditions [2]. Therefore, we concentrate on the excess charge dynamics as potential candidates. The long-lived process (A4, τ4) can be mainly observed as GSB around 400 nm and as induced absorption in the NIR spectral region. It is known from gas phase experiments that the vertical electron detachment energy is 3.37 eV [2], which somewhat lowers in solution [42,43] eventually leading to a charge transfer to solvent (CTTS). Therefore, we compared the absorption spectra of the solvated electron in THF [37] with the long-lived DAS (A4) of the Ge9-cluster (see the orange dashed curve in Figure 5). The match is within the error tolerance.
As a result of this agreement, we assume a formation of a solvated electron in THF solution that was abstracted from the excited Ge9 cluster after photoexcitation. To understand the underlying processes, we apply a mechanism which was initially proposed by Barthel et al. [16] to describe dynamics after photoexcitation of Na in THF solution. In this scenario, the excited Na* can undergo a CTTS reaction within 0.7 ps. The resulting excess electron is initially located in the vicinity of the parent Na0, leading to absorption bands of Na0 (peaking near 890 nm [16,38,44]) and the solvated electron (esolv, 2120 nm in THF solution [37]). Partially, geminate recombination is possible that results in a decay of the Na0 and the esolv bands on a timescale of 1.5 ps. The remaining excess electrons can escape the parent Na0 to survive some ns until further recombination reaction occurs.
Our system is of course much larger involving more degrees of freedom, but nevertheless there are some similarities. The following chemical equations show the adapted mechanism from Na [16] onto the Ge9 cluster:
[ G e 9 ] h ν [ G e 9 ] * [ G e 9 ] * C T T S [ G e 9 0 ] · e s o l v [ G e 9 0 ] · e s o l v r e c o m b . [ G e 9 ] [ G e 9 0 ] · e s o l v escape [ G e 9 0 ] + e s o l v
The negatively charged cluster with its relatively low electron detachment energy releases an electron after photoexcitation. Subsequently, this electron is transferred to the solvent (CTTS) which can be observed as an ultrafast decay of the excited Ge9 species with time constant τ1. In line with earlier studies on a LiGe9 cluster [2,45], vibrational relaxation probably occurs on this timescale, too. The second decay process (τ2) can be attributed to the recombination with the parent Ge90 cluster of the solvated electrons localized nearby.
The third time constant in this simple model has no relating process. We will return to this issue in the further course of the Discussion section.
Solvated electrons that escape the interaction area can survive longer than our experimental delay range (1.2 ns) [37]. For K(crypt)Ge9 the absorption spectrum after 1 ns and the decay associated absorption spectrum of τ4 matches the high energy tail of the solvated electron absorption spectrum in THF with its maximum at 2120 nm [37] (see SI Figure S2).

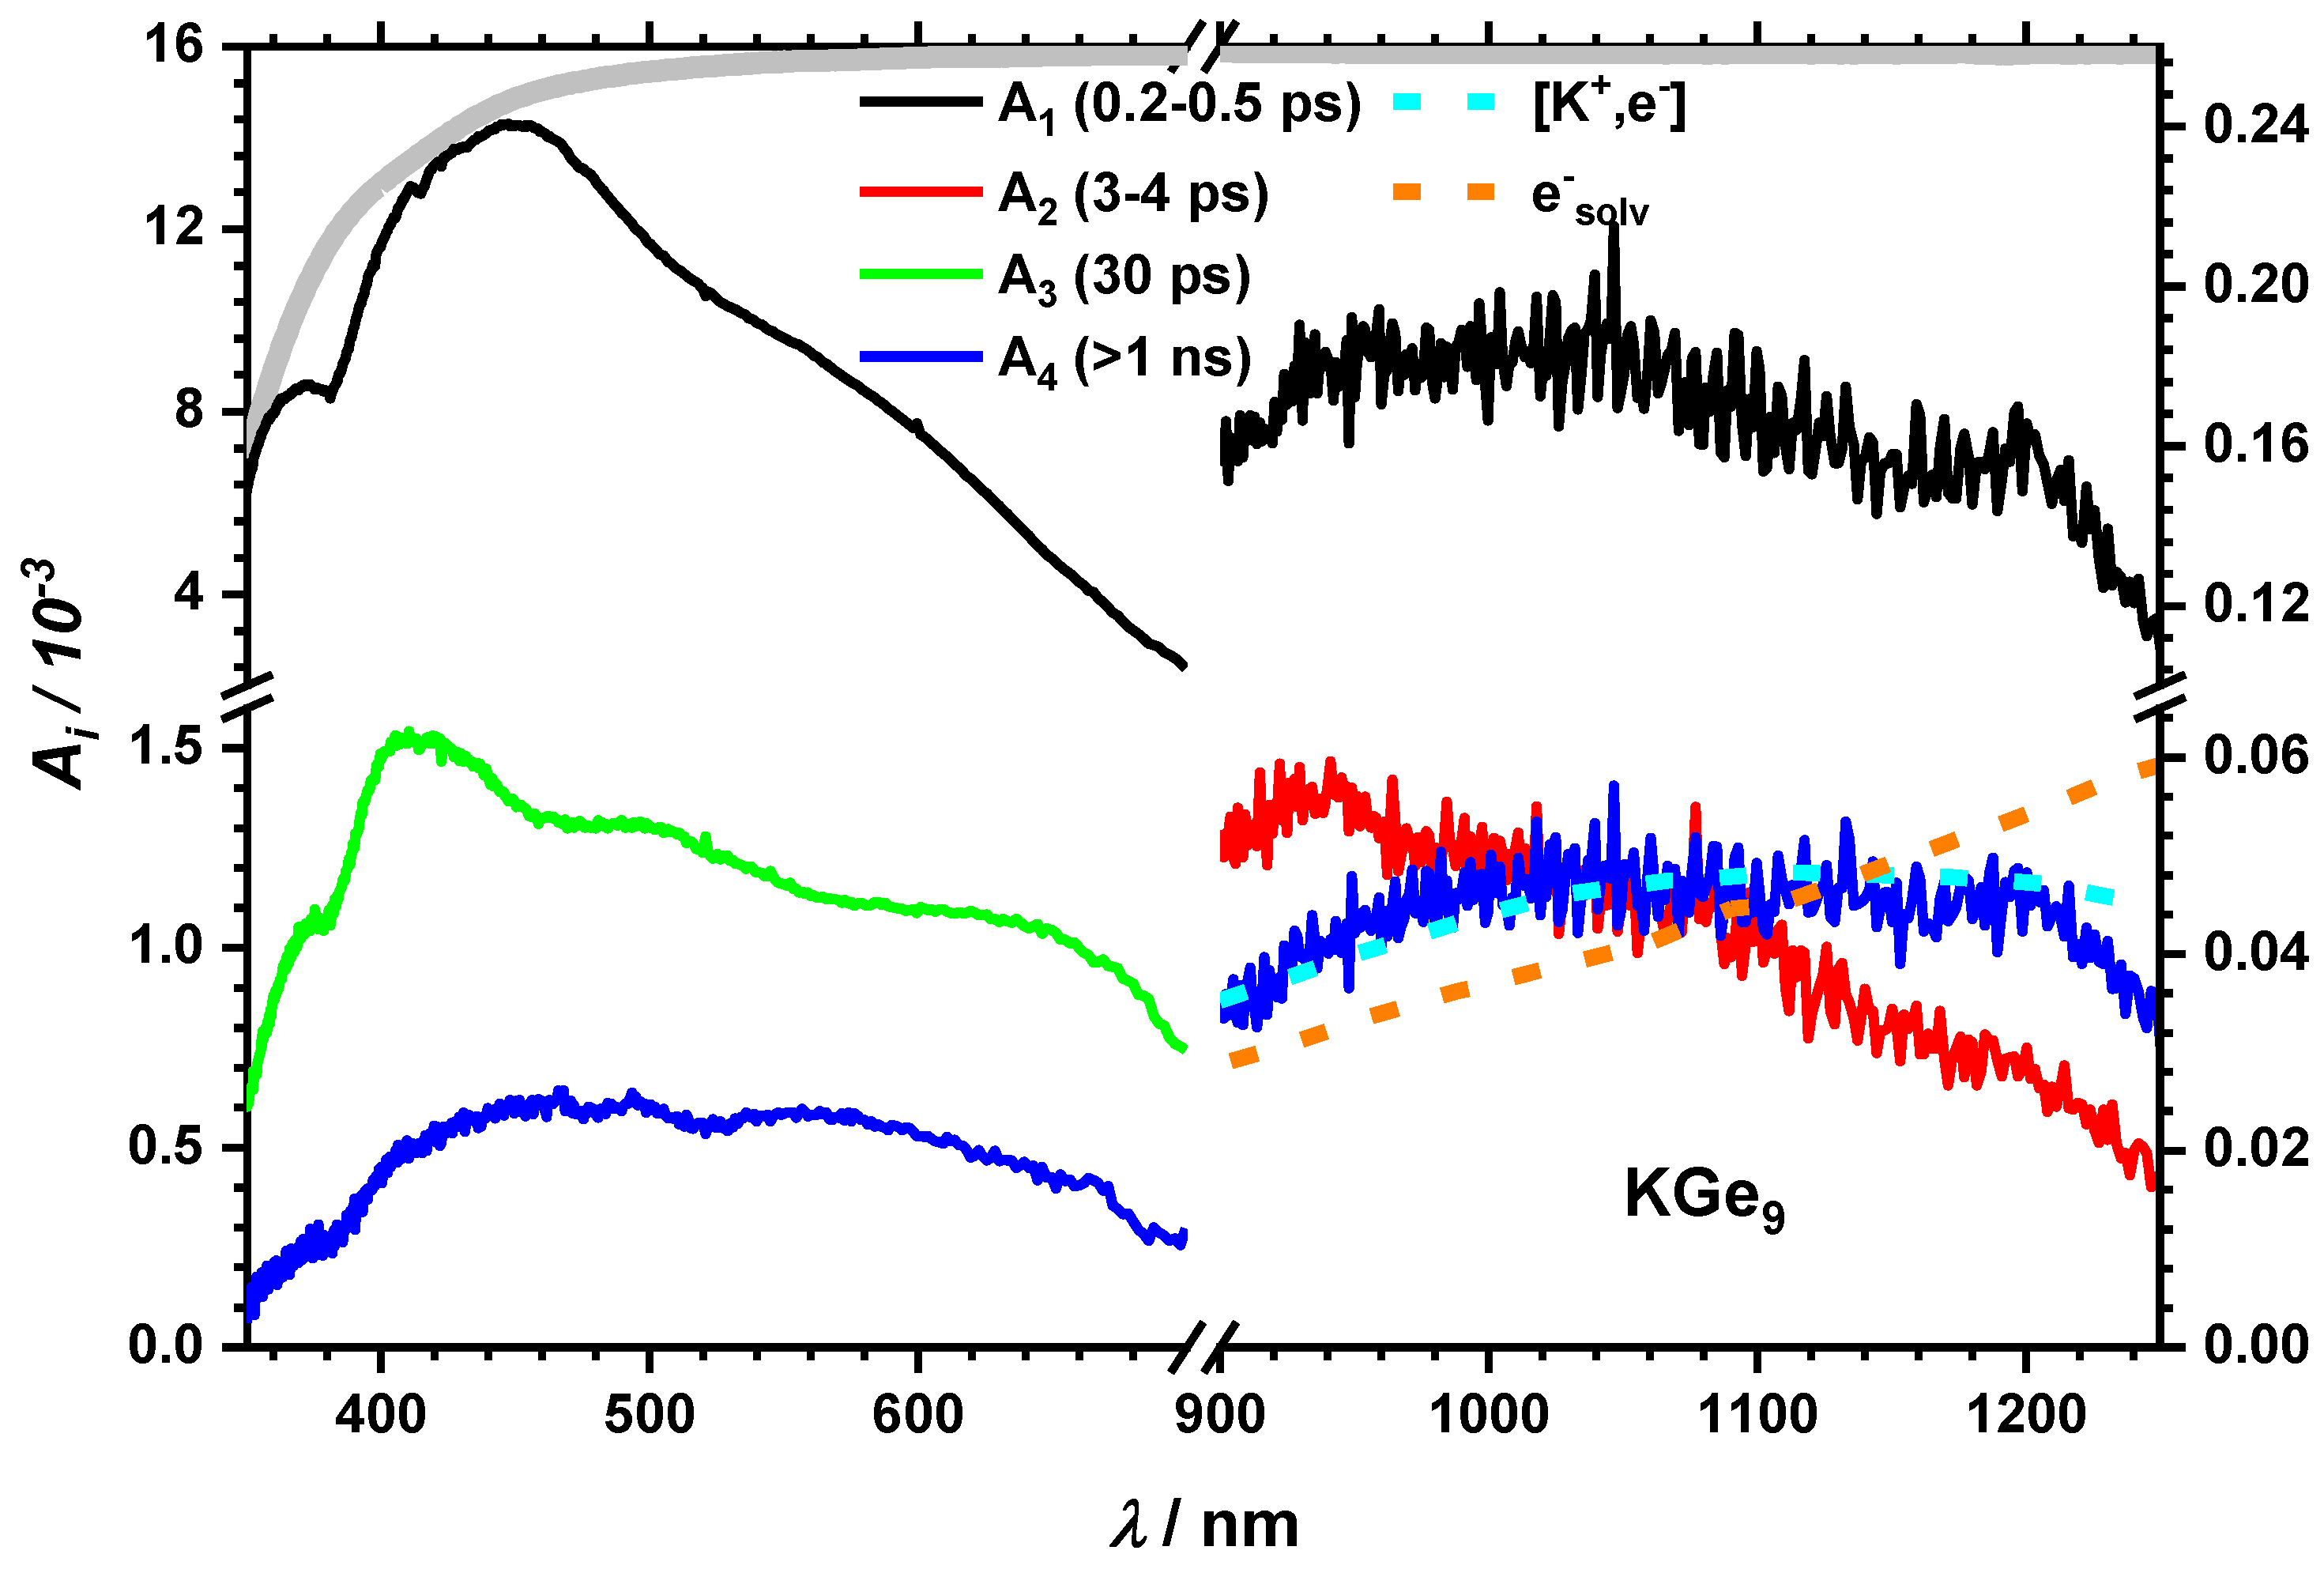
2.2.2. Impact of the Counter Ion

Next, we concentrate on the influence of different counterions. It is known, that the cation (K+) can be bound to the cluster core [46] if not trapped by crypt. Therefore, it can be assumed for KGe9 and LiGe9 that the distance between the cluster core and the cation is small enough for an interaction to take place, which is expected to influence the relaxation dynamics. At first glance, the transient spectra of KGe9 and LiGe9 (see Figure S3) are similar to the one of K(crypt)Ge9 showing a spectral broad long-lived transient absorption throughout the entire experimentally observed spectral range. A closer look, however, reveals subtle differences. For example, time constants from global fitting as described above are in the same order of magnitude except for τ3, which is much shorter for the free cation species (Table 1). In addition, the longest timescale, designated with time constant τ4, shows a somewhat different spectral signature, which does not have much similarity with the solvated electron spectrum in THF. While the UV-Vis range again shows typical spectral features assigned to cluster dynamics, there is a small, but reproducible maximum around 1050 nm in the DAS (Figure 6).
This feature nicely matches another form of charge transfer species, which can be attributed to a contact pair between an electron and K+ [40]. Again, we apply concepts from suitable reference systems. For example, it is known that I releases an electron which forms a contact pair with Na+, i.e., [Na+,e], in aqueous NaI [1]. The corresponding contact pair absorption maxima for Li+ and K+ lie at 1180 [39] and 1125 [40] nm (see also SI Figure S2).
The absorption spectrum of a contact pair of the electron with K(crypt)+ is not known but one would expect it at longer wavelengths as it should be weaker bound than the free ion contact pairs. Therefore, the spectra of the contact pairs and the solvated electron may superimpose. The formation process of the solvated electron and the cation-electron contact pair cannot be observed in our case. The cation has only weak influence on the short timescale dynamics of the cluster (τ1 and τ2), but on the third process and on the charge transfer species (τ4). The charge transfer species are a strong hint that photoexcitation of the Ge9 species leads to an electron detachment and finally to a release of this electron to the solvent, which is in line with earlier analysis by our groups [2]. In this scenario, the low intensity band around 460 nm of A4 for KGe9 is assigned to dynamics of a Ge90 species. It remains from the electron detachment process. All transient response in this spectral region can be related to cluster dynamics of Ge90 and unaltered Ge9 moieties, i.e., clusters where photodetachment did not occur.

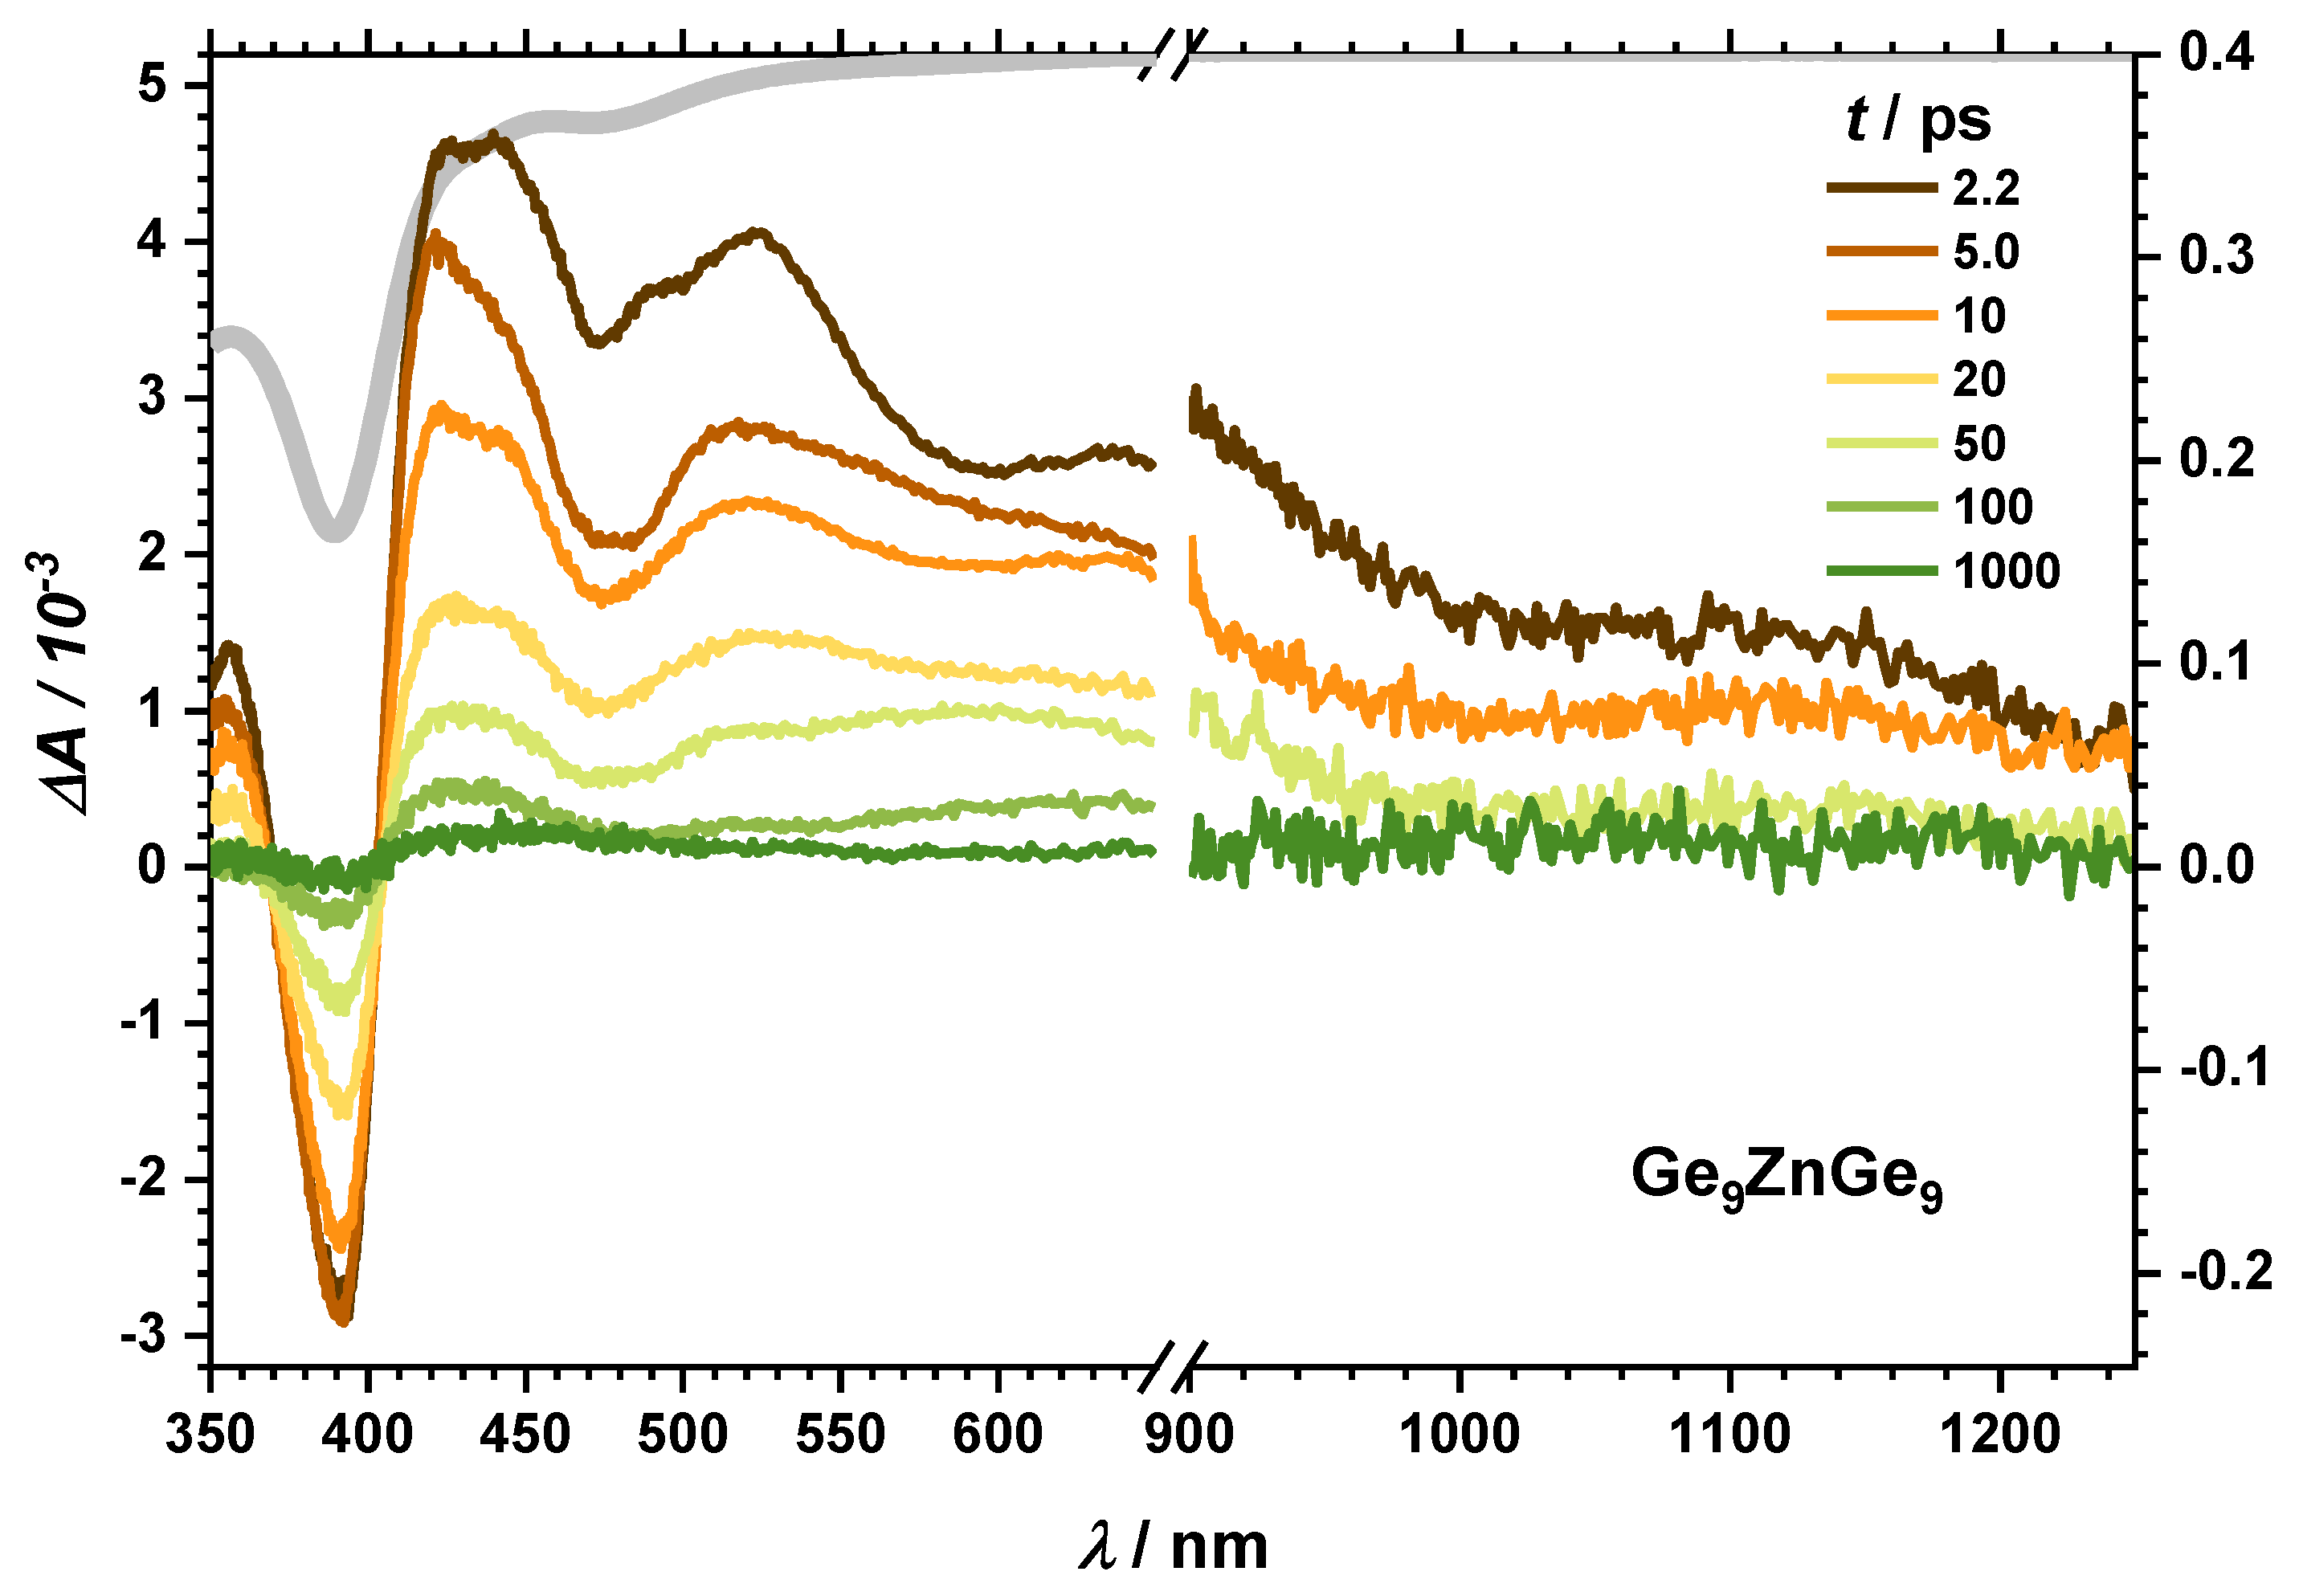
2.2.3. Dynamics of the Dimer

To further substantiate this analysis, excitation of the cluster dimers such as Ge9ZnGe9 is helpful. After excitations at 267/258 nm the transient spectra (see Figure 7) reveal some similar features as the monomer clusters and can be summarized as follows: (i) The broad TA bands from Vis to NIR are superimposed by the negative transient response of the GSB around 390 and 480 nm. (ii) Global analysis reveals four-time constants (see Table 1), which are still in the same order of magnitude as for the monomers. In contrast to the monomeric compounds, the long-lived transient response in the NIR does neither match the solvated electron spectrum in THF nor a cation/electron contact pair. Instead, the spectrum shows more similarity with the excited cluster core spectra such as there are stronger amplitudes towards the blue spectral part compared to red ones. Finally, we point out that the overall transient response almost completely recovers after our maximum delay time of 1 ns. As a result, this makes a CTTS less likely for the dimeric form.
In addition to the UV excitation, the stationary absorption spectrum of Ge9ZnGe9 allows another excitation regime at 400/388 nm (3.09/3.20 eV). This is, of course, slightly lower than the photodetachment energy known from gas phase experiments. On the other hand, it is known for water [42] and THF [43] that the ionization/photodetachment energy decreases by almost 1 eV in solution compared to the gas phase making a photodetachment feasible. Indeed, the transient spectra (Figure S3) resemble the one after UV excitation as do the first three-time constants (see Table 1). The fourth time constant, however, is significantly shorter.
So far, we attribute the short timescale processes τ1 to vibrational relaxation and CTTS and τ2 to geminate recombination processes for all compounds. For the monomer, the charge transfer leads to a solvated electron which can escape out of the interaction sphere of the parent cluster. It can combine with the counterion. Both leads to long lived TA in the NIR spectral range. For the dimer an abstraction of the electron cannot be observed. In the visible range, the transient response is attributed to the Ge9 and Ge90 species.
Finally, we address the interpretation of the third time constant τ3. The monomer with K(crypt)+ has a τ3 of 120 to 140 ps, whereas it decreases to 40 and 30 ps for the cations Li+ and K+, respectively. Indeed, the shortest value can be found for the K+ cation and for the cluster dimer (30 ps). An influence of the dimerization on the third time constant is not present. This differs from the fourth process which is shorter for lower excitation energy and is directly linked to the charge transfer and therefore to the electron detachment process. In addition, the transient spectra of the dimer suggest that this process is independent of the excitation wavelength. One can conclude that the state, which we describe with τ3, is not involved into the charge transfer process. Nevertheless, the cation, especially the trapped cation, interacts with the process we are looking for by e.g. electron withdrawing effects. In all investigated compounds, the DAS (A3) are similar to the spectra, which can be attributed to the cluster in its excited state with or without the detached electron. To explain these experimental findings, we take into account another concept known for charge transfer processes after photoexcitation, which was applied to explain excited state dynamics of [Ge9(Hyp)3FeCp(CO)2] [5]. In this case, no solvated electron or long-lived states occur, but a trap state exists with a lifetime of ~150 ps that can be attributed to a charge transfer state. This is possible for Ge9ZnGe9 but is unlikely for the monomers as their counterion is not directly linked to the cluster and the contact pair bands are pronounced in the NIR spectral range. In bulk materials like α-Fe2O3 nanoparticles, thin films, colloidal solutions [47,48,49], or Fe10Ln10 clusters [8], photoexcitation into the quasi-conduction band leads to a charge transfer from oxygen to iron [17]. Three-time constants can be found on a sub ps, ps, and tens of ps timescale that are attributed to vibrational relaxation and trapping, geminate recombination, and relaxation from trap states, respectively. By analogy, on the timescale of the CTTS (τ1) a concurrent process is therefore the localization around the cluster core in a low excited state or lower edge of a quasi-conduction band. τ3 can be attributed to the relaxation from the quasi conduction band or the excited state. Therefore, the influence of the cation on τ3 is related to the change of the potential energy surface of the excited state due to interaction with the electrostatic field of the cation. In Figure 8 an overview on the possible processes after photoexcitation is given.
This concept is also helpful for the understanding of the long time-scale dynamics of the cluster dimer. For 400 nm excitation τ4 amounts to only 400 ps and is significantly shorter than after 267 nm excitation. Interestingly, the DAS for this time constant are quite similar. The ground state completely recovers within the experimental time window of 1.2 ns (after 400 nm excitation). The long-lived transient absorption in the NIR does not match the solvated electron absorption spectrum, neither after UV nor after 400 nm excitation. As the cation is part of the metalloid cluster entity, a contact pair spectrum is, as expected, not observable. Therefore, no evidence for a release of the electron into the solvent can be found. It is still possible that because of a very low concentration, a small amount of solvated electrons may not be observable, but the complete recovery of the ground state bleach does not promote any species left after 1 ns. Consulting the concept from bulk-like materials and results from [Ge9(Hyp)3FeCp(CO)2] [5], a trap state resulting from a charge transfer between the cluster core and the Zn cation like in the monomer complex [Ge9(Hyp)3FeCp(CO)2] [5], may serve as an explanation why the electron cannot completely be released from the cluster. Indeed, its lifetime depends on excitation wavelength, i.e., on the excess energy deposited in the excited state. As we are not aware of systematic energy-depending studies on such systems, the wavelength dependent lifetimes are still reminiscent to studies of excess electrons in THF [43] or liquid ammonia [7,50] whereby excess energy in the excited state determines survival probability.

3. Materials and Methods

3.1. Sample Preparation

All reactions were carried out under a nitrogen atmosphere using standard Schlenk techniques or under argon atmosphere in a glove box. Toluene, hexane, and THF were dried with sodium, acetonitrile was dried with phosphorus(V)oxide, and pentane was dried with calcium hydride and all were distilled prior to use.

3.1.1. K4Ge9

K (1.54 g, 39.39 mmol) and Ge (5.0 g, 68.84 mmol) were heated in an evacuated quartz glass vial to 650 °C with a ramp of 100 °C per hour and then held at 650 °C for 72 h. After cooling down to room temperature the vial was opened in a glove box and K4Ge9 was obtained as a grey solid and characterized via X-Ray powder diffraction on a Stadi-P (STOE, Darmstadt, Germany) powder diffractometer using germanium monochromated Cu-Kα1 radiation (λ = 154.06 pm and a Mythen 1K detector (see Figure S6)).

3.1.2. KGe9Hyp3

K4Ge9 (3.0 g, 3.07 mmol) was suspended in 150 ml of THF. ClSi[Si(CH3)3]3 (3.0 mL, 2.56 g, 9.056 mmol) was heated to 60 °C to melt and then added quickly via syringe to the suspension. The mixture is stirred at ambient temperature for three days and after that the solvent is removed in vacuo. The residue is washed twice with 100 mL of pentane and then extracted with THF. After removal of the solvent the product is obtained as an orange solid with a yield of 38%. KGe9Hyp3 was used NMR pure or crystallized from toluene at −30 °C in the shape of orange needles. 1H-NMR (C6D6, 300 MHz): δ 0.52 (s, 81H, SiMe3), 13C-NMR (C6D6, 62.9 MHz): δ 3.04 (SiMe3), 29Si-NMR (C6D6, 49.7 MHz, inept-nd): δ −8.48 (decet, Si(SiMe3)3, 2J Si-H = 6.5 Hz), −105.59 (s, Si(SiMe3)3).

3.1.3. K(crypt-2,2,2)Ge9Hyp3

KGe9Hyp3 (500 mg, 0.35 mmol) was dissolved in acetonitrile and layered with hexane. [2,2,2]-cryptand was dissolved in hexane and added to the hexane layer. Orange crystals formed at room temperature at the interface. 1H-NMR (thf-d8, 300 MHz): δ 0.52 (s, 81H, SiMe3), 13C-NMR (thf-d6, 62.9 MHz): δ 3.04 (SiMe3), 29Si-NMR (thf-d8, 49.7 MHz, inept-nd): δ −8.48 (decet, Si(SiMe3)3, 2J Si-H = 6.5 Hz), −105.59 (s, Si(SiMe3)3).

3.1.4. LiGe9Hyp3

KGe9Hyp3 (1.00 g, 0.7 mmol) and LiBr (61 mg, 0.7 mmol) were dissolved in THF at room temperature and stirred overnight. After removing the solvent in vacuo the product was washed with pentane and then extracted with THF. It was obtained in the form of red crystals at −30 °C with 95% yield. 1H-NMR (thf-d8, 300 MHz): δ 0.24 (s, 81H, SiMe3), 13C-NMR (thf-d8, 62.9 MHz): δ 3.19 (SiMe3), 29Si-NMR (thf-d8, 49.7 MHz, inept-nd): δ −9.85 pm (decet, Si(SiMe3)3, 2J Si-H = 6.6 Hz), −105.59 ppm (s, Si(SiMe3)3), 7Li-NMR (thf-d8, 116.64 MHz): δ 0.39 (s, Li).

3.1.5. ZnGe18Hyp6

ZnCl2 (13 mg, 95 µmol) and KGe9Hyp3 (256 mg, 178 µmol) were separately dissolved in THF and cooled to -78 °C. While stirring the ZnCl2 solution was added dropwise to the KGe9Hyp3 solution and afterwards the reaction solution was slowly warmed to room temperature overnight. The solvent was then removed in vacuo and the product extracted with pentane. ZnGe18Hyp6 crystallizes in the form of dark red needles at −30 °C with 80% yield. 1H-NMR (C6D6, 300 MHz): δ 0.54 (s, 162H, SiMe3), 13C-NMR (C6D6, 62.9 MHz): δ 3.25 (SiMe3), 29Si-NMR (C6D6, 49.7 MHz, inept-nd): δ −9.59 (decet, Si(SiMe3)3, 2J Si-H = 6.6 Hz), −105.30 (s, Si(SiMe3)3).
Under exclusion of oxygen and water THF (abs.) was added as solvent for stationary and transient absorption measurements. Measurements were done in cuvettes optimized for the use under inert conditions.

3.2. Steady-State Spectroscopy in Solution

Absorption spectra were obtained with an UV/Vis/NIR spectrometer Cary 500 (Varian, Palo Alto, CA, USA) in THF as solvent in a wavelength range between 200 and 2000 nm. Spectra were measured at room temperature in cuvettes made of fused silica (Hellma, Nürnberg, Germany) with 1 mm optical path length. Concentrations are about 1 mmol/L.

3.3. Transient Absorption Spectroscopy in Solution

To obtain time resolved spectra in the UV-Vis wavelength regime, an experimental setup described elsewhere [41] was used. Briefly, one small part (2–3 µJ) of the 800 nm (Astrella (Coherent, Santa Clara, CA, USA), 7 mJ, 35 fs, repetition rate 1 kHz) laser output was focused into a movable 2 mm CaF2 crystal (nortus optronic GmbH, Wörth am Rhein, Germany) to generate a white-light continuum between 350 and 720 nm. After passing the sample, the white-light is refracted by a fused silica prism and recorded by a CCD Camera (Series 2000, Si Photodetector, Entwicklungsbüro Stresing, Berlin, Germany). Pump wavelengths at 400 and 267 nm were generated by second harmonic generation and sum frequency mixing of the 800 and 400 nm pulses in BBO crystals, respectively. The spot size in the sample was about 200 μm, which was more than twice the white-light spot size. Excitation energies were for all wavelengths 400 nJ per pulse. Delay of the pump pulse was managed by a computer-controlled translation stage (maximum delay ~1.2 ns, Thorlabs, Newton, NJ, USA), whereby every second pulse was blocked with an optical chopper (Thorlabs), resulting in spectra with and without excitation. Differentiation results in ΔA spectra with a time resolution better than 100 fs. Data were collected with an in-house written Labview program.
For recording TA spectra in the NIR spectral range, as described in an earlier publication [5], a CPA 2210 (Clark-MXR, Dexter, MI, USA, 775 nm, repetition rate 1 kHz, 1.3 mJ, 150 fs) was used. One part of the 775 nm beam propagated through a computer-controlled translation stage (maximum delay range 1.4 ns, Physical Instruments PI, Karlsruhe, Germany) and was used to generate an NIR white-light continuum between 900 and 1600 nm in a YAG crystal (nortus Optronic GmbH). The intensity of the refracted pulse (SF10 prism) was collected with a CCD Camera (Series 2000, InGaAs Photodetector, Entwicklungsbüro Stresing). Data were processed by the same program like in the other system adapted to the needs for NIR detection. Pump pulses were generated by second (388 nm) and third (258 nm) harmonic generation of the fundamental laser wavelength. Excitation energies were in the range of 1 μJ per pulse and spot sizes in the sample around 500 μm which, again, corresponded roughly two times the white-light spot size. Longer pulse duration of the fundamental and group velocity mismatch between UV/Vis pump pulses and NIR white-light detection resulted in a time resolution of roughly 200 fs obtained by data analysis.

4. Conclusions

We investigated the relaxation channels after photoexcitation of the [Ge9(Hyp)3] clusters with different cations (K+, Li+ and K(crypt)+) and as dimer (bound through Zn2+) with fs pump probe broadband absorption spectroscopy in THF solution. In analogy to the charge transfer of bulk-like materials and charge transfer to solvent processes in Na, we identified four different processes: Within 0.5 ps after photoexcitation with a 267 nm laser pulse an electron transfer to the solvent takes place, whereas localization in the quasi conduction band and vibrational relaxation occur on a similar timescale. The geminate recombination between the excess electron and the parent cluster occurs within about 2 ps. On a tens of ps timescale one can observe the relaxation from the quasi conduction band. Some excess electrons can escape the cluster influence, leading to solvated electrons and contact pairs with the cations that show characteristic spectra in the NIR with lifetimes longer one ns. For the dimer, the excess electron cannot escape the trapping field of the Zn atom. This leads to a charge transfer state, which decays on a shorter timescale depending on the excitation wavelength. Hence, the dimer shows a normal relaxation pathway for an inorganic cluster in opposition to the monomer, which can completely release an electron into the solvent, which can act as reducing agent. In future work, the influence of different bound cations in form of dimers like Ge9ZnGe9 or complexes like [Ge9(Hyp)3FeCp(CO)2] and on the other hand of different sizes of substituents of the cluster seem to be promising targets for investigations.

Supplementary Materials

The following are available online, Figures S1–S2: Absorption spectra, Figures S3–S4: Transient absorption spectra and decays, Figure S5: Decay associated spectra, Figure S 6: PXRD Pattern.

Author Contributions

Data curation, N.C.M., C.G. and M.D.; Formal analysis, N.C.M. and M.D.; Project administration, A.S. and A.-N.U.; Supervision, A.S. and A.-N.U.; Writing—original draft, N.C.M. and C.G.; Writing—review & editing, A.S. and A.-N.U. All authors have read and agreed to the published version of the manuscript.

Funding

This research was funded by Deutsche Forschungsgemeinschaft, projects UN108/6-1 and SCHN738/9-1.

Acknowledgments

The authors acknowledge financial support by Karlsruhe Institute of Technology (KIT), the University of Tübingen and the Deutsche Forschungsgemeinschaft (DFG). The authors would also like to thank the reviewers for their helpful comments.

Conflicts of Interest

The authors declare no conflict of interest.

References

  1. Bragg, A.E.; Schwartz, B.J. Ultrafast Charge-Transfer-to-Solvent Dynamics of Iodide in Tetrahydrofuran. 2. Photoinduced Electron Transfer to Counterions in Solution. J. Phys. Chem. A 2008, 112, 3530–3543. [Google Scholar] [CrossRef] [PubMed] [Green Version]
  2. Klinger, M.; Schenk, C.; Henke, F.; Clayborne, A.; Schnepf, A.; Unterreiner, A.N. UV photoexcitation of a dissolved metalloid Ge9 cluster compound and its extensive ultrafast response. Chem. Commun. 2015, 51, 12278–12281. [Google Scholar] [CrossRef] [PubMed]
  3. Dotti, N.; Heintze, E.; Slota, M.; Hübner, R.; Wang, F.; Nuss, J.; Dressel, M.; Bogani, L. Conduction mechanism of nitronyl-nitroxide molecular magnetic compounds. Phys. Rev. B 2016, 93, 165201. [Google Scholar] [CrossRef]
  4. Chen, R.; Hong, Z.-F.; Zhao, Y.-R.; Zheng, H.; Li, G.-J.; Zhang, Q.-C.; Kong, X.-J.; Long, L.-S.; Zheng, L.-S. Ligand-Dependent Luminescence Properties of Lanthanide–Titanium Oxo Clusters. Inorg. Chem. 2019, 58, 15008–15012. [Google Scholar] [CrossRef] [PubMed]
  5. Michenfelder, N.C.; Gienger, C.; Schnepf, A.; Unterreiner, A.-N. The influence of the FeCp(CO)2+ moiety on the dynamics of the metalloid [Ge9(Si(SiMe3)3)3] cluster in thf: Synthesis and characterization by time-resolved absorption spectroscopy. Dalton Trans. 2019, 48, 15577–15582. [Google Scholar] [CrossRef] [Green Version]
  6. Liedy, F.; Eng, J.; McNab, R.; Inglis, R.; Penfold, T.J.; Brechin, E.K.; Johansson, J.O. Vibrational coherences in manganese single-molecule magnets after ultrafast photoexcitation. Nat. Chem. 2020, 12, 452–458. [Google Scholar] [CrossRef]
  7. Vogler, T.; Vöhringer, P. Probing the band gap of liquid ammonia with femtosecond multiphoton ionization spectroscopy. Phys. Chem. Chem. Phys. 2018, 20, 25657–25665. [Google Scholar] [CrossRef]
  8. Baniodeh, A.; Liang, Y.; Anson, C.E.; Magnani, N.; Powell, A.K.; Unterreiner, A.-N.; Seyfferle, S.; Slota, M.; Dressel, M.; Bogani, L.; et al. Unraveling the Influence of Lanthanide Ions on Intra- and Inter-Molecular Electronic Processes in Fe10Ln10 Nano-Toruses. Adv. Funct. Mater. 2014, 24, 6280–6290. [Google Scholar] [CrossRef]
  9. Tungulin, D.; Leier, J.; Carter, A.B.; Powell, A.K.; Albuquerque, R.Q.; Unterreiner, A.N.; Bizzarri, C. Chasing BODIPY: Enhancement of Luminescence in Homoleptic Bis(dipyrrinato) ZnII Complexes Utilizing Symmetric and Unsymmetrical Dipyrrins. Chem. Eur. J. 2019, 25, 3816–3827. [Google Scholar] [CrossRef]
  10. Kloepfer, J.A.; Vilchiz, V.H.; Lenchenkov, V.A.; Bradforth, S.E. Femtosecond dynamics of photodetachment of the iodide anion in solution: Resonant excitation into the charge-transfer-to-solvent state. Chem. Phys. Lett. 1998, 298, 120–128. [Google Scholar] [CrossRef]
  11. Bakker, M.J.; Hartl, F.; Stufkens, D.J.; Jina, O.S.; Sun, X.Z.; George, M.W. Alkene-Stabilized Biradical and Zwitterionic Photoproducts of the Clusters [Os3(CO)10(α-diimine)]:  A Time-Resolved Transient Absorption and Infrared Study. Organometallics 2000, 19, 4310–4319. [Google Scholar] [CrossRef]
  12. Kahnt, A.; Heiniger, L.-P.; Liu, S.-X.; Tu, X.; Zheng, Z.; Hauser, A.; Decurtins, S.; Guldi, D.M. An Electrochemical and Photophysical Study of a Covalently Linked Inorganic–Organic Dyad. ChemPhysChem 2010, 11, 651–658. [Google Scholar] [CrossRef]
  13. Maverick, A.W.; Gray, H.B. Luminescence and redox photochemistry of the molybdenum(II) cluster Mo6Cl142. J. Am. Chem. Soc. 1981, 103, 1298–1300. [Google Scholar] [CrossRef]
  14. Yuan, S.; Qin, J.-S.; Xu, H.-Q.; Su, J.; Rossi, D.; Chen, Y.; Zhang, L.; Lollar, C.; Wang, Q.; Jiang, H.-L.; et al. [Ti8Zr2O12(COO)16] Cluster: An Ideal Inorganic Building Unit for Photoactive Metal–Organic Frameworks. ACS Cent. Sci. 2018, 4, 105–111. [Google Scholar] [CrossRef] [PubMed] [Green Version]
  15. Michenfelder, N.C.; Ernst, H.A.; Schweigert, C.; Olzmann, M.; Unterreiner, A.N. Ultrafast stimulated emission of nitrophenolates in organic and aqueous solutions. Phys. Chem. Chem. Phys. 2018, 20, 10713–10720. [Google Scholar] [CrossRef]
  16. Barthel, E.R.; Martini, I.B.; Schwartz, B.J. Direct observation of charge-transfer-to-solvent (CTTS) reactions: Ultrafast dynamics of the photoexcited alkali metal anion sodide (Na). J. Chem. Phys. 2000, 112, 9433–9444. [Google Scholar] [CrossRef] [Green Version]
  17. Fan, H.M.; You, G.J.; Li, Y.; Zheng, Z.; Tan, H.R.; Shen, Z.X.; Tang, S.H.; Feng, Y.P. Shape-Controlled Synthesis of Single-Crystalline Fe2O3 Hollow Nanocrystals and Their Tunable Optical Properties. J. Phys. Chem. C 2009, 113, 9928–9935. [Google Scholar] [CrossRef]
  18. Yam, V.W.-W.; Lo, K.K.-W.; Wang, C.-R.; Cheung, K.-K. Synthesis, Photophysics, and Transient Absorption Spectroscopic Studies of Luminescent Copper(I) Chalcogenide Complexes. Crystal Structure of [Cu4(μ-dtpm)4(μ4-S)](PF6)2 {dtpm = Bis[bis(4-methylphenyl)phosphino]methane}. J. Phys. Chem. A 1997, 101, 4666–4672. [Google Scholar] [CrossRef]
  19. Zhou, M.; Long, S.; Wan, X.; Li, Y.; Niu, Y.; Guo, Q.; Wang, Q.-M.; Xia, A. Ultrafast relaxation dynamics of phosphine-protected, rod-shaped Au20 clusters: Interplay between solvation and surface trapping. Phys. Chem. Chem. Phys. 2014, 16, 18288–18293. [Google Scholar] [CrossRef]
  20. Rothfuss, H.; Knöfel, N.D.; Tzvetkova, P.; Michenfelder, N.C.; Baraban, S.; Unterreiner, A.-N.; Roesky, P.W.; Barner-Kowollik, C. Phenanthroline—A Versatile Ligand for Advanced Functional Polymeric Materials. Chem. Eur. J. 2018, 24, 17475–17486. [Google Scholar] [CrossRef]
  21. Ruan, L.; Gao, X.; Zhao, J.; Xu, C.; Liang, D. Preparation and characteristics of Eu(DBM)3phen: Synthesis, single-crystal structure and spectroscopic analysis. J. Mol. Struct. 2017, 1149, 265–272. [Google Scholar] [CrossRef]
  22. Yuetao, Y.; Qingde, S.; Guiwen, Z. Photoacoustic spectroscopy study on lanthanide ternary complexes with dibenzoylmethide and phenanthroline. Spectrochim. Acta A 1999, 55, 1527–1533. [Google Scholar] [CrossRef]
  23. Thielemann, D.T.; Klinger, M.; Wolf, T.J.A.; Lan, Y.; Wernsdorfer, W.; Busse, M.; Roesky, P.W.; Unterreiner, A.-N.; Powell, A.K.; Junk, P.C.; et al. Novel Lanthanide-Based Polymeric Chains and Corresponding Ultrafast Dynamics in Solution. Inorg. Chem. 2011, 50, 11990–12000. [Google Scholar] [CrossRef] [PubMed]
  24. Cannizzo, A.; Blanco-Rodríguez, A.M.; El Nahhas, A.; Šebera, J.; Záliš, S.; Vlček, A.; Chergui, M. Femtosecond Fluorescence and Intersystem Crossing in Rhenium(I) Carbonyl−Bipyridine Complexes. J. Am. Chem. Soc. 2008, 130, 8967–8974. [Google Scholar] [CrossRef]
  25. Schnepf, A. [Ge9{Si(SiMe3)3}3]: Ein löslicher polyedrischer Ge9-Cluster, stabilisiert durch nur drei Silylliganden. Angew. Chem. 2003, 115, 2728–2729. [Google Scholar] [CrossRef]
  26. Schenk, C.; Henke, F.; Santiso-Quiñones, G.; Krossing, I.; Schnepf, A. [Si(SiMe3)3]6Ge18M (M = Cu, Ag, Au): Metalloid cluster compounds as unusual building blocks for a supramolecular chemistry. Dalton Trans. 2008, 4436–4441. [Google Scholar] [CrossRef]
  27. Henke, F.; Schenk, C.; Schnepf, A. [Si(SiMe3)3]6Ge18M (M = Zn, Cd, Hg): Neutral metalloid cluster compounds of germanium as highly soluble building blocks for supramolecular chemistry. Dalton Trans. 2009, 9141–9145. [Google Scholar] [CrossRef]
  28. Li, F.; Sevov, S.C. Rational Synthesis of [Ge9{Si(SiMe3)3}3] from Its Parent Zintl Ion Ge94−. Inorg. Chem. 2012, 51, 2706–2708. [Google Scholar] [CrossRef]
  29. Kysliak, O.; Schnepf, A. Metalloid Germanium Clusters as Starting Point for New Chemistry. In Reference Module in Chemistry, Molecular Sciences and Chemical Engineering; Elsevier: Amsterdam, The Netherlands, 2017. [Google Scholar]
  30. Schenk, C.; Schnepf, A. [AuGe18{Si(SiMe3)3}6]: A Soluble Au–Ge Cluster on the Way to a Molecular Cable? Angew. Chem. Int. Ed. 2007, 46, 5314–5316. [Google Scholar] [CrossRef]
  31. Geitner, F.S.; Fässler, T.F. Introducing Tetrel Zintl Ions to N-Heterocyclic Carbenes – Synthesis of Coinage Metal NHC Complexes of [Ge9{Si(SiMe3)3}3]. Eur. J. Inorg. Chem. 2016, 2016, 2688–2691. [Google Scholar] [CrossRef]
  32. Geitner, F.S.; Giebel, M.A.; Pöthig, A.; Fässler, T.F. N-Heterocyclic Carbene Coinage Metal Complexes of the Germanium-Rich Metalloid Clusters [Ge9R3] and [Ge9RI2]2− with R = Si(iPr)3 and RI = Si(TMS)3. Molecules 2017, 22, 1204. [Google Scholar] [CrossRef] [PubMed] [Green Version]
  33. Kysliak, O.; Nguyen, D.D.; Clayborne, A.Z.; Schnepf, A. [PtZn2Ge18(Hyp)8] (Hyp = Si(SiMe3)3): A Neutral Polynuclear Chain Compound with Ge9(Hyp)3 Units. Inorg. Chem. 2018, 57, 12603–12609. [Google Scholar] [CrossRef]
  34. Dorfman, L.M.; Jou, F.Y.; Wageman, R. Solvent Dependence of Optical Absorption Spectrum of Solvated Electron. Berich. Bunsen. Phys. Chem. 1971, 75, 681–685. [Google Scholar] [CrossRef]
  35. Giling, L.J.; Kloosterboer, J.G.; Rettschnick, R.P.H.; van Voorst, J.D.W. Flash photolysis of negative aromatic ions in liquid solutions. Chem. Phys. Lett. 1971, 8, 457–461. [Google Scholar] [CrossRef]
  36. Kloosterboer, J.G.; Giling, L.J.; Rettschnick, R.P.H.; van Voorst, J.D.W. Flash photolysis of solutions of sodium in ethers. Chem. Phys. Lett. 1971, 8, 462–466. [Google Scholar] [CrossRef]
  37. Jou, F.Y.; Dorfman, L.M. Pulse radiolysis studies. XXI. Optical absorption spectrum of the solvated electron in ethers and in binary solutions of these ethers. J. Chem. Phys. 1973, 58, 4715–4723. [Google Scholar] [CrossRef]
  38. Bockrath, B.; Dorfman, L.M. Pulse radiolysis studies. XXII. Spectrum and kinetics of the sodium cation-electron pair in tetrahydrofuran solutions. J. Phys. Chem. 1973, 77, 1002–1006. [Google Scholar] [CrossRef]
  39. Bockrath, B.; Dorfman, L.M. Ionic Aggregation of Solvated Electron with Lithium Cation in Tetrahydrofuran Solution. J. Phys. Chem. 1975, 79, 1509–1512. [Google Scholar] [CrossRef] [Green Version]
  40. Salmon, G.A.; Seddon, W.A.; Fletcher, J.W. Pulse Radiolytic Formation of Solvated Electrons, Ion–pairs, and Alkali Metal Anions in Tetrahydrofuran. Can. J. Chem. 1974, 52, 3259–3268. [Google Scholar] [CrossRef]
  41. Schweigert, C.; Babii, O.; Afonin, S.; Schober, T.; Leier, J.; Michenfelder, N.C.; Komarov, I.V.; Ulrich, A.S.; Unterreiner, A.N. Real-Time Observation of Diarylethene-Based Photoswitches in a Cyclic Peptide Environment. ChemPhotoChem 2019, 3, 403–410. [Google Scholar] [CrossRef]
  42. Stähler, J.; Deinert, J.-C.; Wegkamp, D.; Hagen, S.; Wolf, M. Real-Time Measurement of the Vertical Binding Energy during the Birth of a Solvated Electron. J. Am. Chem. Soc. 2015, 137, 3520–3524. [Google Scholar] [CrossRef] [PubMed]
  43. Martini, I.B.; Barthel, E.R.; Schwartz, B.J. Mechanisms of the ultrafast production and recombination of solvated electrons in weakly polar fluids: Comparison of multiphoton ionization and detachment via the charge-transfer-to-solvent transition of Na in THF. J. Chem. Phys. 2000, 113, 11245–11257. [Google Scholar] [CrossRef] [Green Version]
  44. Piotrowiak, P.; Miller, J.R. Spectra of the solvated electron in the presence of sodium cation in tetrahydrofuran and in its.alpha.,.alpha.’-methylated derivatives. J. Am. Chem Soc. 1991, 113, 5086–5087. [Google Scholar] [CrossRef]
  45. Andre Clayborne, P.; Hakkinen, H. The electronic structure of Ge9[Si(SiMe3)3]3: A superantiatom complex. Phys. Chem Chem Phys. 2012, 14, 9311–9316. [Google Scholar] [CrossRef]
  46. Kysliak, O.; Schnepf, A. {Ge9[Si(SiMe3)3]2}2−: A starting point for mixed substituted metalloid germanium clusters. Dalton Trans. 2016, 45, 2404–2408. [Google Scholar] [CrossRef]
  47. Kiwi, J.; Denisov, N.; Gak, Y.; Ovanesyan, N.; Buffat, P.A.; Suvorova, E.; Gostev, F.; Titov, A.; Sarkisov, O.; Albers, P.; et al. Catalytic Fe3+ clusters and complexes in Nafion active in photo-Fenton processes. High-resolution electron microscopy and femtosecond studies. Langmuir 2002, 18, 9054–9066. [Google Scholar] [CrossRef]
  48. Baskoutas, S.; Terzis, A.F. Size-dependent band gap of colloidal quantum dots. J. Appl. Phys. 2006, 99, 013708. [Google Scholar] [CrossRef]
  49. Joly, A.G.; Williams, J.R.; Chambers, S.A.; Xiong, G.; Hess, W.P.; Laman, D.M. Carrier dynamics in α-Fe2O3 (0001) thin films and single crystals probed by femtosecond transient absorption and reflectivity. J. Appl. Phys. 2006, 99, 053521. [Google Scholar] [CrossRef]
  50. Vohringer, P. Ultrafast dynamics of electrons in ammonia. Annu. Rev. Phys. Chem. 2015, 66, 97–118. [Google Scholar] [CrossRef]
Sample Availability: Samples of the compounds are available from the authors.
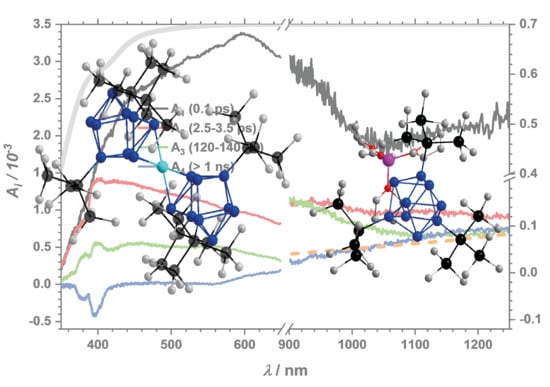
Figure 1. Molecular structure of LiGe9 (left) and Ge9ZnGe9 (right) from crystallographic data without hydrogen atoms. Color-code: Ge(blue); Zn(cyan); Si(black); C(grey); Li(pink); O(red).
Molecules 25 02639 g001
Figure 2. Absorption spectra for K(crypt)Ge9 and Ge9ZnGe9 between 250 and 1600 nm in THF solution with a concentration of about 1 mmol/L. Spectra of KGe9 and LiGe9 are very similar to K(crypt)Ge9 and can be found in the SI Figure S1.
Molecules 25 02639 g002
Figure 3. Broad transient absorption spectra for K(crypt)Ge9 in THF after excitation at 267/258 nm at given delay times. The gray line shows the ground state absorption spectrum with inverted OD axis. The lowered absolute transient response indicates absorption of the white-light probe beam by the sample between 350 and 390 nm.
Molecules 25 02639 g003
Figure 4. Transient response after 267/258 nm excitation at different wavelengths (circles) for K(crypt)Ge9 in THF. On a long timescale one can see that the values continuously increase with longer wavelengths. Fit curves are displayed as lines.
Molecules 25 02639 g004
Figure 5. Decay associated spectra from global fit (further information is given in the SI) for K(crypt)Ge9 in THF. A section of the absorption spectrum of the solvated electron in THF is given as an orange dashed line. Further spectra can be found in the SI Figure S2.
Molecules 25 02639 g005
Figure 6. DAS after 267/258 nm excitation for KGe9 in THF. Dashed blue and orange lines show a [K+,e] contact pair [40] and a section of the absorption of the solvated electron in THF [37]. The corresponding transient spectra and all spectra for LiGe9 can be found in SI Figures S3–S5.
Molecules 25 02639 g006
Figure 7. Transient spectra at given delay times for Ge9ZnGe9 in THF after 267 nm excitation. Ground state absorption spectrum in gray is inverted.
Molecules 25 02639 g007
Figure 8. Illustration on the processes after photoexcitation (hν) of the Ge9-cluster compounds. Recombination processes are depicted as violet arrows all other processes in orange.
Molecules 25 02639 g008
Table 1. Time constants from global analysis after UV (267 nm) and additionally 400 nm excitation for Ge9ZnGe9.
K(crypt)Ge9
(267 nm)
KGe9
(267 nm)
LiGe9
(267 nm)
Ge9ZnGe9
(267 nm)
Ge9ZnGe9
(400 nm)
τ1/ps0.10.50.5−0.70.30.4
τ2/ps2.5−3.53.32.42.5−5.81.8
τ3/ps120−14030−5040−603030
τ4/ps>1000>1000>1000700−1200400

