
Probing the Proton-Loading Site of Cytochrome C Oxidase Using Time-Resolved Fourier Transform Infrared Spectroscopy


1
Institute of Biotechnology, University of Helsinki, FIN-00014 Helsinki, Finland
2
Faculty of Chemistry, University of Gdansk, 80-308 Gdansk, Poland
3
Department of Agricultural Sciences, University of Helsinki, FI-00014 Helsinki, Finland
*
Author to whom correspondence should be addressed.
Molecules 2020, 25(15), 3393; https://doi.org/10.3390/molecules25153393
Submission received: 7 July 2020
/
Revised: 21 July 2020
/
Accepted: 23 July 2020
/
Published: 27 July 2020
(This article belongs to the Special Issue Cellular and Molecular Bioengineering)
Abstract
:Crystal structure analyses at atomic resolution and FTIR spectroscopic studies of cytochrome c oxidase have yet not revealed protonation or deprotonation of key sites of proton transfer in a time-resolved mode. Here, a sensitive technique to detect protolytic transitions is employed. In this work, probing a proton-loading site of cytochrome c oxidase from Paracoccus denitrificans with time-resolved Fourier transform infrared spectroscopy is presented for the first time. For this purpose, variants with single-site mutations of N131V, D124N, and E278Q, the key residues in the D-channel, were studied. The reaction of mutated CcO enzymes with oxygen was monitored and analyzed. Seven infrared bands in the “fast” kinetic spectra were found based on the following three requirements: (1) they are present in the “fast” phases of N131V and D124N mutants, (2) they have reciprocal counterparts in the “slow” kinetic spectra in these mutants, and (3) they are absent in “fast” kinetic spectra of the E278Q mutant. Moreover, the double-difference spectra between the first two mutants and E278Q revealed more IR bands that may belong to the proton-loading site protolytic transitions. From these results, it is assumed that several polar residues and/or water molecule cluster(s) share a proton as a proton-loading site. This site can be propionate itself (holding only a fraction of H+), His403, and/or water cluster(s).
1. Introduction
Cytochrome c oxidase (CcO) is the terminal complex (Complex IV) of the respiratory chain of mitochondria, many aerobic bacteria, and archaea. CcO contains four redox centers: CuA, heme a, heme a3, and CuB. The last two centers form a binuclear center (BNC) where the reduction of O2 to H2O takes place. This reaction requires four electrons and four protons (“chemical” protons) to be sent to the BNC. CcO accepts electrons from a small soluble enzyme Cytochrome c from the outside of the membrane (P-side or positively charged side, see Figure 1) and protons from the matrix of mitochondria or cytosol of bacteria (N-side or negatively charged side, see Figure 1). This reaction is highly exergonic, and energy released is used to translocate four more protons (“pumped” protons) across the membrane (from the N-side to the P-side). Thus, CcO takes part in the production of a transmembrane electrochemical gradient (ΔµH+) that is used for Adenosine Triphosphate (ATP) synthesis. ATP serves energy-dependent actions in the cell [1,2,3,4].
Electrons are carried from one redox center to the next by tunneling. In contrast to electrons, protons require special channels filled in with water molecules for their transfer in the protein interior. CcO possesses two such entrance channels from the N-side of the membrane, so called D- and K-channels, named after conserved Asp-124 and Lys-354 residues, respectively [5,6,7,8,9,10,11,12]. The current work is concentrated on the D-channel exploiting the mutations of key residues in this channel. The initial proton acceptor in the D-channel is D-124. From this residue, protons pass via a chain of polar residues and water molecules to E-278 (conserved residue in the middle of the membrane), then to Δ-propionate (Prp) of heme a3, to A-Prp of heme a3 [13,14], and finally to the proton-loading site (PLS or “pump” site) that is located ~1/5 distance from the P-side [15] (Figure 2, reproduced from [16]).
Although the identity of PLS was proposed [17,18,19,20], there was no attempt to directly observe its protonation/deprotonation status. One of the methods that allows protolytic transitions to be shown is Fourier transform infrared (FTIR) spectroscopy, and particularly time-resolved step-scan FTIR (TRS2-FTIR) spectroscopy [21,22,23,24,25,26,27,28,29,30,31]. FTIR spectroscopy was successfully applied to cytochrome c oxidase (e.g., [27,28]) and many other enzymes such as Ca2+ ATPase [32]), light-induced enzymes [33,34], bacteriorhodopsin [35], and redox induced enzymes such as respiratory Complex I [36], cytochrome bd [37], and bc1 [38], including time-resolved FTIR studies, for example, on channelrhodopsin-2 [39], bacteriorhodopsin [40,41], photosystem II [42], and cytochrome oxidase ba3 [30,31].
Some mutated D-channel variants of CcO (N131V and D124N mutants that were investigated in our previous work) showed enlarged amplitude of the potential generation during the “fast” kinetic phase of the oxygen reaction that was too large to be assigned simply to proton transfer to the BNC from the internal side of the membrane [43,44]. The terms “fast” and “slow” kinetic phases that we widely use throughout the manuscript originate from FTIR kinetic spectra where all the steady-state difference IR spectra comprise the components corresponding to reversible and irreversible processes. When a “slow” process dominates over a “fast” process, the discrepancy between the two respective kinds of difference spectra can be particularly significant. The “fast” components can be resolved only as an abrupt spectral change, while the “slow” component is resolved using a time-resolved FTIR technique. The details on the “fast” and “slow” component for CcO are described in more detail in [44]. Because of the fact that the observed amplitude was too high, it was concluded that the proton in these mutated enzymes is loaded to the PLS in the “fast” resolved kinetic phase and dissipates back to the BNC in the following “slow” kinetic phase. This enlarged electrometric amplitude is absent in the E278Q mutant [43]. Since the PLS should be loaded in the aforementioned mutants in the “fast” kinetic phases and unloaded (back to the BNC) in the “slow” kinetic phases, the FTIR time-resolved flow-flash spectra of these two phases should include the PLS protolytic infrared reciprocal bands. The identification of the PLS IR bands assigned to the PLS protonation should be (1) present in N131V and D124N mutants in their “fast” kinetic phases, (2) reciprocal in the “fast” and “slow” phases, with similar position and amplitude, and finally (3) absent in E278Q mutant “fast” kinetic phase. The analysis of these data allowed us to make a suggestion that the “pump” site is not presented by a single entity but is comprised of several contributors. In this manuscript, we assigned the observed IR bands to particular components of PLS. For the first time, probing a proton-loading site of cytochrome c oxidase with the use of time-resolved Fourier transform infrared spectroscopy is presented, which opens up a novel experimental procedure to deal with other proton-loading systems, in general.
2. Materials and Methods
2.1. Setup for Flow-Flash FTIR Measurements
In order to measure flow-flash reaction (oxygen reaction after photolysis of CO from FRCO (fully-reduced CO-inhibited enzyme) complex) on CcO, a special setup was assembled [39]. This setup, and the approach itself, were earlier applied to follow the oxygen reaction on CcO in real time [44,45,46,47]. The setup is based on an FTIR spectrometer IFS/66s (Bruker Optics, Ettlingen, Germany) equipped with a silicon/ZnSe ATR microprism (SensIR technologies (Chapel Hill, NC, USA), three-bounce version, surface diameter 3 mm) and a fast mercury-cadmium telluride (MCT) detector. The infrared range 1800–1000 cm−1 was cut out with an interference filter (Northumbria Optical Coatings Ltd., Boldon, UK). A special homemade chamber was placed on the ATR microprism. For the design of the chamber see [45], Figure 2 therein, and [16], Figure 3 therein. A syringe needle was directed to the center of an ATR sample at a very close distance (0.5 mm) from the sample film to produce high O2 concentration for the period of the kinetic experiment. O2-saturated buffer was injected with the help of a syringe pump: 100 µL of oxygenated buffer is injected at a speed of 10 mL/min. To initiate the oxygen reaction in FRCO inhibited enzyme, the light guide from the laser was mounted into the chamber and faced onto the microprism with the protein film. To follow the CcO oxygen reaction in the visible range, a reflectance probe from a visible spectrophotometer HR 2000+ (Ocean optics, St Petersburg, FL, USA) was mounted into the ATR chamber and positioned close to the CcO film. A flow-pump is necessary to remove oxygenated buffer from the sample area after measurements of the oxygen reaction. The flow pump was connected to the chamber and switched on in order to accelerate cycles of reduction and CO inhibition of CcO. For this purpose, the chamber was connected to a bottle with a “working” buffer that allowed the enzyme to be kept in the FRCO state. The whole sequence of events needed to measure oxygen reaction using FTIR and visible reflectance spectroscopies was controlled using a timing board. The sequence of commands from the timing board to the setup can be found in [16], Figure 4 therein.
2.2. Enzyme Preparation
Site-directed mutagenesis, bacterial growth conditions, and purification of all three here studied mutated CcO enzymes were as described in [48]. The samples were depleted of detergent to be able to immobilize them on the surface of a hydrophobic silicon ATR microprism mainly as described in [49] with modifications for the D124N mutant [45]. After the enzyme was “ATR-ready”, it was positioned on the ATR microprism, dried with a gentle N2 flow or under a tungsten fiber lamp (380–1700 nm), and then closed with a specially designed chamber (see the previous section). In the pumping buffer (2 mM potassium phosphate at pH 6.0), the dissolved gases were replaced with 100% CO in the gas-exchange vacuum line. The “working” buffer composition for N131V, D124N, and E278Q mutants can be found in [47] for N131V and [45] for D124N and E278Q. The FRCO form of enzymes was prepared as first described in [45]. Briefly, the “working” buffer (100 mM glucose, 260 µg/mL catalase, 3.3 mM ascorbate and 10–100 µM hexaammineruthenium(III) chloride, saturated with pure CO) was pumped over the enzyme film until the enzyme was transformed into the FRCO form. This transformation was controlled by the appearance of a C≡O-heme a3 stretching vibration band at 1965 cm−1 and took normally between 40 and 80 min.
2.3. Sample Quality Control
The quality of CcO samples, desired for the flow-flash experiments, was controlled using three different approaches: (1) the appearance, amplitude, and the shape of the heme a3-C≡O band at 1965 cm−1; (2) CO recombination with heme a3 after photolysis of FRCO complex, followed using a visible spectrophotometer HR2000+ (Ocean Optics, St Petersburg, FL, USA) (410–700 nm, with 1 ms temporal resolution, kinetics acquisition was triggered by the laser flash); (3) following the CO dissociation in the dark from heme a3, which was detected using the rapid-scan mode in the region around 1965 cm−1; and (4) following a flow-flash reaction in the region of around 1965 cm−1 to determine the amount of enzyme capable to perform the oxygen reaction. This region in (3) and (4) was cut out with an interference filter, and the FTIR rapid-scan (RS) mode with time-resolution ~68 ms was applied. The latest approach was performed in the beginning, in the middle, and at the end of each series of flow-flash FTIR kinetic surfaces collection and used to estimate the concentration of catalytically active enzyme (for more details, see [45]). The concentration of active CcO was estimated based on the intensity of the 1965 cm−1 band [50].
2.4. The Oxygen Reaction Measured by Time-Resolved ATR-FTIR Spectroscopy
The oxygen reaction was measured using FTIR time-resolved spectroscopy on three D-channel mutants. All had slower kinetics that allowed measuring the oxygen reaction on them with the RS mode with ~46 ms temporal resolution (i.e., the slow parts of the reaction). The desired spectral region of 1800–1000 cm−1 was cut off with an interference filter. The spectral resolution was set at 8 cm−1. A background (BG) in the IR region of 1024 coadditions was taken before measuring the oxygen reaction. The apodization function used in Fourier transformation was set at Blackman–Harris 3-term. First, the oxygenated buffer was injected, and, together with it, rapid-scan acquisition was started, followed by a 3 s delay, and, finally, the laser flash fired. Four hundred FTIR spectra were collected, which corresponded to ~18.4 s. The flow-pump was stopped before a BG spectrum was collected and again switched on after the kinetics collection finished. The pump was switched on in order to speed up the CcO reduction and FRCO complex formation. This cycle was repeated for a number of hours on the same sample film (the enzyme was active during several days of measurements) in order to decrease the ratio signal/noise. All experiments were performed in ice-cooled conditions (0 °C), which slowed down the speed of the oxygen reactions and increased the local O2 concentration up to 2.4 mM. Applying the RS FTIR approach, it was possible to resolve kinetically only “slow” kinetic phases of the reaction of mutated proteins with oxygen. Reactions faster than 46 ms were detected only as a spectral jump after the laser flash. To resolve slow phases, a global fitting procedure using three sequential reactions in Matlab software (The MathWorks, Inc., Natick, MA, USA) was applied with the SPLMOD algorithm (see [45] for more details). This way, the “slow” kinetic phase in each of the studied mutant enzymes was extracted. Unresolved fast reactions were calculated as a difference between the average of several time points before laser fire and the spectrum measured immediately after the laser flash. These kinetic surfaces were called “fast” kinetic phases.
2.5. Data Analysis and Structural Visualization.
The data analysis and spectral data representation were performed with the Matlab software. Molecular structures were visualized with Visual Molecular Dynamics Software (VMD, http://www.ks.uiuc.edu/Research/vmd/) [51].
3. Results
3.1. FTIR Spectra of “Fast” and “Slow” Kinetic Phases of CcO Mutants with Blocked D-Channel
Our overview of spectral features begins with the N131V mutant measured at pH 9.0 (Figure 3). Here, we would like to note that we used the pH values in the experiments that rationally address the potential role of each of the mutated residues in the whole proton transfer process and allow for the obtainment of the corresponding spectra. The oxygen reaction in this case, and in all following experiments, was performed in ice-cooled conditions to slow down the reaction rates of mutated enzymes. Using this approach, we managed to resolve the flow-flash reaction using the RS FTIR approach. FTIR kinetic surfaces (Δ optical density-time-wavenumber) (altogether 218 co-additions) were decomposed into two kinetic phases. The first phase (the “fast” kinetic phase) is simply the increase after the laser flash and includes all reactions faster than ~46 ms (time resolution of our RS FTIR method applied). The first resolved phase (we call it here the “slow” kinetic phase) developed with τ ~ 600 ms. The “slow” kinetic phase was nicely fitted with a single exponential equation, which proved that the enzyme population turning over after the laser flash is homogeneous. FRCO FTIR photolysis spectra were measured separately (on the wild-type (WT) enzyme at pH 6.5) using continuous mode FTIR spectroscopy with a spectral resolution of 8 cm−1 and subtracted from each “fast” phase transition in this case and in all further experiments mentioned in this work irrespectively of the pH value, as it was demonstrated that FRCO photolysis (on WT) shows no difference irrespectively of the pH range measured [52]. Such subtraction allowed for a better representation of the differences between the spectra of the mutants and WT enzyme. All spectra in this work were normalized to 1 mM concentration by amplitude of the heme a3-C≡O band [50] that was photolyzed by a laser flash. The next set of the same data is for the N131V mutant but at pH 6.5: 338 kinetic surfaces were collected altogether. All conditions were essentially the same as for the N131V mutant at pH 9.0. The “slow” kinetic phase was resolved with τ ~ 90 ms (Figure 4), hence the larger noise level relative to N131V at pH 9.0. Here, 18 reciprocal IR bands were found and labeled. The reciprocal IR bands that are present in all three above stated cases are ~1699, ~1674, ~1655, 1641, ~1550, 1532, ~1481, ~1405, ~1245, ~1140, and 1093 cm−1, 11 IR bands altogether (the assignments of the spectra mentioned in the manuscript are summarized in Table 1). These bands are further compared with those found in E278Q “fast” kinetic spectra. Figure 5 shows mutated enzyme D124N with 296 kinetic surfaces altogether (conditions are essentially the same as for the previous mutant). In this mutant, 19 reciprocal bands were found.
3.2. Comparison of “Fast” Kinetic Spectra of D-Blocked Channel Mutants and E278Q
4. Discussion
Based on our results we discuss the potential role of different proton-loading site participants. One clear IR band is present in the “fast” kinetic spectra of N131V at both pH values and D124N mutants at ~1699 cm−1 position. In the E278Q enzyme, this band also appears though with a reduced intensity and is within the noise level. Despite this reduced insensitivity in the difference spectrum of the E278Q mutant within this frequency region, the observed weak intensity differences should not be neglected. To better visualize the other differences between (i) the “fast” kinetic spectra of two mutants at three conditions altogether (with loaded PLS), namely N131V at pH 9.0 and 6.5 and D124N at pH 9.0 and (ii) the “fast” kinetic spectrum of the E278Q mutant (empty PLS), the difference spectra between each of (i) and (ii) were produced and presented in Figure 7 (=the double-difference spectra). Seven different IR bands were found in the “fast” phases that (1) are present in the “fast” kinetic spectra of both N131V and D124N mutants, (2) have reciprocal counterparts in their “slow” kinetic spectra, and (3) are absent in the “fast” kinetic spectra of E278Q mutant. These bands are ~1699, ~1655, 1641, ~1550, ~1481, ~1405, and ~1140 cm−1. To see more bands, the double-difference spectra were calculated. Additionally, bands that are not seen in the difference spectra but are visualized in the double-difference spectra are also marked (Figure 7). Some of these bands should include a protolytic transition of the PLS (protonation in the “fast” kinetic phase and deprotonation in the “slow” one).
The identification of the IR bands of the PLS begins from the least probable candidates in order to exclude them from consideration.
- Asp/Glu. The next least probable candidates are Asp and Glu residues. Even though there is Asp-399 hydrogen bonded to A-Prp, this residue is less probable because of the position of the C=O symmetrical protonation bands for the region of 1712–1788 cm−1 for Asp. A similar situation is with Asp, whose band position is in the region 1716–1788 cm−1 for the inside of a protein [55]. There are no bands in this region in the double-difference spectra except the earlier assigned Glu-278 bands [45], seen here as a drop at ~1740 cm−1. Even though Asp-399 was proposed as a possible PLS in [19], no full Asp protonation signature is evident in the spectra. A recent study with mutated Asp-399 and His-433 [56] described the importance of Asp-399 together with His-433 in proton-pumping, based on their mutations. Asp-399 was shown to be important in proton-pumping [19].
- Lys. Although the Lys side chain amino group gives rise to only weak IR bands, it can be excluded from consideration because there is no Lys close to A-Prp.
- Heme a3. The first probable candidate for the PLS is A-Prp of heme a3 itself. Protonated propionate has an intensive absorbance at about 1700 cm−1 (see Internet free databases [57] for example). However, if we assume that the extinction coefficient of Prp is close to that of Glu, if it takes a proton during the “fast” kinetic phase, it must hold only a fraction of it. Another fraction in this case must be distributed between other possible protonation sites. Behr et al. published [58] the IR difference spectrum of Prp in CcO, but it was done for the redox static spectrum of CcO.
- His. The second probable candidate is His, with both the first (imidazolium-minus-imidazole) and the second (imidazole-minus-imidazolate) protolytic transitions (for the spectra see [53]). The IR window around 1100 cm−1 is free from all other vibrations in enzymes except for histidines. There are two major bands that could be assigned: 1096 cm−1 to the 1st His transition and 1107 cm−1 to the second transition. The assignment of other characteristic bands to His in the double-difference spectra is difficult because of their interference with other residue, amide and heme bands. There is no known data for extinction coefficients for these two bands, thus it is impossible to estimate the contribution of each of them to the double-difference spectra. Moreover, there is His-403 (Figure 1) close to A-Prp and a hydrogen bond that additionally proves that there is a contribution of His absorption to the PLS. The structural analysis of the corresponding structure (PDB ID: 3HB3, 2.25 Å) suggests that proton-pumping does not require either a histidine or an aspartate hydrogen bonded to A-Prp.
- Water clusters. Finally, the last and the most probable candidate for consideration as a contributor to the PLS absorption is water cluster(s). Since protonated water clusters could absorb in the region 1800–1000 cm−1 with weak extinction [59], the observed absorption could be putatively assigned to the contribution to the protonated PLS water molecules. Supekar et al. showed using multi-scale molecular simulation that a transient PLS may indeed be a protonated water cluster in the form of a Zundel or an Eigen ion [60]. Furthermore, Lu et al. predicted from their calculations that the PLS is not simply one residue, but a cluster composed of polar residues and water molecules [61], which is in agreement with the suggestion made in our work. Finally, a number of experimental studies conducted by Palese support our hypothesis about the significance of the protonated water clusters in the realization of the proton pathway through the cytochrome CcO [62,63,64]. Due to the technical challenges in the assignment of the spectra of particular water molecules belonging to the “water region” (Figure 2) and because it is beyond the scope of this work, we leave the question about the roles of individual water molecules in proton transfer open for future studies. Instead we define the “water region” by the distance cut-off of 4 Å from the amino acid residues comprising the channels, shown in Figure 2.
5. Conclusions
In this paper, for the first time, an attempt to probe the protonation/deprotonation of the PLS of CcO enzyme using FTIR time-resolved spectroscopy is presented. To measure the IR spectrum of the PLS of an enzyme, a special setup was built based on a FTIR spectrometer IFS 66/s with a fast MCT detector and an ATR cell. A special gas-tight chamber with connectors to a bottle with “working buffer” was assembled on top of the ATR cell, which allowed production of the FRCO complex and, thus, measurement of the oxygen reaction in the selected mutated CcO variants. In order to attribute IR bands to protonation of the PLS, they should fulfill the following criteria: (1) be present in the “fast” kinetic spectra for N131V and D124N, (2) be reciprocal in the “slow” kinetic spectra for these mutants, and (3) be absent in the “fast” kinetic spectra of the E278Q mutant. Seven IR bands were found that satisfy these three requirements. To more accurately resolve the bands that belong to protonation/deprotonation of the PLS, the double-difference spectra between the “fast” kinetic spectra of N131V and D124N and between E278Q mutants were taken. More clear bands appeared in the so-called double-difference spectra. Some of these IR bands could be assigned partially to a Prp and also to a His residue. The Prp is most likely heme a3 A-Prp, whereas the His is possibly located nearby heme a3 A-Prp His-403. Water clusters absorb weakly in the studied region and could not be seen due to much stronger bands of hemes and amino acid residues. Nevertheless, water cluster(s) is/are possible candidate(s) for the PLS and should be expected in the “water region” with a small extinction. To sum up, we propose a molecular mechanism of proton-loading in the enzyme CcO by applying FTIR techniques. Besides deepening the understanding of the molecular basis of this particular enzyme function, the methodological pipeline established and used in this work represents a promising experimental approach that could be further adapted to successfully characterize other protein-transporting enzymatic systems.
Author Contributions
E.G. designed and performed the research; E.G., S.A.S. and R.K. analyzed the data; E.G. and R.K. wrote the manuscript. All authors have read and agreed to the published version of the manuscript.
Funding
E.G. was supported by the Center of International Mobility (CIMO) and Informational and Structural Biology (ISB) Graduate School. The work was supported by the Sigrid Juselius foundation, Biocentrum Helsinki and the Academy of Finland (project numbers 200726, 44895, and 115108). S.A.S. was supported by the National Science Centre of Poland (UMO-2018/30/E/ST4/00037). Open access funding provided by University of Helsinki including Helsinki University Central Hospital. The funders had no role in study design, data collection and analysis, decision to publish, or preparation of the manuscript.
Acknowledgments
This work is dedicated to the memory of Michael Verkhovsky, whose ideas and studies it is based upon. We warmly thank the following people: Nikolai Belevich for excellent technical assistance and Marina Verkhovskaya and Alexander A. Kamnev for critical reading of the manuscript.
Conflicts of Interest
The authors declare that they have no conflicts of interest.
Abbreviations
| ATR | attenuated total reflectance |
| BG | background |
| BNC | binuclear center |
| CcO | cytochrome c oxidase |
| FRCO | fully-reduced CO-inhibited enzyme |
| FTIR | Fourier transform infrared |
| IR | infrared |
| PLS | proton-loading site |
| Prp | propionate |
References
- Wikström, M.K.F. Proton pump coupled to cytochrome c oxidase in mitochondria. Nature 1977, 266, 271–273. [Google Scholar] [CrossRef] [PubMed]
- Babcock, G.T.; Wikström, M. Oxygen activation and the conservation of energy in cell respiration. Nature 1992, 356, 301–309. [Google Scholar] [CrossRef] [PubMed]
- Wikström, M. Cytochrome c oxidase: 25 years of the elusive proton pump. Biochim. Biophys. Acta BBA 2004, 1655, 241–247. [Google Scholar] [CrossRef] [PubMed] [Green Version]
- Brzezinski, P. Redox-driven membrane-bound proton pumps. Trends Biochem. Sci. 2004, 29, 380–387. [Google Scholar] [CrossRef]
- Hosler, J.P.; Ferguson-Miller, S.; Calhoun, M.W.; Thomas, J.W.; Hill, J.; Lemieux, L.; Ma, J.; Georgiou, C.; Fetter, J.; Shapleigh, J.; et al. Insight into the active-site structure and function of cytochrome oxidase by analysis of site-directed mutants of bacterial cytochromeaa 3 and cytochromebo. J. Bioenerg. Biomembr. 1993, 25, 121–136. [Google Scholar] [CrossRef]
- Fetter, J.R.; Qian, J.; Shapleigh, J.; Thomas, J.W.; Garcia-Horsman, A.; Schmidt, E.; Hosler, J.; Babcock, G.T.; Gennis, R.B.; Ferguson-Miller, S. Possible proton relay pathways in cytochrome c oxidase. Proc. Natl. Acad. Sci. USA 1995, 92, 1604–1608. [Google Scholar] [CrossRef] [Green Version]
- Iwata, S.; Ostermeier, C.; Ludwig, B.; Michel, H. Structure at 2.8 Å resolution of cytochrome c oxidase from Paracoccus denitrificans. Nature 1995, 376, 660–669. [Google Scholar] [CrossRef]
- Tsukihara, T.; Aoyama, H.; Yamashita, E.; Tomizaki, T.; Yamaguchi, H.; Shinzawa-Itoh, K.; Nakashima, R.; Yaono, R.; Yoshikawa, S. The Whole Structure of the 13-Subunit Oxidized Cytochrome c Oxidase at 2.8 Å. Science 1996, 272, 1136–1144. [Google Scholar] [CrossRef]
- Thomas, J.W.; Puustinen, A.; Alben, J.O.; Gennis, R.B.; Wikström, M. Substitution of asparagine for aspartate-135 in subunit I of the cytochrome bo ubiquinol oxidase of Escherichia coli eliminates proton-pumping activity. Biochemistry 1993, 32, 10923–10928. [Google Scholar] [CrossRef] [PubMed]
- Ostermeier, C.; Harrenga, A.; Ermler, U.; Michel, H. Structure at 2.7 Å resolution of the paracoccus denitrificans two-subunit cytochrome c oxidase complexed with an antibody fv fragment. Proc. Natl. Acad. Sci. USA 1997, 94, 10547–10553. [Google Scholar] [CrossRef] [PubMed] [Green Version]
- Yoshikawa, S.; Shinzawa-Itoh, K.; Nakashima, R.; Yaono, R.; Yamashita, E.; Inoue, N.; Yao, M.; Fei, M.J.; Libeu, C.P.; Mizushima, T.; et al. Redox-Coupled Crystal Structural Changes in Bovine Heart Cytochrome c Oxidase. Science 1998, 280, 1723–1729. [Google Scholar] [CrossRef] [PubMed] [Green Version]
- Tsukihara, T.; Aoyama, H.; Yamashita, E.; Tomizaki, T.; Yamaguchi, H.; Shinzawa-Itoh, K.; Nakashima, R.; Yaono, R.; Yoshikawa, S. Structures of metal sites of oxidized bovine heart cytochrome c oxidase at 2.8 A. Science 1995, 269, 1069–1074. [Google Scholar] [CrossRef]
- Wikström, M.; Verkhovsky, M.I. Mechanism and energetics of proton translocation by the respiratory heme-copper oxidases. Biochim. Biophys. Acta BBA 2007, 1767, 1200–1214. [Google Scholar] [CrossRef] [PubMed] [Green Version]
- Liang, R.; Swanson, J.M.; Peng, Y.; Wikstrom, M.; Voth, G.A. Multiscale simulations reveal key features of the proton-pumping mechanism in cytochrome c oxidase. Proc. Natl. Acad. Sci. USA 2016, 113, 7420–7425. [Google Scholar] [CrossRef] [PubMed] [Green Version]
- Belevich, I.; Bloch, D.A.; Belevich, N.; Wikstrom, M.; Verkhovsky, M.I. Exploring the proton pump mechanism of cytochrome c oxidase in real time. Proc. Natl. Acad. Sci. USA 2007, 104, 2685–2690. [Google Scholar] [CrossRef] [PubMed] [Green Version]
- Gobrikova, E. Oxygen reduction and proton translocation by cytochrome c oxidase. Ph.D. Thesis, University of Helsinki, Department of Biological and Environmental Sciences & Institute of Biotechnology & National Graduate School in Informational and Structural Biology Åbo Akademi, Helsinki, Norway, 2009. [Google Scholar]
- Kaila, V.R.I.; Sharma, V.; Wikström, M. The identity of the transient proton loading site of the proton-pumping mechanism of cytochrome c oxidase. Biochim. Biophys. Acta BBA 2011, 1807, 80–84. [Google Scholar] [CrossRef] [PubMed] [Green Version]
- Egawa, T.; Yeh, S.R.; Rousseau, D.L. Redox-Controlled Proton Gating in Bovine Cytochrome c Oxidase. PLoS ONE 2013, 8, e63669. [Google Scholar] [CrossRef] [Green Version]
- Von Ballmoos, C.; Gonska, N.; Lachmann, P.; Gennis, R.B.; Adelroth, P.; Brzezinski, P. Mutation of a single residue in the ba3 oxidase specifically impairs protonation of the pump site. Proc. Natl. Acad. Sci. USA 2015, 112, 3397–3402. [Google Scholar] [CrossRef] [Green Version]
- Nicolaides, A.; Soulimane, T.; Varotsis, C. Detection of functional hydrogen-bonded water molecules with protonated/deprotonated key carboxyl side chains in the respiratory enzyme ba 3-oxidoreductase. Phys. Chem. Chem. Phys. 2015, 17, 8113–8119. [Google Scholar] [CrossRef]
- Griffiths, P.R.; De Haseth, J.A. Fourier Transform Infrared Spectrometry, 2nd ed.; John Wiley & Sons, Ltd.: Chichester, UK, 2007. [Google Scholar] [CrossRef] [Green Version]
- Papadopoulos, P. Friedrich Siebert and Peter Hildebrandt, vibrational spectroscopy in life science. Colloid Polym. Sci. 2008, 286, 487. [Google Scholar] [CrossRef]
- Gunzler, H.; Gremlich, H.-U. Ir Spectroscopy: An Introduction; WILEY-VCH Verlag GmbH: Weinheim, Germany, 2002. [Google Scholar]
- Stuart, B.H. Infrared Spectroscopy: Fundamentals and Applications; John Wiley & Sons, Ltd.: Chichester, UK, 2004. [Google Scholar] [CrossRef]
- Stuart, B.H. Biological Applications of Infrared Spectroscopy; John Wiley & Sons, Ltd.: Chichester, UK, 1997. [Google Scholar]
- Barth, A.; Haris, P.I. Biological and Biomedical Infrared Spectroscopy; IOS Press: Amsterdam, The Netherlands, 2009. [Google Scholar] [CrossRef]
- Hellwig, P.; Rost, B.; Kaiser, U.; Ostermeier, C.; Michel, H.; Mäntele, W. Carboxyl group protonation upon reduction of the Paracoccus denitrificans cytochrome c oxidase: Direct evidence by FTIR spectroscopy. FEBS Lett. 1996, 385, 53–57. [Google Scholar] [CrossRef] [Green Version]
- Nyquist, R.M.; Heitbrink, D.; Bolwien, C.; Wells, T.A.; Gennis, R.B.; Heberle, J. Perfusion-induced redox differences in cytochrome c oxidase: ATR/FT-IR spectroscopy. FEBS Lett. 2001, 505, 63–67. [Google Scholar] [CrossRef] [Green Version]
- Gorbikova, E.; Kalendar, R. Comparison between O and OH Intermediates of Cytochrome c Oxidase Studied by FTIR Spectroscopy. Front. Chem. 2020, 8. [Google Scholar] [CrossRef] [PubMed]
- Nicolaides, A.; Soulimane, T.; Varotsis, C. Ns-mus time-resolved step-scan FTIR of ba(3) oxidoreductase from thermus thermophilus: Protonic connectivity of w941-w946-w927. Int. J. Mol. Sci. 2016, 17, 1657. [Google Scholar] [CrossRef] [Green Version]
- Koutsoupakis, C.; Soulimane, T.; Varotsis, C. Discrete Ligand Binding and Electron Transfer Properties of ba3-Cytochrome c Oxidase from Thermus thermophilus: Evolutionary Adaption to Low Oxygen and High Temperature Environments. Acc. Chem. Res. 2019, 52, 1380–1390. [Google Scholar] [CrossRef]
- Kumar, S.; Li, C.; Montigny, C.; Le Maire, M.; Barth, A. Conformational changes of recombinant Ca2+-ATPase studied by reaction-induced infrared difference spectroscopy. FEBS J. 2013, 280, 5398–5407. [Google Scholar] [CrossRef]
- Berthomieu, C.; Hienerwadel, R. Vibrational spectroscopy to study the properties of redox-active tyrosines in photosystem II and other proteins. Biochim. Biophys. Acta BBA 2005, 1707, 51–66. [Google Scholar] [CrossRef] [Green Version]
- Dioumaev, A.K.; Brown, L.; Shih, J.; Spudich, E.N.; Spudich, A.J.L.; Lanyi, J.K. Proton Transfers in the Photochemical Reaction Cycle of Proteorhodopsin†. Biochemistry 2002, 41, 5348–5358. [Google Scholar] [CrossRef]
- Souvignier, G.; Gerwert, K. Proton uptake mechanism of bacteriorhodopsin as determined by time-resolved stroboscopic-FTIR-spectroscopy. Biophys. J. 1992, 63, 1393–1405. [Google Scholar] [CrossRef] [Green Version]
- Marshall, D.; Fisher, N.; Grigic, L.; Zickermann, V.; Brandt, U.; Shannon, R.J.; Hirst, J.; Lawrence, R.; Rich, P.R. Atr-ftir redox difference spectroscopy of yarrowia lipolytica and bovine complex I. Biochemistry 2006, 45, 5458–5467. [Google Scholar] [CrossRef]
- Zhang, J.; Oettmeier, W.; Gennis, R.B.; Hellwig, P. Ftir spectroscopic evidence for the involvement of an acidic residue in quinone binding in cytochrome bd from Escherichia coli. Biochemistry 2002, 41, 4612–4617. [Google Scholar] [CrossRef] [PubMed]
- Iwaki, M.; Yakovlev, G.; Hirst, J.; Osyczka, A.; Dutton, P.L.; Marshall, D.; Rich, P.R. Direct observation of redox-linked histidine protonation changes in the iron-sulfur protein of the cytochrome bc1 complex by atr-ftir spectroscopy. Biochemistry 2005, 44, 4230–4237. [Google Scholar] [CrossRef] [PubMed]
- Lorenz-Fonfria, V.A.; Resler, T.; Krause, N.; Nack, M.; Gossing, M.; Fischer von Mollard, G.; Bamann, C.; Bamberg, E.; Schlesinger, R.; Heberle, J. Transient protonation changes in channelrhodopsin-2 and their relevance to channel gating. Proc. Natl. Acad. Sci. USA 2013, 110, E1273–E1281. [Google Scholar] [CrossRef] [PubMed] [Green Version]
- Lorenz-Fonfria, V.A.; Kandori, H.; Padrós, E. Probing Specific Molecular Processes and Intermediates by Time-Resolved Fourier Transform Infrared Spectroscopy: Application to the Bacteriorhodopsin Photocycle. J. Phys. Chem. B 2011, 115, 7972–7985. [Google Scholar] [CrossRef] [PubMed]
- Heberle, J. The dynamics of proton transfer across bacteriorhodopsin explored by FT-IR spectroscopy. Biochim. Biophys. Acta BBA 2005, 1458, 135–147. [Google Scholar] [CrossRef] [Green Version]
- Noguchi, T. Fourier transform infrared difference and time-resolved infrared detection of the electron and proton transfer dynamics in photosynthetic water oxidation. Biochim. Biophys. Acta BBA 2015, 1847, 35–45. [Google Scholar] [CrossRef] [Green Version]
- Belevich, I.; Verkhovsky, M.I.; Wikström, M. Proton-coupled electron transfer drives the proton pump of cytochrome c oxidase. Nature 2006, 440, 829–832. [Google Scholar] [CrossRef]
- Belevich, I.; Gorbikova, E.; Belevich, N.P.; Rauhamaki, V.; Wikstrom, M.; Verkhovsky, M.I. Initiation of the proton pump of cytochrome c oxidase. Proc. Natl. Acad. Sci. USA 2010, 107, 18469–18474. [Google Scholar] [CrossRef] [Green Version]
- Gorbikova, E.A.; Belevich, N.P.; Wikstrom, M.; Verkhovsky, M.I. Time-resolved atr-ftir spectroscopy of the oxygen reaction in the d124n mutant of cytochrome c oxidase from paracoccus denitrificans. Biochemistry 2007, 46, 13141–13148. [Google Scholar] [CrossRef]
- Gorbikova, E.A.; Belevich, I.; Wikstrom, M.; Verkhovsky, M.I. The proton donor for o-o bond scission by cytochrome c oxidase. Proc. Natl. Acad. Sci. USA 2008, 105, 10733–10737. [Google Scholar] [CrossRef] [Green Version]
- Gorbikova, E.A.; Wikstrom, M.; Verkhovsky, M.I. The protonation state of the cross-linked tyrosine during the catalytic cycle of cytochrome c oxidase. J. Biol. Chem. 2008, 283, 34907–34912. [Google Scholar] [CrossRef] [PubMed] [Green Version]
- Riistama, S.; Laakkonen, L.; Wikstrom, M.; Verkhovsky, M.I.; Puustinen, A. The calcium binding site in cytochrome aa3 from paracoccus denitrificans. Biochemistry 1999, 38, 10670–10677. [Google Scholar] [CrossRef] [PubMed]
- Rich, P.R.; Breton, J. Attenuated total reflection fourier transform infrared studies of redox changes in bovine cytochrome c oxidase: Resolution of the redox fourier transform infrared difference spectrum of hemea3. Biochemistry 2002, 41, 967–973. [Google Scholar] [CrossRef] [PubMed]
- Yoshikawa, S.; Choc, M.G.; O’Toole, M.C.; Caughey, W.S. An infrared study of co binding to heart cytochrome c oxidase and hemoglobin a. Implications re o2 reactions. J. Boil. Chem. 1977, 252, 5498–5508. [Google Scholar]
- Humphrey, W.; Dalke, A.; Schulten, K. VMD: Visual molecular dynamics. J. Mol. Graph. 1996, 14, 33–38. [Google Scholar] [CrossRef]
- Heitbrink, D.; Sigurdson, H.; Bolwien, C.; Brzezinski, P.; Heberle, J. Transient binding of CO to Cu(B) in cytochrome c oxidase is dynamically linked to structural changes around a carboxyl group: A time-resolved step-scan Fourier transform infrared investigation. Biophys. J. 2002, 82, 1–10. [Google Scholar] [CrossRef] [Green Version]
- Wikström, M. Infrared protein spectroscopy as a tool to study protonation reactions within proteins. In Biophysical and Structural Aspects of Bioenergetics; Wikström, M., Ed.; RSC Publishing: Cambridge, UK, 2007; pp. 314–333. [Google Scholar] [CrossRef]
- Koepke, J.; Olkhova, E.; Angerer, H.; Müller, H.; Peng, G.; Michel, H. High resolution crystal structure of Paracoccus denitrificans cytochrome c oxidase: New insights into the active site and the proton transfer pathways. Biochim. Biophys. Acta BBA 2009, 1787, 635–645. [Google Scholar] [CrossRef] [Green Version]
- Barth, A. The infrared absorption of amino acid side chains. Prog. Biophys. Mol. Boil. 2000, 74, 141–173. [Google Scholar] [CrossRef]
- Chang, H.Y.; Choi, S.K.; Vakkasoglu, A.S.; Chen, Y.; Hemp, J.; Fee, J.A.; Gennis, R.B. Exploring the proton pump and exit pathway for pumped protons in cytochrome ba3 from thermus thermophilus. Proc. Natl. Acad. Sci. USA 2012, 109, 5259–5264. [Google Scholar] [CrossRef] [Green Version]
- Chemical Book. Propionic Acid. Available online: https://www.chemicalbook.com/SpectrumEN_79-09-4_IR2.htm (accessed on 7 July 2020).
- Behr, J.; Hellwig, P.; Mantele, W.; Michel, H. Redox dependent changes at the heme propionates in cytochrome c oxidase from paracoccus denitrificans: Direct evidence from ftir difference spectroscopy in combination with heme propionate 13c labeling. Biochemistry 1998, 37, 7400–7406. [Google Scholar] [CrossRef]
- Headrick, J.M.; Diken, E.G.; Walters, R.S.; Hammer, N.I.; Christie, R.A.; Cui, J.; Myshakin, E.M.; Duncan, M.A.; Johnson, M.A.; Jordan, K.D. Spectral signatures of hydrated proton vibrations in water clusters. Science 2005, 308, 1765–1769. [Google Scholar] [CrossRef] [PubMed]
- Supekar, S.; Gamiz-Hernandez, A.P.; Kaila, V.R. A Protonated Water Cluster as a Transient Proton-Loading Site in Cytochrome cOxidase. Angew. Chem. Int. Ed. 2016, 55, 11940–11944. [Google Scholar] [CrossRef] [PubMed]
- Lu, J.; Gunner, M.R. Characterizing the proton loading site in cytochrome c oxidase. Proc. Natl. Acad. Sci. USA 2014, 111, 12414–12419. [Google Scholar] [CrossRef] [Green Version]
- Palese, L.L. Cytochrome c oxidase structures suggest a four-state stochastic pump mechanism. Phys. Chem. Chem. Phys. 2019, 21, 4822–4830. [Google Scholar] [CrossRef] [PubMed]
- Palese, L.L. Explaining leak states in the proton pump of heme-copper oxidases observed in single-molecule experiments. Biophys. Chem. 2019, 256, 106276. [Google Scholar] [CrossRef] [PubMed]
- Palese, L.L. Oxygen-oxygen distances in protein-bound crystallographic water suggest the presence of protonated clusters. Biochim. Biophys. Acta BBA 2020, 1864, 129480. [Google Scholar] [CrossRef] [PubMed]
Figure 1.
Cytochrome c oxidase (CcO) overall structure (A) and the heme a3 propionates together with located in 5 Å proximity His-403 and Asp-399 and water molecules (red spheres) (B). The atomic coordinates are obtained from the structure of Paracoccus denitrificans enzyme (PDB ID: 3HB3, 2.25 Å). His-403 and Asp-399 are hydrogen bonded to A-Prp of heme.

Figure 2.
Schematic representation of the proposed proton transfer in CcO. Left panel: the proton transfer routes through the D- and K-channels and proton-loading site (PLS) are shown by black arrows. The polar residues composing both channels and hemes without ions are shown in stick representation and labeled. Right panel: water molecules (resolved in the structure within 4.0 Å of these residues and metal ions) and metal ions are shown in spheres and labeled using the following numbers: 1—water molecules within D- and K-channels (magenta), 2—water molecules within PLS (yellow), 3—iron (orange), 4—copper (cyan), 5—manganese (blue). The atomic coordinates are obtained from the structure of Paracoccus denitrificans enzyme (PDB ID: 3HB3, 2.25 Å).

Figure 3.
The “fast” and “slow” kinetic spectra of N131V mutant at pH 9.0. The dark-blue spectrum represents the “fast” phase and the red spectrum represents the “slow” one. A total of 14 reciprocal IR bands were found, of about equal position and amplitude in these two kinetic phases. The reciprocal IR bands are marked. Note that in this paper (here and below) the bands that were already earlier assigned, i.e., the Glu-278 band at around 1740 cm−1, Tyr-280 at 1308 cm−1, Tyr-35 at 1247 cm−1, and a shift 1514/1496 cm−1, are omitted from consideration.

Figure 4.
The “fast” and “slow” kinetic spectra of N131V mutant at pH 6.5. The “fast” phase spectrum (in dark blue) and the “slow” one (in red) are shown. Eighteen reciprocal IR bands are marked with numbers.
Figure 4.
The “fast” and “slow” kinetic spectra of N131V mutant at pH 6.5. The “fast” phase spectrum (in dark blue) and the “slow” one (in red) are shown. Eighteen reciprocal IR bands are marked with numbers.

Figure 5.
The “fast” and “slow” kinetic spectra of the D124N mutant at pH 9.0. The “fast” kinetic spectrum in dark blue and the “slow” one in red are shown. The reciprocal IR bands are marked with numbers.
Figure 5.
The “fast” and “slow” kinetic spectra of the D124N mutant at pH 9.0. The “fast” kinetic spectrum in dark blue and the “slow” one in red are shown. The reciprocal IR bands are marked with numbers.

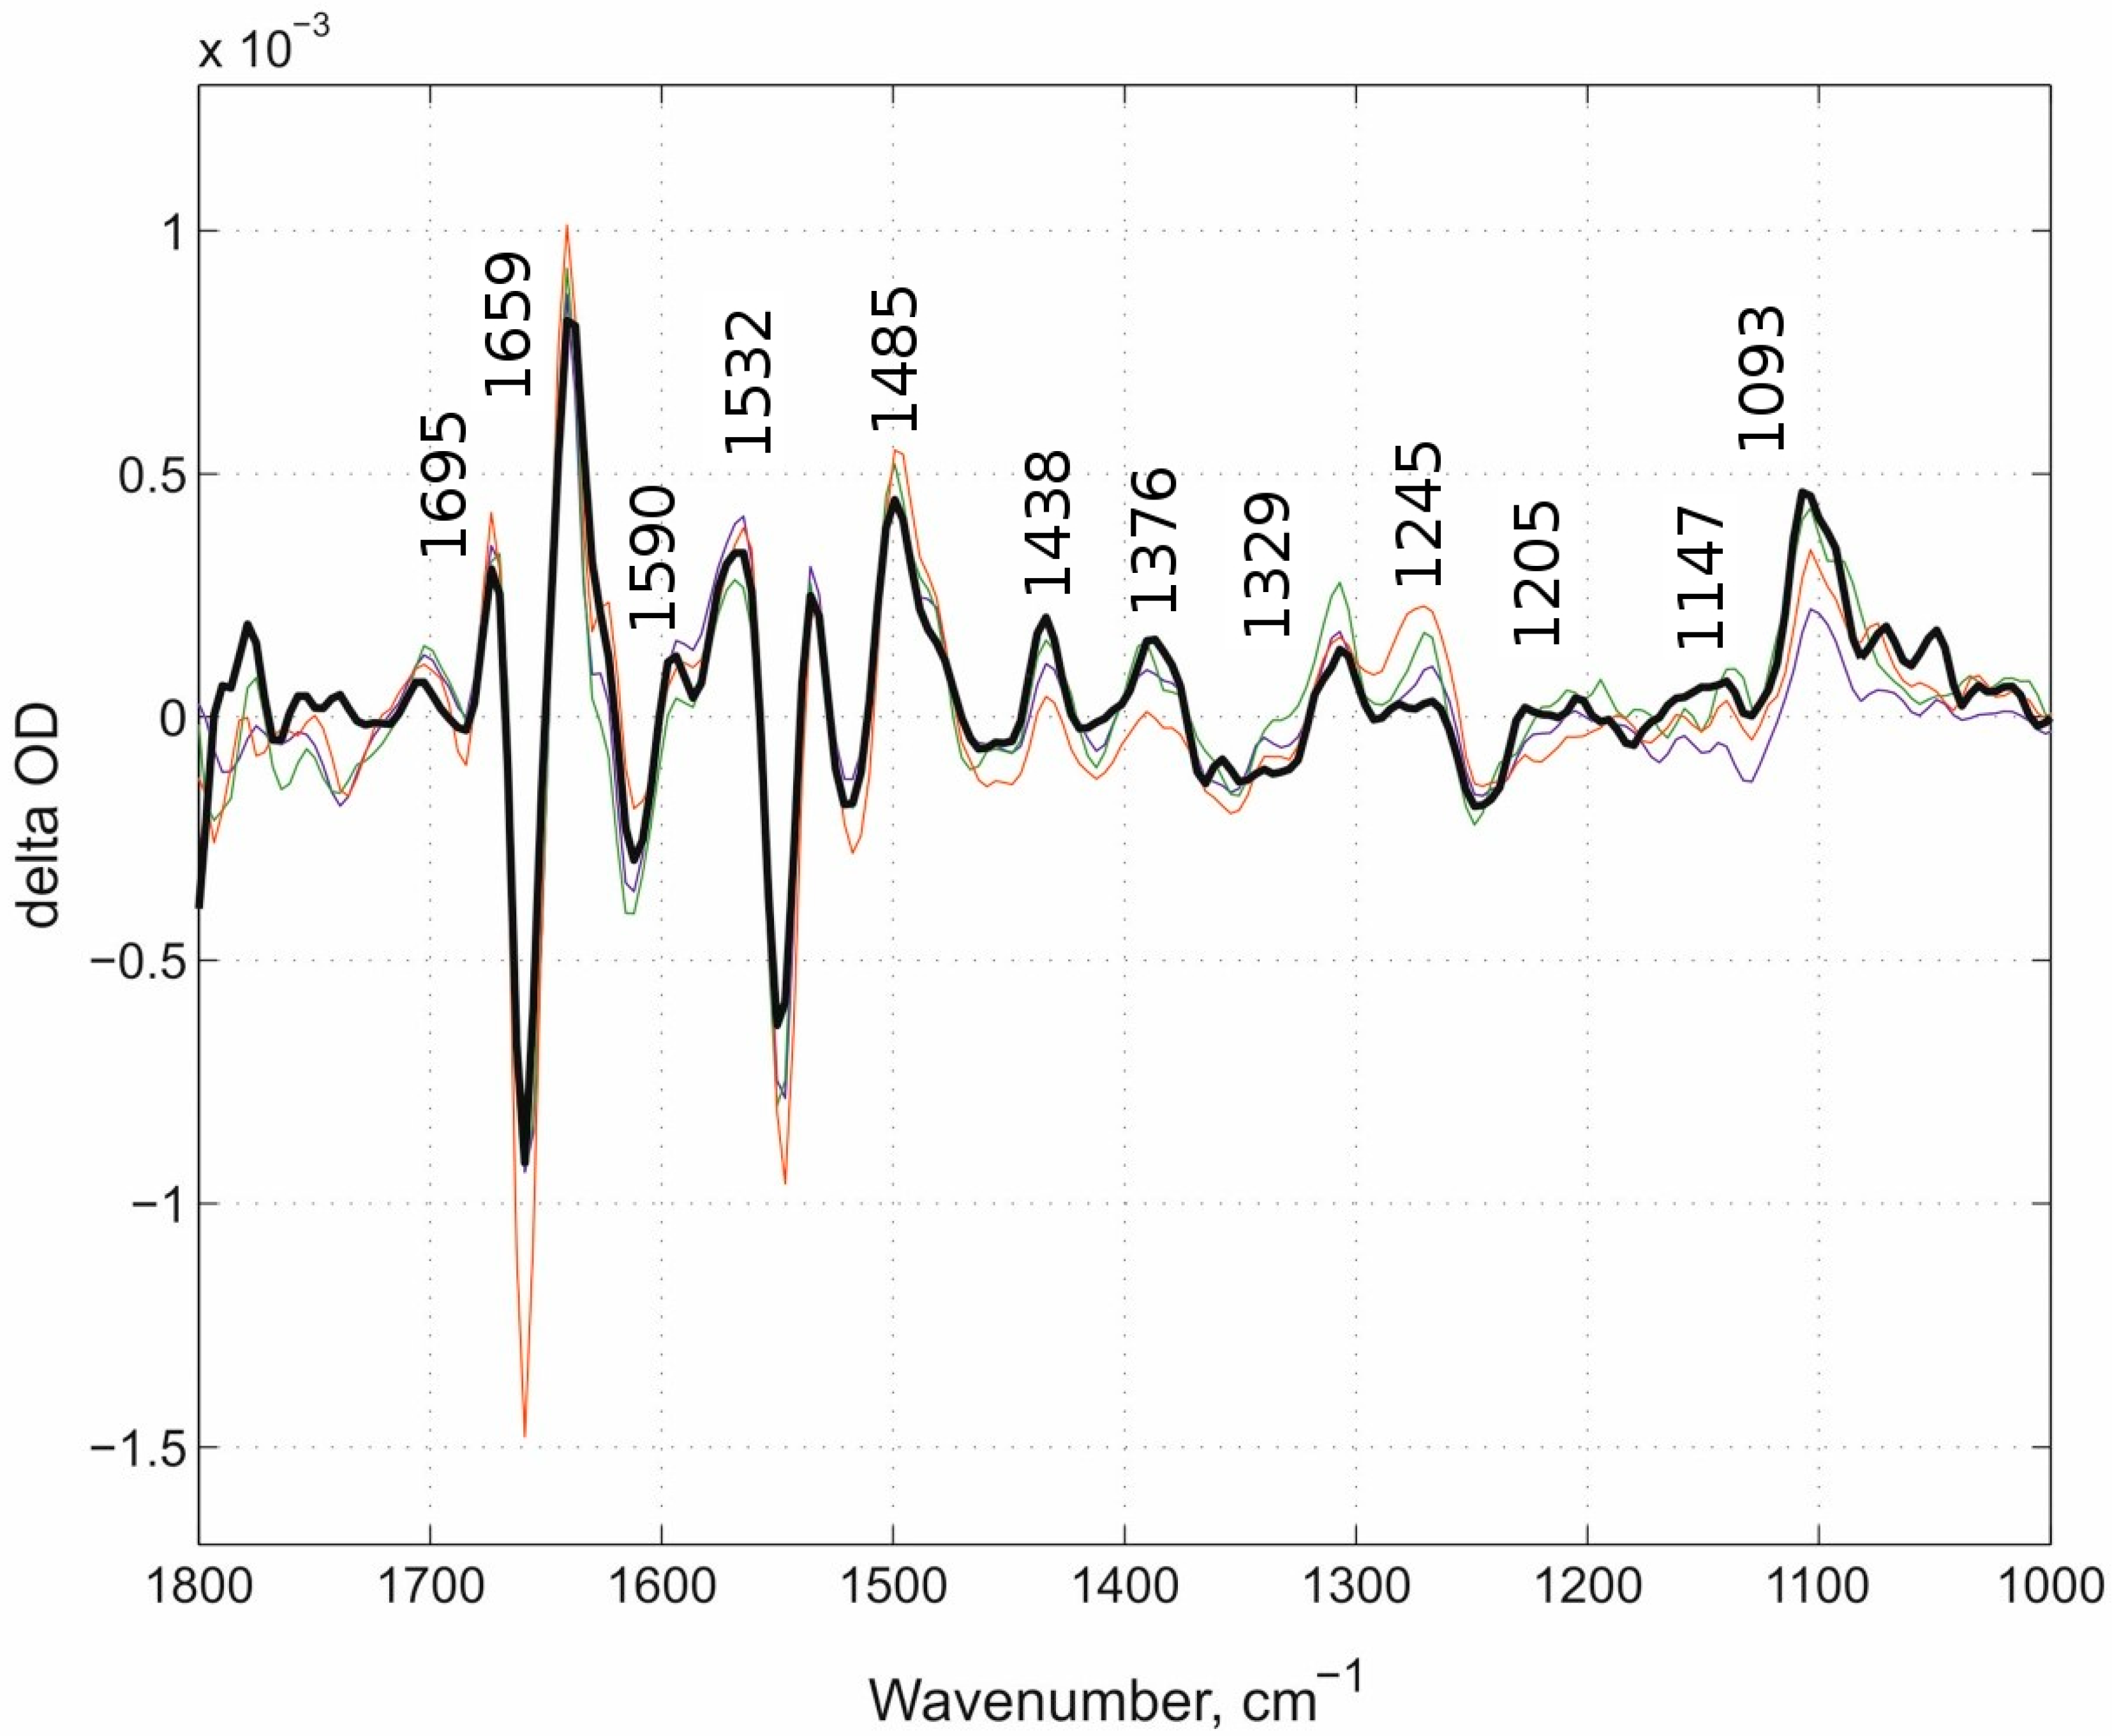
Figure 6.
The “fast” kinetic spectra of all three cases, N131V pH 9.0, N131V pH 6.5, and D124N pH 9.0, and of E278Q mutant protein at pH 6.5. The “fast” kinetic spectra of all three cases described above (thin lines of different color) together with the “fast” kinetic spectrum of the E278Q mutant (thick black line).

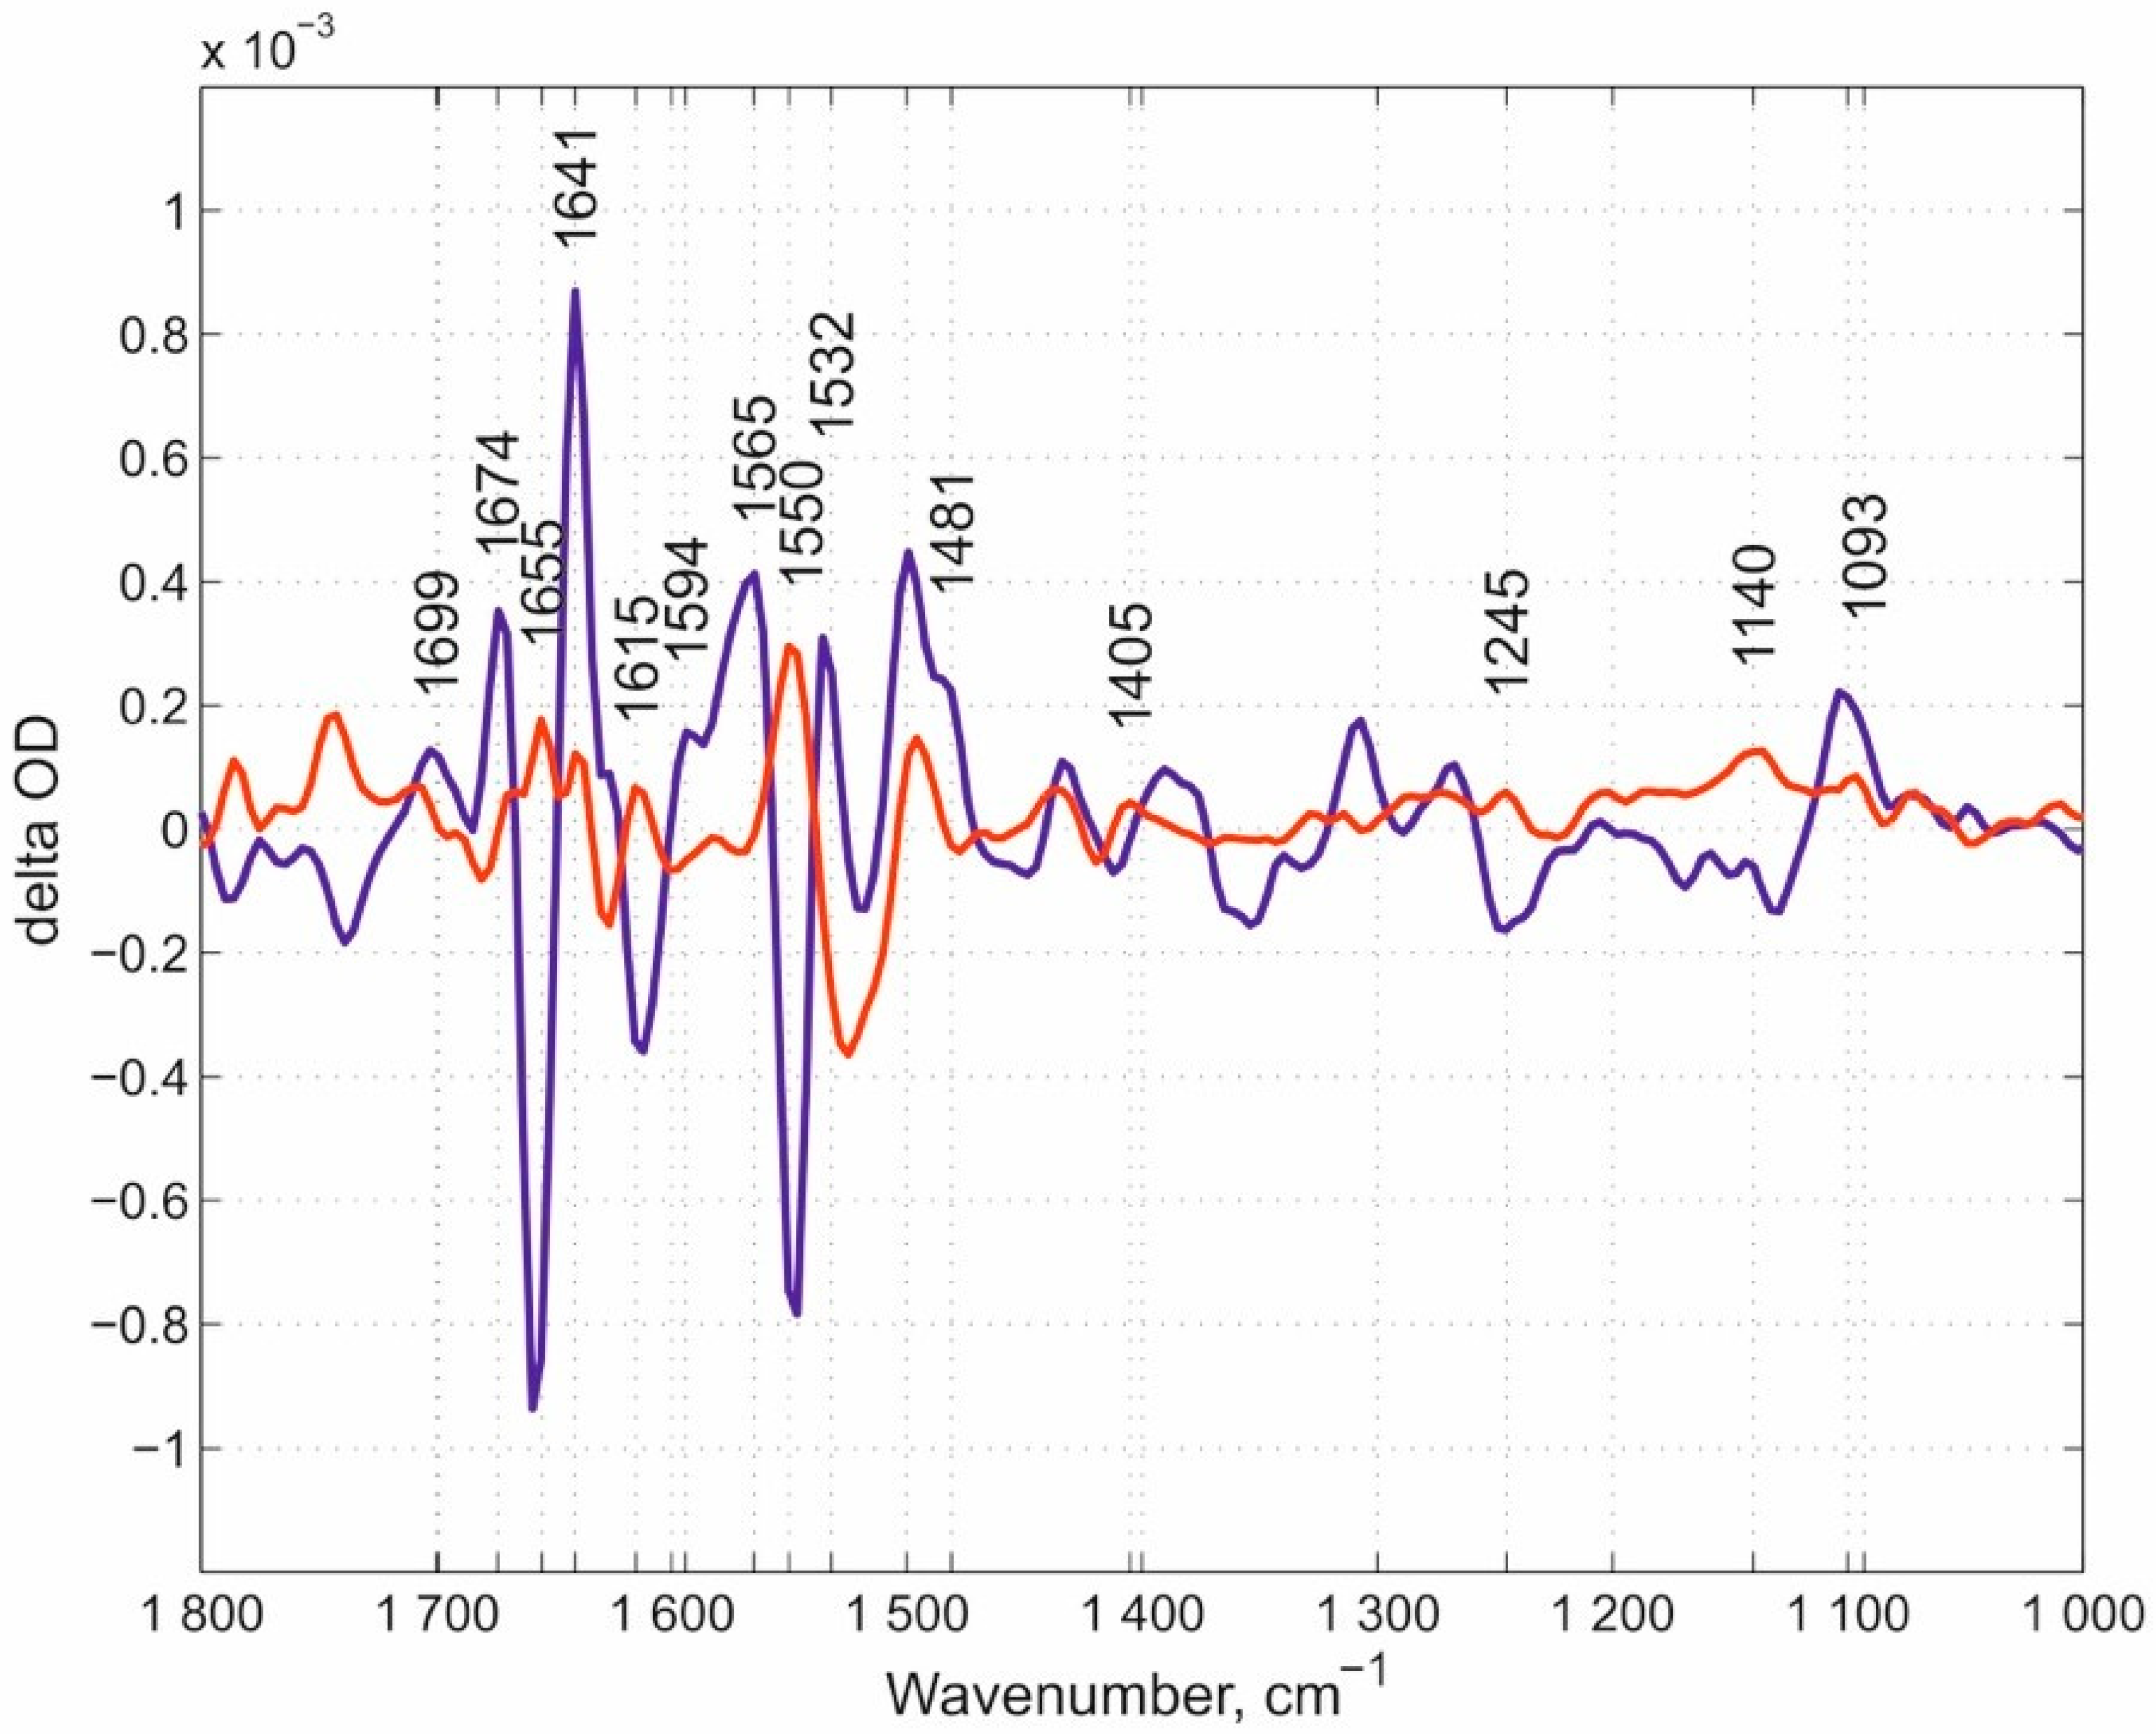
Figure 7.
The double-difference spectra between (1) D-blocking channel mutants and (2) E278Q. The difference bands between all three cases in (i) and (ii). The double-difference bands that are present in all (i) cases and absent in (ii) are labeled plus additionally labeled bands that are seen in the double difference spectra in all three cases. N131V pH 9.0-minus-E278Q pH 6.5 is shown in dark blue, N131V pH 6.5-minus-E278Q pH 6.5 in green, and D124N pH 9.0-minus-E278Q pH 6.5 in red. This figure should include a signature of PLS protonation-minus-deprotonation.


Table 1.
Summary of the assignments of the bands mentioned through the manuscript.
| Wavenumber, cm−1 | Assignment |
|---|---|
| 1965 | C≡O-heme a3 |
| 1712–1788 | Asp-399 |
| 1740 | Glu-278 |
| 1700 | A-Prp of heme a3 |
| 1666 | Arg residues |
| 1308 | Tyr-280 |
| 1247 | Tyr-35 |
| 1107 | His residues, second transition |
| 1096 | His residues, first transition |
| 1000–1800 | Water |
© 2020 by the authors. Licensee MDPI, Basel, Switzerland. This article is an open access article distributed under the terms and conditions of the Creative Commons Attribution (CC BY) license (http://creativecommons.org/licenses/by/4.0/).
Share and Cite
MDPI and ACS Style
Gorbikova, E.; Samsonov, S.A.; Kalendar, R. Probing the Proton-Loading Site of Cytochrome C Oxidase Using Time-Resolved Fourier Transform Infrared Spectroscopy. Molecules 2020, 25, 3393. https://doi.org/10.3390/molecules25153393
AMA Style
Gorbikova E, Samsonov SA, Kalendar R. Probing the Proton-Loading Site of Cytochrome C Oxidase Using Time-Resolved Fourier Transform Infrared Spectroscopy. Molecules. 2020; 25(15):3393. https://doi.org/10.3390/molecules25153393
Chicago/Turabian StyleGorbikova, Elena, Sergey A. Samsonov, and Ruslan Kalendar. 2020. "Probing the Proton-Loading Site of Cytochrome C Oxidase Using Time-Resolved Fourier Transform Infrared Spectroscopy" Molecules 25, no. 15: 3393. https://doi.org/10.3390/molecules25153393