A Non-Vector Approach to Increase Lipid Levels in the Microalga Planktochlorella nurekis

 , , , , and
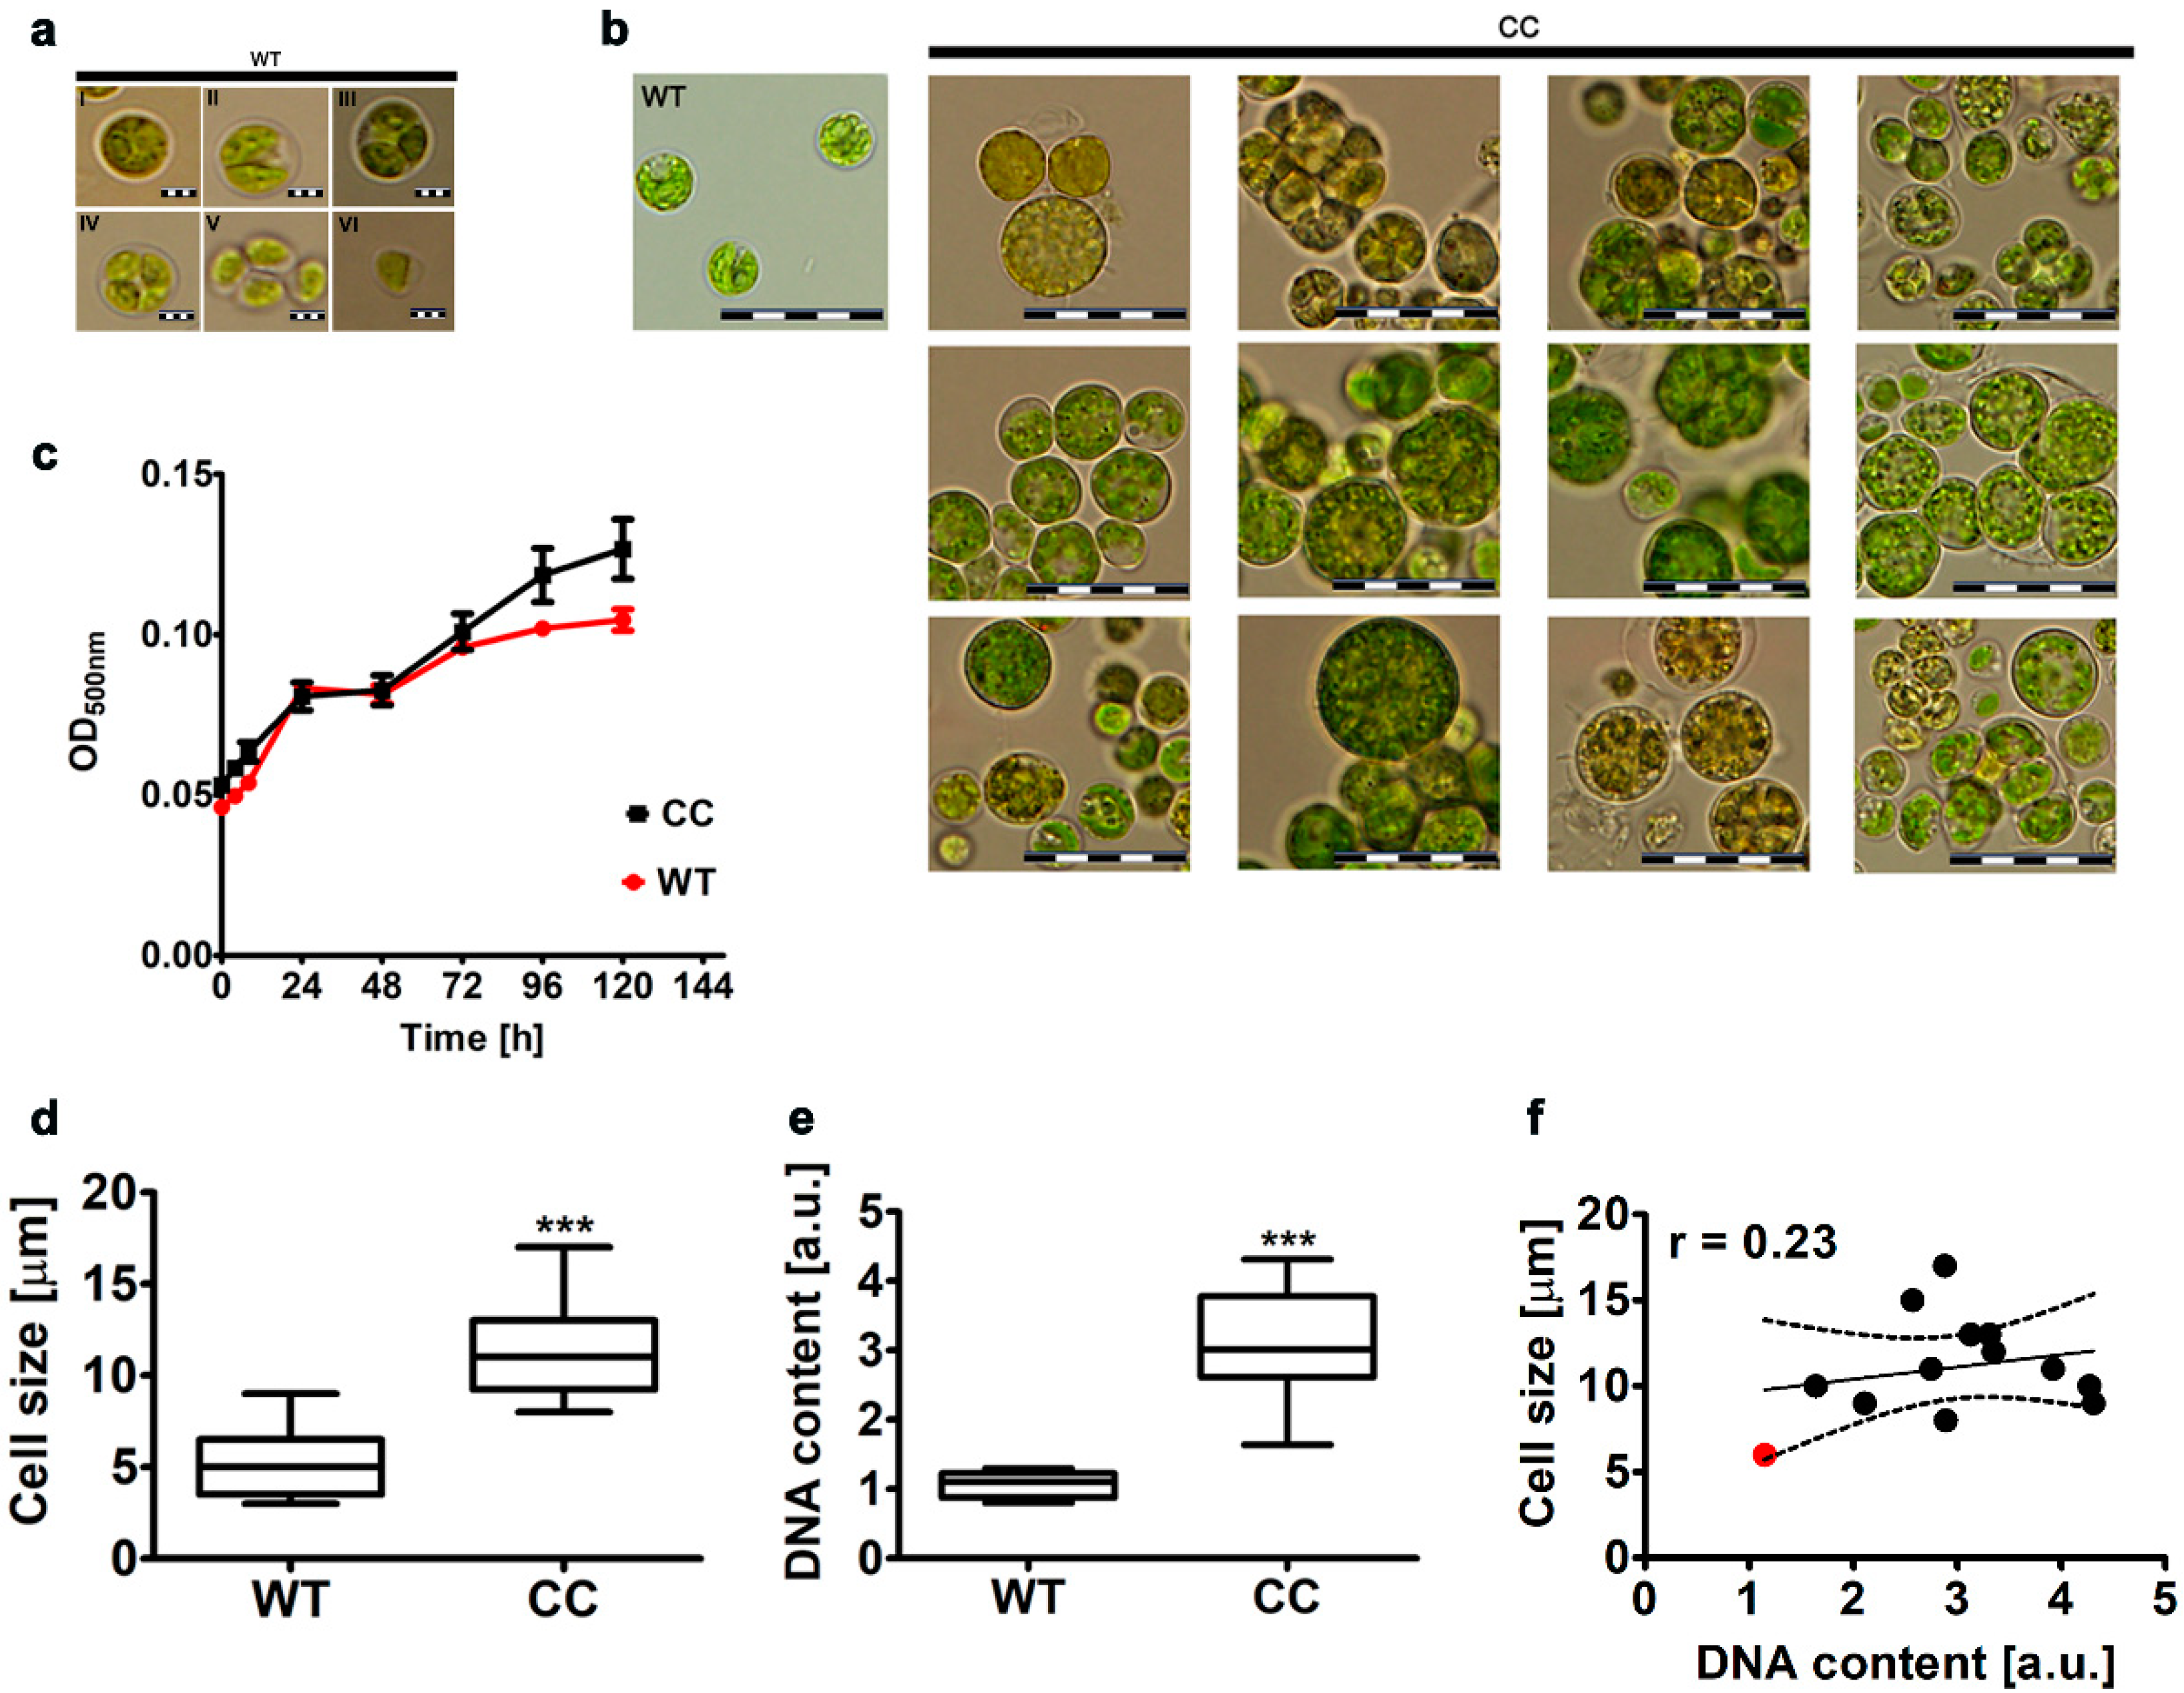
Abstract
:1. Introduction
2. Results and Discussion
2.1. The Effect of Co-Treatment with Colchicine and Cytochalasin B on Morphology, Cell Size and DNA Content of the Microalga Planktochlorella nurekis
2.2. Biochemical Analyses
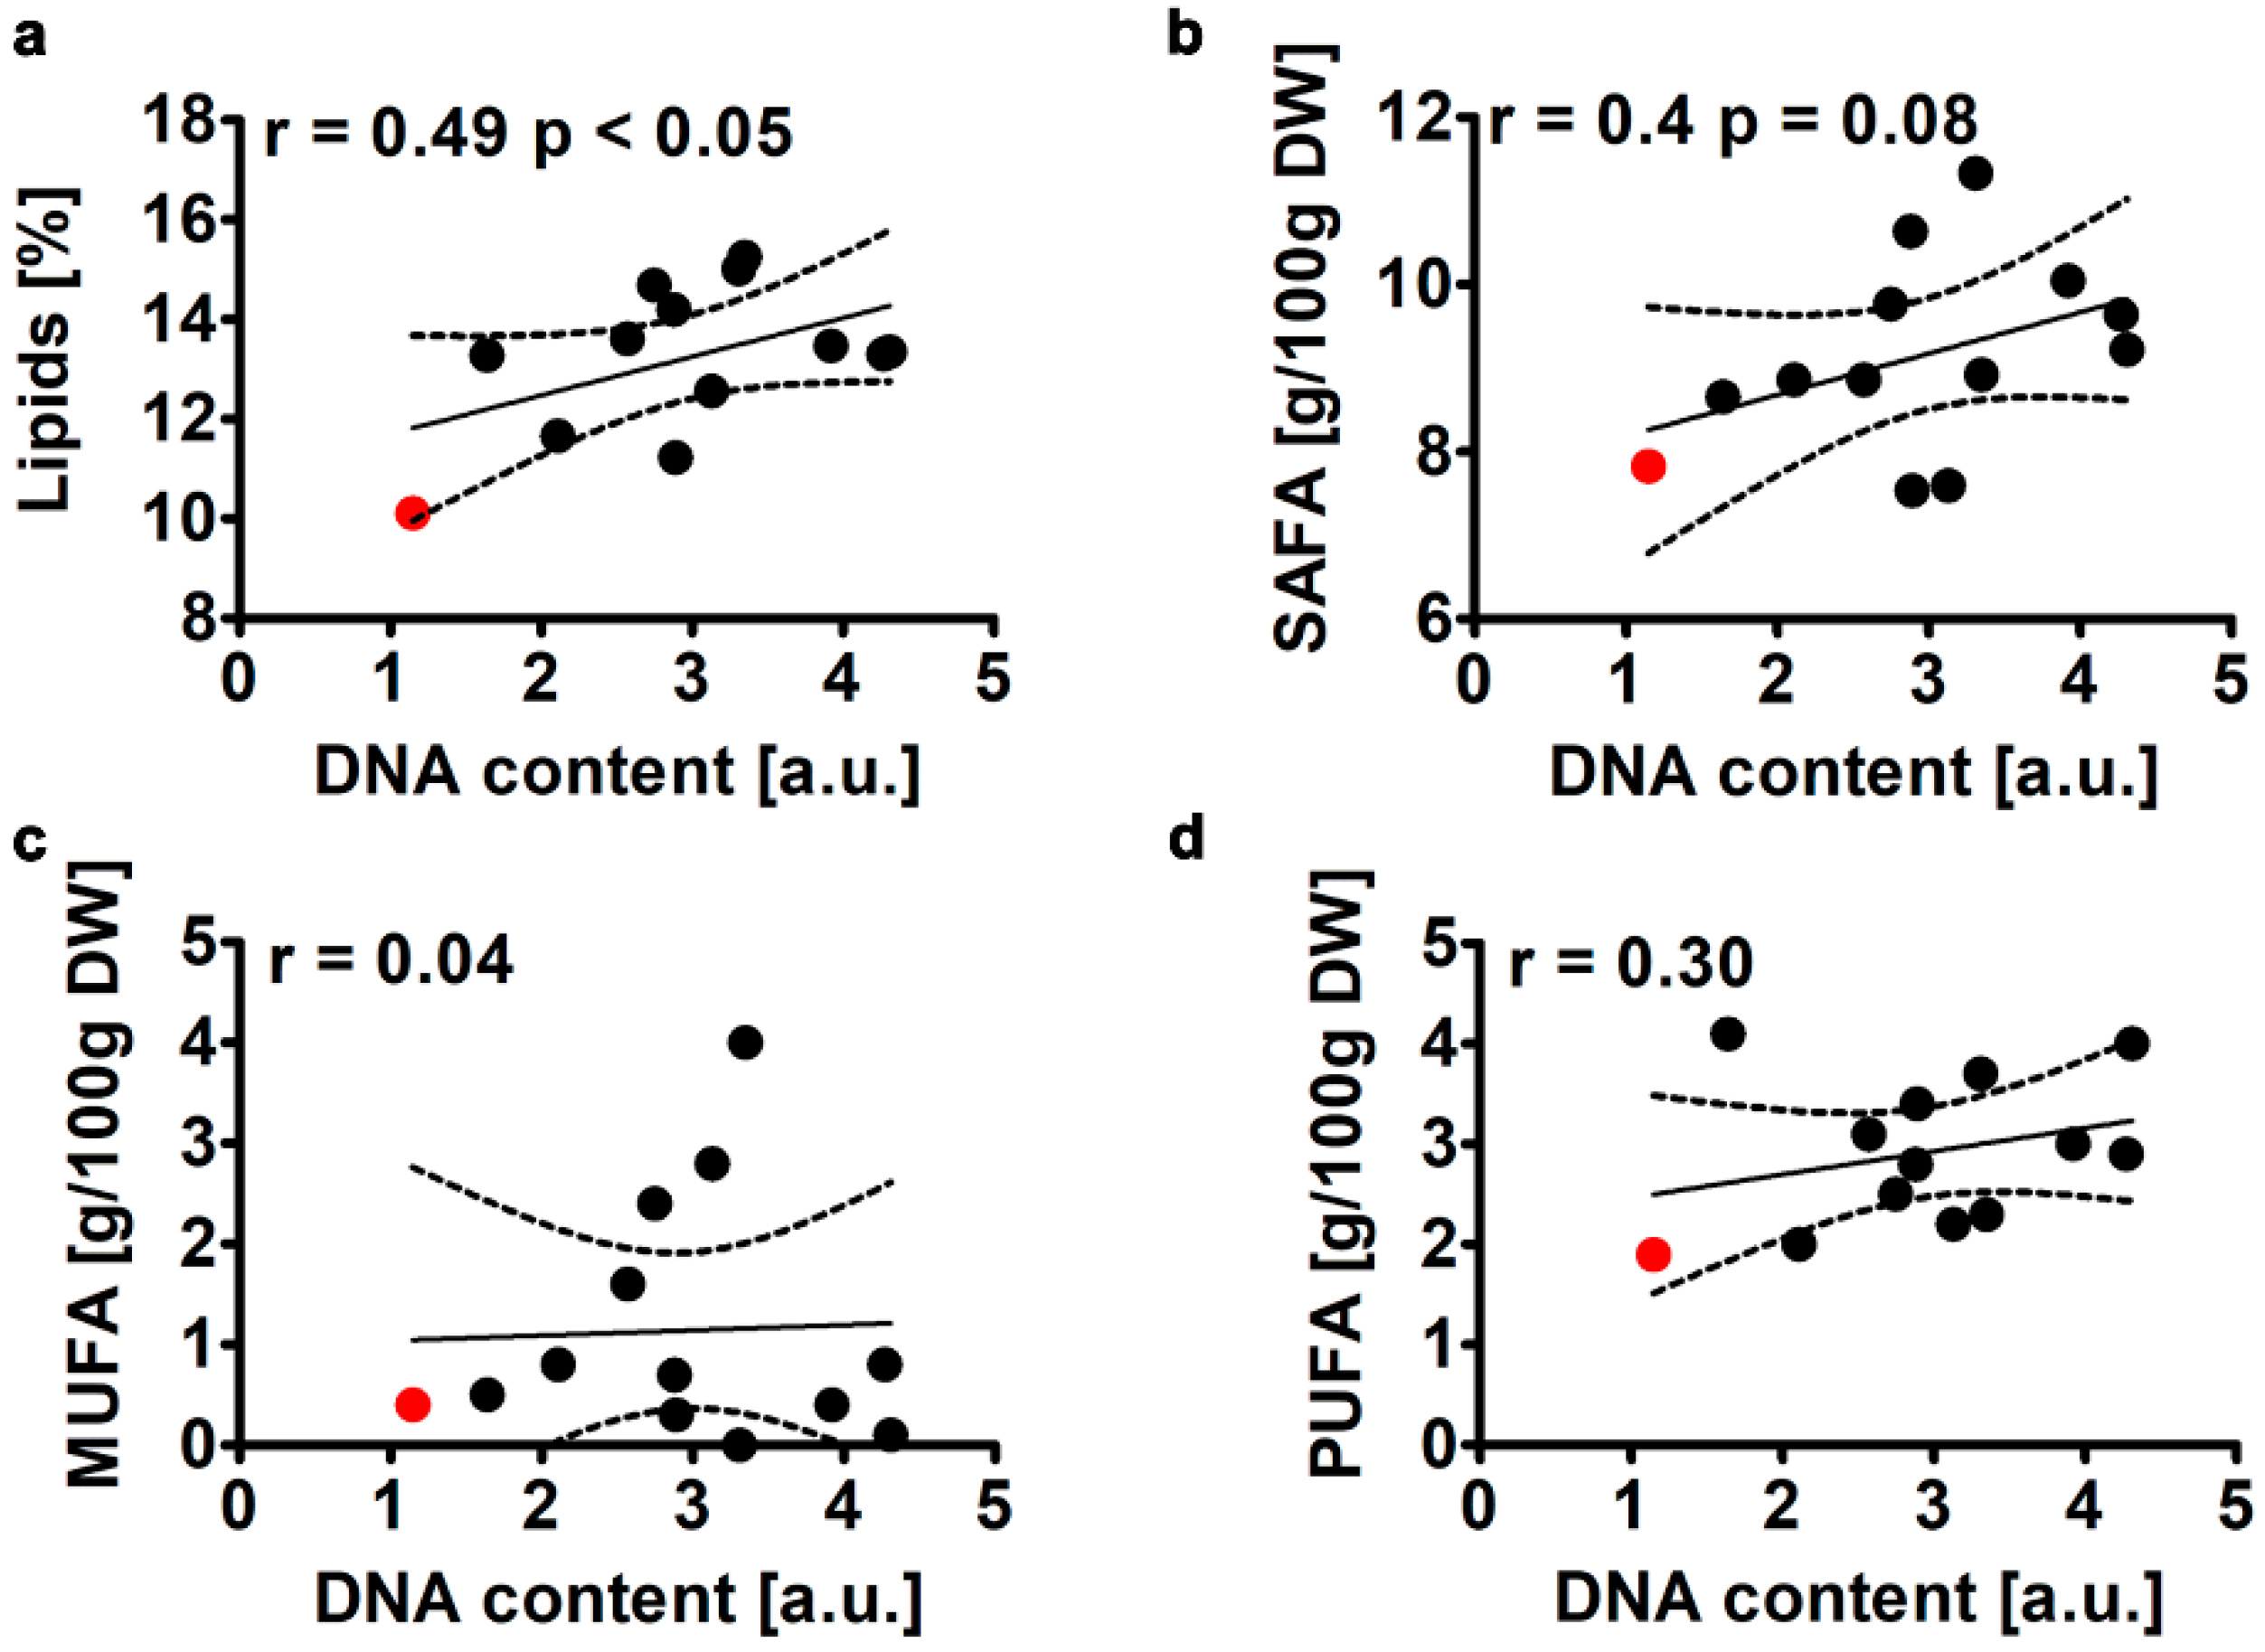
2.2.1. Total Lipid Content and Fatty Acid Profile
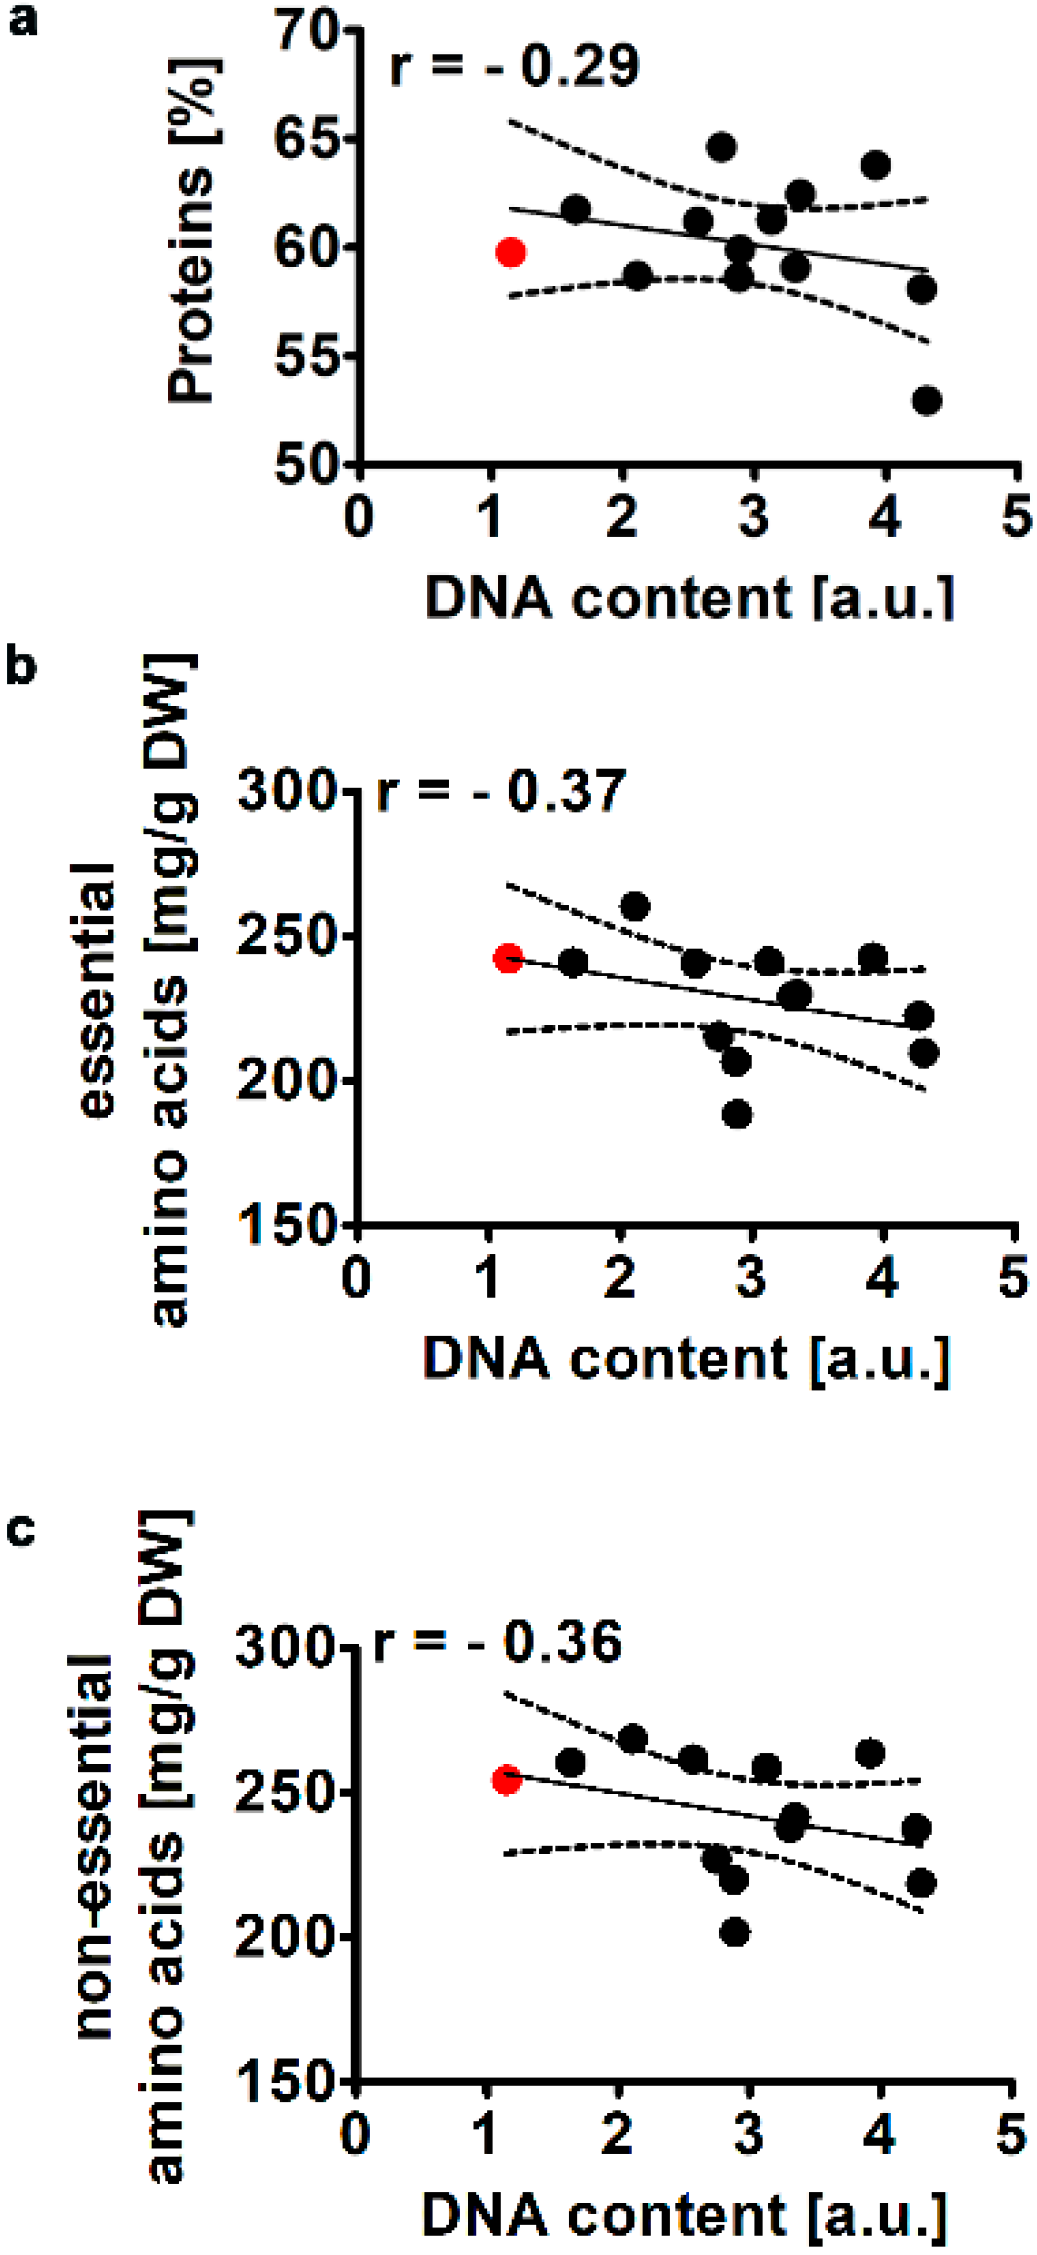
2.2.2. Total Protein Levels and Amino Acid Profile
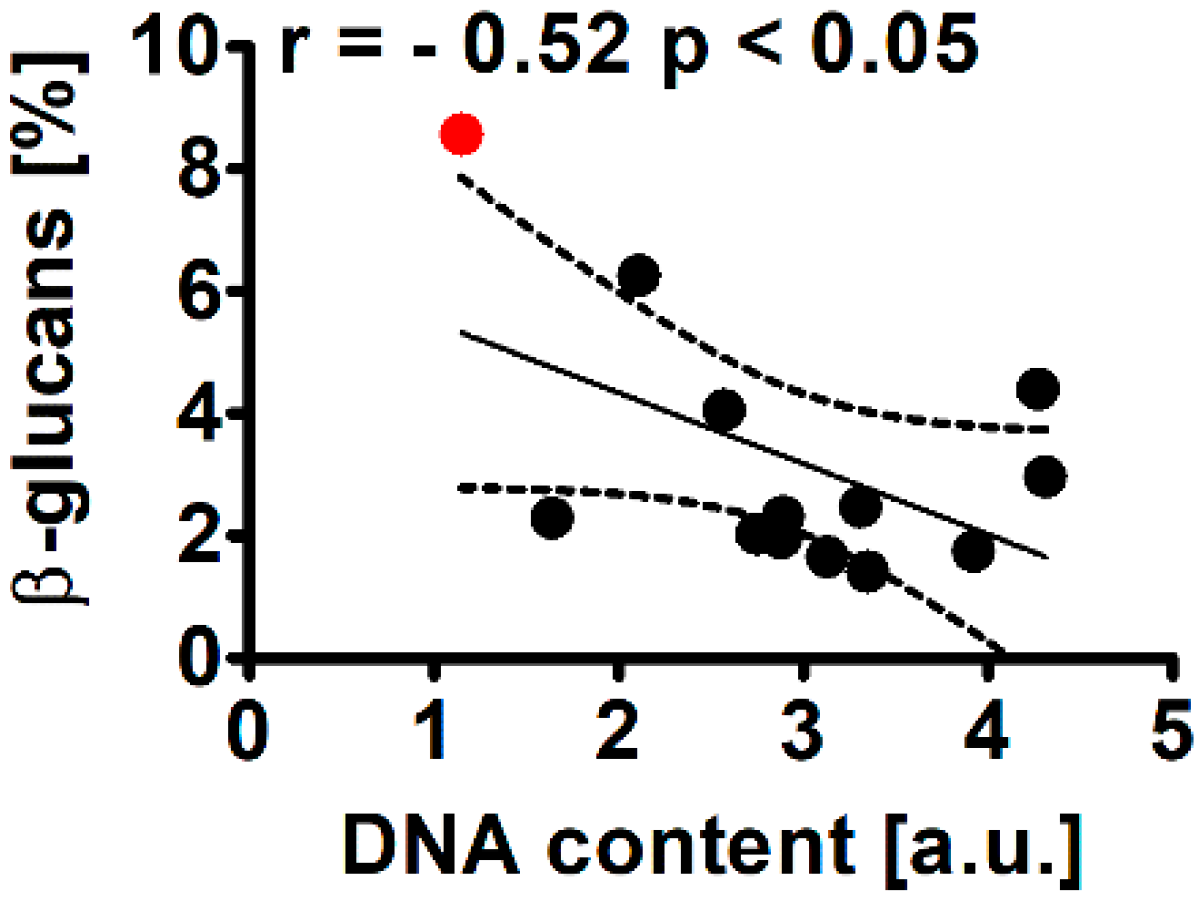
2.2.3. β-Glucans
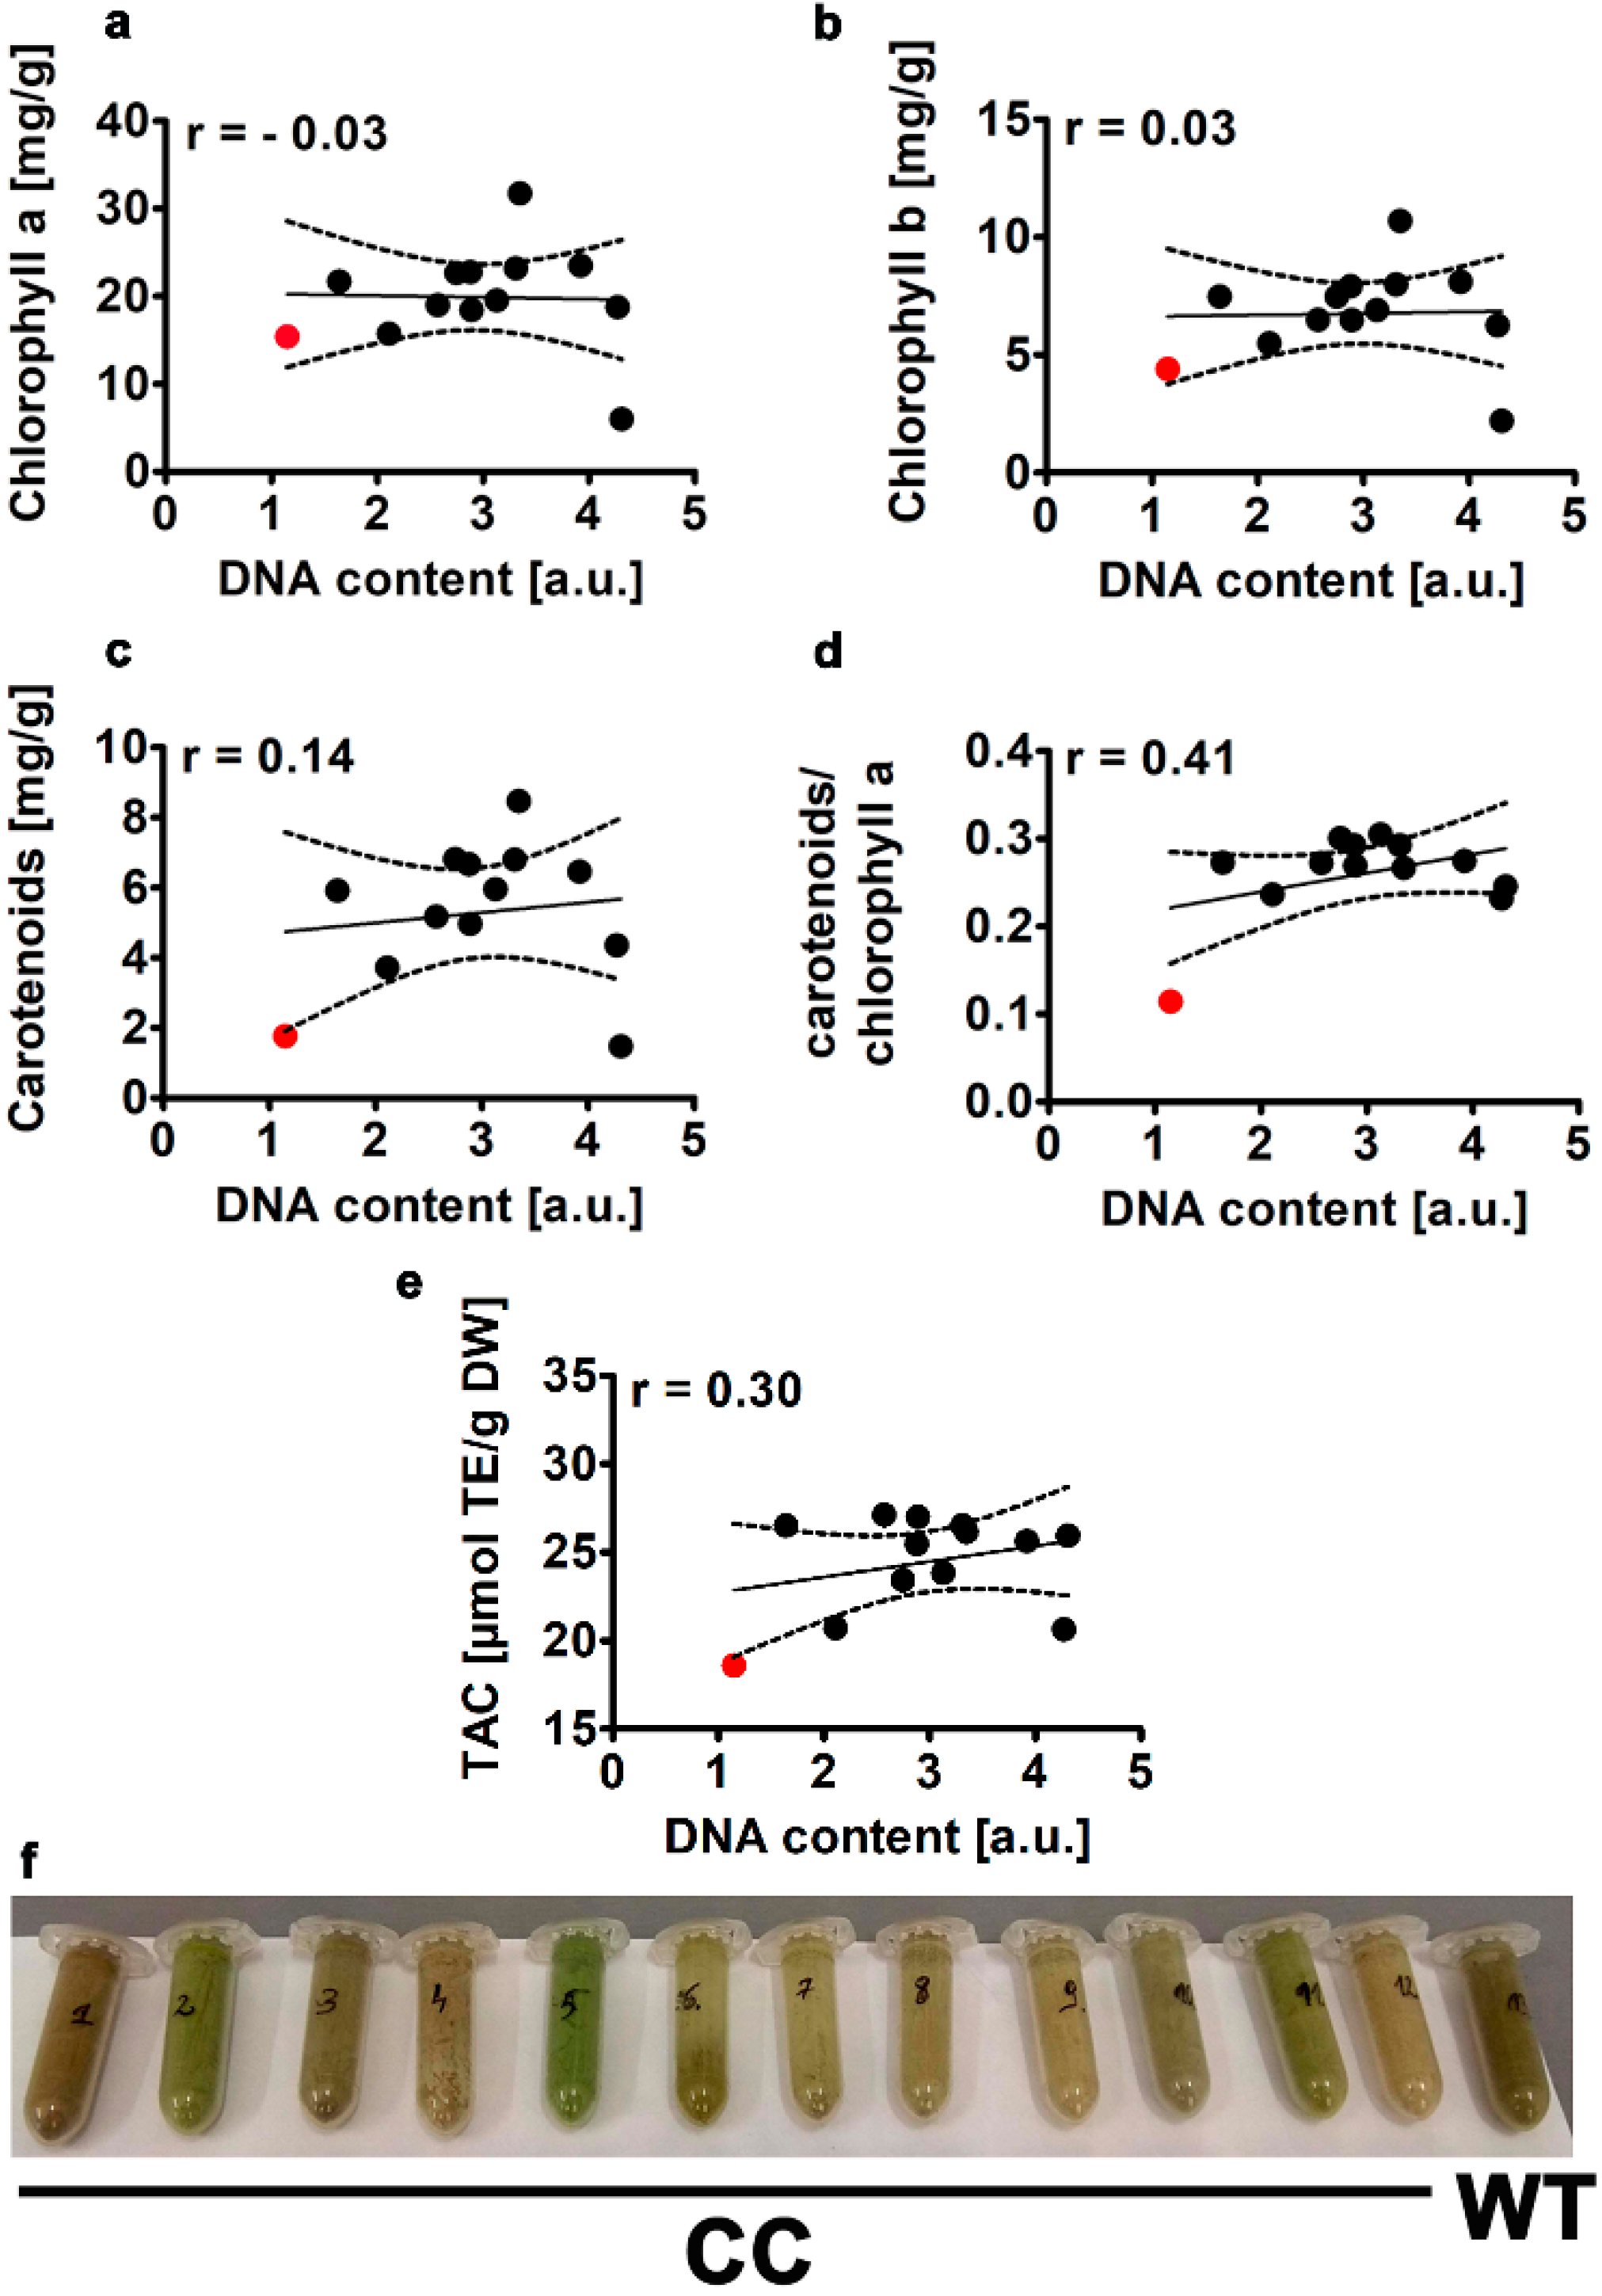
2.2.4. Pigments and Total Antioxidant Capacity
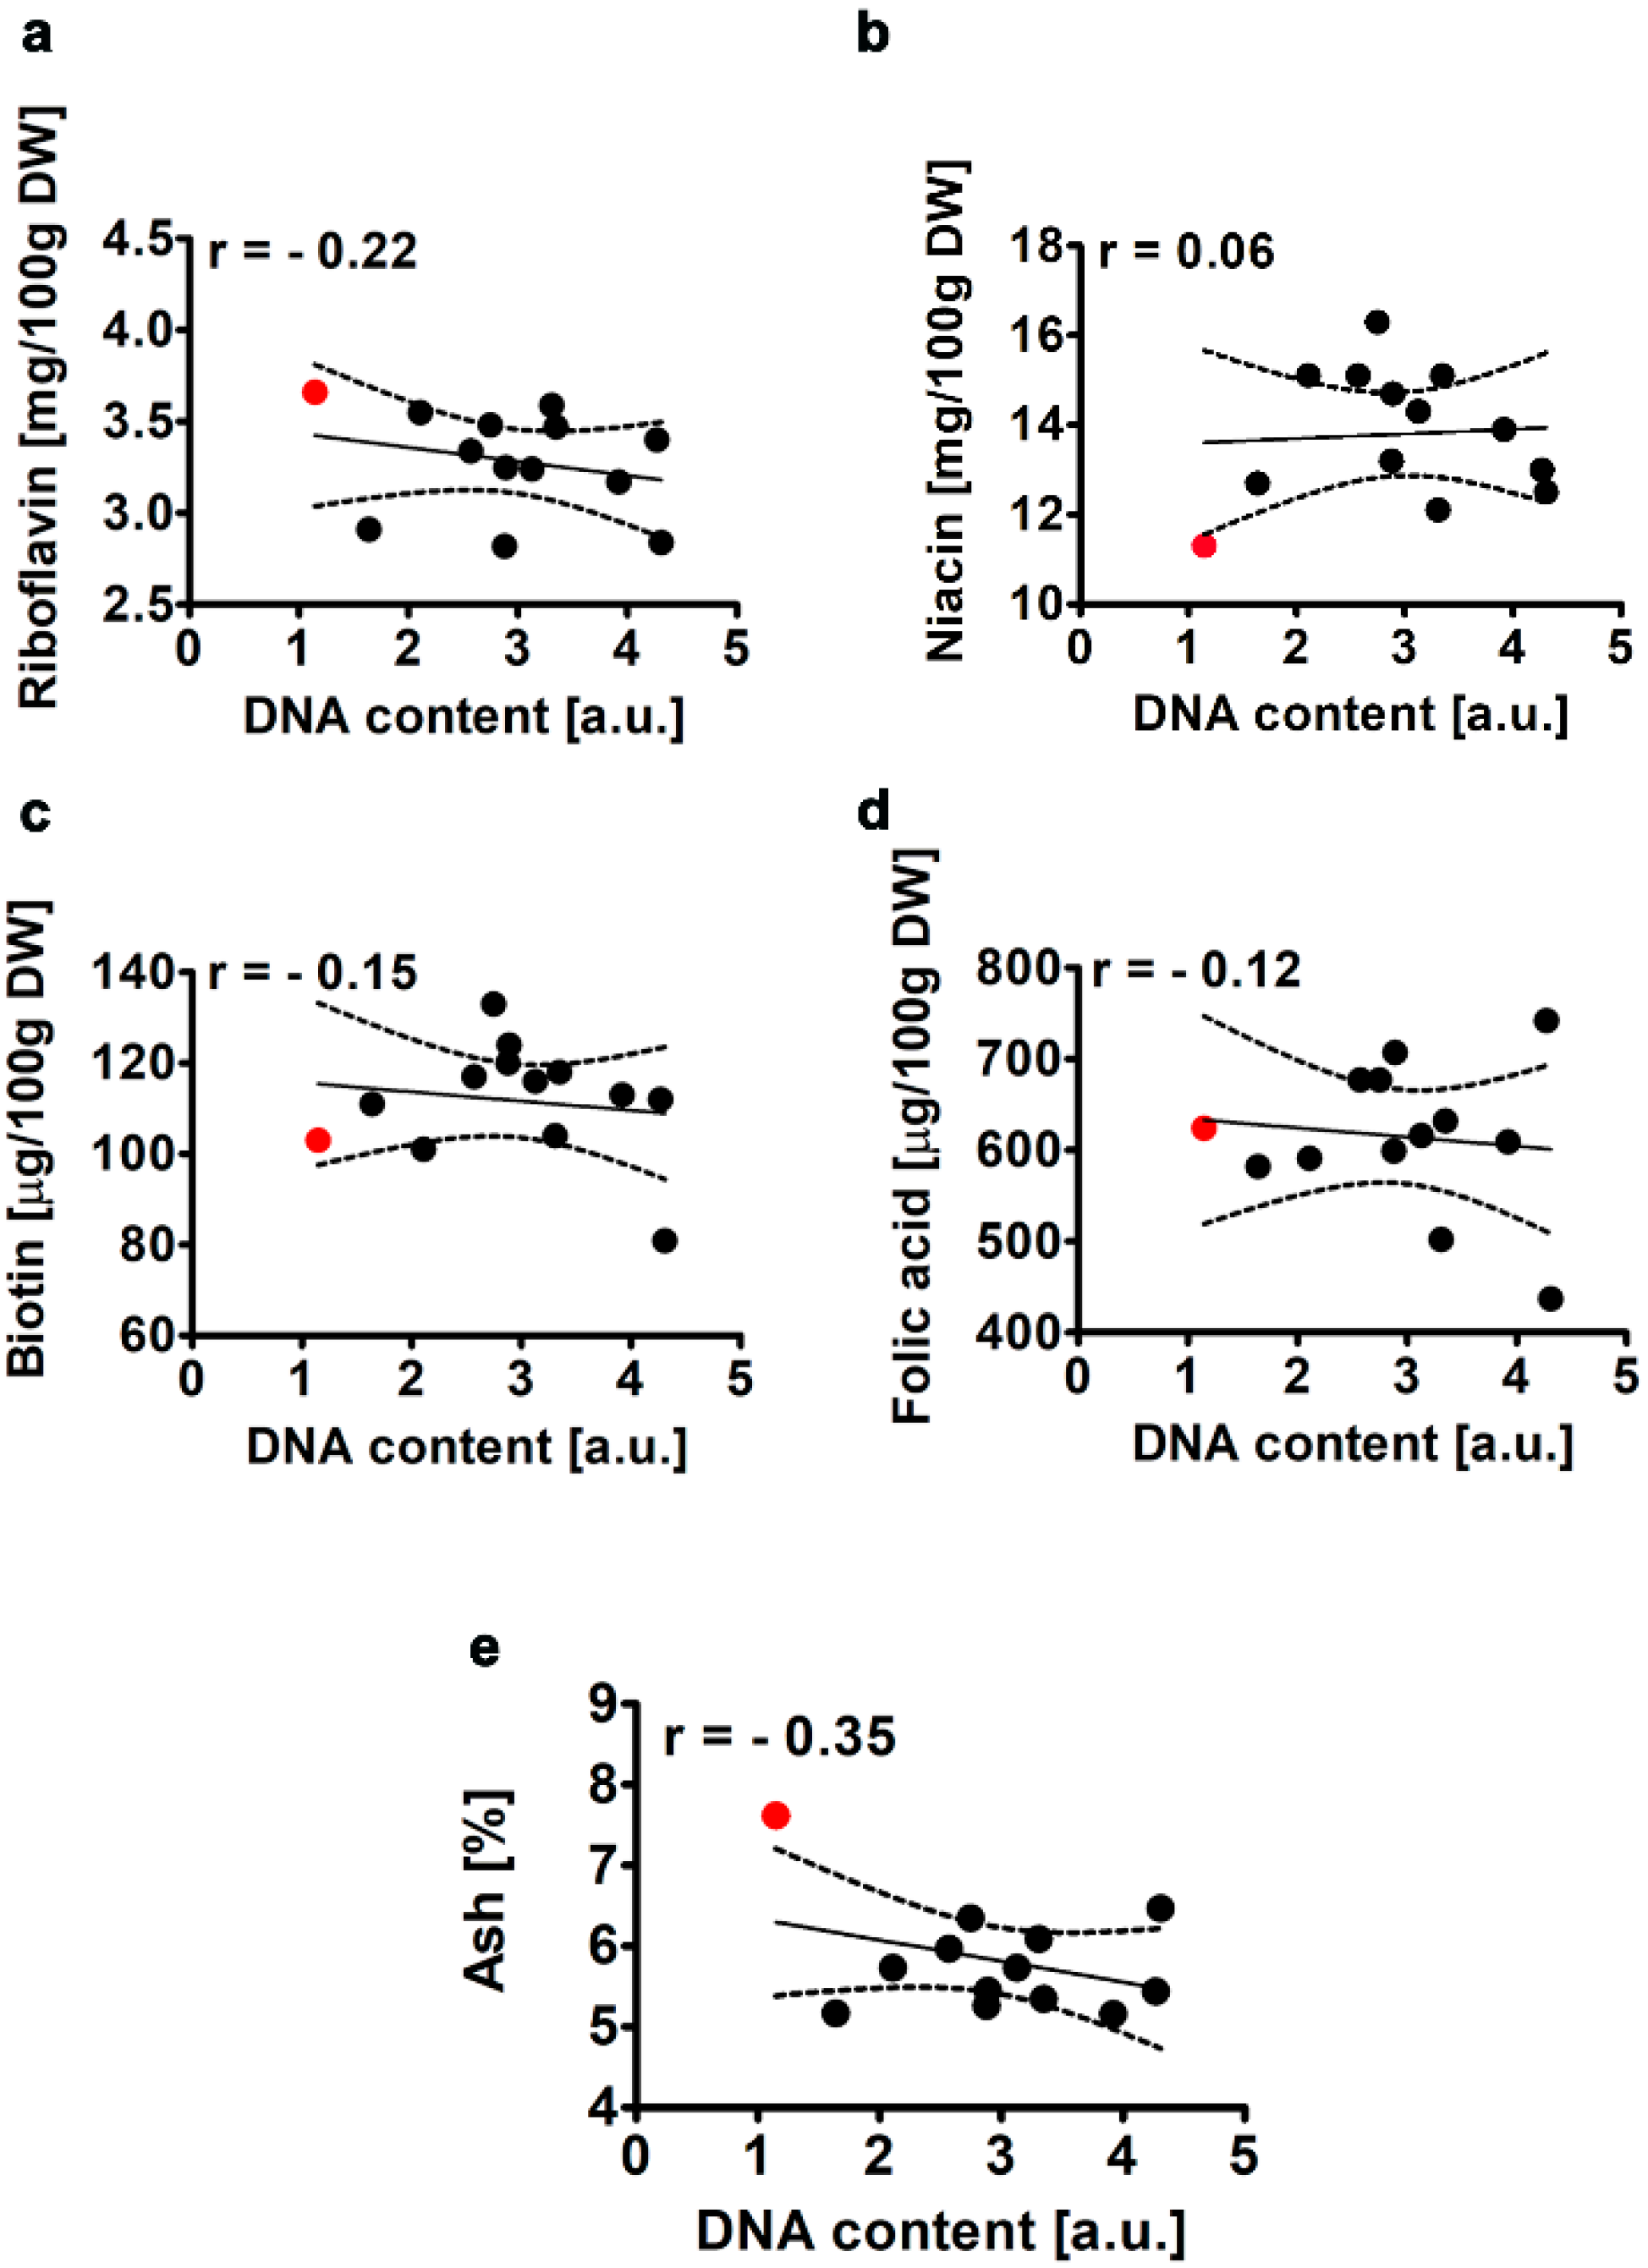
2.2.5. Selected B Vitamins and Ash Content
3. Materials and Methods
3.1. Species Identification and Culture Conditions
3.2. Co-Treatment with Colchicine and Cytochalasin B
3.3. Imaging Flow Cytometry-Based Analysis of Cell Size and Cell Aggregates
3.4. DNA Content Analysis
3.5. Biochemical Analyses
3.5.1. Protein Content and Amino Acid Profile
3.5.2. Total Lipid Content and Fatty Acid Profile
3.5.3. β-Glucan Levels
3.5.4. The Content of Chlorophylls and Carotenoids
3.5.5. Total Antioxidant Capacity (TAC)
3.5.6. The Content of B Vitamins
3.5.7. Ash Content
3.6. Statistical Analysis
4. Conclusions
Supplementary Materials
Author Contributions
Funding
Conflicts of Interest
References
- Mobin, S.; Alam, F. Some promising microalgal species for commercial applications: A review. Energy Procedia 2017, 110, 510–517. [Google Scholar] [CrossRef]
- Pulz, O.; Gross, W. Valuable products from biotechnology of microalgae. Appl. Microbiol. Biotechnol. 2004, 65, 635–648. [Google Scholar] [CrossRef] [PubMed]
- Spolaore, P.; Joannis-Cassan, C.; Duran, E.; Isambert, A. Commercial applications of microalgae. J. Biosci. Bioeng. 2006, 101, 87–96. [Google Scholar] [CrossRef] [PubMed] [Green Version]
- Liu, J.; Chen, F. Biology and industrial applications of Chlorella: Advances and prospects. Adv. Biochem. Eng. Biotechnol. 2016, 153, 1–35. [Google Scholar] [PubMed]
- Becker, E.W. Micro-algae as a source of protein. Biotechnol. Adv. 2007, 25, 207–210. [Google Scholar] [CrossRef] [PubMed]
- Garrido-Cardenas, J.A.; Manzano-Agugliaro, F.; Acien-Fernandez, F.G.; Molina-Grima, E. Microalgae research worldwide. Algal Res. 2018, 35, 50–60. [Google Scholar] [CrossRef]
- Valverde, F.; Romero-Campero, F.J.; Leon, R.; Guerrero, M.G.; Serrano, A. New challenges in microalgae biotechnology. Eur. J. Protistol. 2016, 55, 95–101. [Google Scholar] [CrossRef]
- Del Rio-Chanona, E.A.; Liu, J.; Wagner, J.L.; Zhang, D.; Meng, Y.; Xue, S.; Shah, N. Dynamic modeling of green algae cultivation in a photobioreactor for sustainable biodiesel production. Biotechnol. Bioeng. 2018, 115, 359–370. [Google Scholar] [CrossRef] [Green Version]
- D’Alessandro, E.B.; Antoniosi Filho, N.R. Concepts and studies on lipid and pigments of microalgae: A review. Renew. Sustain. Energy Rev. 2016, 58, 832–841. [Google Scholar] [CrossRef]
- Chen, B.; Wan, C.; Mehmood, M.A.; Chang, J.S.; Bai, F.; Zhao, X. Manipulating environmental stresses and stress tolerance of microalgae for enhanced production of lipids and value-added products—A review. Bioresour. Technol. 2017, 244, 1198–1206. [Google Scholar] [CrossRef]
- Courchesne, N.M.; Parisien, A.; Wang, B.; Lan, C.Q. Enhancement of lipid production using biochemical, genetic and transcription factor engineering approaches. J. Biotechnol. 2009, 141, 31–41. [Google Scholar] [CrossRef] [PubMed]
- Rosenberg, J.N.; Oyler, G.A.; Wilkinson, L.; Betenbaugh, M.J. A green light for engineered algae: Redirecting metabolism to fuel a biotechnology revolution. Curr. Opin. Biotechnol. 2008, 19, 430–436. [Google Scholar] [CrossRef] [PubMed]
- Fu, W.; Chaiboonchoe, A.; Khraiwesh, B.; Nelson, D.R.; Al-Khairy, D.; Mystikou, A.; Alzahmi, A.; Salehi-Ashtiani, K. Algal cell factories: Approaches, applications, and potentials. Mar. Drugs 2016, 14, 225. [Google Scholar] [CrossRef] [PubMed] [Green Version]
- Geider, R.J.; La Roche, J. Redfield revisited: Variability of C:N:P in marine microalgae and its biochemical basis. Eur. J. Phycol. 2002, 37, 1–17. [Google Scholar] [CrossRef] [Green Version]
- Li, X.; Pribyl, P.; Bisova, K.; Kawano, S.; Cepak, V.; Zachleder, V.; Cizkova, M.; Branyikova, I.; Vitova, M. The microalga Parachlorella kessleri—A novel highly efficient lipid producer. Biotechnol. Bioeng. 2013, 110, 97–107. [Google Scholar] [CrossRef]
- Converti, A.; Casazza, A.A.; Ortiz, E.Y.; Perego, P.; Del Borghi, M. Effect of temperature and nitrogen concentration on the growth and lipid content of Nannochloropsis oculata and Chlorella vulgaris for biodiesel production. Chem. Eng. Process. Process Intensif. 2009, 48, 1146–1151. [Google Scholar] [CrossRef]
- Henley, W.J.; Litaker, R.W.; Novoveská, L.; Duke, C.S.; Quemada, H.D.; Sayre, R.T. Initial risk assessment of genetically modified (gm) microalgae for commodity-scale biofuel cultivation. Algal Res. 2013, 2, 66–77. [Google Scholar] [CrossRef]
- Beacham, T.A.; Sweet, J.B.; Allen, M.J. Large scale cultivation of genetically modified microalgae: A new era for environmental risk assessment. Algal Res. 2017, 25, 90–100. [Google Scholar] [CrossRef]
- Škaloud, P.; Němcová, Y.; Pytela, J.; Bogdanov, N.I.; Bock, C.; Pickinpaugh, S.H. Planktochlorella nurekis gen. Et sp. Nov. (Trebouxiophyceae, Chlorophyta), a novel coccoid green alga carrying significant biotechnological potential. Fottea Olomouc 2014, 14, 53–62. [Google Scholar] [CrossRef] [Green Version]
- Harbard, J.L.; Griffin, A.R.; Foster, S.; Brooker, C.; Kha, L.D.; Koutoulis, A. Production of colchicine-induced autotetraploids as a basis for sterility breeding in Acacia mangium willd. Forestry 2012, 85, 427–436. [Google Scholar] [CrossRef] [Green Version]
- Wetherell, D.F.; Krauss, R.W. Colchicine-induced polyploidy in Chlamydomonas. Science 1956, 124, 25–26. [Google Scholar] [CrossRef] [PubMed]
- Mahardika, A.; Mukti, A.T.; Arief, M. The effect of colchicine on the size and bioactive compound of microalgae Spirulina platensis. In IOP Conference Series: Earth and Environmental Science; IOP: London, UK, 2018; Volume 137, p. 012011. [Google Scholar]
- Soltani Nezhada, F.; Mansouri, H. Induction of polyploidy by colchicine on the green algae Dunaliella salina. Russ. J. Mar. Biol. 2019, 45, 106–112. [Google Scholar] [CrossRef]
- Chisti, Y. Biodiesel from microalgae. Biotechnol. Adv. 2007, 25, 294–306. [Google Scholar] [CrossRef] [PubMed]
- Rodolfi, L.; Chini Zittelli, G.; Bassi, N.; Padovani, G.; Biondi, N.; Bonini, G.; Tredici, M.R. Microalgae for oil: Strain selection, induction of lipid synthesis and outdoor mass cultivation in a low-cost photobioreactor. Biotechnol. Bioeng. 2009, 102, 100–112. [Google Scholar] [CrossRef]
- Tossavainen, M.; Ilyass, U.; Ollilainen, V.; Valkonen, K.; Ojala, A.; Romantschuk, M. Influence of long term nitrogen limitation on lipid, protein and pigment production of Euglena gracilis in photoheterotrophic cultures. PeerJ 2019, 7, e6624. [Google Scholar] [CrossRef]
- Ajjawi, I.; Verruto, J.; Aqui, M.; Soriaga, L.B.; Coppersmith, J.; Kwok, K.; Peach, L.; Orchard, E.; Kalb, R.; Xu, W.; et al. Lipid production in Nannochloropsis gaditana is doubled by decreasing expression of a single transcriptional regulator. Nat. Biotechnol. 2017, 35, 647–652. [Google Scholar] [CrossRef]
- Trentacoste, E.M.; Shrestha, R.P.; Smith, S.R.; Gle, C.; Hartmann, A.C.; Hildebrand, M.; Gerwick, W.H. Metabolic engineering of lipid catabolism increases microalgal lipid accumulation without compromising growth. Proc. Natl. Acad. Sci. USA 2013, 110, 19748–19753. [Google Scholar] [CrossRef] [Green Version]
- Kwak, M.; Park, W.K.; Shin, S.E.; Koh, H.G.; Lee, B.; Jeong, B.R.; Chang, Y.K. Improvement of biomass and lipid yield under stress conditions by using diploid strains of Chlamydomonas reinhardtii. Algal Res. 2017, 26, 180–189. [Google Scholar] [CrossRef]
- Bobadilla, F.; Rodriguez-Tirado, C.; Imarai, M.; Galotto, M.J.; Andersson, R. Soluble beta-1,3/1,6-glucan in seaweed from the southern hemisphere and its immunomodulatory effect. Carbohydr. Polym. 2013, 92, 241–248. [Google Scholar] [CrossRef]
- Sadovskaya, I.; Souissi, A.; Souissi, S.; Grard, T.; Lencel, P.; Greene, C.M.; Duin, S.; Dmitrenok, P.S.; Chizhov, A.O.; Shashkov, A.S.; et al. Chemical structure and biological activity of a highly branched (1 → 3,1 → 6)-beta-d-glucan from Isochrysis galbana. Carbohydr. Polym. 2014, 111, 139–148. [Google Scholar] [CrossRef]
- Schulze, C.; Wetzel, M.; Reinhardt, J.; Schmidt, M.; Felten, L.; Mundt, S. Screening of microalgae for primary metabolites including β-glucans and the influence of nitrate starvation and irradiance on β-glucan production. J. Appl. Phycol. 2016, 28, 2719–2725. [Google Scholar] [CrossRef]
- Barkia, I.; Saari, N.; Manning, S.R. Microalgae for high-value products towards human health and nutrition. Mar. Drugs 2019, 17, 304. [Google Scholar] [CrossRef] [PubMed] [Green Version]
- Da Silva Ferreira, V.; Sant’Anna, C. Impact of culture conditions on the chlorophyll content of microalgae for biotechnological applications. World J. Microbiol. Biotechnol. 2017, 33, 20. [Google Scholar] [CrossRef]
- Goiris, K.; Muylaert, K.; Fraeye, I.; Foubert, I.; De Brabanter, J.; De Cooman, L. Antioxidant potential of microalgae in relation to their phenolic and carotenoid content. J. Appl. Phycol. 2012, 102, 771–776. [Google Scholar] [CrossRef]
- Zhang, P.; Li, Z.; Lu, L.; Xiao, Y.; Liu, J.; Guo, J.; Fang, F. Effects of stepwise nitrogen depletion on carotenoid content, fluorescence parameters and the cellular stoichiometry of Chlorella vulgaris. Spectrochim. Acta A Mol. Biomol. Spectrosc. 2017, 181, 30–38. [Google Scholar] [CrossRef] [PubMed]
- Rauytanapanit, M.; Janchot, K.; Kusolkumbot, P.; Sirisattha, S.; Waditee-Sirisattha, R.; Praneenararat, T. Nutrient deprivation-associated changes in green microalga Coelastrum sp. Tistr 9501re enhanced potent antioxidant carotenoids. Mar. Drugs 2019, 17, 328. [Google Scholar] [CrossRef] [PubMed] [Green Version]
- Lamers, P.P.; Janssen, M.; De Vos, R.C.; Bino, R.J.; Wijffels, R.H. Carotenoid and fatty acid metabolism in nitrogen-starved Dunaliella salina, a unicellular green microalga. J. Biotechnol. 2012, 162, 21–27. [Google Scholar] [CrossRef]
- Rodriguez-Garcia, I.; Guil-Guerrero, J.L. Evaluation of the antioxidant activity of three microalgal species for use as dietary supplements and in the preservation of foods. Food Chem. 2008, 108, 1023–1026. [Google Scholar] [CrossRef]
- Andrade, L.M.; Andrade, C.J.; Dias, M.; Nascimento, C.A.O.; Mendes, M.A. Chlorella and Spirulina microalgae as sources of functional foods, nutraceuticals, and food supplements; an overview. MOJ Food Process. Technol. 2018, 6, 00144. [Google Scholar] [CrossRef] [Green Version]
- Kennedy, D.O. B vitamins and the brain: Mechanisms, dose and efficacy—A review. Nutrients 2016, 8, 68. [Google Scholar] [CrossRef] [Green Version]
- Wan, M.; Rosenberg, J.N.; Faruq, J.; Betenbaugh, M.J.; Xia, J. An improved colony PCR procedure for genetic screening of Chlorella and related microalgae. Biotechnol. Lett. 2011, 33, 1615–1619. [Google Scholar] [CrossRef]
- Rosenberg, J.N.; Kobayashi, N.; Barnes, A.; Noel, E.A.; Betenbaugh, M.J.; Oyler, G.A. Comparative analyses of three Chlorella species in response to light and sugar reveal distinctive lipid accumulation patterns in the microalga C. sorokiniana. PLoS ONE 2014, 9, e92460. [Google Scholar] [CrossRef] [Green Version]
- Potocki, L.; Depciuch, J.; Kuna, E.; Worek, M.; Lewinska, A.; Wnuk, M. FTIR and Raman spectroscopy-based biochemical profiling reflects genomic diversity of clinical Candida isolates that may be useful for diagnosis and targeted therapy of candidiasis. Int. J. Mol. Sci. 2019, 20, 988. [Google Scholar] [CrossRef] [Green Version]
- Lopez, C.V.; Garcia Mdel, C.; Fernandez, F.G.; Bustos, C.S.; Chisti, Y.; Sevilla, J.M. Protein measurements of microalgal and cyanobacterial biomass. Bioresour. Technol. 2010, 101, 7587–7591. [Google Scholar] [CrossRef]
- Available online: https://www.nrel.gov/docs/fy16osti/60958.pdf (accessed on 11 June 2018).
- Sumanta, N.; Haque, C.I.; Nishika, J.; Suprakash, R. Spectrophotometric analysis of chlorophylls and carotenoids from commonly grown fern species by using various extracting solvents. Res. J. Chem. Sci. 2014, 4, 63–69. [Google Scholar]
- Brand-Williams, W.; Cuvelier, M.E.; Berset, C. Use of a free radical method to evaluate antioxidant activity. LWT Food Sci. Technol. 1995, 28, 25–30. [Google Scholar] [CrossRef]
Sample Availability: Samples of the microalga are not available from the authors. |


© 2020 by the authors. Licensee MDPI, Basel, Switzerland. This article is an open access article distributed under the terms and conditions of the Creative Commons Attribution (CC BY) license (http://creativecommons.org/licenses/by/4.0/).
Share and Cite
Szpyrka, E.; Broda, D.; Oklejewicz, B.; Podbielska, M.; Slowik-Borowiec, M.; Jagusztyn, B.; Chrzanowski, G.; Kus-Liskiewicz, M.; Duda, M.; Zuczek, J.; et al. A Non-Vector Approach to Increase Lipid Levels in the Microalga Planktochlorella nurekis. Molecules 2020, 25, 270. https://doi.org/10.3390/molecules25020270
Szpyrka E, Broda D, Oklejewicz B, Podbielska M, Slowik-Borowiec M, Jagusztyn B, Chrzanowski G, Kus-Liskiewicz M, Duda M, Zuczek J, et al. A Non-Vector Approach to Increase Lipid Levels in the Microalga Planktochlorella nurekis. Molecules. 2020; 25(2):270. https://doi.org/10.3390/molecules25020270
Chicago/Turabian StyleSzpyrka, Ewa, Daniel Broda, Bernadetta Oklejewicz, Magdalena Podbielska, Magdalena Slowik-Borowiec, Bartosz Jagusztyn, Grzegorz Chrzanowski, Malgorzata Kus-Liskiewicz, Magdalena Duda, Janusz Zuczek, and et al. 2020. "A Non-Vector Approach to Increase Lipid Levels in the Microalga Planktochlorella nurekis" Molecules 25, no. 2: 270. https://doi.org/10.3390/molecules25020270