Association of Moderate Beer Consumption with the Gut Microbiota and SCFA of Healthy Adults

 ,
,
Abstract
: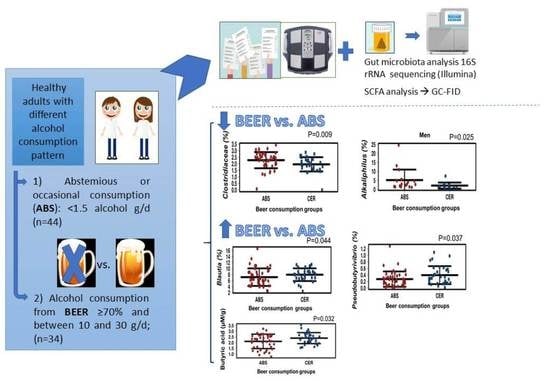
1. Introduction
2. Results
2.1. Anthropometric, Lifestyle, and Dietary Profile Characteristics of the Beer Consumption Groups
2.2. Gut Microbiota Diversity and Relative Abundance
2.3. SCFA Concentration in the Gut
3. Discussion
4. Materials and Methods
4.1. Experimental Design
4.2. Gut Microbiota Analysis
4.3. Short Chain Fatty Acids Analysis
4.4. Statistical Analysis
5. Conclusions
Supplementary Materials
Author Contributions
Funding
Conflicts of Interest
References
- de Gaetano, G.; Costanzo, S.; Di Castelnuovo, A.; Badimon, L.; Bejko, D.; Alkerwi, A.; Chiva-Blanch, G.; Estruch, R.; La Vecchia, C.; Panico, S.; et al. Effects of moderate beer consumption on health and disease: A consensus document. Nutr. Metab. Cardiovasc. Dis. 2016, 26, 443–467. [Google Scholar] [CrossRef] [PubMed] [Green Version]
- Goñi, I.; Díaz-Rubio, M.E.; Saura-Calixto, F. Dietary fiber in beer: Content, composition, colonic fermentability, and contribution to the diet. In Beer in Health and Disease Prevention; Elsevier: Amsterdam, The Netherlands, 2008; pp. 299–307. ISBN 9780123738912. [Google Scholar]
- Pérez-Jiménez, J.; Díaz-Rubio, M.E.; Saura-Calixto, F. Non-extractable polyphenols, a major dietary antioxidant: Occurrence, metabolic fate and health effects. Nutr. Res. Rev. 2013, 26, 118–129. [Google Scholar] [CrossRef] [PubMed] [Green Version]
- Neish, A.S. Microbes in gastrointestinal health and disease. Gastroenterology 2009, 136, 65–80. [Google Scholar] [CrossRef] [Green Version]
- Hansen, N.W.; Sams, A. The microbiotic highway to health—New perspective on food structure, gut microbiota, and host inflammation. Nutrients 2018, 10, 1590. [Google Scholar] [CrossRef] [PubMed] [Green Version]
- Engen, P.A.; Green, S.J.; Voigt, R.M.; Forsyth, C.B.; Keshavarzian, A. The gastrointestinal microbiome: Alcohol effects on the composition of intestinal microbiota. Alcohol Res. Curr. Rev. 2015, 37, 223–236. [Google Scholar]
- Bach Knudsen, K.E. Microbial degradation of whole-grain complex carbohydrates and impact on short-chain fatty acids and health. Adv. Nutr. 2015, 6, 206–213. [Google Scholar] [CrossRef] [Green Version]
- Maslowski, K.M.; Vieira, A.T.; Ng, A.; Kranich, J.; Sierro, F.; Yu, D.; Schilter, H.C.; Rolph, M.S.; MacKay, F.; Artis, D.; et al. Regulation of inflammatory responses by gut microbiota and chemoattractant receptor GPR43. Nature 2009, 461, 1282–1286. [Google Scholar] [CrossRef] [PubMed]
- Tolhurst, G.; Heffron, H.; Lam, Y.S.; Parker, H.E.; Habib, A.M.; Diakogiannaki, E.; Cameron, J.; Grosse, J.; Reimann, F.; Gribble, F.M. Short-chain fatty acids stimulate glucagon-like peptide-1 secretion via the G-protein-coupled receptor FFAR2. Diabetes 2012, 61, 364–371. [Google Scholar] [CrossRef] [Green Version]
- Dolara, P.; Luceri, C.; De Filippo, C.; Femia, A.P.; Giovannelli, L.; Caderni, G.; Cecchini, C.; Silvi, S.; Orpianesi, C.; Cresci, A. Red wine polyphenols influence carcinogenesis, intestinal microflora, oxidative damage and gene expression profiles of colonic mucosa in F344 rats. Mutat. Res. Fundam. Mol. Mech. Mutagen. 2005, 591, 237–246. [Google Scholar] [CrossRef]
- Quesada-Molina, M.; Muñoz-Garach, A.; Tinahones, F.J.; Moreno-Indias, I. A new perspective on the health benefits of moderate beer consumption: Involvement of the gut microbiota. Metabolites 2019, 9, 272. [Google Scholar] [CrossRef] [Green Version]
- Tzounis, X.; Vulevic, J.; Kuhnle, G.G.C.; George, T.; Leonczak, J.; Gibson, G.R.; Kwik-Uribe, C.; Spencer, J.P.E. Flavanol monomer-induced changes to the human faecal microflora. Br. J. Nutr. 2008, 99, 782–792. [Google Scholar] [CrossRef] [Green Version]
- Possemiers, S.; Bolca, S.; Grootaert, C.; Heyerick, A.; Decroos, K.; Dhooge, W.; De Keukeleire, D.; Rabot, S.; Verstraete, W.; Van de Wiele, T. The Prenylflavonoid Isoxanthohumol from Hops (Humulus lupulus L.) Is Activated into the Potent Phytoestrogen 8-Prenylnaringenin In Vitro and in the Human Intestine. J. Nutr. 2006, 136, 1862–1867. [Google Scholar] [CrossRef] [PubMed] [Green Version]
- Paraiso, I.L.; Plagmann, L.S.; Yang, L.; Zielke, R.; Gombart, A.F.; Maier, C.S.; Sikora, A.E.; Blakemore, P.R.; Stevens, J.F. Reductive Metabolism of Xanthohumol and 8-Prenylnaringenin by the Intestinal Bacterium Eubacterium ramulus. Mol. Nutr. Food Res. 2019, 63, e1800623. [Google Scholar] [CrossRef]
- Teixeira, C.; Prykhodko, O.; Alminger, M.; Fåk Hållenius, F.; Nyman, M. Barley Products of Different Fiber Composition Selectively Change Microbiota Composition in Rats. Mol. Nutr. Food Res. 2018, 62, 1701023. [Google Scholar] [CrossRef]
- Zhong, Y.; Nyman, M.; Fåk, F. Modulation of gut microbiota in rats fed high-fat diets by processing whole-grain barley to barley malt. Mol. Nutr. Food Res. 2015, 59, 2066–2076. [Google Scholar] [CrossRef] [PubMed]
- Cummings, J.H. Short-chain fatty acid enemas in the treatment of distal ulcerative colitis. Eur. J. Gastroenterol. Hepatol. 1997, 9, 149–153. [Google Scholar] [CrossRef]
- Rivière, A.; Selak, M.; Lantin, D.; Leroy, F.; De Vuyst, L. Bifidobacteria and Butyrate-Producing Colon Bacteria: Importance and Strategies for Their Stimulation in the Human Gut. Front. Microbiol. 2016, 7, 979. [Google Scholar] [CrossRef] [Green Version]
- Ramirez-Farias, C.; Slezak, K.; Fuller, Z.; Duncan, A.; Holtrop, G.; Louis, P. Effect of inulin on the human gut microbiota: Stimulation of Bifidobacterium adolescentis and Faecalibacterium prausnitzii. Br. J. Nutr. 2009, 101, 541–550. [Google Scholar] [CrossRef] [Green Version]
- Hernández-Quiroz, F.; Nirmalkar, K.; Villalobos-Flores, L.E.; Murugesan, S.; Cruz-Narváez, Y.; Rico-Arzate, E.; Hoyo-Vadillo, C.; Chavez-Carbajal, A.; Pizano-Zárate, M.L.; García-Mena, J. Influence of moderate beer consumption on human gut microbiota and its impact on fasting glucose and β-cell function. Alcohol 2020, 85, 77–94. [Google Scholar] [CrossRef]
- Broekaert, W.F.; Courtin, C.M.; Verbeke, K.; van de Wiele, T.; Verstraete, W.; Delcour, J.A. Prebiotic and other health-related effects of cereal-derived arabinoxylans, arabinoxylan-oligosaccharides, and xylooligosaccharides. Crit. Rev. Food Sci. Nutr. 2011, 51, 178–194. [Google Scholar] [CrossRef]
- Vardakou, M.; Nueno Palop, C.; Gasson, M.; Narbad, A.; Christakopoulos, P. In vitro three-stage continuous fermentation of wheat arabinoxylan fractions and induction of hydrolase activity by the gut microflora. Int. J. Biol. Macromol. 2007, 41, 584–589. [Google Scholar] [CrossRef] [PubMed]
- Na, M.H.; Kim, W.K. Effects of Xylooligosaccharide Intake on Fecal Bifidobacteria, Lactic acid and Lipid Metabolism in Korean Young Women. Korean J. Nutr. 2007, 40, 154–161. [Google Scholar]
- Moore, L.V.H.; Moore, W.E.C. Oribaculum catoniae gen. nov., sp. nov.; Catonella morbi gen. nov., sp. nov.; Hallella seregens gen. nov., sp. nov.; Johnsonella ignava gen. nov., sp. nov.; and Dialister pneumosintes gen. nov., comb. nov., nom. rev., anaerobic gram-negative bacilli from the human gingival crevice. Int. J. Syst. Bacteriol. 1994, 44, 187–192. [Google Scholar] [CrossRef] [PubMed] [Green Version]
- Kopečný, J.; Zorec, M.; Mrázek, J.; Kobayashi, Y.; Marinšek-Logar, R. Butyrivibrio hungatei sp. nov. and Pseudobutyrivibrio xylanivorans sp. nov., butyrate-producing bacteria from the rumen. Int. J. Syst. Evol. Microbiol. 2003, 53, 201–209. [Google Scholar] [CrossRef] [Green Version]
- Rajilić-Stojanović, M.; de Vos, W.M. The first 1000 cultured species of the human gastrointestinal microbiota. FEMS Microbiol. Rev. 2014, 38, 996–1047. [Google Scholar] [CrossRef] [PubMed]
- Redondo-Useros, N.; Gheorghe, A.; Díaz-Prieto, L.E.; Villavisencio, B.; Marcos, A.; Nova, E. Associations of Probiotic Fermented Milk (PFM) and Yogurt Consumption with Bifidobacterium and Lactobacillus Components of the Gut Microbiota in Healthy Adults. Nutrients 2019, 11, 651. [Google Scholar] [CrossRef] [PubMed] [Green Version]
- Nova, E.; San Mauro-Martín, I.; Díaz-Prieto, L.E.; Marcos, A. Wine and beer within a moderate alcohol intake is associated with higher levels of HDL-c and adiponectin. Nutr. Res. 2019, 63, 42–50. [Google Scholar] [CrossRef] [PubMed] [Green Version]
- Martin-Moreno, J.M.; Boyle, P.; Gorgojo, L.; Maisonneuve, P.; Fernandez-Rodriguez, J.C.; Salvini, S.; Willett, W.C. Development and validation of a food frequency questionnaire in Spain. Int. J. Epidemiol. 1993, 22, 512–519. [Google Scholar] [CrossRef] [PubMed]
- Mataix, J. Tablas de Composición de Alimentos [Food Composition Tables]. Available online: http://www.sennutricion.org/es/2013/05/11/tablas-de-composicin-de-alimentos-mataix-et-al (accessed on 27 May 2019).
- Dore, J.; Ehrlich, S.D.; Levenez, F.; Pelletier, E.; Alberti, A.; Bertrand, L.; Bork, P.; Costea, P.I.; Sunagawa, S.; Guarner, F.; et al. IHMS_SOP 06 V1: Standard Operating Procedure for Faecal Samples DNA Extraction, Protocol, Q. In International Human Microbiome Standards; INRA: Paris, France, 2015. [Google Scholar]
- 16S Metagenomics App. Illumina. Available online: https://support.illumina.com/help/BaseSpace_App_16S_Metagenomics_help/16S_Metagenomics_App_Help.htm (accessed on 27 May 2019).


| Beer Consumption Group | |||||
|---|---|---|---|---|---|
| Men | ABS (n = 18) | BEER (n = 15) | pϒ | p * | p¥ |
| Age (years) | 37.23 (5.99) | 34.05 (6.39) | 0.151 | -- | -- |
| BMI (kg/m2) | 26.47 (3.20) | 24.23 (2.64) | 0.038 | -- | -- |
| BMI-Fat (%) | |||||
| Normal weight | 44.4 | 73.3 | -- | -- | 0.095 |
| Overweight | 55.6 | 26.7 | |||
| Body fat (%) | 20.47 (6.32) | 16.48 (5.06) | 0.057 | -- | -- |
| Visceral fat index | 7.00 (4.00–9.00) | 4.00 (3.00–6.00) | -- | 0.057 | -- |
| MEDAS total score | 6.778 (2.264) | 6.867 (1.767) | 0.902 | -- | -- |
| Capital (%) | |||||
| Low (<50,000 €) | 33.3 | 40.0 | -- | -- | 0.848 |
| Medium (50,000–200,000 €) | 50.0 | 40.0 | |||
| High (>200,000 €) | 16.7 | 20.0 | |||
| Smoking habits (%) | |||||
| Non-smokers | 5.6 | 13.3 | -- | -- | 0.530 |
| Current smokers | 11.1 | 20.0 | |||
| Former smokers | 83.3 | 66.7 | |||
| Physical activity (kcal/wk) †φ | 5588 (3793) | 7280 (4497) | 0.152 | -- | -- |
| Sleep (h/d) † | 7.45 (1.05) | 7.64 (0.87) | 0.535 | -- | -- |
| Women | ABS (n = 26) | BEER (n = 19) | pϒ | p * | p¥ |
| Age (years) | 36.78 (7.18) | 34.70 (6.48) | 0.323 | -- | -- |
| BMI (kg/m2) | 22.80 (3.01) | 23.75 (2.25) | 0.253 | -- | -- |
| BMI-Fat (%) | |||||
| Normal weight | 69.2 | 63.2 | -- | -- | 0.670 |
| Overweight | 30.8 | 36.8 | |||
| Body fat (%) | 27.60 (8.12) | 29.11 (5.07) | 0.480 | -- | -- |
| Visceral fat index | 3.00 (2.00–4.13) | 4.00 (3.00–4.00) | -- | 0.476 | -- |
| MEDAS total score | 7.269 (1.756) | 7.526 (1.679) | 0.624 | -- | -- |
| Capital (%) | |||||
| Low (<50,000 €) | 57.7 | 47.4 | -- | -- | 0.471 |
| Medium (50,000–200,000 €) | 30.8 | 47.4 | |||
| High (>200,000 €) | 11.5 | 5.3 | |||
| Smoking habits (%) | |||||
| Non-smokers | 19.2 | 36.8 | -- | -- | 0.339 |
| Current smokers | 30.8 | 31.6 | |||
| Former smokers | 50.0 | 31.6 | |||
| Physical activity (kcal/wk) †φ | 3156 (2242) | 2617 (2359) | 0.433 | -- | -- |
| Sleep (h/d) † | 7.75 (0.88) | 7.75 (0.78) | 0.943 | -- | -- |
| Beer Consumption Groups | |||||
|---|---|---|---|---|---|
| ABS (n = 44) | BEER (n = 34) | p# | pλ | p * | |
| Lachnospiraceae | 16.16 (5.61) | 17.68 (4.01) | -- | 0.189 | -- |
| Ruminococcaceae | 15.16 (4.77) | 15.28 (4.30) | 0.958 | -- | -- |
| Clostridiaceae† | 11.31 (5.93) | 8.20 (3.61) | -- | 0.009 | -- |
| Bacteroidaceae | 10.62 (7.89–17.71) | 13.89 (7.75–20.34) | -- | -- | 0.228 |
| Bifidobacteriaceae | 2.342 (0.935–5.441) | 1.348 (0.516–3.260) | -- | -- | 0.303 |
| Peptococcaceae | 0.268 (0.156–0.410) | 0.237 (0.166–0.353) | -- | -- | 0.323 |
| Eubacteriaceae | 0.146 (0.118–0.187) | 0.141 (0.121–0.161) | -- | -- | 0.465 |
| Lactobacillaceae | 0.134 (0.054–0.249) | 0.095 (0.059–0.147) | -- | -- | 0.181 |
| Beer Consumption Groups | |||
|---|---|---|---|
| ABS (n = 44) | BEER (n = 34) | p * | |
| Bacteroidaceae | |||
| Bacteroides | 10.62 (7.89–17.71) | 13.60 (7.78–19.90) | 0.268 |
| Lachnospiraceae | |||
| Blautia | 6.419 (5.041–8.822) | 8.098 (6.801–9.043) | 0.044 |
| Lachnospira | |||
| Normal weight | 2.268 (1.082–3.408) | 1.951 (1.428–4.011) | 0.795 |
| Overweight | 1.110 (0.653–1.662) | 1.297 (0.992–1.822) | 0.387 |
| Coprococcus | |||
| Normal weight | 1.919 (0.957–2.580) | 1.321 (0.970–1.822) | 0.065 |
| Overweight | 1.908 (1.762–3.091) | 3.223 (1.119–4.252) | 0.188 |
| Roseburia | 1.424 (0.675–2.639) | 2.196 (1.278–2.978) | 0.118 |
| Dorea | 0.442 (0.236–0.617) | 0.332 (0.233–0.570) | 0.438 |
| Pseudobutyrivibrio | 0.224 (0.104–0.364) | 0.323 (0.159–0.591) | 0.037 |
| Butyrivibrio | 0.080 (0.034–0.179) | 0.166 (0.065–0.296) | 0.056 |
| Anaerostipes | 0.072 (0.028–0.116) | 0.052 (0.007–0.121) | 0.276 |
| Johnsonella | 0.035 (0.022–0.073) | 0.055 (0.036–0.071) | 0.051 |
| Oribacterium | |||
| Normal weight | 0.019 (0.011–0.033) | 0.028 (0.015–0.035) | 0.200 |
| Overweight | 0.014 (0.009–0.023) | 0.010 (0.007–0.018) | 0.438 |
| Lachnobacterium | 0.009 (0.002–0.027) | 0.014 (0.006–0.078) | 0.107 |
| Shuttleworthia | 0.008 (0.003–0.016) | 0.009 (0.002–0.017) | 0.525 |
| Catonella | 0.001 (0.000–0.001) | 0.001 (0.000–0.001) | 0.674 |
| Ruminococcaceae | |||
| Faecalibacterium | |||
| Normal weight | 8.007 (4.794–9.872) | 7.530 (6.330–9.767) | 0.857 |
| Overweight | 6.067 (3.362–9.512) | 6.663 (4.237–8.366) | 0.842 |
| Ruminococcus | 4.796 (3.410–6.352) | 4.019 (2.998–5.724) | 0.144 |
| Oscillospira | 3.776 (2.436–4.839) | 3.755 (2.721–4.344) | 0.856 |
| Anaerofilum | 0.082 (0.048–0.149) | 0.072 (0.049–0.131) | 0.896 |
| Anaerotruncus | 0.059 (0.034–0.094) | 0.063 (0.044–0.095) | 0.643 |
| Ethanoligenens | 0.000 (0.000–0.001) | 0.000 (0.000–0.001) | 0.938 |
| Clostridiaceae | |||
| Clostridium | 5.192 (3.514–6.378) | 4.013 (3.161–5.072) | 0.056 |
| Alkaliphilus | |||
| Men | 2.914 (1.570–5.391) | 1.535 (1.318–2.590) | 0.025 |
| Women | 2.100 (0.951–3.672) | 1.200 (0.463–2.608) | 0.198 |
| Caloramator | 0.450 (0.157–1.226) | 0.218 (0.080–1.144) | 0.204 |
| Eubacteriaceae | |||
| Acetobacterium | 0.144 (0.108–0.181) | 0.134 (0.122–0.156) | 0.724 |
| Eubacterium | 0.104 (0.038–0.503) | 0.217 (0.017–0.981) | 0.526 |
| Anaerofustis | 0.001 (0.000–0.003) | 0.000 (0.000–0.001) | 0.068 |
| Bifidobacteriaceae | |||
| Bifidobacterium | 2.333 (0.930–5.425) | 1.500 (0.509–3.804) | 0.426 |
| Lactobacillaceae | |||
| Lactobacillus | 0.131 (0.046–0.245) | 0.083 (0.058–0.142) | 0.201 |
| Peptococcaceae | |||
| Desulfotomaculum | 0.070 (0.048–0.108) | 0.064 (0.043–0.092) | 0.450 |
| Peptococcus | 0.042 (0.020–0.095) | 0.029 (0.018–0.073) | 0.403 |
| Sporotomaculum | 0.024 (0.017–0.034) | 0.024 (0.019–0.035) | 0.896 |
| Desulfosporosinus | 0.023 (0.008–0.034) | 0.013 (0.004–0.025) | 0.090 |
| Dehalobacterium | 0.012 (0.001–0.028) | 0.007 (0.003–0.014) | 0.343 |
| Desulfurispora | 0.005 (0.003–0.016) | 0.005 (0.003–0.008) | 0.632 |
| Pelotomaculum | 0.003 (0.002–0.005) | 0.003 (0.002–0.005) | 0.545 |
| Desulfitobacterium | 0.001 (0.000–0.005) | 0.001 (0.000–0.003) | 0.402 |
| Beer Consumption Groups | |||
|---|---|---|---|
| ABS (n = 44) | BEER (n = 34) | p * | |
| Blautia coccoides | 1.752 (1.142–2.212) | 2.254 (1.724–2.912) | 0.027 |
| Alkaliphilus peptidifermentans | 1.022 (0.270–2.407) | 0.574 (0.211–1.008) | 0.028 |
| Alkaliphilus crotonatoxidans | 0.920 (0.295–1.906) | 0.376 (0.178–0.934) | 0.054 |
| Clostridium alkalicellulosi | 0.629 (0.393–0.932) | 0.668 (0.444–0.886) | 0.747 |
| Blautia hanseii | 0.400 (0.218–0.526) | 0.343 (0.285–0.492) | 0.928 |
| Blautia wexlerae | 0.384 (0.236–0.658) | 0.522 (0.341–0.819) | 0.133 |
| Pseudobutyrivibrio xylanivorans | 0.224 (0.104–0.364) | 0.323 (0.159–0.591) | 0.037 |
| Clostridium cadaveris | 0.170 (0.072–0.577) | 0.124 (0.070–0.310) | 0.190 |
| Clostridium histolyticum | 0.144 (0.093–0.245) | 0.155 (0.108–0.209) | 0.904 |
| Clostridium frigoris | 0.102 (0.020–0.514) | 0.167 (0.020–0.565) | 0.657 |
| Butyrivibrio proteoclasticus | 0.080 (0.034–0.179) | 0.166 (0.065–0.276) | 0.058 |
| Blautia obeum | 0.079 (0.031–0.160) | 0.084 (0.055–0.198) | 0.328 |
| Clostridium caenicola | 0.056 (0.029–0.080) | 0.053 (0.039–0.077) | 0.832 |
| Clostridium hiranonis | 0.046 (0.012–0.110) | 0.013 (0.002–0.038) | 0.006 |
| Clostridium fallax | 0.038 (0.010–0.100) | 0.040 (0.006–0.116) | 0.687 |
| Johnsonella ignava | 0.034 (0.020–0.072) | 0.055 (0.035–0.069) | 0.046 |
| Clostridium thermosuccinogenes | 0.030 (0.021–0.048) | 0.039 (0.020–0.116) | 0.230 |
| Clostridium taeniosporum | 0.020 (0.013–0.049) | 0.040 (0.015–0.078) | 0.131 |
| Clostridium thermoalcaliphilum | |||
| Men | 0.029 (0.011–0.038) | 0.017 (0.011–0.044) | 0.442 |
| Women | 0.016 (0.008–0.037) | 0.010 (0.007–0.017) | 0.103 |
| Clostridium termitidis | |||
| Men | 0.011 (0.005–0.041) | 0.008 (0.006–0.019) | 0.442 |
| Women | 0.036 (0.013–0.066) | 0.015 (0.011–0.050) | 0.301 |
| Blautia schinkii | 0.009 (0.004–0.017) | 0.010 (0.004–0.015) | 0.856 |
| Blautia glucerasea | 0.008 (0.003–0.016) | 0.010 (0.004–0.017) | 0.665 |
| Clostridium hveragerdense | 0.008 (0.003–0.022) | 0.009 (0.003–0.020) | 0.956 |
| Clostridium cavendishii | 0.006 (0.002–0.012) | 0.004 (0.003–0.008) | 0.420 |
| Clostridium malenominatum | 0.005 (0.002–0.014) | 0.004 (0.001–0.016) | 0.519 |
| Clostridium straminisolvens | 0.003 (0.001–0.009) | 0.002 (0.000–0.005) | 0.263 |
| Clostridium proteolyticus | 0.002 (0.001–0.005) | 0.002 (0.001–0.004) | 0.532 |
| Alkaliphilus metalliredigens | 0.001 (0.000–0.002) | 0.001 (0.000–0.001) | 0.267 |
| Blautia hydrogenotrophica | 0.001 (0.000–0.006) | 0.001 (0.000–0.004) | 0.830 |
| Clostridium tepidiprofundi | 0.001 (0.000–0.002) | 0.001 (0.001–0.002) | 0.944 |
| Clostridium chartatabidum | 0.001 (0.000–0.003) | 0.001 (0.000–0.002) | 0.235 |
| Clostridium aestuarii | 0.001 (0.000–0.002) | 0.000 (0.000–0.001) | 0.128 |
| Blautia producta | 0.000 (0.000–0.003) | 0.003 (0.000–0.028) | 0.039 |
| Beer Consumption Groups | |||
|---|---|---|---|
| ABS (n = 44) | BEER (n = 34) | pλ | |
| Acetic acid (µM/g) † | 33.24 (16.29) | 37.79 (15.51) | 0.158 |
| Propionic acid (µM/g) † | 11.66 (7.08) | 13.32 (6.55) | 0.133 |
| Butyric acid (µM/g) † | 8.831 (5.383) | 11.35 (6.538) | 0.032 |
| Isobutyric acid (µM/g) † | 1.857 (0.942) | 1.639 (0.710) | 0.351 |
| Valeric acid (µM/g) † | 1.854 (1.436) | 1.923 (0.972) | 0.376 |
| Isovaleric acid (µM/g) † | 2.679 (1.691) | 2.371 (1.259) | 0.599 |
Sample Availability: Not available. | |
Publisher’s Note: MDPI stays neutral with regard to jurisdictional claims in published maps and institutional affiliations. |
© 2020 by the authors. Licensee MDPI, Basel, Switzerland. This article is an open access article distributed under the terms and conditions of the Creative Commons Attribution (CC BY) license (http://creativecommons.org/licenses/by/4.0/).
Share and Cite
González-Zancada, N.; Redondo-Useros, N.; Díaz, L.E.; Gómez-Martínez, S.; Marcos, A.; Nova, E. Association of Moderate Beer Consumption with the Gut Microbiota and SCFA of Healthy Adults. Molecules 2020, 25, 4772. https://doi.org/10.3390/molecules25204772
González-Zancada N, Redondo-Useros N, Díaz LE, Gómez-Martínez S, Marcos A, Nova E. Association of Moderate Beer Consumption with the Gut Microbiota and SCFA of Healthy Adults. Molecules. 2020; 25(20):4772. https://doi.org/10.3390/molecules25204772
Chicago/Turabian StyleGonzález-Zancada, Natalia, Noemí Redondo-Useros, Ligia E. Díaz, Sonia Gómez-Martínez, Ascensión Marcos, and Esther Nova. 2020. "Association of Moderate Beer Consumption with the Gut Microbiota and SCFA of Healthy Adults" Molecules 25, no. 20: 4772. https://doi.org/10.3390/molecules25204772