
Optical and Photoacoustic Properties of Laser-Ablated Silver Nanoparticles in a Carbon Dots Solution

 , , and
Abstract
:1. Introduction
2. Results
3. Materials and Methods
3.1. Reagents
3.2. Preparation of Carbon Dots
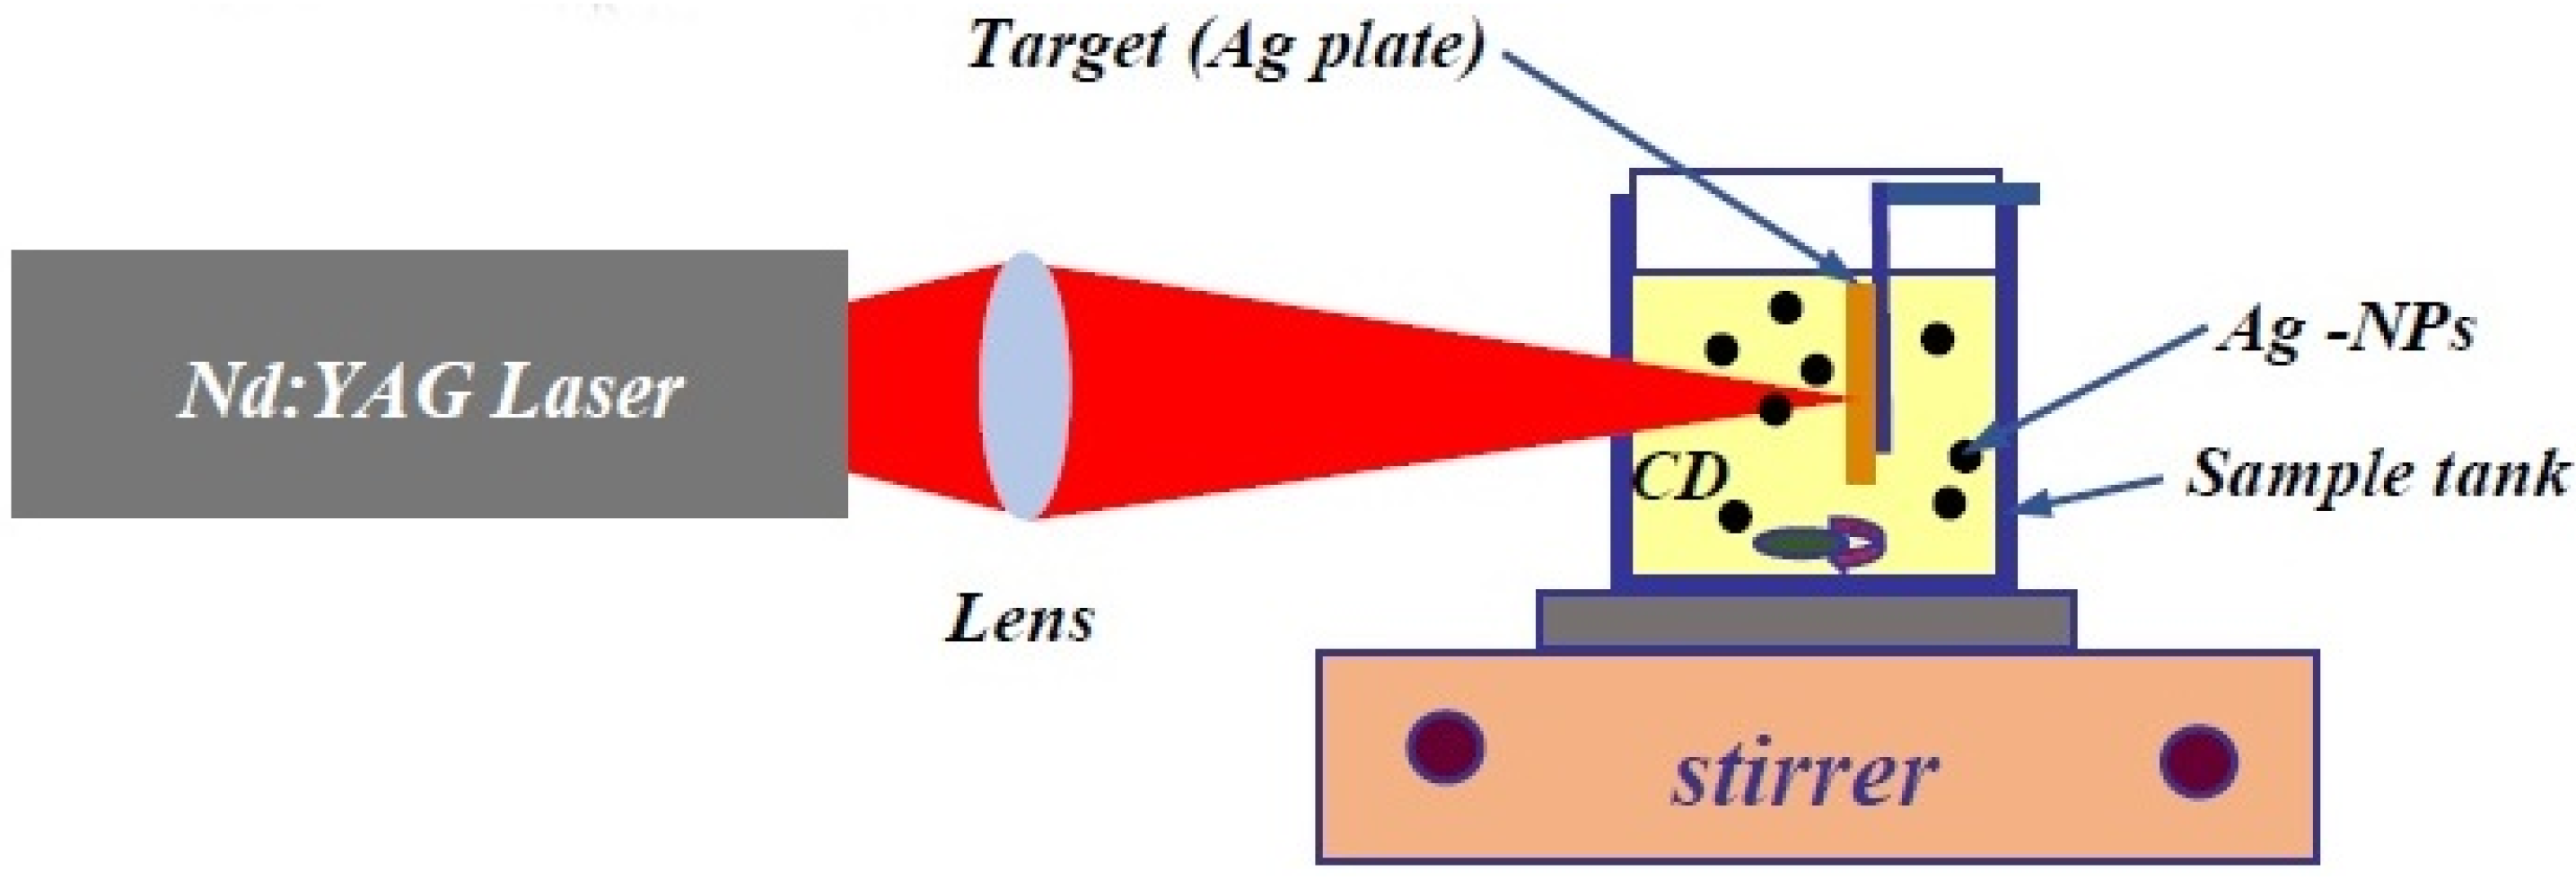
3.3. Laser Ablation
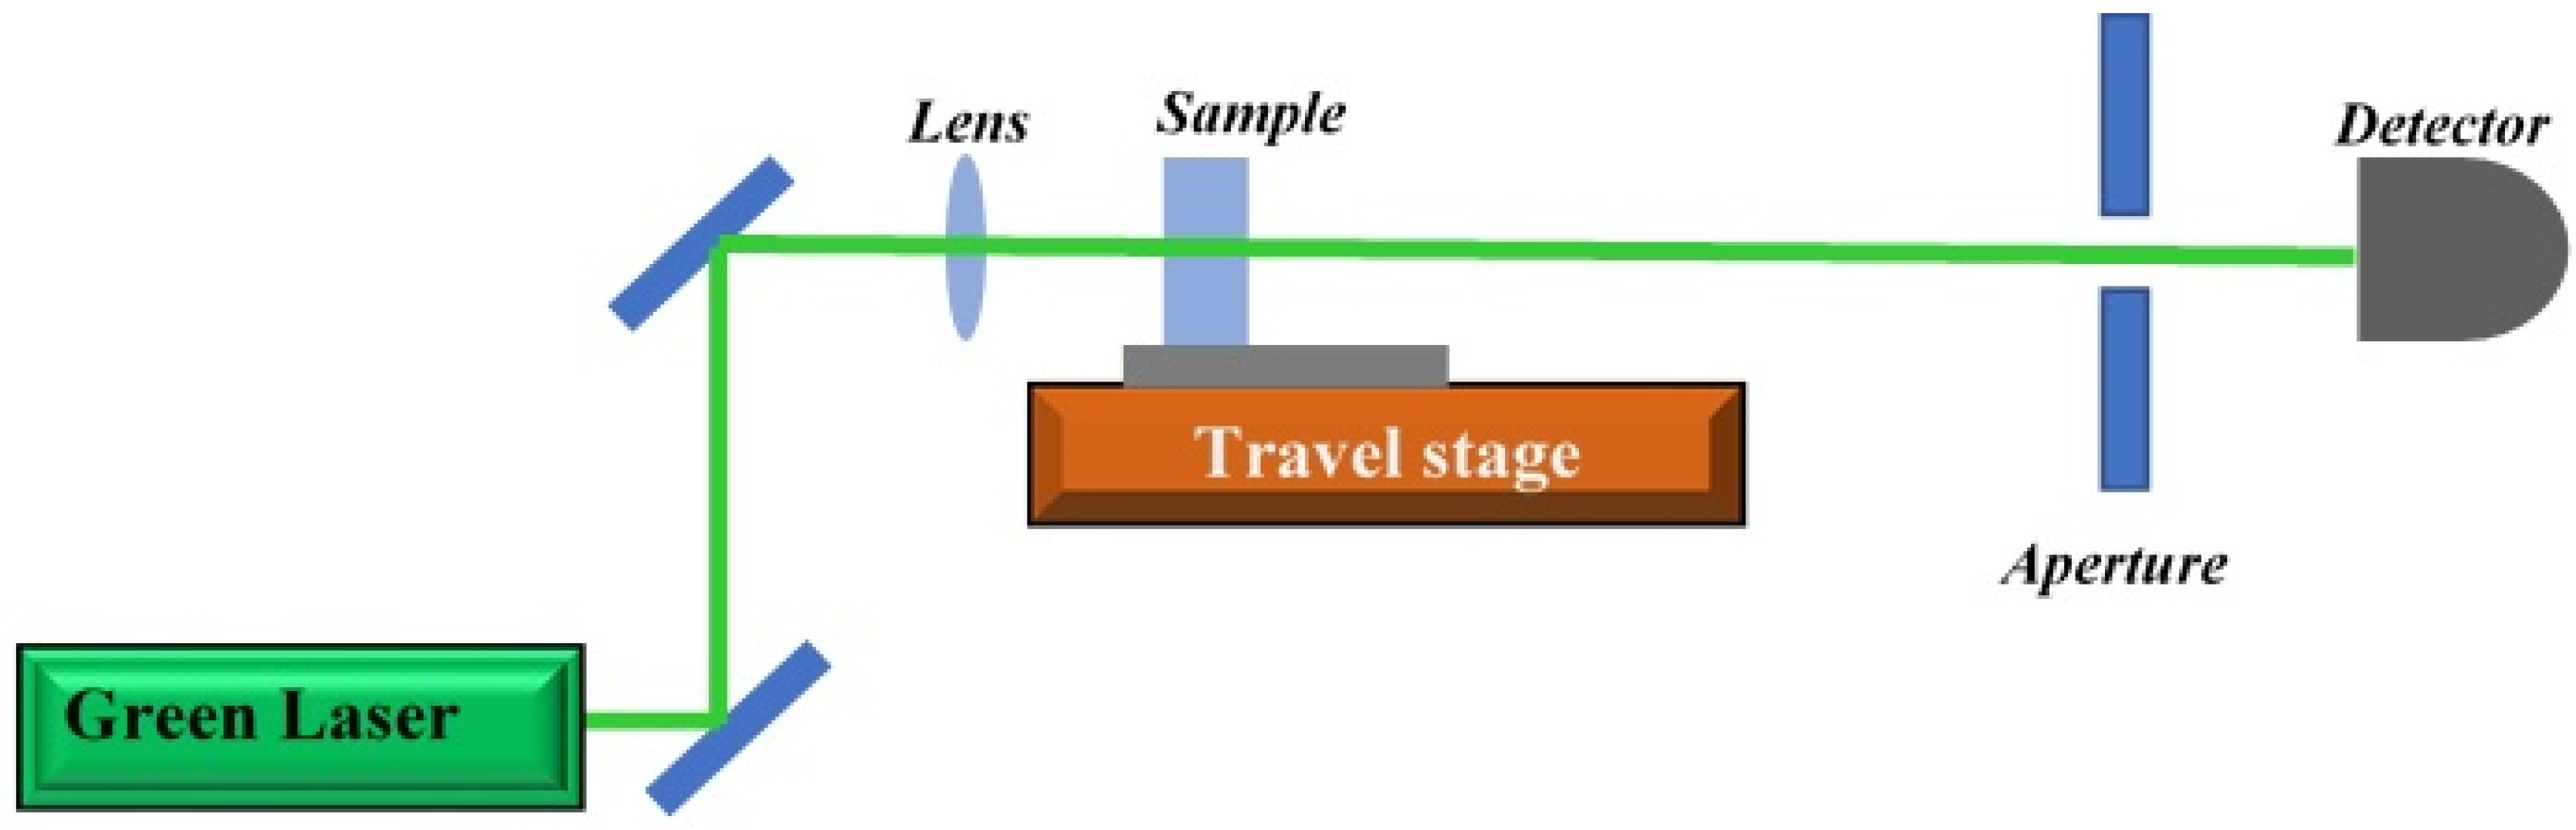
3.4. Z-Scan Setup
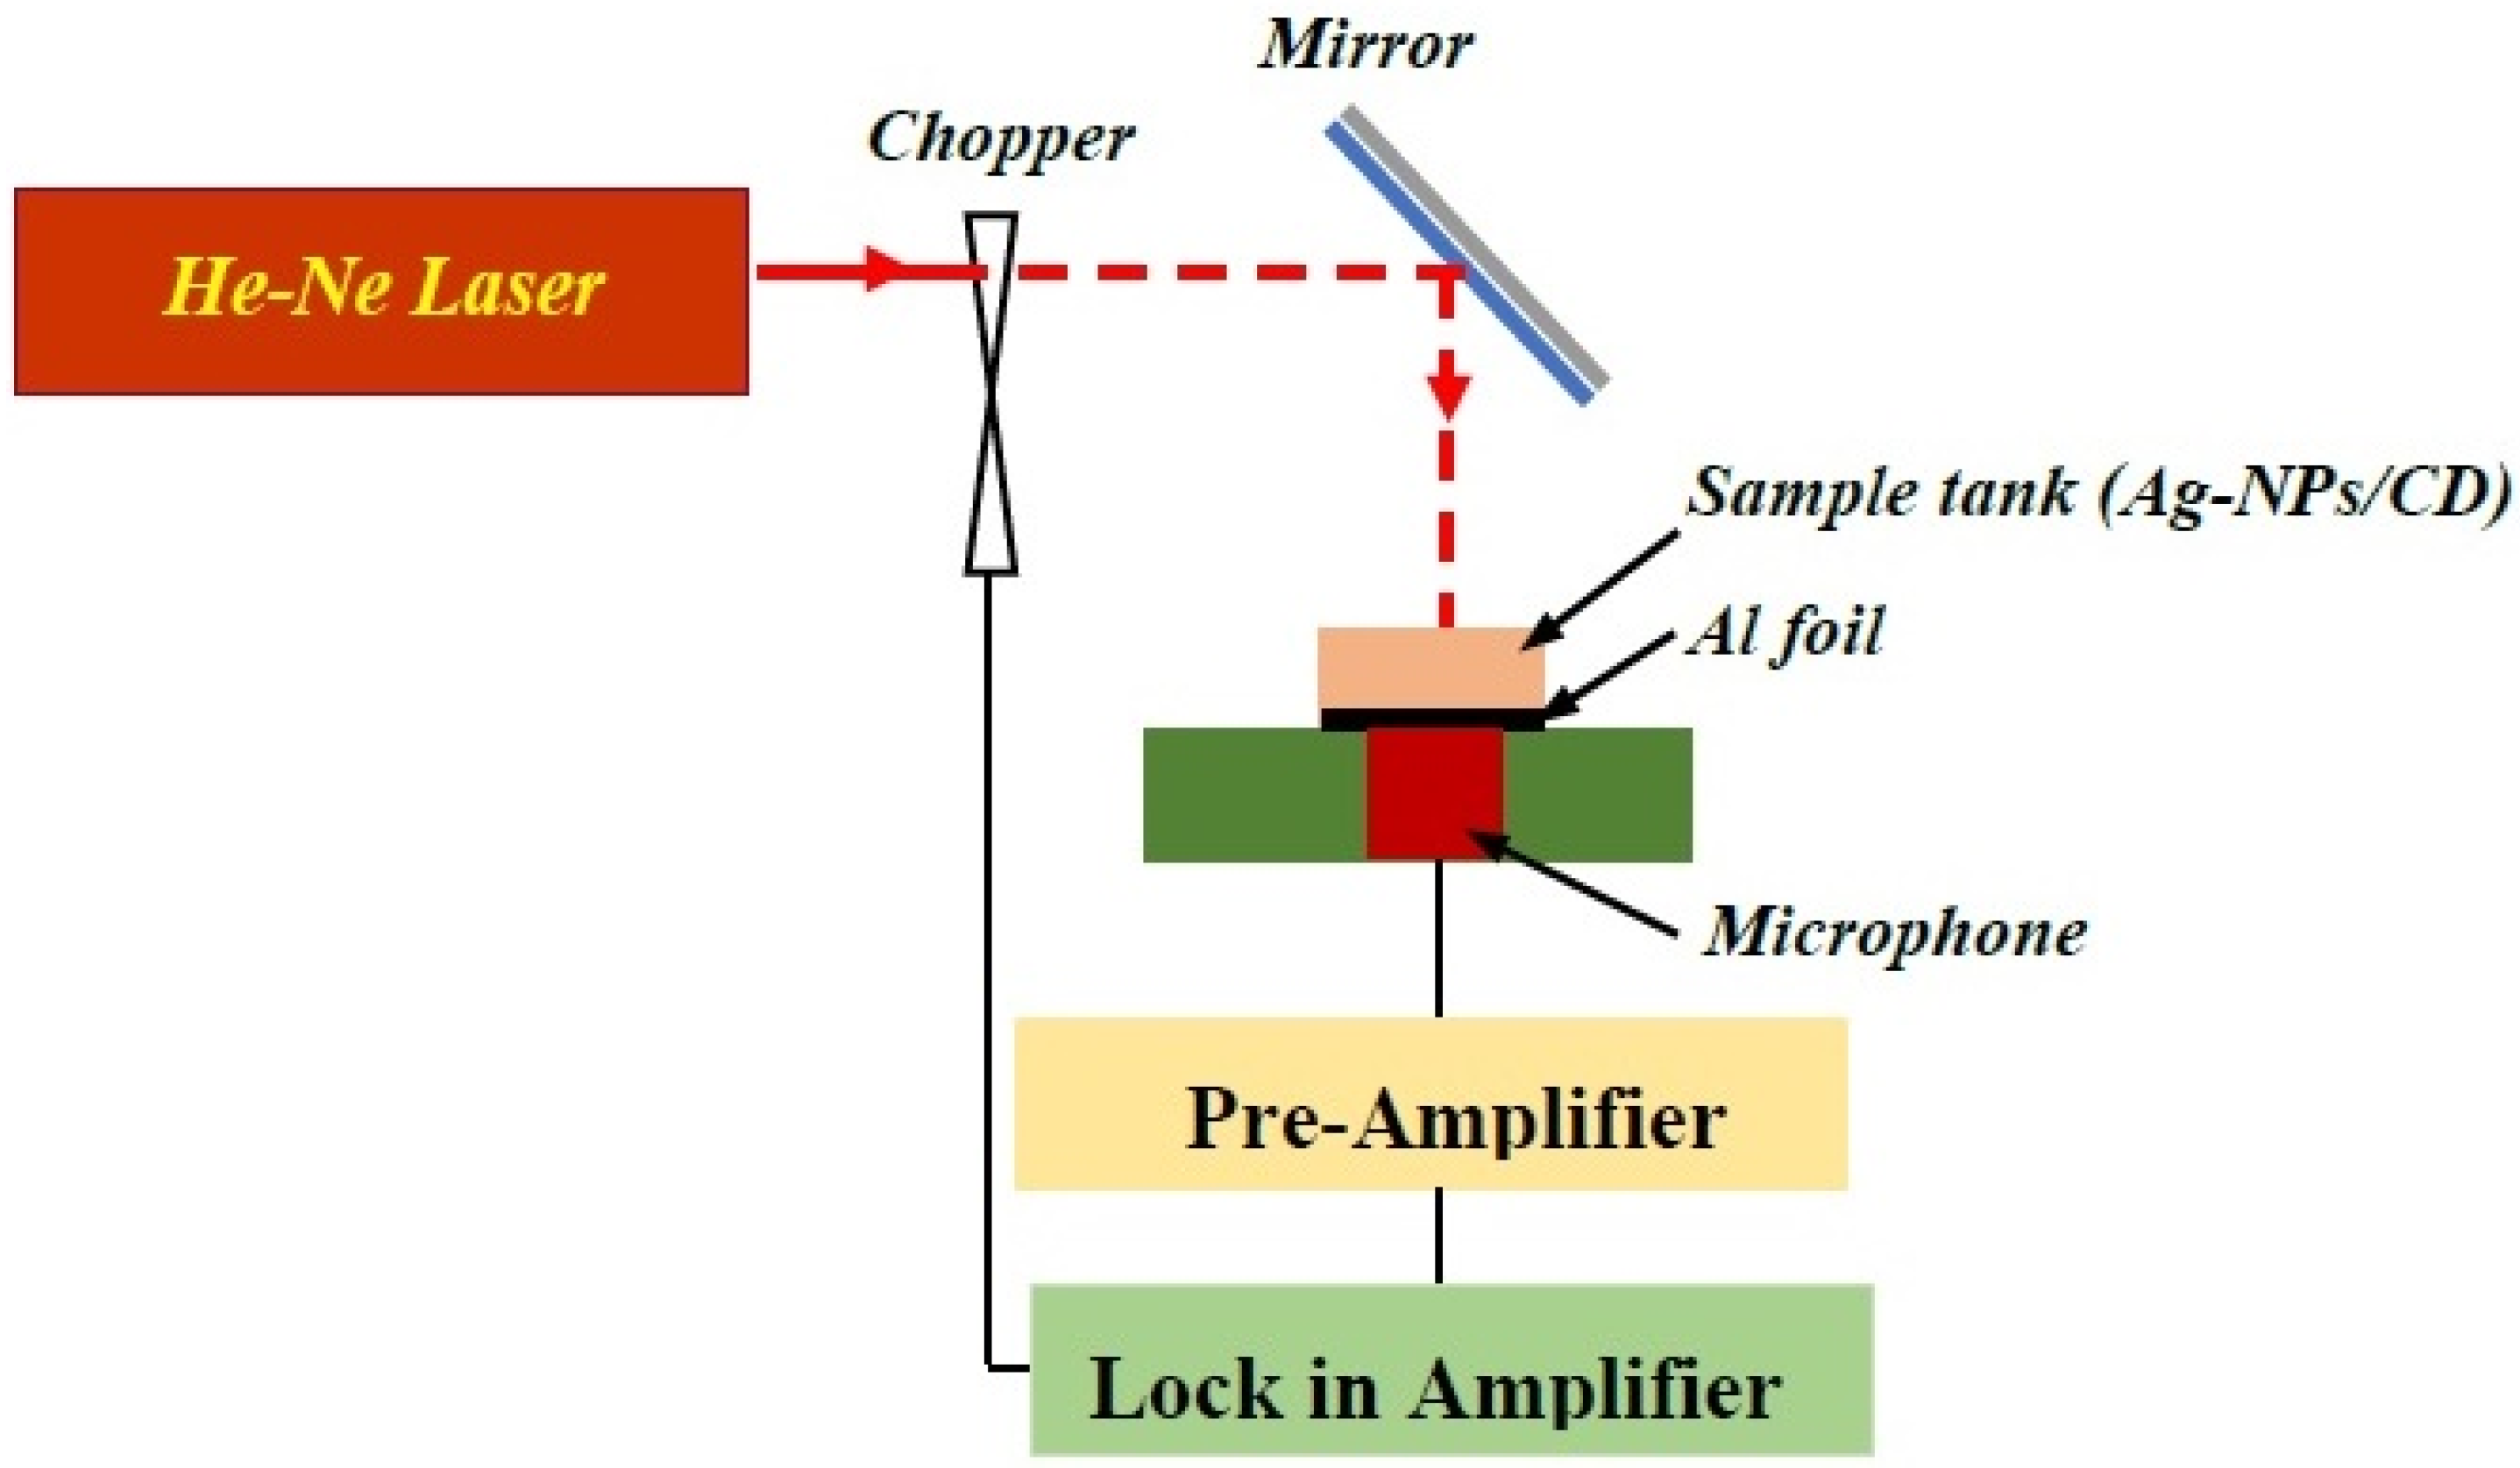
3.5. Photoacoustic Setup
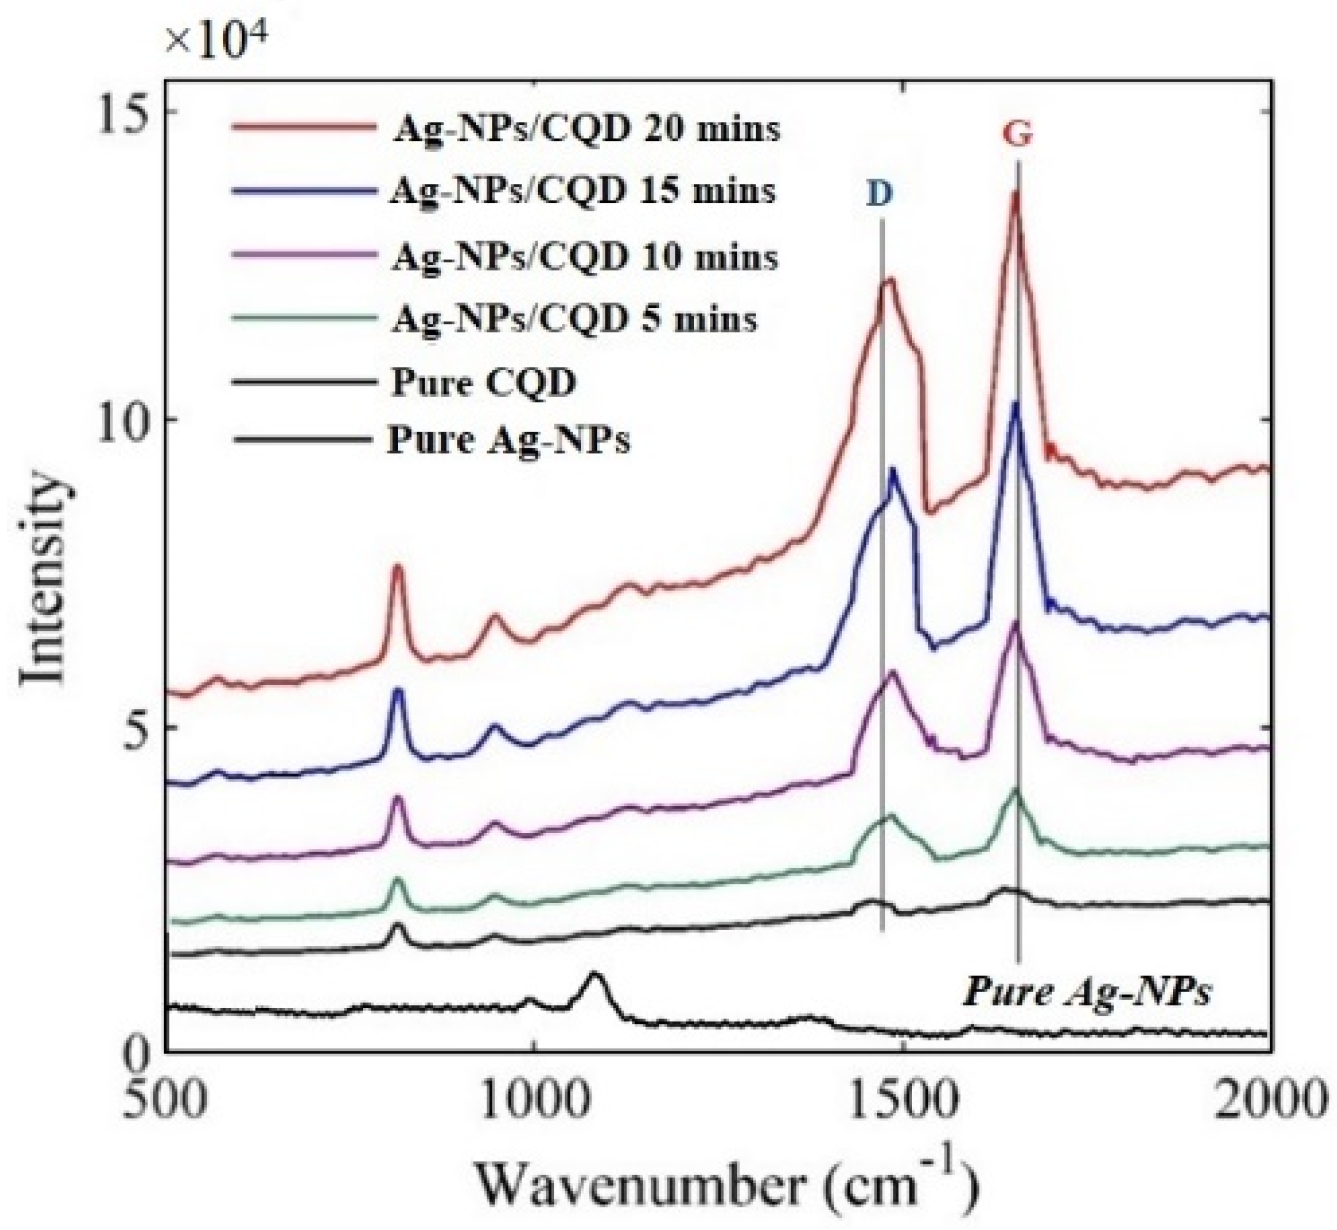
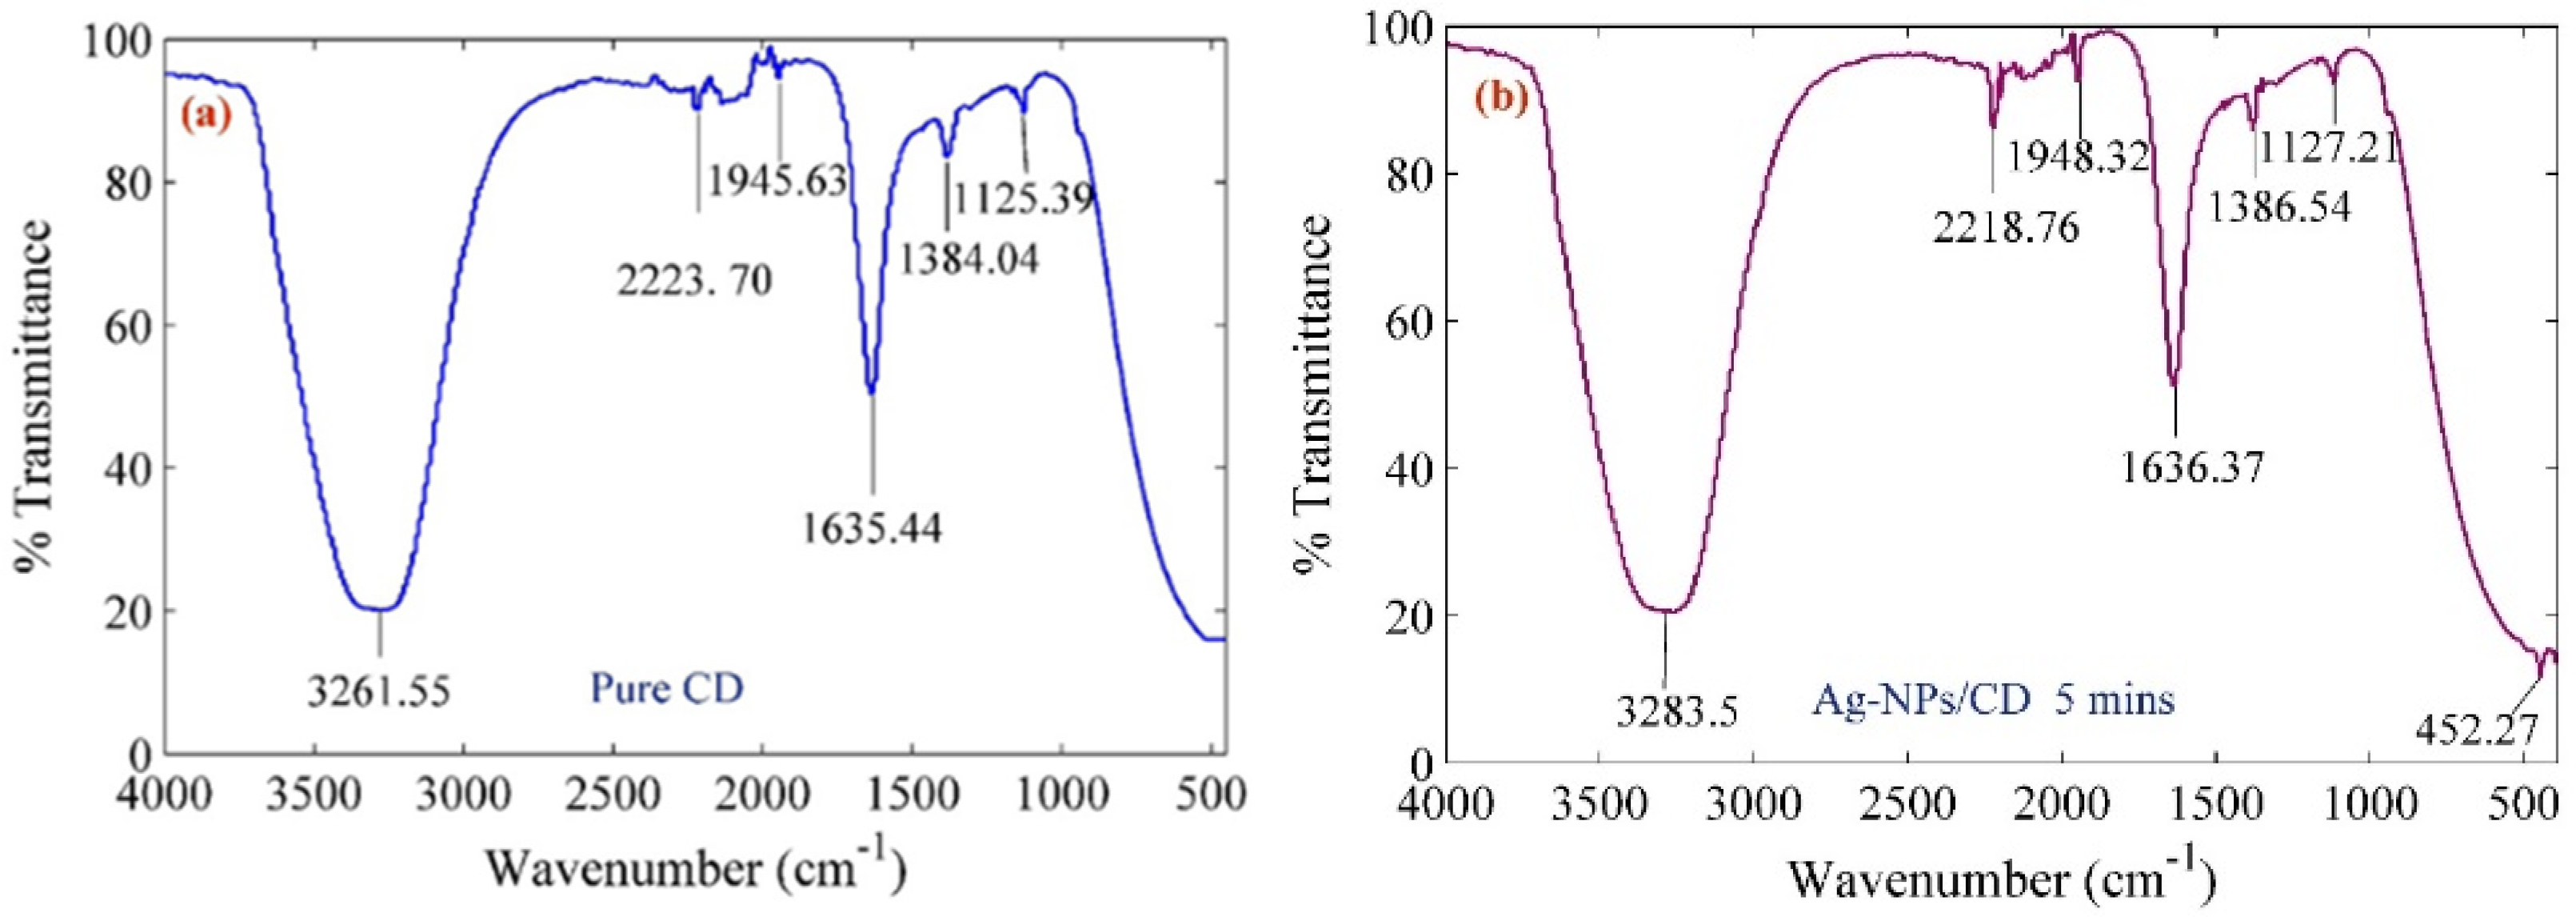
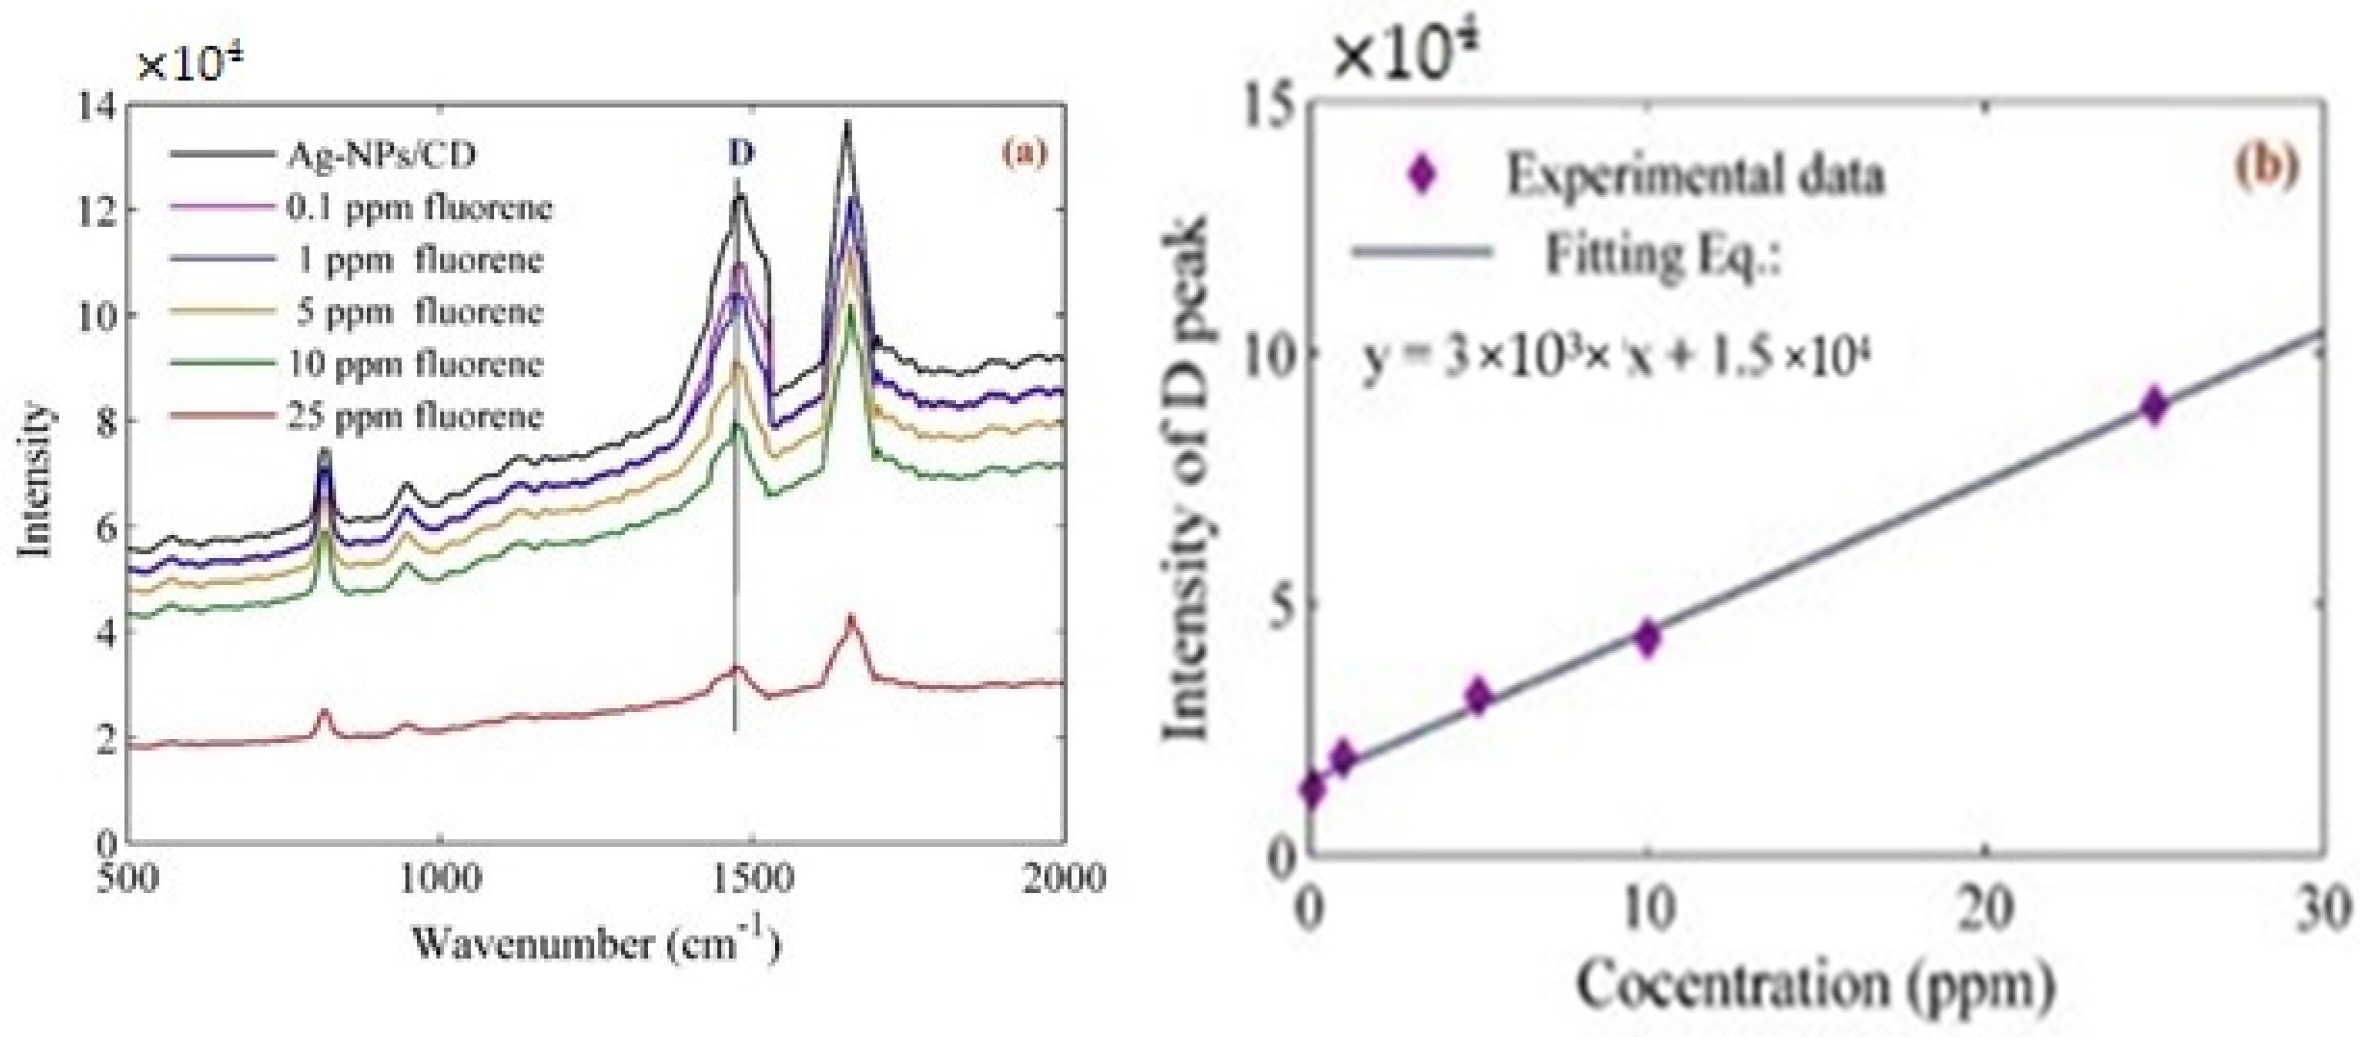
3.6. Raman Spectroscopy
3.7. Preparation of Fluoride Solution
4. Conclusions
Author Contributions
Funding
Acknowledgments
Conflicts of Interest
References
- Durán, N.; Simões, M.B.; De Moraes, A.C.M.; Fávaro, W.J.; Seabra, A.B.; Nelson, D. Nanobiotechnology of carbon dots: A review. J. Biomed. Nanotechnol. 2016, 12, 1323–1347. [Google Scholar] [CrossRef] [PubMed]
- Yuan, F.; Li, S.; Fan, Z.; Yang, S.; Fan, L.; Yang, S. Shining carbon dots: Synthesis and biomedical and optoelectronic applications. Nano Today 2016, 11, 565–586. [Google Scholar] [CrossRef]
- Molaei, M.J. A review on nanostructured carbon quantum dots and their applications in biotechnology, sensors, and chemiluminescence. Talanta 2019, 196, 456–478. [Google Scholar] [CrossRef] [PubMed]
- Wang, Y.; Hu, A. Carbon quantum dots: Synthesis, properties and applications. J. Mater. Chem. C 2014, 2, 6921–6939. [Google Scholar] [CrossRef] [Green Version]
- Molaei, M.J. Principles, mechanisms, and application of carbon quantum dots in sensors: A review. Anal. Methods 2020, 12, 1266–1287. [Google Scholar] [CrossRef]
- Li, H.; Kang, Z.; Liu, Y.; Lee, S.-T. Carbon nanodots: Synthesis, properties and applications. J. Mater. Chem. 2012, 22, 24230–24253. [Google Scholar] [CrossRef]
- Shen, J.; Zhu, Y.; Yang, X.; Li, C. Graphene quantum dots: Emergent nano-lights for bioimaging, sensors, catalysis and photovoltaic devices. Chem. Commun. 2012, 48, 3686–3699. [Google Scholar] [CrossRef]
- Cao, L.; Wang, X.; Meziani, M.J.; Lu, F.; Wang, H.; Luo, P.G.; Lin, Y.; Harruff, B.A.; Veca, L.M.; Murray, D.; et al. Carbon dots for multiphoton bioimaging. J. Am. Chem. Soc. 2007, 129, 11318–11319. [Google Scholar] [CrossRef] [Green Version]
- Zhu, S.; Meng, Q.; Wang, L.; Zhang, J.; Song, Y.; Jin, H.; Zhang, K.; Sun, H.; Wang, H.-Y.; Yang, B. Highly Photoluminescent carbon dots for multicolor patterning, sensors, and Bioimaging. Angew. Chem. 2013, 125, 4045–4049. [Google Scholar] [CrossRef]
- Li, H.; He, X.; Kang, Z.; Huang, H.; Liu, Y.; Liu, J.; Lian, S.; Tsang, C.H.A.; Yang, X.; Lee, S.-T. Water-Soluble Fluorescent carbon quantum dots and photocatalyst design. Angew. Chem. Int. Ed. 2010, 49, 4430–4434. [Google Scholar] [CrossRef]
- Chaudhuri, R.G.; Paria, S. Core/Shell nanoparticles: Classes, properties, synthesis mechanisms, characterization, and applications. Chem. Rev. 2011, 112, 2373–2433. [Google Scholar] [CrossRef] [PubMed]
- Chouhan, N. Silver nanoparticles: Synthesis, characterization and applications. In Silver Nanoparticles–Fabrication, Characterization and Applications; IntechOpen: London, UK, 2018. [Google Scholar]
- Gong, H.M.; Zhou, L.; Su, X.R.; Xiao, S.; Liu, S.D.; Wang, Q.Q. Illuminating dark plasmons of silver nanoantenna rings to enhance exciton-plasmon interactions. Adv. Funct. Mater. 2009, 19, 298–303. [Google Scholar] [CrossRef]
- Jin, J.C.; Xua, Z.; Dong, P.; Lai, L.; Lan, J.Y.; Jiang, F.L.; Liu, Y. One-step synthesis of silver nanoparticles using carbon dots as reducing and stabilizing agents and their antibacterial mechanisms. Carbon 2015, 94, 129–141. [Google Scholar] [CrossRef]
- Dong, Y.; Wang, Q.; Wan, L.; You, X.; Chi, Y. Carbon based dot capped silver nanoparticles for efficient surface-enhanced Raman scattering. J. Mater. Chem. C 2016, 4, 7472–7477. [Google Scholar] [CrossRef]
- Wang, C.; Ding, Y.; Bi, X.; Luo, J.; Wang, G.; Lin, Y. Carbon quantum dots-Ag nanoparticle complex as a highly sensitive “turn-on” fluorescent probe for hydrogen sulfide: A DFT/TD-DFT study of electronic transitions and mechanism of sensing. Sens. Actuators B Chem. 2018, 264, 404–409. [Google Scholar] [CrossRef]
- Shen, L.; Chen, M.; Hu, L.; Chen, X.; Wang, J.H. Growth and stabilization of silver nanoparticles on carbon dots and sensing application. Langmuir 2013, 29, 16135–16140. [Google Scholar] [CrossRef]
- Sinduja, B.; John, S.A. Silver nanoparticles capped with carbon dots as a fluorescent probe for the highly sensitive “off–on” sensing of sulfide ions in water. Anal. Bioanal. Chem. 2019, 411, 2597–2605. [Google Scholar] [CrossRef]
- Yoo, D.; Park, Y.; Cheon, B.; Park, M.H. Carbon dots as an effective fluorescent sensing platform for metal ion detection. Nanoscale Res. Lett. 2019, 14, 213–272. [Google Scholar] [CrossRef] [Green Version]
- Kim, M.; Osone, S.; Yeom, G.Y.; Higashi, H.; Seto, T. Synthesis of nanoparticles by laser ablation: A review. KONA Powder Part. J. 2017, 34, 80–90. [Google Scholar] [CrossRef] [Green Version]
- Sadrolhosseini, A.R.; Rashid, S.; Shafie, S.; Soleimani, H. Laser ablation synthesis of Ag nanoparticles in graphene quantum dots aqueous solution and optical properties of nanocomposite. Appl. Phys. A 2019, 125, 82. [Google Scholar] [CrossRef]
- Sadrolhosseini, A.R.; Rashid, S.; Zakaria, A. Synthesis of gold nanoparticles dispersed in palm oil using laser ablation technique. J. Nanomater. 2017, 2017, 6496390. [Google Scholar] [CrossRef] [Green Version]
- Sadrolhosseini, A.R.; Rashid, S.A.; Zakaria, A.; Shameli, K. Green fabrication of copper nanoparticles dispersed in walnut oil using laser ablation technique. J. Nanomater. 2016, 2016, 8069685. [Google Scholar] [CrossRef]
- Wang, R.; Lu, K.Q.; Tang, Z.R.; Xu, Y.J. Recent progress in carbon quantum dots: Synthesis, properties and applications in photocatalysis. J. Mater. Chem. A 2017, 5, 3717–3734. [Google Scholar] [CrossRef]
- Zhou, X.; Gao, J.; Huang, H.; Wu, Q.; Ji, X. Surface-enhanced Raman spectroscopy for tellurium detection by AgNPs-loaded 3D porous graphene hydrogel. Micro Nano Lett. 2017, 12, 12. [Google Scholar] [CrossRef]
- Song, H.; Li, X.; Yoo, S.; Wu, Y.; Liu, W.; Wang, X.; Liu, H. Highly sensitive surface enhanced Raman spectroscopy from ag nanoparticles decorated graphene sheet. J. Nanomater. 2014, 2014, 538024. [Google Scholar] [CrossRef]
- Zhai, Z.; Nie, M.; Guan, Y.; Zhang, F.; Chen, L.; Du, W.; Liu, G.; Tian, Y.; Huang, Q. A microfluidic surface-enhanced Raman spectroscopy approach for assessing the particle number effect of AgNPs on cytotoxicity. Ecotoxicol. Environ. Saf. 2018, 162, 529–535. [Google Scholar] [CrossRef]
- Zhang, K.; Liu, X.; Man, B.; Yang, C.; Zhang, C.; Liu, M.; Zhang, Y.; Liu, L.; Chen, C. Label-free and stable serum analysis based on Ag-NPs/PSi surface-enhanced Raman scattering for noninvasive lung cancer detection. Biomed. Opt. Express 2018, 9, 4345–4358. [Google Scholar] [CrossRef]
- Muntean, C.M.; Dina, N.E.; Coroş, M.; Toşa, N.; Turza, A.I.; Dan, M. Graphene/silver nanoparticles-based surface-enhanced Raman spectroscopy detection platforms: Application in the study of DNA molecules at low pH. J. Raman Spectrosc. 2019, 50, 1849–1860. [Google Scholar] [CrossRef]
- Dung, M.X.; Le, Q.T.; Nguuyen, L.A.; Thi, P.N.; Thi, P.L.; La, H.V. Photosynthesis of silver nanoparticle–Carbon quantum dots nanocomposites. material. Sci. Res. India 2019, 16, 118–124. [Google Scholar]
- Bhunia, S.K.; Zeiri, L.; Manna, J.; Nandi, S.; Jelinek, R. Carbon-Dot/Silver-nanoparticle flexible SERS-Active films. ACS Appl. Mater. Interfaces 2016, 8, 25637–25643. [Google Scholar] [CrossRef]
- Lu, G.; Li, H.; Liusman, C.; Yin, Z.; Wu, S.; Zhang, H. Surface enhanced Raman scattering of Ag or Au nanoparticle-decorated reduced graphene oxide for detection of aromatic molecules. Chem. Sci. 2011, 2, 1817–1821. [Google Scholar] [CrossRef] [Green Version]
- Haick, H. Chemical sensors based on molecularly modified metallic nanoparticles. J. Phys. D Appl. Phys. 2007, 40, 7173–7186. [Google Scholar] [CrossRef]
- Raman Spectroscopy. Available online: http://en.wikipedia.org/wiki/Raman_spectroscopy (accessed on 2 January 2013).
- Cocola, L.; Tondello, G.; Poletto, L. A non-dispersive approach for a Raman gas sensor. SN Appl. Sci. 2020, 2, 1–8. [Google Scholar] [CrossRef] [Green Version]
- McCreery, R.L. Raman spectroscopy for chemical analysis. Meas. Sci. Technol. 2001, 12, 653–654. [Google Scholar] [CrossRef] [Green Version]
- Mogilevsky, G.; Borland, L.; Brickhouse, M.; Iii, A.W.F. Raman spectroscopy for homeland security applications. Int. J. Spectrosc. 2012, 2012, 808079. [Google Scholar] [CrossRef] [Green Version]
- Tian, L.; Ghosh, D.; Chen, W.; Pradhan, S.; Chang, X.; Chen, S. nanosized carbon particles from natural gas soot. Chem. Mater. 2009, 21, 2803–2809. [Google Scholar] [CrossRef]
- Jhonsi, M.A.; Thulasi, S. A novel fluorescent carbon dots derived from tamarind. Chem. Phys. Lett. 2016, 661, 179–184. [Google Scholar] [CrossRef]
- Zhu, S.; Song, Y.; Zhao, X.; Shao, J.; Zhang, J.; Yang, B. The photoluminescence mechanism in carbon dots (graphene quantum dots, carbon nanodots, and polymer dots): Current state and future perspective. Nano Res. 2015, 8, 355–381. [Google Scholar] [CrossRef]
- Dager, A.; Uchida, T.; Maekawa, T.; Tachibana, M. Synthesis and characterization of Mono-disperse Carbon Quantum dots from fennel seeds: Photoluminescence analysis using machine learning. Sci. Rep. 2019, 9, 14004–14012. [Google Scholar] [CrossRef]
- Zuo, J.; Jiang, T.; Zhao, X.; Xiong, X.; Xiao, S.; Zhu, Z. Preparation and application of fluorescent carbon dots. J. Nanomater. 2015, 2015, 787862. [Google Scholar] [CrossRef] [Green Version]
- Sadrolhosseini, A.R.; Rashid, S.A.; Shafie, S.; Nezakati, H. Laser ablation synthesis of gold nanoparticle to enhance the fluorescence properties of graphene quantum dots. J. Laser Appl. 2019, 31, 022006. [Google Scholar] [CrossRef]
- Chen, C.; Long, M.; Wu, H.; Cai, W. One-step synthesis of Pt nanoparticles/reduced graphene oxide composite with enhanced electrochemical catalytic activity. Sci. China Ser. B Chem. 2012, 56, 354–361. [Google Scholar] [CrossRef]
- Kim, W.J.; Basavaraja, C.; Thinh, P.X.; Huh, D.S. Structural characterization and DC conductivity of honeycomb-patterned poly(“-caprolactone)/gold nanoparticle-reduced graphite oxide composite films. Mater. Lett. 2013, 90, 14–18. [Google Scholar] [CrossRef]
- Sadrolhosseini, A.R.; Habibiasr, M.; Shafie, S.; Solaimani, H.; Lim, H.N. Optical and thermal properties of laser-ablated platinum nanoparticles graphene oxide composite. Int. J. Mol. Sci. 2019, 20, 6153. [Google Scholar] [CrossRef] [Green Version]
- Uthayakumar, G.S.; Senthilkumar, P.; Inbasekaran, S.; Sivasubramanian, A.; Jacob, S.J.P. Nanoparticle analysis for various medicinal drugs and human body saliva at macromolecular level. Appl. Nanosci. 2014, 5, 563–568. [Google Scholar] [CrossRef] [Green Version]
- Gui, R.; Jin, H.; Xia, J.; Liu, X.; Wang, Z.; Zhang, F.; Yang, M.; Bi, S. Retraction: N, S co-doped graphene quantum dots from a single source precursor used for photodynamic cancer therapy under two-photon excitation. Chem. Commun. 2015, 51, 10066. [Google Scholar] [CrossRef] [Green Version]
- Tsekov, R.; Georgiev, P.; Simeonova, S.; Balashev, K. Quantifying the blue shift in the light absorption of small gold nanoparticles. C. R. Acad. Bulg. Sci. 2017, 70, 1237–1246. [Google Scholar]
- Zamiri, R.; Zakaria, A.; Ahangar, H.A.; Sadrolhosseini, A.R.; Mahdi, M. Fabrication of silver nanoparticles dispersed in palm oil using laser ablation. Int. J. Mol. Sci. 2010, 11, 4764–4770. [Google Scholar] [CrossRef]
- Mock, J.J.; Barbic, M.; Smith, D.R.; Schultz, D.A.; Schultz, S. Shape effects in plasmon resonance of individual colloidal silver nanoparticles. J. Chem. Phys. 2002, 116, 6755–6759. [Google Scholar] [CrossRef]
- Mafuné, F.; Kohno, J.Y.; Takeda, Y.; Kondow, T.; Sawabe, H. Structure and stability of silver nanoparticles in aqueous solution produced by laser ablation. J. Phys. Chem. B 2000, 104, 8333–8337. [Google Scholar] [CrossRef]
- Kabashin, A.; Meunier, M. Synthesis of colloidal nanoparticles during femtosecond laser ablation of gold in water. J. Appl. Phys. 2003, 94, 7941–7943. [Google Scholar] [CrossRef] [Green Version]
- Balderas-Lopez, J.A.; Acosta-Avalos, D.; Alvarado, J.J.; Zelaya-Angel, O.; Sanchez-Sinencio, F.; Falcony, C.; Cruz-Orea, A.; Vargas, H. Photoacoustic measurements of transparent liquid samples: Thermal effusivity. Meas. Sci. Technol. 1995, 6, 1163–1168. [Google Scholar] [CrossRef]
- Abdullah, M.; Bakhtiar, H.; Aziz, M.S.A.; Krishnan, G.; Ropi, N.A.M.; Kasim, N.; Adnan, N.N. Thermally induced optical nonlinearity in colloidal alloy nanoparticles synthesized by laser ablation. Appl. Phys. A 2019, 125, 155. [Google Scholar] [CrossRef]
- Abdullah, M.; Bakhtiar, H.; Krishnan, G.; Aziz, M.; Danial, W.; Islam, S. Transition from saturable absorption to reverse saturable absorption of carmoisine dye under low-powered continuous wave laser excitation. Opt. Laser Technol. 2019, 115, 97–103. [Google Scholar] [CrossRef]
- Kanipe, K.N.; Chidester, P.P.F.; Stucky, G.D.; Moskovits, M. Large Format surface-enhanced raman spectroscopy substrate optimized for enhancement and uniformity. ACS Nano 2016, 10, 7566–7571. [Google Scholar] [CrossRef]
- Roy, A.K.; Park, S.Y.; Kim, S.M.; Paoprasert, P.; In, I. Preparation of biocompatible and antibacterial carbon quantum dots derived from resorcinol and formaldehyde spheres. RSC Adv. 2015, 5, 31677–31682. [Google Scholar] [CrossRef]
Sample Availability: Samples of the compounds are available from the authors. |


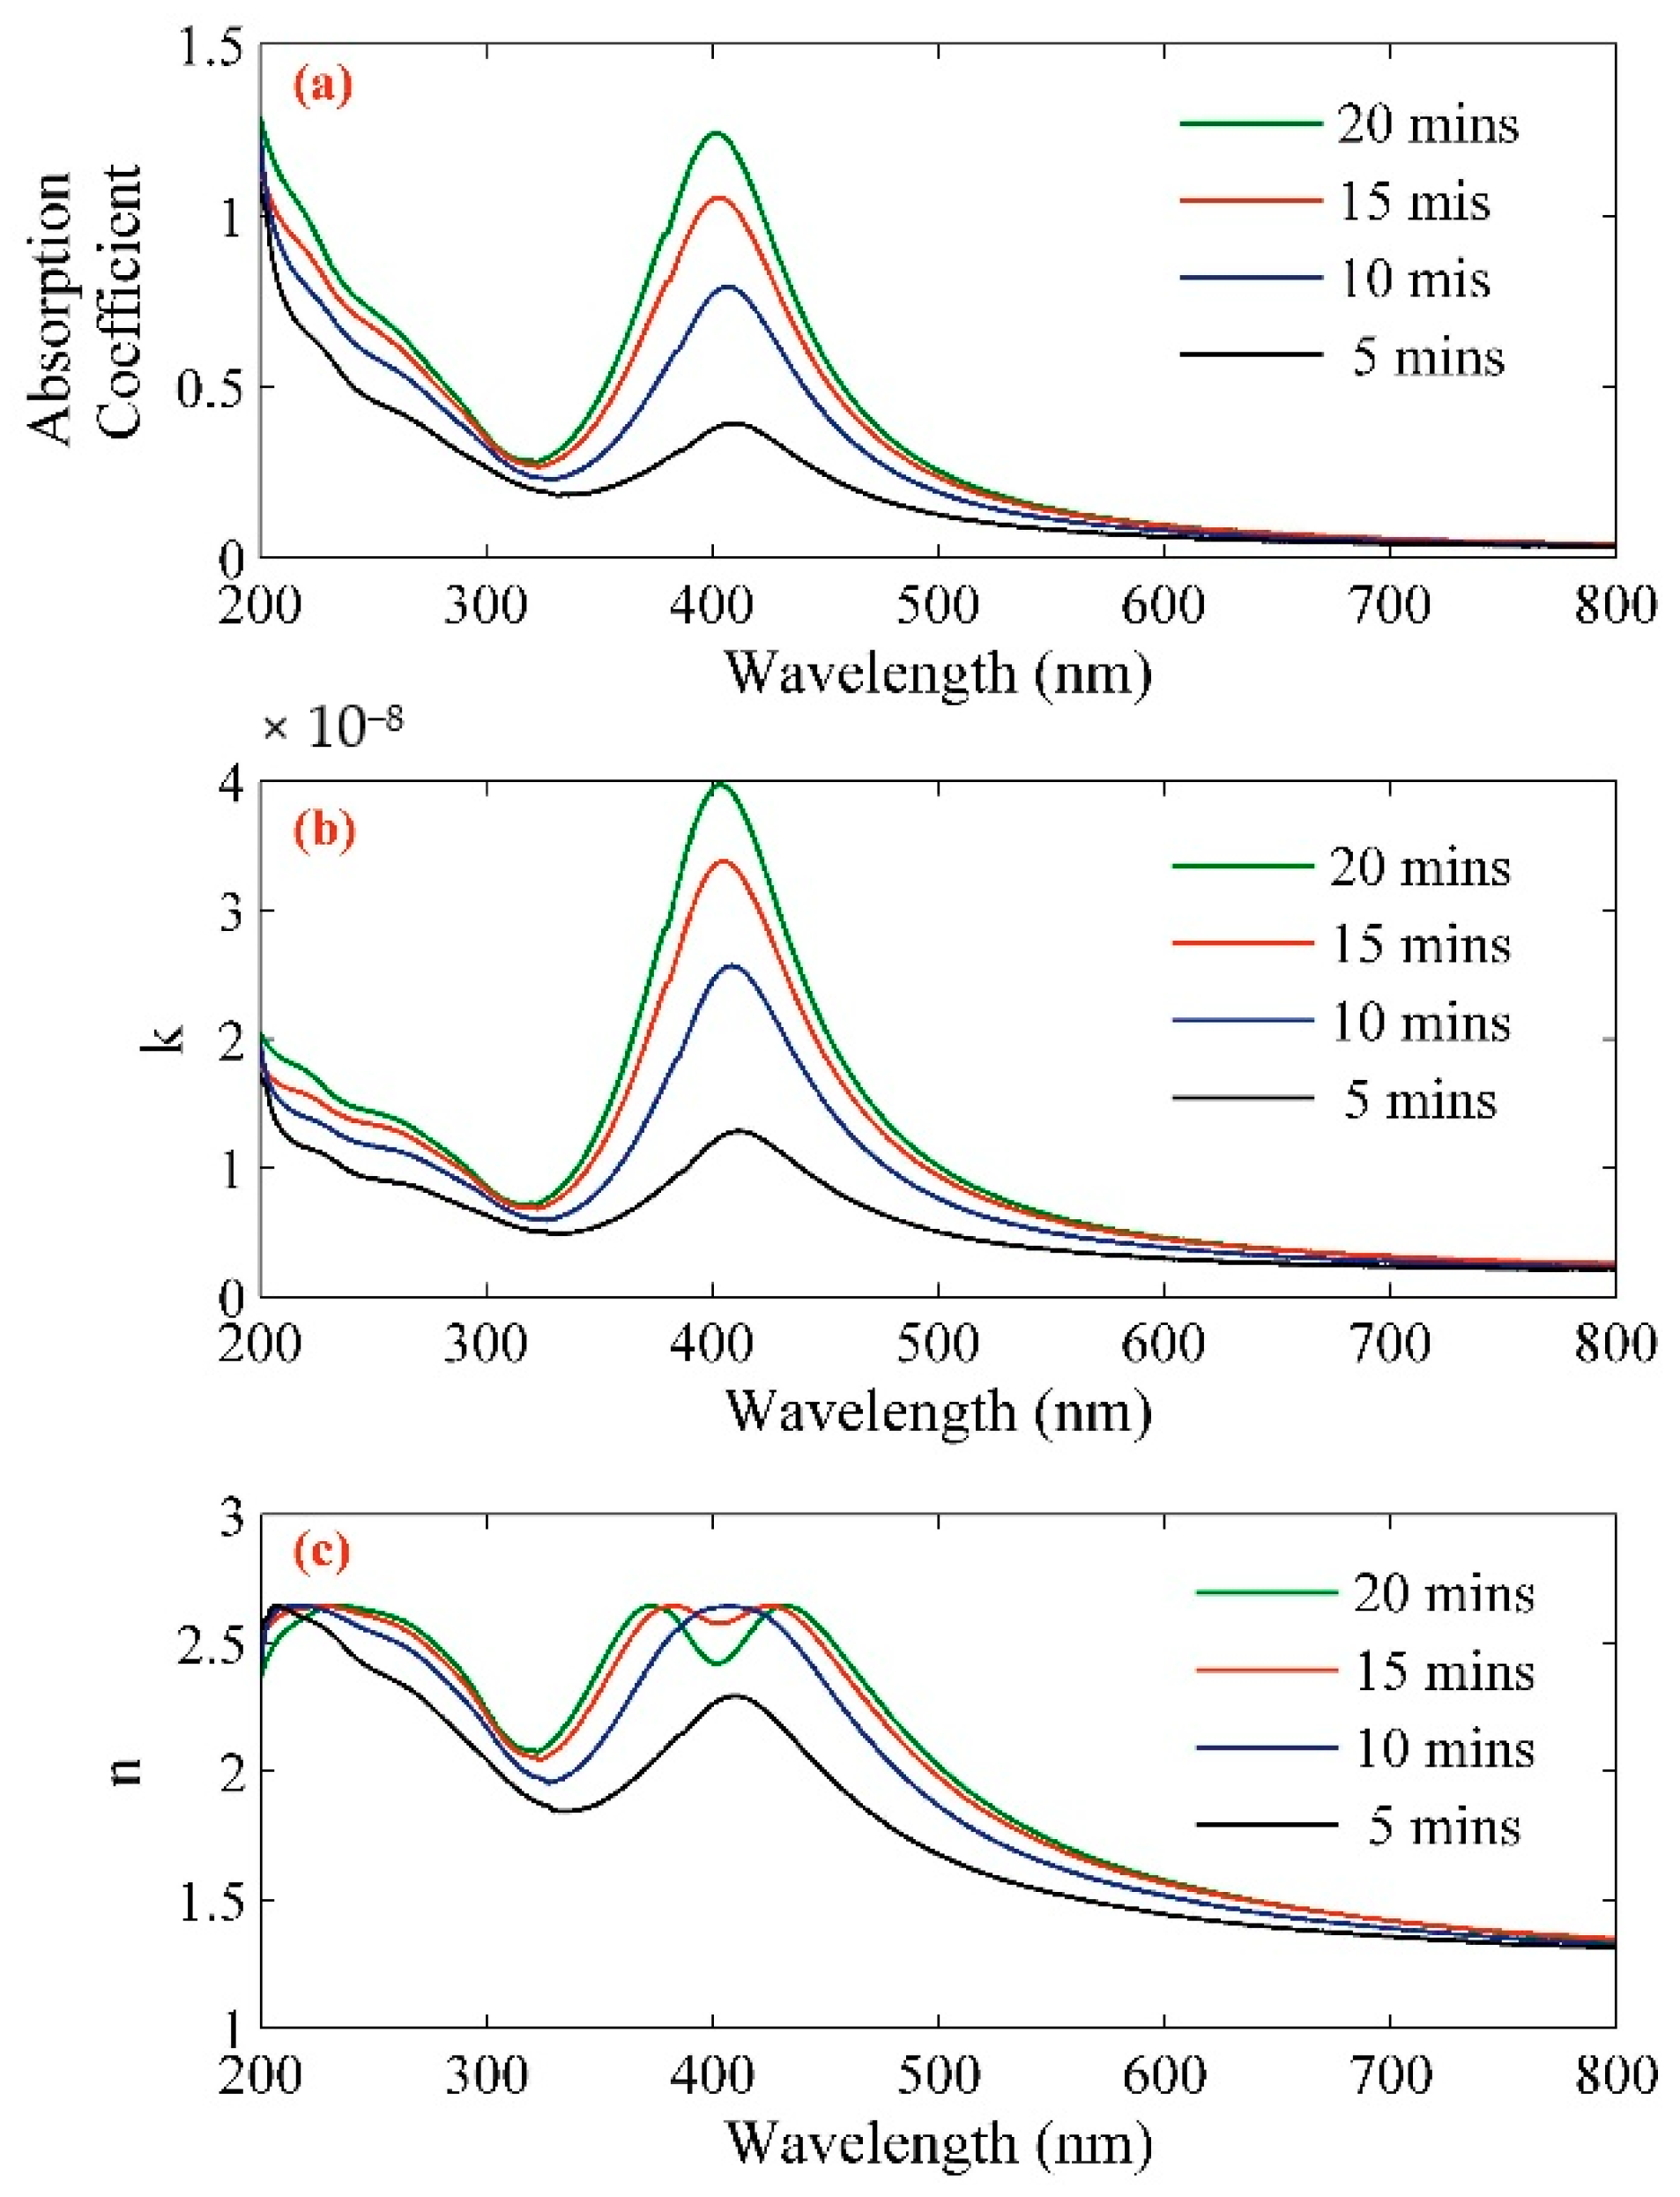
| Sample | Concentration (ppm) | Volume Fraction (×10−6) | Absorption Coefficient (at 532 nm) | n (at 532 nm) | k × 10−9 (at 532 nm) |
|---|---|---|---|---|---|
| Ag–NPs/CD 5 min | 2.5 | 0.130 | 0.094 | 1.5676 | 3.94 |
| Ag–NPs/CD 10 min | 5.1 | 0.264 | 0.134 | 1.6979 | 5.65 |
| Ag–NPs/CD 15 min | 8.3 | 0.430 | 0.163 | 1.7836 | 6.87 |
| Ag–NPs/CD 20 min | 11.4 | 0.591 | 0.173 | 1.8129 | 7.32 |
| Sample | P3 (×102) | Thermal Effusivity (W s1/2 cm−2 K−1) |
|---|---|---|
| Water | 0.469 | 0.159 |
| Ethylene Glycol | 0.274 | 0.093 |
| Pure CD | 0.631 | 0.218 |
| Ag–NPs/CD 5 min | 0.717 | 0.243 |
| Ag–NPs/CD 10 min | 0.914 | 0.310 |
| Ag–NPs/CD 15 min | 1.088 | 0.369 |
| Ag–NPs/CD 20 min | 1.377 | 0.467 |
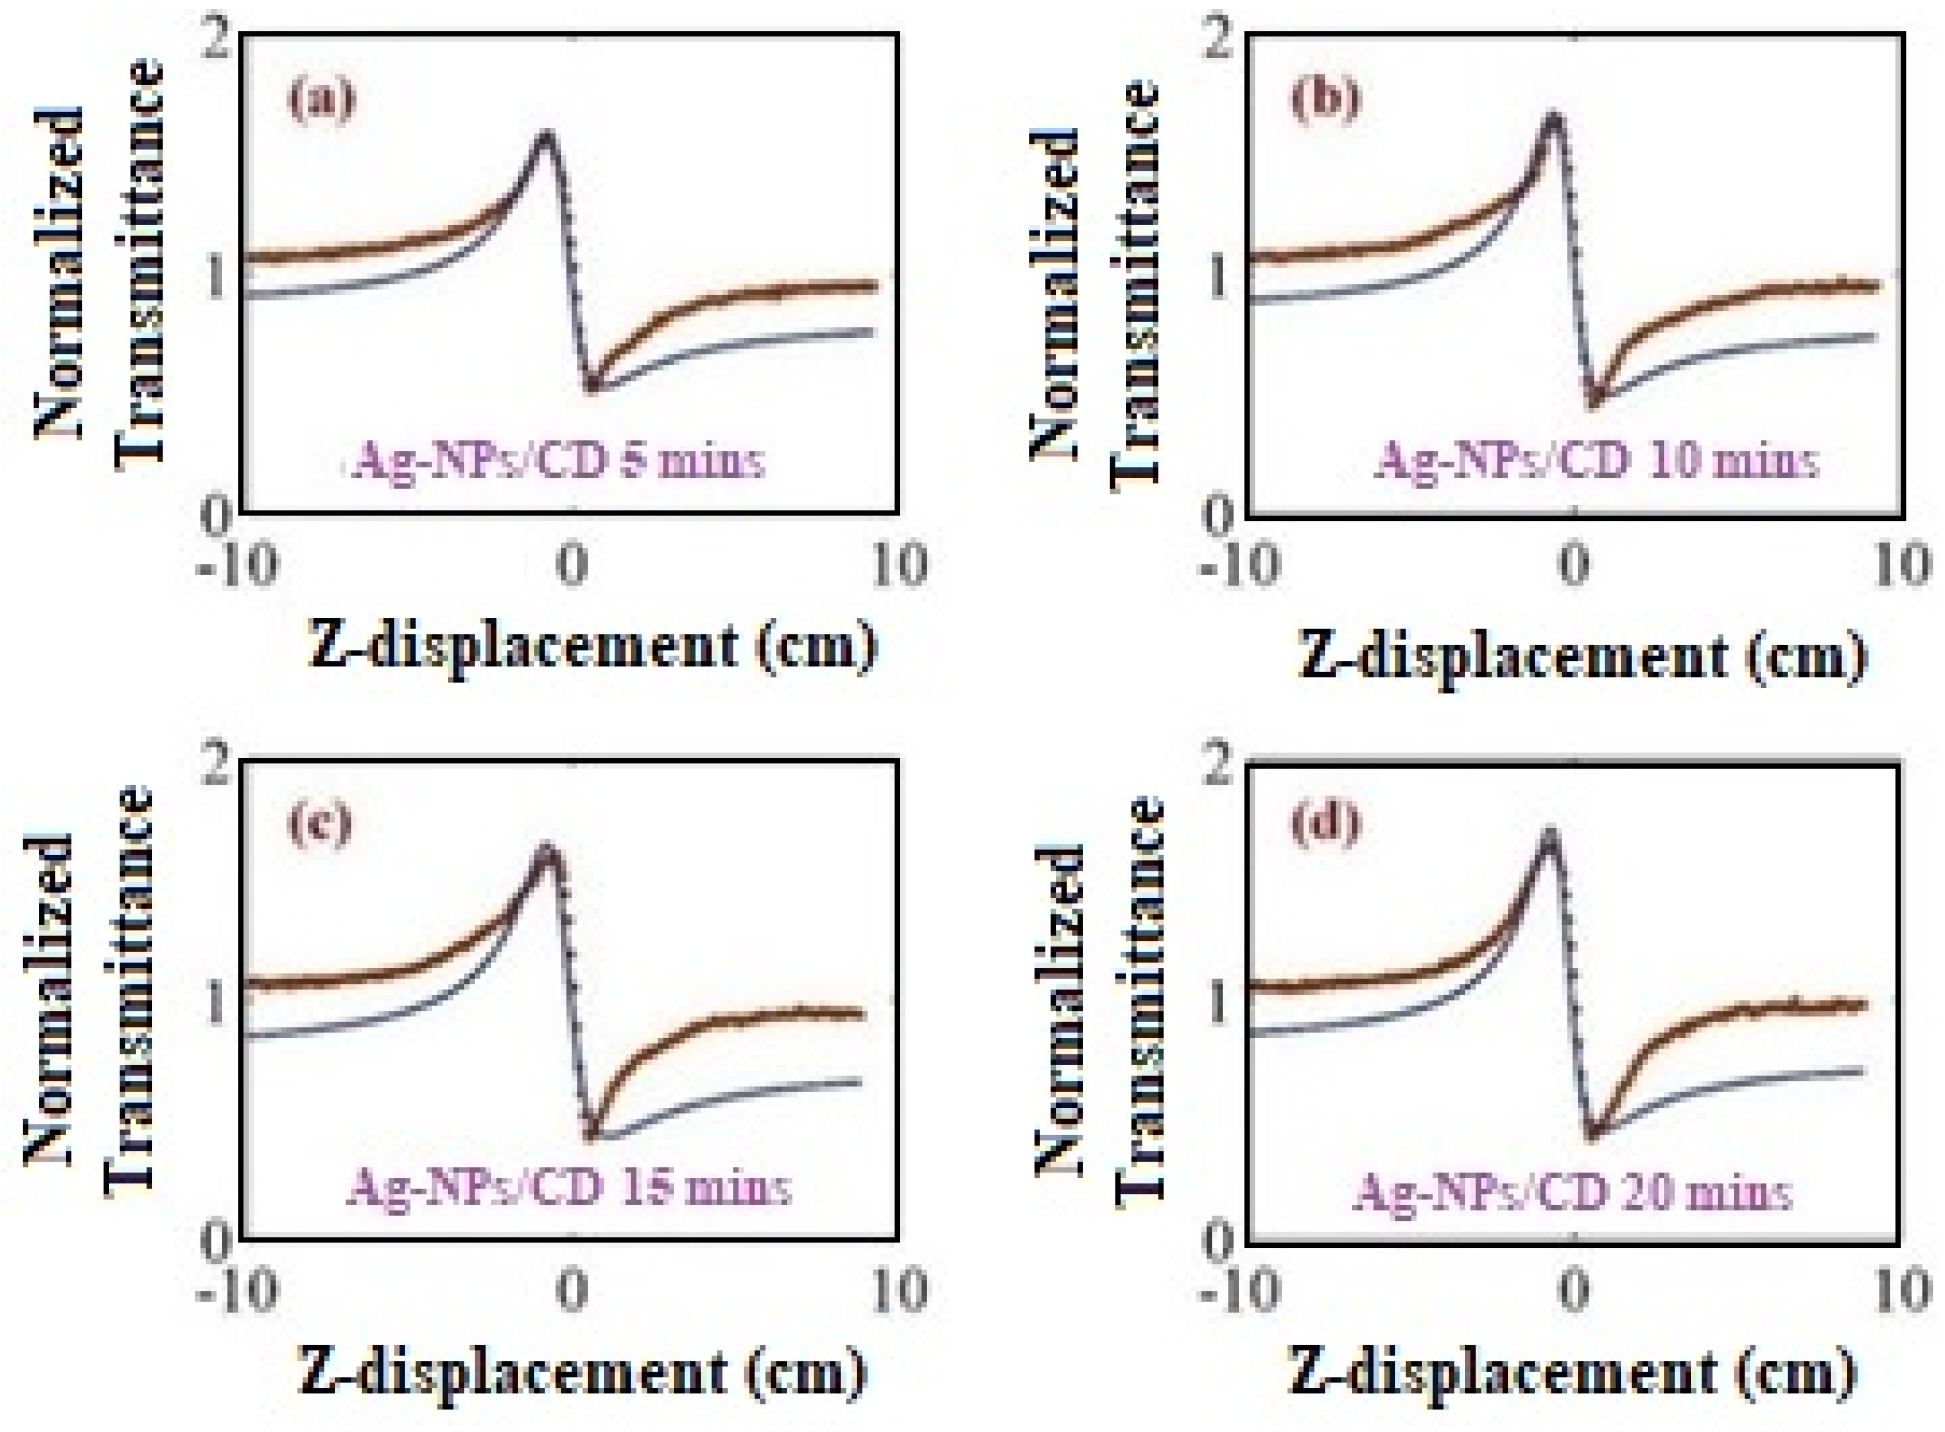
| Samples | −n2 (×10−10 cm2 W−1) | −Re (x3 × 10−8 esu) |
|---|---|---|
| Ag–NPs/CD 5 min | 7.377 | 5.40 |
| Ag–NPs/CD 10 min | 9.556 | 6.99 |
| Ag–NPs/CD 15 min | 9.184 | 6.71 |
| Ag–NPs/CD 20 min | 9.527 | 6.97 |
Publisher’s Note: MDPI stays neutral with regard to jurisdictional claims in published maps and institutional affiliations. |
© 2020 by the authors. Licensee MDPI, Basel, Switzerland. This article is an open access article distributed under the terms and conditions of the Creative Commons Attribution (CC BY) license (http://creativecommons.org/licenses/by/4.0/).
Share and Cite
Sadrolhosseini, A.R.; Krishnan, G.; Shafie, S.; Abdul Rashid, S.; Wadi Harun, S. Optical and Photoacoustic Properties of Laser-Ablated Silver Nanoparticles in a Carbon Dots Solution. Molecules 2020, 25, 5798. https://doi.org/10.3390/molecules25245798
Sadrolhosseini AR, Krishnan G, Shafie S, Abdul Rashid S, Wadi Harun S. Optical and Photoacoustic Properties of Laser-Ablated Silver Nanoparticles in a Carbon Dots Solution. Molecules. 2020; 25(24):5798. https://doi.org/10.3390/molecules25245798
Chicago/Turabian StyleSadrolhosseini, Amir Reza, Ganesan Krishnan, Suhaidi Shafie, Suraya Abdul Rashid, and Sulaiman Wadi Harun. 2020. "Optical and Photoacoustic Properties of Laser-Ablated Silver Nanoparticles in a Carbon Dots Solution" Molecules 25, no. 24: 5798. https://doi.org/10.3390/molecules25245798