
Spectroscopic Methods Used in Implant Material Studies
by
 , ,
, ,
Sławomir Lach
*,† ,
,
Przemysław Jurczak
†,
Natalia Karska
,
Agnieszka Kubiś
,
Aneta Szymańska
and
Sylwia Rodziewicz-Motowidło
* Department of Biomedical Chemistry, Faculty of Chemistry, University of Gdańsk, Wita Stwosza 63, 80-308 Gdańsk, Poland
*
Authors to whom correspondence should be addressed.
†
These authors contributed equally to this work.
Molecules 2020, 25(3), 579; https://doi.org/10.3390/molecules25030579
Submission received: 1 January 2020
/
Revised: 18 January 2020
/
Accepted: 25 January 2020
/
Published: 29 January 2020
(This article belongs to the Special Issue Practical Applications of Molecular Spectroscopy)
Abstract
:It is recognized that interactions between most materials are governed by their surface properties and manifest themselves at the interface formed between them. To gain more insight into this thin layer, several methods have been deployed. Among them, spectroscopic methods have been thoroughly evaluated. Due to their exceptional sensitivity, data acquisition speed, and broad material tolerance they have been proven to be invaluable tools for surface analysis, used by scientists in many fields, for example, implant studies. Today, in modern medicine the use of implants is considered standard practice. The past two decades of constant development has established the importance of implants in dentistry, orthopedics, as well as extended their applications to other areas such as aesthetic medicine. Fundamental to the success of implants is the knowledge of the biological processes involved in interactions between an implant and its host tissue, which are directly connected to the type of implant material and its surface properties. This review aims to demonstrate the broad applications of spectroscopic methods in implant material studies, particularly discussing hard implants, surface composition studies, and surface–cell interactions.
1. Introduction
The enormous amount of scientific methods used today is a consequence of the multitude of hypotheses and problems tackled by the research community. One such problem is understanding the origin and complexity of interactions between materials. Extensive studies revolving around various materials and their interactions have led to the conclusion that in the majority of cases, the surface properties of the material have the most profound effect on its interplay with its surroundings and govern its short- and long-term behavior. Useful methods of study that focus on material interface should be able to deliver (i) qualitative information, (ii) quantitative information, (iii) be of a nondestructive character, (iv) tolerate a broad type of substrates, and (v) be relatively simple in use and interpretation. Of course, no method spanning all these conditions exists, and therefore scientists often choose several approaches to gather the necessary data. Nevertheless, there is a group of methods that can meet most of the requirements which fall into the general category of spectroscopic methods.
Over the last decades, spectroscopic methods have been applied in numerous studies revolving around analytical, biophysical and physical, or organic chemistry and material science. Examples of applied spectroscopic methods include agriculture and food analysis [1,2], environmental problem analysis [3,4], catalyst evaluation [5,6], chemical mapping [7], polymer analysis [8,9], biological surfaces [10], cellular [11,12,13] and tissue analysis [14,15,16,17], biosensing [18,19], and clinical applications [20,21,22].
Spectroscopy, according to the International Union of Pure and Applied Chemistry (IUPAC) [23], is defined as “the study of physical systems by the electromagnetic radiation with which they interact or that they produce. In certain types of optical spectroscopy, the radiation originates from an external source and is modified by the system, whereas in other types, the radiation originates within the system itself”. Following this definition comes a broad group of techniques, many of which, for example, X-ray photoelectron spectroscopy or Raman spectroscopy, are known for their vast scope, applicability, and reliability.
One of the areas that combines features of various scientific fields, for example, already mentioned material science and biophysical chemistry, and has benefited from developments in spectroscopy is implantology. Several past decades are marked with incredible advances in this area, especially regarding dental implants and bone prosthetics. Implant geometry, material type, and implant coating have all been the subjects of intensive studies, however, it has been proven that the material and coating type have the biggest impact on implantation success. Evaluation of material and coating characteristics have very often been performed with the use of suitable spectroscopic methods.
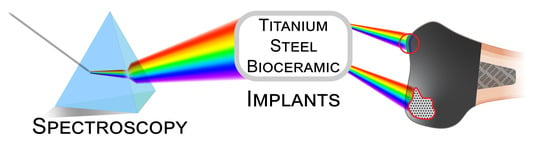
The purpose of this review is to bring together and highlight the most common methods used in the evaluation of implants and implant-tissue interfaces, with respect to the types of materials used. This review focuses on “hard” (metal and ceramic) implants and includes methods that focus on cell behavior analysis which is important for the analysis of the degree of material impact on the surrounding tissue (Figure 1).
2. Metal-Based Implants
Metal implants [24,25], especially titanium-based implants, have taken the major share of the implant market. Owing to the ease of manufacture and relatively low costs they are the number one choice for dental and orthopedic applications, with new advancements being constantly brought to light [25,26]. The broad use of metal-based implants made them a subject of extensive evaluation utilizing spectroscopic methods.
2.1. Steel, Titanium, and Titanium Alloy-Based Implants
2.1.1. Auger Electron Spectroscopy
Auger electron spectroscopy (AES) is considered a very well-known analytical technique utilized in material science for surface-related studies. It uses an electron beam, which is directed at the analysis spot (ranging from 10 nm to 5 µm) and ejects electrons from the sample of interest, usually a conductive or semiconductive material. With the sampling depth varying between 1 to 5 nm (2 to 10 atomic layers), AES offers very high spatial resolution. Due to its nature, AES carries several limitations of which probably the most important ones are (i) the inability to analyze elements of fewer than three electrons (such as hydrogen and helium) and (ii) significantly better detection of lighter elements. Both of these restrictions stem from the physics behind the Auger process which is beyond the scope of this review and can be found elsewhere [27,28]. Finally, due to the utilization of an electron beam, AES can lead to sample deterioration or destruction, and therefore beam current densities need to be adjusted, especially when the sample is of great importance.
AES has many applications, mainly revolving around film growth [29,30,31], surface chemical composition [32,33], grain boundaries analysis [34,35], or quality control surface analysis in integrated circuits production [34,36]. Early reports of AES used in implant-related studies date back to 1985 to 1986, when Sundgren et al. [37,38] focused on understanding the mechanisms governing reactions occurring at the interface between a stainless-steel implant and tissue. Supported by scanning electron microscopy (SEM) and depth profiling, authors of the study presented several interesting results. First, the variation of the nature and thickness of the (mainly) chromium-based oxide present on the surface of the implant was attributed to the location of the implant. The thickness of an initially present 50 Å-thick layer varied with respect to the location of the implant; implants located in the cortical bone had the thickness of the oxide unchanged while the ones located in the bone marrow were thicker by a factor of three to four. Furthermore, in both cases, calcium and phosphorus were incorporated into the oxide. On the other hand, the oxide layer on implants located in the soft tissue within the oral cavity was only 1.5 times thicker as compared with the initial thickness of 50 Å. Interestingly, in the last case, instead of calcium and phosphorus, sulfur was present within the oxide layer. The authors proposed several hypotheses, along with possible mechanisms to justify such a discrepancy of the oxide thickness which included: (i) the difference in oxygen concentration along the implant, (ii) electron transfer mediated by proteins adsorbed on the surface, (iii) pH variation, and (iv) a combination of high protein concentration accompanied with high concentrations of the electrolyte.
The occurrence of calcium has been explained as a result of its co-precipitation together with phosphate ions, which can originate from various sources in body fluids. Because experimental results have pointed to the thickest oxide layer to be found in the bone marrow, a place of high metabolic activity requiring highly energetic phosphate bonds to be broken, it is reasonable to consider this as an additional driving force behind the oxide formation. Interestingly, it has been reported that the amount of sulfur also varied with respect to the placement of an implant, with its highest amount traced back to implants located in the oral part of the body. It has been unclear at that moment, what was the main sources of sulfur identified on the implant surface. Among many possibilities, authors have mentioned proteins adsorbed on the surface of the implant and chondroitin sulfate-containing proteoglycans, although none of these sources is location specific, therefore, it has not been possible to determine why only oral-region implants contained sulfur.
An early example of utilizing AES in an analysis of titanium implant surfaces [39] dates back to the late 1990s. The author of the referred paper focused on establishing a relationship between surface properties and the biological response to the material. In this example, titanium surfaces were prepared in the following four different ways: (i) machining, (ii) electropolishing, (iii) thermal oxidation, and (iv) nitrogen ion implantation. All these methods have been, among other techniques, also the subject of AES analysis. Furthermore, the author compared the results obtained for pure titanium with the results for the Ti6Al4V alloy and added observations resulting from biological studies. An AES spectrum from the above-cited paper is shown in Figure 2.
The data clearly demonstrate that the Auger peaks can be used to distinguish between different titanium oxides, while, at the same time, underlining the dependency of the results on analysis parameters (electron beam energy and dose). An example of such dependency can be observed in the change of the Ti LMV transition peak (≈420 eV) in Figure 2, starting from the bottom spectrum, where the electron beam intensity and dose are lowest and below the threshold for significant oxygen desorption to occur, and finishing with the topmost spectrum, with a probable Ti2O3-like oxide composition due to excessive beam intensity. These results have been utilized for comparison with data obtained with X-ray photoelectron spectroscopy (XPS), explained in detail later, and, as previously mentioned, for surfaces prepared in different ways. The AES results have been in agreement with the XPS data, which helps to establish the reliability of AES spectroscopy. Examples of further experiments are shown in Figure 3. Here, AES has been successfully employed to assess the composition of titanium oxides prepared in various electrolytes (Figure 3a), to compare clinical titanium with nitrogen ion-implanted titanium (Figure 3b), and to evaluate the thickness of the oxide layer as a function of temperature (Figure 3c).
To conclude, in the above referred publication, the author relied on AES as an important tool for implant surface characterization. Used side-by-side and compared with X-ray photoelectron spectroscopy, AES results have been verified and in agreement with XPS data. Despite its potential, in recent years AES has been gradually substituted with X-ray photoelectron spectroscopy. Nevertheless, the existence of such a method should be kept in mind, especially for depth profiling applications.
2.1.2. X-ray Photoelectron Spectroscopy also known as Electron Spectroscopy for Chemical Analysis
X-ray photoelectron spectroscopy (XPS) is probably the most often utilized method for surface studies, often mentioned alongside Auger electron spectroscopy [40], with which XPS shares many similarities such as applicability to all elements, in addition to hydrogen and helium (due to the physics behind the process [41,42]), and possibility of sample deterioration. The main difference between the techniques is the utilization of an X-ray photon in the case of XPS in contrast to an electron beam used in AES. Importantly, this difference leads to greater sensitivity of AES as compared with XPS, as the Auger electrons are ejected from regions closer to other atoms as compared with core-level electrons ejected in XPS. Furthermore, XPS can be applied to a greater variety of materials, adding polymers, glasses, and other insulating materials to the group of conductors and semiconductors typically studied with AES. XPS is used everywhere where surface or thin film composition plays a critical role in performance, including nanomaterials [43,44], photovoltaics [45,46], catalysis [47,48], corrosion [49], and general support of industrial research and manufacturing [50].
One of the early examples referring to the use of XPS in implant surface studies was presented by Lausmaa et al., where X-ray photoelectron spectroscopy was used in a so-called survey surface analysis to determine the initial composition of the surface of machined and autoclaved titanium surface and to trace the changes in the composition after performing further experiments (Figure 4).
In the next example, the authors studied the effect of bacteria on a dental implant surface, with the main focus on the morphology and corrosion of the implant, utilizing XPS [51]. In their experiments, the authors compared results from the “as received” implants with implant samples that had been sputtered in order to remove superficial layers and contaminants from the specimen surface, thus, revealing other oxidation states (Figure 5). The obtained results confirmed that the presence of Streptococcus mutans and Porphyromonas gingivalis in the implant environment can lead to the changes in the oxidation states of titanium and further corrosion of the metal surface.
The following example does not exactly focus on studies of implant surface, nevertheless it is worth mentioning, since it presents XPS as a tool capable of studying changes and differences in bone quality between newly formed bone, sampled from the vicinity of a titanium alloy implant. By comparing the data to that of cortical bone (acting as a control) in combination with sampling at different time points the changes were tracked within the newly formed bone [52] (Figure 6).
Although the spectra presented in Figure 6 appear to be almost identical, differences become apparent after taking a more detailed look at the shapes of some peaks and their relative intensities differing between spectra. Furthermore, comparison of the results taken at four and eight weeks for the newly formed bone, with the results for the cortical bone revealed more details and track the changes in the bone structure taking place during bone maturing (Figure 7).
The XPS data was also utilized for quantitative analysis of both, newly formed and cortical bone (Table 1). The authors concluded from the results that, after eight weeks, the newly formed bone has a strong physicochemical resemblance to the cortical bone due to maturation and bone metabolism.
X-ray photoelectron spectroscopy has become the “go to”, most widely used tool for surface analysis. Its applicability to a broad range of materials combined with the delivery of both, quantitative and chemical state information from the sample’s surface, are the pillars of its success and popularity among researchers.
2.1.3. Raman Spectroscopy
Raman spectroscopy is being considered as a complementary technique to infrared spectroscopy (IR) due to its sensitivity to vibrational modes, which are either not observed in IR or yield only weak absorption bands. On the molecular level, Raman spectroscopy relies on the polarization of the electron cloud of the chemical bond dependent on the vibration of the bond-forming atoms. For details on the physics behind these phenomena, the reader is pointed towards more specialized texts [53,54]. Since molecular vibrations are unique for every molecule, Raman spectra are often viewed as a type of molecular “fingerprint”, widely utilized in semi-qualitative and semi-quantitative analysis in biology [55,56], chemistry [57,58,59,60], geology [61], life and material sciences [62,63], as well as in pharmaceutical [64], cosmetics [65], and semiconductor industry [66]. This wide spectrum of applicability of Raman spectroscopy is supported by its speed of data acquisition and lack of special needs for sample preparation.
The field of implantology has benefited substantially from Raman spectroscopy. Considering the conditions to which an implant is exposed, it is a must to include surface studies to analyze implant surface reactions to the outside stimuli. An example of utilization of such surface studies are titanium implant abutments (Figure 8a) used in modern dentistry as a tool for soft tissue conditioning prior to proper implant placement (Figure 8b).
Usually, an abutment is analyzed with several techniques in order to characterize any changes in surface crystallinity, morphology, and elemental composition, with an emphasis on the thickness of the oxide layer and both, the identity and orientation of the crystal phase [67]. A typical approach starts with surface scanning electron microscopy (SEM) analysis followed by Raman spectroscopy of regions of particular interest [68]. Such an example is illustrated in Figure 9, which depicts results from a study focused on surface alterations and possible bone formation on the surface of failed dental implants (either Straumann ST type or TiUnite), which were removed due to any given reason. First of the two SEM micrographs (Figure 9a), presents fragments of a fibrinous matrix with a less osseous surface, whereas the second (Figure 9b) shows a similar region with higher magnification. The presented surface reveals a significant degree of mineralization which can only take place due to significant interactions happening on the bone–implant interface. The presence of such features on the surface confirms a significant contact level between the implant and the bone.
Raman analysis was conducted to explore the origin of the augments, marked with the boxed regions in Figure 9b. One of the results of these experiments is presented in Figure 9c. Raman spectroscopy revealed a broad peak in the region specific for C–H bonds, in this case representing the bone organic matrix formed due to collagen deposition on the surface. Interestingly, the comparison between the Straumann ST and the TiUnite on the same spectrum revealed a higher degree of deposition in favor of the Straumann ST system.
Raman spectroscopy has been the method of choice for analysis of TiO2 phases present on root surfaces of commercial dental implants [69]. The presence of TiO2 on the metal surface is of tremendous importance for the chemical stability and durability of such an implant. However, an even greater impact can be attributed to the phase type of the oxide layer. Because interactions on the oxide–tissue interface play a crucial role in the long-term implant behavior, facilitating the support of the implant by the bone often happens due to hydroxyapatite growth on the metal surface, which can be affected by the type of the oxide phase. Hydroxyapatite does not readily grow on amorphous TiO2, contrary to rutile or anatase-rich TiO2 surfaces, both being better substrates for hydroxyapatite, yielding substantially better growth, which can have a significant influence on osseointegration [70]. As straightforward as it seems, obtaining a rutile or anatase-rich surface requires various treatments, for example, blasting, machining, plasma treatment, and anodization, which yield implants varying in TiO2 phase composition. Keeping in mind the phase-dependent hydroxyapatite growth preference, the authors of the study evaluated several commercially available implants, focusing on the presence of amorphous/rutile/anatase phases with respect to the surface treatment method [70] (Table 2).
All the above-mentioned implants have been subjected to Raman analysis in order to evaluate the composition and TiO2 phase (or phases) present on the implant surface. Among many possibilities, the authors choose the intensity of the obtained signal as the first characteristics to divide the resulting spectra into three groups with maximum peak scale of: (i) < 800 a.u. for Group 1, (ii) 1250 up to 6000 a.u. for Group 2, and (iii) > 35,000 a.u. for Group 3. Within these groups, the authors analyzed the data and assigned signals with respect to reference materials. Exemplary spectra of implants yielding signals differing both in intensities and surface composition are presented in Figure 10. The tricalcium phosphate/hydroxyapatite blasted LLK implant (Figure 10a), assigned to Group 2, shows a broad peak profile, from which most of the signals have been recognized as belonging to amorphous and anatase TiO2 phases. On the contrary, the surface characteristics the OSP implant, assigned to Group 3, are a result of calcium-based anodization, and shows sharp and well resolved peaks, originating from anatase TiO2 phases.
Across other implants analyzed in the study, authors have shown that, besides already presented in Figure 10 anatase and amorphous phases, samples can contain Al2O3, brookite, or Ti2O3, in different proportions, depending on implant type or exclusively showing just one signal assigned to one of the phase types (the OSP implant in Figure 10b). Raman spectroscopy showed to be an outstanding tool for analysis of implants as received from the manufacturer and without prior preparations.
3. Bioceramic Materials
Bioceramic materials constitute a vast group of inorganic and nonmetallic compositions with numerous applications in medicine and medical devices [71,72,73], of which orthopedic and dental implant use covers the major share [74,75,76]. Furthermore, with ceramic materials gaining increasing attention and sparking a discussion of their versatility and superiority over titanium-based implants [77], it is important to note that not all ceramic materials are suitable for implant purposes. To address the issues of tissue attachment and post-transplantation material behavior has required countless modifications in the composition of such materials, ultimately leading to many examples, of which relatively few have achieved clinical success.
Considering the modus operandi, as well as surface and bulk interactions of ceramic-based implants, the analysis of crucial processes taking place in their vicinity has evolved over the years, followed by the development of bioceramics from simple bioinert materials through bioactive and resorbable materials, and finishing with bioceramics acting as scaffolds for cells [78]. In this section several examples of techniques used for the analysis of various ceramic materials are given, focusing on the most interesting examples from the groups of alumina and hydroxyapatite-containing materials.
3.1. Photoluminescence Piezospectroscopy
Photoluminescence piezospectroscopy (PLPS) is considered a technique of choice when examining surface imperfections, and nanoscale stress distribution on material surfaces are of significance. It is most frequently used for the analysis of alumina containing materials, typically ceramics [79,80], thermal coatings [81,82], or weld analysis [83]. The principle of this method is based on observations of the shifts of fluorescent Cr3+, as it is always present as an impurity (or added externally dopant) in aluminum, in response to applied stress. Utilizing a Raman optical probe, PLPS analysis can yield signals of intensity 106 greater than obtained in typical Raman experiments, with the acquisition time of around one second. The obtained data is often compared to an unstrained reference sapphire sample. It is important to note that the peak position in the spectra is temperature dependent, and therefore temperature maintenance is of critical importance for reliable PLPS results [84]. An example of a typical PLPS spectrum is presented in Figure 11a, in which peaks R1 and R2 denote optical energy levels for Cr3+ [85]. Versatility of PLPS lies in its ability to distinguish between the type of stress being applied to the surface; compressive stresses shift the optical levels R1 and R2 towards lower wavenumbers (higher wavelengths), whereas tensile stresses shift them towards higher wavenumbers (lower wavelengths) (Figure 11b).
Data gathered during photoluminescence piezospectroscopy experiments have been used by Pezzotti et al. [85] to examine stresses on the surface and subsurface of hip joints exposed in vivo, starting from a period of one month, and finishing with nineteen years of exposure. Such a long time span allowed the authors to take a careful look at the performance of three generations of implants, all manufactured from Al2O3, differing in grain size of the material. The results of the analysis have been presented in a form of three-dimensional maps, examples of which are given in Figure 12.
Analysis of the data revealed intriguing patterns, especially in the case of the implant exposed for the longest time (Figure 12a). Both the surface and subsurface (30 µm below the surface) maps of the ball of the implant carried signs of stresses located in the same places, corresponding to the main wear zones, although surface stresses were shown to be compressive in nature, whereas the subsurface stresses were tensile. The authors explained this phenomenon by presenting a hypothesis of a local equilibrium being established between the surface and subsurface areas, which requires development of stress fields of opposite sign. Importantly, the authors point to a possibility that the presence of stress fields of such a magnitude could be the cause of surface degradation, along with grain detachment and formation of debris. A different trend was found on samples retrieved after a short-term implantation (Figure 12b,c). As expected, in both cases, the samples showed significantly lower stress fields, due to the relatively short term of usage. However, both cases differed in the type of stresses revealed on the surface, the stresses for the short-term used implants showed to be tensile in nature. Furthermore, the authors pointed out that the averaged stresses tend to evolve over time, starting from tensile for short-term used implants, through a point of stress annihilation, eventually leading to compressive values.
3.2. Raman Spectroscopy
Raman spectroscopy has already been introduced as a tool utilized in hard implant surface studies. In this section, its applications in hydroxyapatite-related studies are presented. Hydroxyapatite (HA) is one of the best, if not the best, well-known bioceramic materials to date. It owes its importance to its chemical similarity to bone itself, at the same time being biocompatible, bioactive, and stable. HA has been the subject of many outstanding reviews, focusing on its synthetic methods [86,87], applications in dentistry and oral implantology [88], biomedicine [89], and as an element of composite materials [90,91]. Typically, HA is used as an implant coating, to improve the fixation of the implants with bone tissue.
Dippel et al. studied mineralization of bone tissue and HA coating of integrated hip and knee prostheses of human and canine specimens, particularly utilizing Raman spectroscopy to investigate the level of bone integration by analyzing the vicinity of the prosthesis or its coating and the bone–coating interface. Additionally, the authors investigated the spatial distribution of different phosphate structures [92]. One of the obtained results is presented in Figure 13. All samples were compared to appropriate controls in the form of uncoated implants to assess the effect of HA.
The microscope image of the canine specimen sample (Figure 13a) shows the HA coating detached from the implant after six months of full-weight bearing, creating space for the bone ingrowth to be formed. The authors compared the ongrowth and ingrowth parts of the bone to discover a 13% difference in HA contents in favor of the ongrowth part (Figure 13b,c). Additional observations have shown the distribution of HA to be at similar levels all the time, independent of the composition of the coating and history of the implant. The content of HA changed, beginning from a maximum in the direct vicinity of the implant, decreasing to a minimum towards the boundary of the coating to increase again from the side of ongrowth bone.
Simmler et al. performed a similar study of HA coatings, although in this case, the authors turned their attention towards the integration of HA-coated implants in order to establish the timespan of full-bone mineralization [93]. For this purpose, Raman spectra was acquired in the form of lateral scans from the surface of the implant, reaching in the subsurface area of the bone tissue, to determine the amount of protein and inorganic components. The obtained results differentiated between HA form present in mature bone tissue and synthetic HA present in the implant coating. Furthermore, it was shown that implants residing in the body over a period of eighteen months contained the same amount of HA across the bone-implant interface as compared with the mature bone tissue. At the same time, the content of synthetic HA was reduced. On the contrary, after six months the samples did not achieve full mineralization and the content of synthetic HA was substantial, with the synthetic form found at positions beyond the implant coating, showing the active involvement of the coating in the mineralization of new bone tissue.
One of the most challenging studies utilizing Raman spectroscopy was performed by Penel et al. [94]. Employing special titanium bone chambers, the authors utilized intravital Raman spectroscopy to monitor bone composition directly in living animals, focusing on HA and β-tricalcium phosphate (β-TCP). The chambers were implanted in the femur and the humerus of New Zealand female rabbits, and therefore spectral and optical observations could be made without any additional surgery (Figure 14a,b).
Spectra of HA taken at different times are presented in the top panel of Figure 14c. During the study, no significant frequency shifts were detected. The authors performed additional experiments in order to analyze the composition of the bone tissue two weeks post implantation (Figure 14c, bottom). Data revealed several modes characteristic for carbonate apatite typically encountered in bone tissue (: 1073, 1035, 1048, 960, 604, 587, 450, and 430 cm−1; : 1103 and 1073 cm−1), together with signals attributed to the presence of collagen (amide III: 1200 to 1300 cm−1, amide I: 1600 to 1700 cm−1, and CH groups: 2800 to 3100 cm−1). Additionally, the eight month in situ observation allowed the authors to follow the integration of biomaterials with the bone tissue and revealed faster incorporation of β-TCP contrary to HA.
Quite an interesting example, though not exactly regarding bioceramic implants, shows the utilization of Raman spectroscopy along with fluorescence microspectroscopy to study phase transformations in solid tissues of human teeth occurring during tooth caries formation, delivered by Seredin et al. [95]. First, the authors investigated the teeth areas with enamel carious fissure (Figure 15a). Fluorescence experiments performed on the sample revealed fissures, visualized as dark spots with surrounding lighter areas (magnified in the inset of Figure 15a, marked with the arrow). The reason for the observed increase of fluorescence around the fissures is explained as a result of the decrease of crystallinity and absence of HA in preferable orientation, marking irreversible changes taking place in the organo-mineral complex along with the removal of the mineral components.
Raman spectroscopy has been chosen as the perfect tool to analyze the micro-sized fissures (marked with the black arrow in the inset of Figure 15a). The results of the analysis are presented in Figure 15b, confirming the increased intensity of caries region as compared with the enamel. The authors took further efforts to extract details revealing differences in the surface composition caused by the phase transformations. More detailed Raman experiments (Figure 15c) shed light on the differences between the two regions of interest. The top spectrum in Figure 15c presents dicalcium phosphate dihydrate (DCPD, ), proposed as an intermediate in apatite mineralization and dissolution processes. Its signals have been recognized on the carious fissure spectrum, overlaid with the enamel signals at the bottom of Figure 15c. Additionally, the data shows significant variations in signal intensity in the fissure spectrum combined with an increase in intensity of signals near 775 cm−1 and 1075 cm−1, relating to , due to the substitution of the phosphate HA group in the structure by carbonate ions. On the enamel spectrum, signals corresponding to vibrational modes of , and functional groups, characteristic for enamel’s inorganic component, are present. These data helped the authors shed some light on the mechanisms of fissure formation and the part played by hydroxyapatite in these processes. Their work further emphasized the importance of Raman spectroscopy and its complementarity with fluorescence microspectroscopy.
3.3. Diffuse Reflectance Infrared Fourier Transform Spectroscopy
Diffuse reflectance infrared Fourier transform spectroscopy (DRIFTS) is a variant of IR spectroscopy, which takes advantage of the subsurface diffused part of the electromagnetic radiation, especially important if samples are yielding very little or no specular reflection, i.e., their surfaces are dull, rough, and lack shininess. The ability to analyze non-transparent specimens made of highly absorbing materials is the key advantage of DRIFTS. Other frequently mentioned advantages include: effortless sample preparation, very good signal-to-noise ratio, and ability to perform in situ measurements and quantitative analysis of surface species [96]. DRIFTS is most often applied to provide precious insights about mechanisms and reaction pathways [97,98,99], organic paints, and dyes [100,101]. It has also proven useful in implant-related studies. The following examples focused on analysis of hydroxyapatite coatings on stainless steel [102] and titanium implants [103]. In the first case, Jonauske et al. evaluated calcium hydroxyapatite (, CHA) coatings obtained by a sol-gel method as a means of protecting steel surfaces to aid their poor bioactivity and associated formation of fibrous tissue, issues typical for this material. In their experiments, a steel plate, initially roughened through physical treatment, was subjected to cycles (up to thirty) of spin coating of the CHA sol-gel followed by further annealing of the sample at 850 °C for five hours in air. So prepared, the samples were immersed into simulated body fluid (SBF) for two, three, and four weeks to evaluate the in vivo bioactivity of the coatings. Several methods were utilized to draw the necessary conclusions from the performed experiments, among them, DRIFTS was used to evaluate the formation and change in the composition following successful formation of CHA coating layers (Figure 16).
Analysis of the obtained spectra revealed almost no differences across the samples. Absorption bands in the range 1100–950 cm−1, typical CHA, are clearly visible, along with bands located at 1035 and 1090 cm−1, resulting from symmetric stretching vibrations in , and a broad band in the 3600–3300 cm−1 range attributed to the presence of water. An additional weak and broad band in the range 1550–1370 cm−1, attributed to bending modes in CHA, was observed in all of the spectra. These results, accompanied by additional methods, confirmed the formation of good quality CHA coatings on the rough stainless-steel surface.
In the second case, Rigo et al. focused on titanium implants. However, the authors utilized a different strategy for covering the metal surface with HA [103]. HA was deposited by immersion of the implant in SBF along with bioactive glass. The glass released Ca2+, Na+, and K+ ions via an exchange with H3O+ present in SBF along with release of silicate ions, which adsorbed on the substrate surface and, eventually, led to formation of silanol (Si-OH) groups. These together with Ti-OH acted as nucleation sites for apatite growth. Nucleation was additionally stimulated by the earlier released Ca2+, Na+, and K+ ions, along with ions present in SBF. Once the nuclei were formed, HA growth was spontaneous. So prepared, implants were inserted into rabbit’s tibia for eight weeks and afterwards analyzed accordingly. DRIFTS analysis was utilized in the early stage of the experiments, to assess and confirm the formation of HA.
4. Applications of Fluorescence Techniques for the Analysis of Implants and Implant-Surrounding Tissues
Biocompatibility and cytotoxicity are crucial aspects to be considered during the processes of design and optimization of properties of a new implantable material. These properties were studied in vitro and in vivo regarding the influence of the material on the behavior of prokaryotic and eukaryotic cells (e.g., proliferation, viability, and differentiation), which are, in most cases, chosen for the studies depending on the sight of implantation [104,105,106,107,108]. The most common methods to visualize the behavior of cells located in close proximity to the implant involve histopathologic staining [109,110,111] and fluorescence labeling [108,112,113]. This section of the review focuses on the latter one.
Since fluorescent staining is a very powerful tool for sensitive and selective labeling of a molecule of interest, principles of exemplary fluorescence microscopy techniques and different applications of the fluorescent visualization of cell–implant interactions or drug release are highlighted in this part of this review. Possible applications of the techniques including: (i) characterization and analysis of cells in implant-surrounding tissues, (ii) observations of cell behavior on the implant interface, (iii) evaluation of antibacterial properties of the implant surface and its cytocompatibility, and (iv) assessment of drug release will also be discussed (Table 3).
Contrary to the previously described spectroscopy techniques, the applications of fluorescent microscopy techniques do not vary as significantly when applied to different implant materials. The principles of fluorescent microscopy methods relay on the type of visualized cells and tissues and the fluorescent staining procedures. Therefore, contrary to the previous section of this paper, where the division with respect to material types was applied, here, we focus on the group of metal implants involving titanium and its alloys, nickel, platinum, cobalt, and chromium alloys. Additionally, two examples of active agent release from non-metal implants into the surrounding tissues are described in Section 4.2.5. Imaging Systems.
4.1. Fluorescence Labeling Methods
For monitoring of processes taking place at the cellular and molecular levels, fluorescence microscopy requires the sample to be labeled. Even though in some molecules the concentration of fluorophore is high enough for the autofluorescence to be used for visualization, the intrinsic fluorescence is in most cases weak, nonspecific, and of limited use [127]. There are several ways to induce fluorescence in a sample. The most common ways involve labeling with fluorescent dyes or combining with fluorescent proteins [128,129]. It should be stressed that fluorescence labeling exhibits some significant limitations, i.e., fluorescent dyes have limited stability, are susceptible to photobleaching, and can induce phototoxic effects [127].
The simplest molecules used as fluorescent labels involve small organic compounds and fluorescent nanoparticles (NPs). On the basis of the core structure, organic fluorophores can be divided into such families as fluoresceines (e.g., calcein and FITC), coumarins, or rhodamines (Figure 17) [127]. All of them are prone to chemical modifications affecting their properties (e.g., wavelength range, brightness, and photostability), which is their key advantage over other fluorescent molecules [130,131,132]. Fluorescent NPs are often prepared from CdSe and ZnSe [133,134,135]. Their emission wavelength depends on the size and the material they are made of. A range of fluorescent dyes is also used due to their selective binding to a specific group of molecules. The examples of such involve 4’,6’-diamidino-2-phenylindole (DAPI) [136] and bisbenzimide trihydrochloride [116] which bind DNA thus being used for staining of cell nuclei, phalloidin, [137] acting as a fluorophore carrier and selectively binding F-actin, used for cellular filament staining, or tetracycline hydrochloride [138] which is readily absorbed into the bone. To monitor the antibacterial properties of surfaces, a live/dead bacterial viability kit is most often used [139]. It contains two nucleic acid stains that penetrate bacterial cells to a different extent. Green stain (e.g., SYTO®9 in the Thermo Fisher kit) penetrates the wall of all cells, whereas red stain (e.g., propidium iodide in the Thermo Fisher kit) only penetrates the damaged membrane of dead cells [139].
Immunofluorescence is a more advanced technique of molecule labeling. It relies on a highly specific binding of a primary antibody to a target molecule [140]. In some cases, the primary antibody can act as a fluorophore carrier, otherwise, a secondary fluorophore-containing antibody is introduced to the system to verify if the primary antibody bound successfully to the antigen-containing molecules.
The progress in the understanding of genetics has resulted in an increased range of possibilities to modify the processes of protein expression and utilize them to our advantage. As a result, fluorescent proteins became a popular direction for the labeling of biological samples. They can be expressed in vivo in genetically modified cells, for example, to monitor cell migration or co-expressed with other proteins in a form of a label to monitor the localization of the molecule [141,142]. Contrary to commonly used organic dyes, fluorescent proteins are most often nontoxic and allow studies of living cells.
4.2. Fluorescence Microscopy Techniques
4.2.1. Fluorescence Microscopy
Fluorescence is one of the most popular contrasting techniques in microscopy. It involves the use of fluorophores or fluorochromes which absorb light at a specific wavelength and, after excitation, emit fluorescence [127]. Since the emitted fluorescence is much weaker (typically several thousand to million times) than the excitation light, a set of advanced filters is applied to selectively absorb the excitation light, and therefore only the emitted fluorescence to reach the detector [143]. This way, the observed structures are superimposed with high contrast against the dark background. The levels of fluorescence emitted by a sample are generally low, and therefore the sources of excitation light need to emit a light with high intensity [143]. The most often used light sources involve high-energy short-arc discharge lamps such as mercury or xenon burners. The more advanced fluorescence microscopes (e.g., confocal microscopes) use lasers as the light sources. The greatest advantage of the fluorescence microscopy is the presence of the fluorophore [127]. Although in some cases fluorescent microscopes do not work at high enough resolution to register the structure of specific molecules, the emitted fluorescence monitors spreading and localization of molecules within the sample.
Life sciences have found numerous applications for fluorescence microscopy. Focusing on implantology and new implantable materials only, they range from visualizing the bone metabolism to monitoring antibacterial properties of the new materials, facilitating, for example, the evaluation of different implantation techniques.
One of them, the osteotome technique, aims at increasing the primary stability of dental implants in the posterior maxilla [114]. Although this method is well described and used in clinical routine, the experimental data on the post-implantation osseointegration are scarce. Therefore, in vivo polychromatic fluorescence labeling was applied by Nkene et al., to evaluate the osseointegration and morphology of newly formed bone tissue around the inserted implant [144]. Fluorescence labeling was used to follow the direction and the topographic localization of new bone formation. For this purpose, four dyes (oxytetracycline, alizarin complexion, calcein, and xylenol) were supplied via intramuscular injection. After the bone formation, samples were isolated and analyzed. The obtained data showed weakly stained bone for the control group. The dyes accumulated around the implants in the sequence of their administration. A different pattern was shown for the osteotome technique group, where a strong signal in the whole compressed area was observed already two weeks after implantation (Figure 18). After healing periods of four and eight weeks, an even more pronounced dye apposition was observed in the compressed area and close to the implant surface. The study showed that the osteotome technique significantly increases osseointegration of implants.
The new implantation materials are designed to meet the highest standards of biocompatibility. To improve their properties surface modifications are often used. The studies on titanium implant surface modifications are among the most popular. As an example, one of the studies focused on the osteogenic and pro-angiogenic effects of a coating based on zinc (Zn) and magnesium (Mg) ions [115]. The ions were selected based on their high importance for cellular metabolism [145] and processes leading to adhesion of osteoblasts to orthopedic implant surface [146] and co-implanted into the titanium surface via plasma immersion ion implantation. During the study, the in vitro adhesion activity and viability of rat bone marrow mesenchymal stem cells (rBMSCs) on Zn/Mg surface was visualized by staining the cytoskeleton and cell nuclei with rhodamine-phalloidin and DAPI, respectively. The in vitro osteogenic induction and the pro-angiogenic effects of the ions were visualized by immunofluorescence labeling of osteocalcin (OCN) and HIF-1α (respectively) in rBMSCs and HUVEC cells. For this purpose, after the exposure to the corresponding antibodies (anti-OCN and anti-HIF-1α) the cells were stained with fluorochrome-conjugated secondary antibody and DAPI. The results of the study showed increased adhesion, proliferation, and differentiation of rBMSCs. The activation of HIF-1α (essential regulatory factor of VEGF) in HUVECs was also increased, thus, enhancing angiogenesis. Additionally, due to the antibacterial properties of the studied coating, a certain inhibitory effect towards Porphyromonas gingivalis, Fusobacterium nucleatum, and Streptococcus mutans was observed.
Bioceramics represent another sort of implantable material compared to previously mentioned titanium. One of the studies describing applications of orthopedic bioceramics aimed at evaluating the properties and cytocompatibility of silicon carbide (SiC) ceramics, synthesized from different substrates obtained from wood specimens [116]. The studied SiC was coated with a hydroxyapatite layer to increase its osseoinductive properties. To verify the osseoinductive properties of the hydroxyapatite coating and SiC surface, the NIH 3T3 fibroblast cell line was used. The cells were stained with bisbenzimide trihydrochloride and phalloidin to detect cell nuclei and F-actin, respectively. The fluorescence microscopy showed that the coating increased the implant cytocompatibility.
Multicomponent coatings are an advanced strategy which affect several properties of an implant at the same time. An example of such coating exploited the synergetic antibacterial properties of ZnO nanorods and silver NPs (AgNPs) [117]. Additionally, poly(lactic-co-glycolic acid) (PLGA), a biodegradable and highly biocompatible material, was used as one of the coating components to increase surface stability and control the release of the active agents over time. It was assumed that the PLGA/Ag/ZnO composite coating of titanium implant should release dual antibacterial agents (zinc and silver) to improve surface antibacterial efficiency and enhance biocompatibility (PLGA). To evaluate the properties of the multicomponent coating, its influence on the morphology of osteoblastic cells (MC3T3-E1) and viability of bacteria (Staphylococcus aureus and Escherichia coli) was monitored. To visualize alive and dead bacteria and assess the antibacterial properties of the coating, propidium iodide and acridine orange were applied. The MC3T3-E1 cells were stained with FITC-phalloidin and DAPI to monitor their morphology. The data obtained from the study showed that, after optimization of active agent concentrations, the coating provided a long-lasting antibacterial activity and good cytocompatibility.
Fluorescence microscopy is in a state of constant, rapid development, with new advancements in probes and equipment appearing almost every day. As a result, new possibilities become available, for example, to increase imaging resolution or to perform advanced three-dimensional (3D) imaging. The need for specialized techniques adjusted for specific samples has resulted in the development of a range of state-of-the-art fluorescence techniques including X-ray fluorescence microscopy, confocal microscopy, or total internal reflection fluorescence microscopy.
4.2.2. X-ray Fluorescence Microscopy
X-ray fluorescence (XRF) microscopy is used for quantitative measurements and imaging of trace elements distribution in various kinds of samples [147]. In fluorescence X-ray microscopy the sample is irradiated with micro-focused and monochromatic X-rays [148]. The fluorescence spectra are obtained by changing the wavelength of the incident X-ray while scanning the sample point-by-point. The XRF microscopy shows what types and amounts of elements are contained in each point by detecting the emission of characteristic fluorescence X-rays from each specific element in the sample [149].
The advantages of X-ray fluorescence microscopy involve high sensitivity, multi-elemental detection capability, nondestructive analysis, minimum sample preparation, and the ability to analyze solid, liquid, or gas samples at atmospheric pressure [150]. The use of synchrotron X-ray fluorescence microscopy permits reduction in the spatial resolution up to the micron level, as well as significant improvements in the elemental sensitivity. The main limitation of this technique is strictly associated with its principle. X-ray fluorescence detects atoms depending on the specific wavelength emitted from the sample, but due to strong matrix effects, interferences can occur, causing weakening or strengthening of the primary X-rays, thus, questioning the accuracy of direct X-ray fluorescence analysis [151]. The applications of X-ray microscopy involve monitoring protein transportation, investigations of wet biology specimens, or elemental mapping of biological tissues [147].
Considering the fact that the nature and distribution of metal accumulated within the surrounding tissue helps to evaluate the level of corrosion of electrode implants, Spiers et al. applied XRF to verify the amount of the material released from the implant into the surrounding fibrous tissue [118]. The study aimed at analyzing the implant-surrounding tissue, after long-term implantations (implantations in 1978, 1983, and 1998; material retrieved post-mortem in 2007). The use of X-ray fluorescence microscopy allowed for the detection and differentiation of various forms of accumulated platinum, for example, platinum NPs which were released most probably as a result of corrosion, and platinum ions which later formed complexes with proteins most probably released as a result of electrolytic processes.
In another study, micro X-ray fluorescence (µXRF) microscopy (a method with a spatial resolution with a diameter many orders of magnitude smaller than conventional XRF) was used to monitor the release of cobalt and chromium from a Co-Cr alloy-based implant into the surrounding bone tissue [119]. The study aimed at determining if it is possible to prevent metal release by covering the implant surface with a thin layer of titanium dioxide utilizing the atomic layer deposition method. The µXRF mapping determined that the titanium oxide layer significantly decreased the amount of metal released into the tissue. Additionally, the increase of the layer thickness decreased the release even more. However, the release was not entirely averted. The TiO2 layer also prevented the corrosion process of the alloy in physiological conditions.
A similar study was performed by Uo et al. who applied X-ray scanning analytical microscopy (XSAM) to monitor the release of nickel from nickel implants [120]. The data form XSAM mapping was compared with results from histological analysis and showed that the area of the nickel spreading obtained from XSAM mapping was highly consistent with the area around the implant exhibiting inflammation, detected during histological analysis.
4.2.3. Confocal Microscopy
Confocal microscopy is commonly applied for visualizing specific objects within living and fixed cells or tissues [152]. High resolution of the technique registers detailed structures [153]. Contrary to the standard fluorescence microscope, confocal microscope is built so that the laser light irradiates only a defined spot at a specific depth in a sample, the rest of the sample left out of focus. When samples are scanned in one plane in a raster pattern, a two-dimensional (2D) view of one sample plane is formed. Scanning an object one plane after another creates a 3D model. Advanced confocal microscopes containing different filters can irradiate the sample with several lasers during one measurement for simultaneous analysis of samples stained with several dyes at once [154].
The main advantages of confocal microscopy involve the possibility of registering images with high resolution and contrast [155], combined with the ability to prepare 3D models of the image data gathered during the experiments. The possibility of in vivo measurements up to c.a. 200 µm in depth is another benefit of this technique. As a result, it is possible to, for example, monitor the entire epidermis and superficial layer of the dermis. Considering the technique’s limitations, the depth of imaging is limited by the optical penetration and signal-to-noise ratio. It should also be stressed that, similar to the other fluorescence techniques, fluorescence confocal microscopy struggles with photobleaching and cytotoxicity of the fluorescent probes.
The confocal microscopy can monitor changes in bone morphology. As a consequence, it is feasible to visualize the effect of an implant on bones in predisease or diseased states. One of such states is osteopenia, a preclinical state of osteoporosis [156], which causes the bone weakening and makes the use of orthodontic implant anchorage and tooth implants difficult or even unadvised. Therefore, Liang et al. performed a study with the aim to elaborate an improved method for increasing the success rate of dental implantation, avoiding at the same time drug therapy [112]. For this purpose, titanium implants were coated with strontium, since it promotes bone formation. Fluorescence labeling was successfully used to visualize the processes of the new bone formation around the implant. The bone was stained with tetracycline hydrochloride and calcein after different periods. The canalization of the dye in the newly formed bone and distances between the dye lines showed the increased rate of mineralization and osseointegration (Figure 19).
Advances in modern medical engineering introduce different implant surface modifications [157] to enhance their biocompatibility. Collagen type I is one of the active agents used as a surface coating for orthopedic and dental titanium implants [104,107,108]. Ao et al. described the influence of such a coating on the in vitro behavior of human mesenchymal stem cells (hMSC) and in vivo new bone formation [108]. They utilized staining with phalloidin (actin filaments) and counterstaining with DAPI (nuclei) during in vitro tests to visualize the changes in cell morphology when in contact with the implant surface. For the purpose of the study, cell viability and spreading were visualized with the use of a live/dead bacterial viability kit (ab115347). In the in vivo study, the new bone forming around the implants was fluorescently labeled with calcein.
It often happens that different properties of the coating are studied in combination with the monitoring of cytocompatibility and antibacterial properties at the same time. Considering this strategy, Zhao et al. evaluated the properties of a nitinol surface functionalized with two-component coating, based on graphene oxide and gelatin molecules [121]. They verified cytocompatibility by measuring adhesion, viability, proliferation, and differentiation of MC3T3-E1 osteoblastic cells on the coated surface, while antibacterial properties of the surface were assessed by the viability of the Escherichia coli cells. For the purpose of visualization, the MC3T3-E1 cells were, first, the subject of an immunoassay with goat anti-mouse IgG-FITC followed by rhodamine-phalloidin and DAPI treatments to visualize the actin and cell nuclei, respectively, whereas the Escherichia coli cells were stained with live/dead bacterial viability kit (L13152, Molecular Probes).
4.2.4. Total Internal Reflection Fluorescence Microscopy (TIRF)
The lateral and axial resolutions of conventional fluorescence microscopy are limited to c.a. 200 nm and 600 nm, respectively [158]. This prevents observation of some important biological structures and dynamics at the nanoscale. Advances in the development of microscopy apparatus have overcome this limitation by introducing super-resolution microscopy which comprises such techniques as stimulated emission depletion (STED), single-molecule localization microscopy (SMLM), or total internal reflection fluorescence microscopy (TIRF) [158,159,160].
TIRF is an example of super-resolution microscopy which finds its application in life sciences, where it can be used, for example, in detailed studies on the integration of biomaterials with the cells located in the surrounding tissues [127,159]. The main principle of TIRF takes advantage of the fact that most biological samples are placed on a thin glass coverslip, to exploit the properties of the interface [161]. During the experiment the coverslip is illuminated at a very low angle, limiting the excitation of the fluorophores only to those located in close proximity to the surface. In this way, the out-of-focus background noises, which are the central issue of microscopy in general, can be reduced and the axial resolution of the method can be increased even up to c.a. 100 nm [162].
Among many advantages of TIRF, the most prominent one is its excellent signal-to-noise ratio [163]. It is also worth mentioning that TIRF can be used to study processes and structures in live cells and increase cell viability in long-lasting experiments. This method exhibits low phototoxic stress due to low penetration of the sample by the excitation beam [164]. TIRF also resolves the problem of photobleaching. Since only a fraction of the available fluorophore is illuminated during the experiment and the constant flux from cytosol to the irradiated region provide new fluorophore molecules, the signal-to-noise ratio remains constant for a long period of time [165]. The main limitation of TIRF is the necessity to use a sample that is highly adherent to the microscope glass surface, because it has to be very close to the interface to be irradiated by the excitation beam [164].
The applications of TIRF in the field of biomaterials and implantology revolve mainly around description and explanation of processes occurring on the bone–implant interface such as the dynamics of cell surface adhesion [122]. Current data shows that the cell surface adhesion depends strictly on the properties of the surface [166] and the number of possible spots of cell–surface interactions (e.g., peptides, proteins) [167]. Since it is the ligands present on the surface of an implant that mostly determines its surface properties, a study was performed to determine the strength of attachment of bovine aortic endothelial cells to immobilized linear RGD peptides and fibronectin [122,123]. The data showed higher affinity of the cells to fibronectin. Another study focused on the dynamics of cell-implant contact [122,123]. Covering vascular grafts with endothelial cells is a promising direction for reducing the probability of post-implantation thrombosis. However, inserting the adhered cells into the environment with constant blood flow requires tight adhesion of the cells. It should also be considered that the flow can increase tension and compression applied to the cells causing constant stress to the cytoskeleton. In the study, TIRF was applied to monitor short-term response of the cells to the applied fluid forces. The study results indicated that the forces were not strong enough to influence the shape of the cell meaning that the cell did not move on the implant.
4.2.5. Imaging Systems
The “top shelf” of imaging systems belongs to advanced, multifunctional apparatuses capable of acquiring fluorescence and bioluminescence data in vitro and in vivo, both in 2D and 3D modes (with varying options depending on the model). In the context of implantology these systems detect fluorescent material embedded in organic tissue in vivo in living organisms, and thus are applied, for example, in studies on drug release [124,126]. Xenogen IVIS-200 (PerkinElmer) or eXplore Optix (Advanced Research Technologies) are examples of systems used for fluorescence imaging in small animals. Simplified substitutes of commercial platforms exhibiting a narrower range of technical capabilities are also successfully utilized. What is important, they can be constructed and configured with regard to the exact experiment they are meant for [126].
Multifunctional platforms for the release of active agents are the focus of modern implant engineering. One of the possible materials for such platforms are hydrogels, which can be formed into different shapes and combined with different active agents. An example of a hydrogel drug delivery platform was documented by Berdichevski et al. [124], who studied the integration of biodegradable hydrogel implants (rat model) containing vascular endothelial growth factor (VEGF). The study compared the release parameters and angiogenic properties of VEGF from three geometric configurations of the hydrogel, i.e., cylindrical plugs, microbeads, and in situ crosslinked hydrogels (Figure 20). The PEG-fibrinogen biodegradable hydrogels were covalently conjugated with fluorescent probes for the purpose of monitoring the diffusion of the cyanine-labeled (Cy5.5) fibrinopeptides during gel degradation. In vivo fluorescence analysis of the hydrogels was performed with Xenogen IVIS-200. The applied method provided data regarding release and resorption profiles of degradation products of the hydrogel implants.
Another commercially available imaging system was applied by Lovati et al. for in vivo evaluation of bone deposition on surface-modified titanium implants [125]. In this study, the microporous titanium surface was loaded with bone marrow mesenchymal stem cells (to support implant-bone integration) and hydrogel enriched with strontium (anabolic and anticatabolic properties towards bone). For the purpose of bone deposition monitoring, a fluorescent bisphosphonate OsteoSenseTM750 was applied. The fluorescence was detected by an eXplore Optix imaging system (ART Advanced Research Technologies). The results showed an increased matrix deposition on stem cells and strontium modified implants.
In a different study, Markovic et al. evaluated a new implantable nanoplatform for drug delivery. The study focused on visualization and quantification of in vivo diffusion of fluorescently doped NPs [126]. To validate the platform, the release of free fluorophores and 30 nm and 200 nm sized NPs conjugated with the same fluorophores as a model drug was studied. The release was studied in agar gel phantoms in vitro and in mice in vivo (Figure 21). PLGA spacers coated with either a free dye, 30 or 200 nm NPs were implanted in the rear flanks of nude mice and, then, imaged daily for 15 days. The fluorescence of the implants was monitored with a custom-designed imaging system (substitute of a commercial system) utilizing NIR fluorescence.
5. Conclusions
The complexity of materials and surface functionalities used currently in implant manufacture requires a set of tools capable of providing the modern researcher with the data necessary to thoroughly characterize and profile the research target, with an emphasis placed on the quality of the data, sample preparation, time of the analysis, and cost. Since an ideal, single, and comprehensive method does not exist and seems to be out of reach anywhere in the near future, the scientific community is often turning towards spectroscopic and fluorescent microscopy methods, used separately or in tandem. With their development, scientists have gained access to tools very often capable of assessing properties of samples without the need for special pretreatment or preparation, that can be used both in vitro and in vivo. This possibility is of the utmost importance in modern implantology studies in which the implants surface and its interactions with the surrounding tissue are crucial and responsible for its success.
The complementary applications of spectroscopic and fluorescence microscopy methods are not to be overlooked. Currently we are witnessing progress in developing their combined methodologies, microspectroscopy and spectromicroscopy, capable of spectral measurements directly from microscopic samples or from microscopic images, ensuring the necessary precision and resolution, while leaving the sample intact.
It can safely be said that the position and importance of spectroscopy and fluorescence microscopy among the methods used by the scientific community are not endangered. On the contrary, we should expect further development and expansion of these techniques, including merging with other methods, for example, the combination of atomic force microscopy with IR to yield AFM-IR capable of nanoscale chemical analysis. Additionally, developing alternative methodologies to already existing ones, for example, electrochemical or Raman microscopy label-free biosensing methods should be expected. Further developments will happen with respect to the equipment used and supporting computational methods, offering novel functionalities with improvements in data quality, accuracy, and ease of interpretation.
Author Contributions
S.L. and S.R.-M. were responsible for manuscript conceptualization; S.L. was responsible for figure design and preparation; S.L., P.J., N.K., and A.K. were responsible for data collection, original manuscript writing; S.L., S.R.-M., P.J., and A.S. were responsible for review and editing. All authors have read and agreed to the published version of the manuscript.
Funding
This research was funded by the Polish National Agency for Academic Exchange within the “Polish Returns” programme (PPN/PPO/2018/1/00071/DEC/1) and the National Center for Research and Development, Poland (grant no. TECHMATSTRATEG2/406384/7/NCBR/2019).
Conflicts of Interest
The authors declare no conflict of interest.
References
- Yang, D.; Ying, Y. Applications of Raman Spectroscopy in Agricultural Products and Food Analysis: A Review. Appl. Spectrosc. Rev. 2011, 46, 539–560. [Google Scholar] [CrossRef]
- Mahesar, S.A.; Lucarini, M.; Durazzo, A.; Santini, A.; Lampe, A.I.; Kiefer, J. Application of Infrared Spectroscopy for Functional Compounds Evaluation in Olive Oil: A Current Snapshot. J. Spectro. 2019, 2019, 1–11. [Google Scholar] [CrossRef] [Green Version]
- Tanner, P.A. Application of Spectroscopic Methods to Environmental Problems. Spectrosc. Lett. 2005, 38, 211–212. [Google Scholar] [CrossRef]
- Nawar, S.; Cipullo, S.; Douglas, R.K.; Coulon, F.; Mouazen, A.M. The applicability of spectroscopy methods for estimating potentially toxic elements in soils: State-of-the-art and future trends. Appl. Spectrosc. Rev. 2019, 154, 1–33. [Google Scholar] [CrossRef]
- Van Schrojenstein Lantman, E.M.; Deckert-Gaudig, T.; Mank, A.J.G.; Deckert, V.; Weckhuysen, B.M. Catalytic processes monitored at the nanoscale with tip-enhanced Raman spectroscopy. Nat. Nanotechnol. 2012, 7, 583–586. [Google Scholar] [CrossRef] [PubMed]
- Lee, K.J.; Elgrishi, N.; Kandemir, B.; Dempsey, J.L. Electrochemical and spectroscopic methods for evaluating molecular electrocatalysts. Nat. Rev. Chem. 2017, 1, 0039EP. [Google Scholar] [CrossRef]
- Piñon, V.; Mateo, M.P.; Nicolas, G. Laser-Induced Breakdown Spectroscopy for Chemical Mapping of Materials. Appl. Spectrosc. Rev. 2013, 48, 357–383. [Google Scholar] [CrossRef]
- Bokobza, L. Some Applications of Vibrational Spectroscopy for the Analysis of Polymers and Polymer Composites. Polymers 2019, 11. [Google Scholar] [CrossRef] [Green Version]
- Chakrapani, S.B.; Minkler, M.J.; Beckingham, B.S. Low-field 1H-NMR spectroscopy for compositional analysis of multicomponent polymer systems. Analyst 2019, 144, 1679–1686. [Google Scholar] [CrossRef]
- Aller, A.J. The Challenge of Spectroscopy in the Microanalysis of Biological Surfaces. Appl. Spectrosc. Rev. 1992, 27, 223–244. [Google Scholar] [CrossRef]
- Clemens, G.; Hands, J.R.; Dorling, K.M.; Baker, M.J. Vibrational spectroscopic methods for cytology and cellular research. Analyst 2014, 139, 4411–4444. [Google Scholar] [CrossRef] [PubMed]
- Austin, L.A.; Osseiran, S.; Evans, C.L. Raman technologies in cancer diagnostics. Analyst 2016, 141, 476–503. [Google Scholar] [CrossRef]
- Smith, R.; Wright, K.L.; Ashton, L. Raman spectroscopy: An evolving technique for live cell studies. Analyst 2016, 141, 3590–3600. [Google Scholar] [CrossRef] [PubMed] [Green Version]
- Movasaghi, Z.; Rehman, S.; Rehman, I.U. Raman Spectroscopy of Biological Tissues. Appl. Spectrosc. Rev. 2007, 42, 493–541. [Google Scholar] [CrossRef]
- Movasaghi, Z.; Rehman, S.; ur Rehman, I. Fourier Transform Infrared (FTIR) Spectroscopy of Biological Tissues. Appl. Spectrosc. Rev. 2008, 43, 134–179. [Google Scholar] [CrossRef]
- Talari, A.C.S.; Martinez, M.A.G.; Movasaghi, Z.; Rehman, S.; Rehman, I.U. Advances in Fourier transform infrared (FTIR) spectroscopy of biological tissues. Appl. Spectrosc. Rev. 2017, 52, 456–506. [Google Scholar] [CrossRef]
- Querido, W.; Falcon, J.M.; Kandel, S.; Pleshko, N. Vibrational spectroscopy and imaging: Applications for tissue engineering. Analyst 2017, 142, 4005–4017. [Google Scholar] [CrossRef]
- Larmour, I.A.; Graham, D. Surface enhanced optical spectroscopies for bioanalysis. Analyst 2011, 136, 3831–3853. [Google Scholar] [CrossRef]
- Garrote, B.L.; Santos, A.; Bueno, P.R. Perspectives on and Precautions for the Uses of Electric Spectroscopic Methods in Label-free Biosensing Applications. Acs Sens. 2019, 4, 2216–2227. [Google Scholar] [CrossRef] [Green Version]
- Kendall, C.; Isabelle, M.; Bazant-Hegemark, F.; Hutchings, J.; Orr, L.; Babrah, J.; Baker, R.; Stone, N. Vibrational spectroscopy: A clinical tool for cancer diagnostics. Analyst 2009, 134, 1029–1045. [Google Scholar] [CrossRef]
- Baker, M.J.; Byrne, H.J.; Chalmers, J.; Gardner, P.; Goodacre, R.; Henderson, A.; Kazarian, S.G.; Martin, F.L.; Moger, J.; Stone, N.; et al. Clinical applications of infrared and Raman spectroscopy: State of play and future challenges. Analyst 2018, 143, 1735–1757. [Google Scholar] [CrossRef]
- E Silva de Carvalho, L.F.d.C.; Nogueira, M.S. New insights of Raman spectroscopy for oral clinical applications. Analyst 2018, 143, 6037–6048. [Google Scholar] [CrossRef]
- Nič, M.; Jirát, J.; Košata, B.; Jenkins, A.; McNaught, A. IUPAC Compendium of Chemical Terminology; IUPAC: Research Triagle Park, NC, USA, 2009; ISBN 0-9678550-9-8. [Google Scholar]
- Shayesteh Moghaddam, N.; Taheri Andani, M.; Amerinatanzi, A.; Haberland, C.; Huff, S.; Miller, M.; Elahinia, M.; Dean, D. Metals for bone implants: Safety, design, and efficacy. Biomanuf. Rev. 2016, 1, 4058. [Google Scholar] [CrossRef]
- Prakasam, M.; Locs, J.; Salma-Ancane, K.; Loca, D.; Largeteau, A.; Berzina-Cimdina, L. Biodegradable Materials and Metallic Implants-A Review. J. Funct. Biomater. 2017, 8, 44. [Google Scholar] [CrossRef] [PubMed] [Green Version]
- Prasad, K.; Bazaka, O.; Chua, M.; Rochford, M.; Fedrick, L.; Spoor, J.; Symes, R.; Tieppo, M.; Collins, C.; Cao, A.; et al. Metallic Biomaterials: Current Challenges and Opportunities. Materials 2017, 10, 884. [Google Scholar] [CrossRef] [PubMed]
- Handbook of Auger Electron Spectroscopy: A Book of Reference Data for Identification and Interpretation in Auger Electron Spectroscopy, 3rd ed.; Childs, K.D.; Hedberg, C.L. (Eds.) Physical Electronics: Eden Prairie, MN, USA, 1995; ISBN 0964812401. [Google Scholar]
- Gunawardane, R.P.; Arumainayagam, C.R. Auger Electron Spectroscopy. In Handbook of Applied Solid State Spectroscopy; Vij, D.R., Ed.; Springer: New York, NY, USA, 2006; pp. 451–483. ISBN 978-0-387-32497-5. [Google Scholar]
- Argile, C.; Rhead, G.E. Adsorbed layer and thin film growth modes monitored by Auger electron spectroscopy. Surf. Sci. Rep. 1989, 10, 277–356. [Google Scholar] [CrossRef]
- Powell, C.J. Growth and trends in Auger-electron spectroscopy and x-ray photoelectron spectroscopy for surface analysis. J. Vac. Sci. Technol. A 2003, 21, S42–S53. [Google Scholar] [CrossRef]
- Grant, J.T. Analysis of Surfaces and Thin Films by Using Auger Electron Spectroscopy and X-ray Photoelectron Spectroscopy. J. Korean Phys. Soc. 2007, 51, 925. [Google Scholar] [CrossRef]
- Xu, M.; Takano, Y.; Hatano, T.; Kimura, T.; Fujita, D. Auger electron spectroscopy study of MgB2 surface. Appl. Surf. Sci. 2003, 205, 225–230. [Google Scholar] [CrossRef]
- Orvis, T.; Surendran, M.; Liu, Y.; Cunniff, A.; Ravichandran, J. In situ Auger electron spectroscopy of complex oxide surfaces grown by pulsed laser deposition. J. Vac. Sci. Technol. A 2019, 37, 61401. [Google Scholar] [CrossRef]
- Flewitt, P.E.J.; Moskovic, R.; Wild, R.K. Measurement of segregation to grain boundaries in ferritic steel using Auger electron spectroscopy. Surf. Interface Anal. 2002, 33, 729–734. [Google Scholar] [CrossRef]
- Ott, N.; Yan, Y.; Ramamurthy, S.; Kairy, S.; Birbilis, N. Auger electron spectroscopy analysis of grain boundary microchemistry in an Al–Cu–Li alloy. Scr. Mater. 2016, 119, 17–20. [Google Scholar] [CrossRef] [Green Version]
- Lowry, R.K. Auger Electron Spectroscopy. In Failure Analysis of Integrated Circuits: Tools and Techniques; Wagner, L.C., Ed.; Springer: Boston, MA, USA, 1999; pp. 217–227. ISBN 978-1-4613-7231-8. [Google Scholar]
- Sundgren, J.E.; Bodö, P.; Lundström, I.; Berggren, A.; Hellem, S. Auger electron spectroscopic studies of stainless-steel implants. J. Biomed. Mater. Res. 1985, 19, 663–671. [Google Scholar] [CrossRef] [PubMed]
- Sundgren, J.-E.; Bodö, P.; Lundström, I. Auger electron spectroscopic studies of the interface between human tissue and implants of titanium and stainless steel. J. Colloid Interface Sci. 1986, 110, 9–20. [Google Scholar] [CrossRef]
- Lausmaa, J. Surface spectroscopic characterization of titanium implant materials. J. Electron. Spectrosc. Relat. Phenom. 1996, 81, 343–361. [Google Scholar] [CrossRef]
- Hofmann, S. Auger- and X-ray Photoelectron Spectroscopy in Materials Science: A User-oriented Guide/Siegfried Hofmann; Springer: Heidelberg, Germany, 2013; ISBN 9783642273810. [Google Scholar]
- Moulder, J.F.; Chastain, J. Handbook of X-ray Photoelectron Spectroscopy: A Reference Book of Standard Spectra for Identification and Interpretation of XPS Data; Perkin-Elmer Corporation: Eden Prairie, MN, USA, 1992; ISBN 0962702625. [Google Scholar]
- Van der Heide, P. X-Ray Photoelectron Spectroscopy; John Wiley & Sons, Inc.: Hoboken, NJ, USA, 2011; ISBN 9781118162897. [Google Scholar]
- Baer, D.R.; Wang, Y.-C.; Castner, D.G. Use of XPS to Quantify Thickness of Coatings on Nanoparticles. Micros. Today 2016, 24, 40–45. [Google Scholar] [CrossRef] [Green Version]
- Baer, D.R.; Engelhard, M.H.; Johnson, G.E.; Laskin, J.; Lai, J.; Mueller, K.; Munusamy, P.; Thevuthasan, S.; Wang, H.; Washton, N.; et al. Surface characterization of nanomaterials and nanoparticles: Important needs and challenging opportunities. J. Vac. Sci. Technol. A 2013, 31, 50820. [Google Scholar] [CrossRef]
- Ariza, M.J.; Martín, F.; Leinen, D. XPS surface analysis of monocrystalline silicon solar cells for manufacturing control. Appl. Phys. A Mater. Sci. Process. 2001, 73, 579–584. [Google Scholar] [CrossRef]
- Wei, J.; Bai, D.; Yang, L. Polymer Photovoltaic Cells with Rhenium Oxide as Anode Interlayer. PLoS ONE 2015, 10, e0133725. [Google Scholar] [CrossRef] [Green Version]
- Venezia, A.M. X-ray photoelectron spectroscopy (XPS) for catalysts characterization. Catal. Today 2003, 77, 359–370. [Google Scholar] [CrossRef]
- Anbarasan, R.; Palanikumar, S.; Devi, A.A.; Chen, P.-H.; Tung, K.L. Characterization and application of Cu based superhydrophobic catalyst. Prog. Nat. Sci. Mater. Int. 2019. [Google Scholar] [CrossRef]
- Duchoslav, J.; Arndt, M.; Keppert, T.; Luckeneder, G.; Stifter, D. XPS investigation on the surface chemistry of corrosion products on ZnMgAl-coated steel. Anal. Bioanal. Chem. 2013, 405, 7133–7144. [Google Scholar] [CrossRef] [PubMed]
- Stickle, W.F.; Young, C.N. Applying XPS to support industrial research and manufacturing. J. Electron. Spectrosc. Relat. Phenom. 2019, 231, 50–56. [Google Scholar] [CrossRef]
- Rodrigues, D.C.; Sridhar, S.; Gindri, I.M.; Siddiqui, D.A.; Valderrama, P.; Wilson, T.G.; Chung, K.-H.; Wadhwani, C. Spectroscopic and microscopic investigation of the effects of bacteria on dental implant surfaces. RSC Adv. 2016, 6, 48283–48293. [Google Scholar] [CrossRef]
- Nakada, H.; Sakae, T.; Tanimoto, Y.; Teranishi, M.; Kato, T.; Watanabe, T.; Saeki, H.; Kawai, Y.; Legeros, R.Z. Assessment of the Quality of Newly Formed Bone around Titanium Alloy Implants by Using X-Ray Photoelectron Spectroscopy. Int. J. Biomater. 2012, 2012, 615018. [Google Scholar] [CrossRef] [PubMed]
- Schlösser, M. Theory of Quantitative Raman Spectroscopy. In Accurate Calibration of Raman Systems; Schlösser, M., Ed.; Springer: New York, NY, USA, 2014; pp. 53–74. ISBN 978-3-319-06220-4. [Google Scholar]
- Cialla-May, D.; Schmitt, M.; Popp, J. Theoretical principles of Raman spectroscopy. Phys. Sci. Rev. 2019, 4, 557. [Google Scholar] [CrossRef]
- Butler, H.J.; Ashton, L.; Bird, B.; Cinque, G.; Curtis, K.; Dorney, J.; Esmonde-White, K.; Fullwood, N.J.; Gardner, B.; Martin-Hirsch, P.L.; et al. Using Raman spectroscopy to characterize biological materials. Nat. Protoc. 2016, 11, 664EP. [Google Scholar] [CrossRef] [Green Version]
- Kuhar, N.; Sil, S.; Verma, T.; Umapathy, S. Challenges in application of Raman spectroscopy to biology and materials. Rsc Adv. 2018, 8, 25888–25908. [Google Scholar] [CrossRef] [Green Version]
- Zrimsek, A.B.; Chiang, N.; Mattei, M.; Zaleski, S.; McAnally, M.O.; Chapman, C.T.; Henry, A.-I.; Schatz, G.C.; van Duyne, R.P. Single-Molecule Chemistry with Surface- and Tip-Enhanced Raman Spectroscopy. Chem. Rev. 2017, 117, 7583–7613. [Google Scholar] [CrossRef]
- Nguyen, A.H.; Peters, E.A.; Schultz, Z.D. Bioanalytical applications of surface-enhanced Raman spectroscopy: De novo molecular identification. Rev. Anal. Chem 2017, 36. [Google Scholar] [CrossRef]
- Lee, J.; Crampton, K.T.; Tallarida, N.; Apkarian, V.A. Visualizing vibrational normal modes of a single molecule with atomically confined light. Nature 2019, 568, 78–82. [Google Scholar] [CrossRef] [PubMed]
- Kumar, N.; Weckhuysen, B.M.; Wain, A.J.; Pollard, A.J. Nanoscale chemical imaging using tip-enhanced Raman spectroscopy. Nat. Protoc. 2019, 14, 1169–1193. [Google Scholar] [CrossRef]
- Neuville, D.R.; de Ligny, D.; Henderson, G.S. Advances in Raman Spectroscopy Applied to Earth and Material Sciences. Rev. Mineral. Geochem. 2014, 78, 509–541. [Google Scholar] [CrossRef]
- Cantarero, A. Raman Scattering Applied to Materials Science. Procedia Mater. Sci. 2015, 9, 113–122. [Google Scholar] [CrossRef] [Green Version]
- Gunter, G.; Hoffmann, G.G. Raman Spectroscopy, Volume I//Raman Spectroscopy: Principles and Applications in Chemistry, Physics, Materials Science, and Biology//Principles and Applications in Chemistry, Physics, Materials Science, and Biology; Momentum Press: New York, NY, USA, 2019; ISBN 9781945612008. [Google Scholar]
- Paudel, A.; Raijada, D.; Rantanen, J. Raman spectroscopy in pharmaceutical product design. Adv. Drug Deliv. Rev. 2015, 89, 3–20. [Google Scholar] [CrossRef] [Green Version]
- Jentzsch, P.; Ramos, L.; Ciobotă, V. Handheld Raman Spectroscopy for the Distinction of Essential Oils Used in the Cosmetics Industry. Cosmetics 2015, 2, 162–176. [Google Scholar] [CrossRef] [Green Version]
- Fluegel, B.; Mialitsin, A.V.; Beaton, D.A.; Reno, J.L.; Mascarenhas, A. Electronic Raman scattering as an ultra-sensitive probe of strain effects in semiconductors. Nat. Commun. 2015, 6, 7136. [Google Scholar] [CrossRef] [Green Version]
- Wheelis, S.E.; Wilson, T.G.; Valderrama, P.; Rodrigues, D.C. Surface characterization of titanium implant healing abutments before and after placement. Clin. Implant Dent. Relat. Res. 2018, 20, 180–190. [Google Scholar] [CrossRef]
- Daood, U.; Banday, N.; Akram, Z.; Tsoi, J.; Neelakantan, P.; Omar, H.; Abduljabbar, T.; Vohra, F.; Al-Hamoudi, N.; Fawzy, A. Mechanical and Spectroscopic Analysis of Retrieved/Failed Dental Implants. Coatings 2017, 7, 201. [Google Scholar] [CrossRef] [Green Version]
- Gaintantzopoulou, M.; Zinelis, S.; Silikas, N.; Eliades, G. Micro-Raman spectroscopic analysis of TiO2 phases on the root surfaces of commercial dental implants. Dent. Mater. 2014, 30, 861–867. [Google Scholar] [CrossRef]
- Xia, W.; Lindahl, C.; Lausmaa, J.; Engqvist, H. Biomimetic Hydroxyapatite Deposition on Titanium Oxide Surfaces for Biomedical Application. In Advances in Biomimetics; George, A., Ed.; InTech: Rijeka, Croatia; CA, USA, 2011; ISBN 978-953-307-191-6. [Google Scholar]
- Kokubo, T. Bioceramics and Their Clinical Applications; CRC Press: Cambridge, UK, 2008; ISBN 978-1-4200-7207-5. [Google Scholar]
- Rahaman, M.N.; Day, D.E.; Bal, B.S.; Fu, Q.; Jung, S.B.; Bonewald, L.F.; Tomsia, A.P. Bioactive glass in tissue engineering. Acta Biomater. 2011, 7, 2355–2373. [Google Scholar] [CrossRef] [PubMed] [Green Version]
- Baino, F.; Hamzehlou, S.; Kargozar, S. Bioactive Glasses: Where Are We and Where Are We Going? J. Funct. Biomater. 2018, 9, 25. [Google Scholar] [CrossRef] [PubMed] [Green Version]
- Baino, F.; Verné, E.; Fiume, E.; Peitl, O.; Zanotto, E.D.; Brandão, S.M.; Schellini, S.A. Bioactive glass and glass-ceramic orbital implants. Int. J. Appl. Ceram. Technol. 2019, 16, 1850–1863. [Google Scholar] [CrossRef]
- Vallittu, P.K. Bioactive glass-containing cranial implants: An overview. J. Mater. Sci. 2017, 52, 8772–8784. [Google Scholar] [CrossRef] [Green Version]
- Han, J.; Zhao, J.; Shen, Z. Zirconia ceramics in metal-free implant dentistry. Adv. Appl. Ceram. 2017, 116, 138–150. [Google Scholar] [CrossRef] [Green Version]
- Osman, R.B.; Swain, M.V. A Critical Review of Dental Implant Materials with an Emphasis on Titanium versus Zirconia. Materials 2015, 8, 932–958. [Google Scholar] [CrossRef] [Green Version]
- Vallet-Regí, M. Evolution of bioceramics within the field of biomaterials. C.R. Chim. 2010, 13, 174–185. [Google Scholar] [CrossRef]
- Grabner, L. Spectroscopic technique for the measurement of residual stress in sintered Al2O3. J. Appl. Phys. 1978, 49, 580–583. [Google Scholar] [CrossRef]
- Ma, Q.; Clarke, D.R. Piezospectroscopic Determination of Residual Stresses in Polycrystalline Alumina. J. Am. Ceram. Soc. 1994, 77, 298–302. [Google Scholar] [CrossRef]
- Lima, C.R.C.; Dosta, S.; Guilemany, J.M.; Clarke, D.R. The application of photoluminescence piezospectroscopy for residual stresses measurement in thermally sprayed TBCs. Surf. Coat. Tech. 2017, 318, 147–156. [Google Scholar] [CrossRef]
- Pollock, T.M.; Lipkin, D.M.; Hemker, K.J. Multifunctional coating interlayers for thermal-barrier systems. Mrs Bull. 2012, 37, 923–931. [Google Scholar] [CrossRef]
- Kim, N.; Yun, H.-B. Noncontact mobile sensing for absolute stress in rail using photoluminescence piezospectroscopy. Struct. Health Monit. 2018, 17, 1213–1224. [Google Scholar] [CrossRef]
- Wang, X. Photoluminescence Piezo-Spectroscopy Method for Measurement of Residual Stresses. In Encyclopedia of Thermal Stresses; Hetnarski, R.B., Ed.; Springer Reference: Dordrecht, The Netherlands, 2014; pp. 3682–3690. ISBN 978-94-007-2738-0. [Google Scholar]
- Pezzotti, G.; Tateiwa, T.; Zhu, W.; Kumakura, T.; Yamada, K.; Yamamoto, K. Fluorescence spectroscopic analysis of surface and subsurface residual stress fields in alumina hip joints. J. Biomed. Opt. 2006, 11, 24009. [Google Scholar] [CrossRef] [PubMed]
- Shavandi, A.; Bekhit, A.E.-D.A.; Sun, Z.F.; Ali, A. A Review of Synthesis Methods, Properties and Use of Hydroxyapatite as a Substitute of Bone. JBBBE 2015, 25, 98–117. [Google Scholar] [CrossRef]
- Fihri, A.; Len, C.; Varma, R.S.; Solhy, A. Hydroxyapatite: A review of syntheses, structure and applications in heterogeneous catalysis. Coord. Chem. Rev. 2017, 347, 48–76. [Google Scholar] [CrossRef]
- Pajor, K.; Pajchel, L.; Kolmas, J. Hydroxyapatite and Fluorapatite in Conservative Dentistry and Oral Implantology-A Review. Materials 2019, 12, 2683. [Google Scholar] [CrossRef] [Green Version]
- Haider, A.; Haider, S.; Han, S.S.; Kang, I.-K. Recent advances in the synthesis, functionalization and biomedical applications of hydroxyapatite: A review. Rsc Adv. 2017, 7, 7442–7458. [Google Scholar] [CrossRef] [Green Version]
- Siddiqui, H.A.; Pickering, K.L.; Mucalo, M.R. A Review on the Use of Hydroxyapatite-Carbonaceous Structure Composites in Bone Replacement Materials for Strengthening Purposes. Materials 2018, 11, 1813. [Google Scholar] [CrossRef] [Green Version]
- Wei, G.; Gong, C.; Hu, K.; Wang, Y.; Zhang, Y. Biomimetic Hydroxyapatite on Graphene Supports for Biomedical Applications: A Review. Nanomaterials 2019, 9, 1435. [Google Scholar] [CrossRef] [Green Version]
- Dippel, B.; Mueller, R.T.; Pingsmann, A.; Schrader, B. Composition, constitution, and interaction of bone with hydroxyapatite coatings determined by FT Raman microscopy. Biospectroscopy 1998, 4, 403–412. [Google Scholar] [CrossRef]
- Döpner, S.; Müller, F.; Hildebrandt, P.; Müller, R.T. Integration of metallic endoprotheses in dog femur studied by near-infrared Fourier-transform Raman microscopy. Biomaterials 2002, 23, 1337–1345. [Google Scholar] [CrossRef]
- Penel, G.; Delfosse, C.; Descamps, M.; Leroy, G. Composition of bone and apatitic biomaterials as revealed by intravital Raman microspectroscopy. Bone 2005, 36, 893–901. [Google Scholar] [CrossRef] [PubMed]
- Seredin, P.; Goloshchapov, D.; Prutskij, T.; Ippolitov, Y. Phase transformations in a human tooth tissue at the initial stage of caries. PLoS ONE 2015, 10, e0124008. [Google Scholar] [CrossRef] [PubMed]
- Mirabella, F.M. Modern Techniques in Applied Molecular Spectroscopy; Wiley: New York, NY, USA, 1998; ISBN 0471123595. [Google Scholar]
- Zeine, C.; Grobe, J. Diffuse reflectance infrared fourier transform (DRIFT) spectroscopy in the preservation of historical monuments: Studies on salt migration. Mikrochim. Acta 1997, 125, 279–282. [Google Scholar] [CrossRef]
- Chiarello, G.L.; Nachtegaal, M.; Marchionni, V.; Quaroni, L.; Ferri, D. Adding diffuse reflectance infrared Fourier transform spectroscopy capability to extended x-ray-absorption fine structure in a new cell to study solid catalysts in combination with a modulation approach. Rev. Sci. Instrum. 2014, 85, 74102. [Google Scholar] [CrossRef]
- Cumming, D.J.; Tumilson, C.; Taylor, S.F.R.; Chansai, S.; Call, A.V.; Jacquemin, J.; Hardacre, C.; Elder, R.H. Development of a diffuse reflectance infrared Fourier transform spectroscopy (DRIFTS) cell for the in situ analysis of co-electrolysis in a solid oxide cell. Faraday Discuss. 2015, 182, 97–111. [Google Scholar] [CrossRef] [Green Version]
- Ford, T.; Rizzo, A.; Hendriks, E.; Frøysaker, T.; Caruso, F. A non-invasive screening study of varnishes applied to three paintings by Edvard Munch using portable diffuse reflectance infrared Fourier transform spectroscopy (DRIFTS). Herit Sci 2019, 7, 200. [Google Scholar] [CrossRef] [Green Version]
- Deiner, L.J.; Farjami, E. Diffuse reflectance infrared spectroscopic identification of dispersant/particle bonding mechanisms in functional inks. J. Vis. Exp. 2015, e52744. [Google Scholar] [CrossRef] [Green Version]
- Jonauske, V.; Stanionyte, S.; Chen, S.-W.; Zarkov, A.; Juskenas, R.; Selskis, A.; Matijosius, T.; Yang, T.C.K.; Ishikawa, K.; Ramanauskas, R.; et al. Characterization of Sol-Gel Derived Calcium Hydroxyapatite Coatings Fabricated on Patterned Rough Stainless Steel Surface. Coatings 2019, 9, 334. [Google Scholar] [CrossRef] [Green Version]
- Rigo, E.C.S.; Boschi, A.O.; Yoshimoto, M.; Allegrini, S.; Konig, B.; Carbonari, M.J. Evaluation in vitro and in vivo of biomimetic hydroxyapatite coated on titanium dental implants. Mater. Sci. Eng. C 2004, 24, 647–651. [Google Scholar] [CrossRef]
- Marín-Pareja, N.; Salvagni, E.; Guillem-Marti, J.; Aparicio, C.; Ginebra, M.-P. Collagen-functionalised titanium surfaces for biological sealing of dental implants: Effect of immobilisation process on fibroblasts response. Colloids Surf. B Biointerfaces 2014, 122, 601–610. [Google Scholar] [CrossRef] [PubMed]
- Raphel, J.; Karlsson, J.; Galli, S.; Wennerberg, A.; Lindsay, C.; Haugh, M.G.; Pajarinen, J.; Goodman, S.B.; Jimbo, R.; Andersson, M.; et al. Engineered protein coatings to improve the osseointegration of dental and orthopaedic implants. Biomaterials 2016, 83, 269–282. [Google Scholar] [CrossRef] [PubMed] [Green Version]
- Raphel, J.; Parisi-Amon, A.; Heilshorn, S. Photoreactive elastin-like proteins for use as versatile bioactive materials and surface coatings. J. Mater. Chem. 2012, 22, 19429–19437. [Google Scholar] [CrossRef] [PubMed] [Green Version]
- Truc, N.T.; Minh, H.H.; Khanh, L.L.; Thuy, V.M.; van Toi, V.; van Man, T.; Nam, H.C.N.; Quyen, T.N.; Hiep, N.T. Modification of type I collagen on TiO2 surface using electrochemical deposition. Surf. Coat. Tech. 2018, 344, 664–672. [Google Scholar] [CrossRef]
- Ao, H.-Y.; Xie, Y.-T.; Yang, S.-B.; Wu, X.-D.; Li, K.; Zheng, X.-B.; Tang, T.-T. Covalently immobilised type I collagen facilitates osteoconduction and osseointegration of titanium coated implants. J. Orthop. Translat. 2016, 5, 16–25. [Google Scholar] [CrossRef] [Green Version]
- Konermann, A.; Götz, W.; Le, M.; Dirk, C.; Lossdörfer, S.; Heinemann, F. Histopathological Verification of Osteoimmunological Mediators in Peri-Implantitis and Correlation to Bone Loss and Implant Functional Period. J. Oral Implantol. 2016, 42, 61–68. [Google Scholar] [CrossRef]
- Shnaiderman-Shapiro, A.; Dayan, D.; Buchner, A.; Schwartz, I.; Yahalom, R.; Vered, M. Histopathological spectrum of bone lesions associated with dental implant failure: Osteomyelitis and beyond. Head Neck Pathol. 2015, 9, 140–146. [Google Scholar] [CrossRef] [Green Version]
- Vlahović, Z.; Marković, A.; Lazić, Z.; Šćepanović, M.; Đinić, A.; Kalanović, M. Histopathological comparative analysis of periimplant bone inflammatory response after dental implant insertion using flap and flapless surgical technique. An experimental study in pigs. Clin. Oral Implant. Res. 2017, 28, 1067–1073. [Google Scholar] [CrossRef]
- Linag, Y.; Li, H.; Xu, J.; Li, X.I.N.; Li, X.; Yam, Y.; Qi, M.; Hi, M.I.N. Strontium coating by electrochemical deposition improves implant osseointegration in osteopenic models. Exp. Ther. Med. 2014, 9, 172–176. [Google Scholar] [CrossRef]
- Chen, R.; Willcox, M.D.P.; Ho, K.K.K.; Smyth, D.; Kumar, N. Antimicrobial peptide melimine coating for titanium and its in vivo antibacterial activity in rodent subcutaneous infection models. Biomaterials 2016, 85, 142–151. [Google Scholar] [CrossRef]
- Summers, R.B. A new concept in maxillary implant surgery: The osteotome technique. Compendium 1994, 15, 152, 154–156, 158 passim; quiz 162. [Google Scholar] [PubMed]
- Yu, Y.; Jin, G.; Xue, Y.; Wang, D.; Liu, X.; Sun, J. Multifunctions of dual Zn/Mg ion co-implanted titanium on osteogenesis, angiogenesis and bacteria inhibition for dental implants. Acta Biomater. 2017, 49, 590–603. [Google Scholar] [CrossRef] [PubMed] [Green Version]
- Gryshkov, O.; Klyui, N.I.; Temchenko, V.P.; Kyselov, V.S.; Chatterjee, A.; Belyaev, A.E.; Lauterboeck, L.; Iarmolenko, D.; Glasmacher, B. Porous biomorphic silicon carbide ceramics coated with hydroxyapatite as prospective materials for bone implants. Mater. Sci. Eng. C Mater. Biol. Appl. 2016, 68, 143–152. [Google Scholar] [CrossRef]
- Xiang, Y.; Li, J.; Liu, X.; Cui, Z.; Yang, X.; Yeung, K.W.K.; Pan, H.; Wu, S. Construction of poly(lactic-co-glycolic acid)/ZnO nanorods/Ag nanoparticles hybrid coating on Ti implants for enhanced antibacterial activity and biocompatibility. Mater. Sci. Eng. C Mater. Biol. Appl. 2017, 79, 629–637. [Google Scholar] [CrossRef] [PubMed]
- Spiers, K.; Cardamone, T.; Furness, J.B.; Clark, J.C.M.; Patrick, J.F.; Clark, G.M. An X-ray fluorescence microscopic analysis of the tissue surrounding the multi-channel cochlear implant electrode array. Cochlear Implant. Int. 2016, 17, 129–131. [Google Scholar] [CrossRef]
- Bilo, F.; Borgese, L.; Prost, J.; Rauwolf, M.; Turyanskaya, A.; Wobrauschek, P.; Kregsamer, P.; Streli, C.; Pazzaglia, U.; Depero, L.E. Atomic layer deposition to prevent metal transfer from implants: An X-ray fluorescence study. Appl. Surf. Sci. 2015, 359, 215–220. [Google Scholar] [CrossRef]
- Uo, M. Dissolution of nickel and tissue response observed by X-ray scanning analytical microscopy. Biomaterials 1999, 20, 747–755. [Google Scholar] [CrossRef]
- Zhao, C.; Pandit, S.; Fu, Y.; Mijakovic, I.; Jesorka, A.; Liu, J. Graphene oxide based coatings on nitinol for biomedical implant applications: Effectively promote mammalian cell growth but kill bacteria. Rsc Adv. 2016, 6, 38124–38134. [Google Scholar] [CrossRef]
- Burmeister, J.S.; Olivier, L.A.; Reichert, W.M.; Truskey, G.A. Application of total internal reflection fluorescence microscopy to study cell adhesion to biomaterials. Biomaterials 1998, 19, 307–325. [Google Scholar] [CrossRef]
- Truskey, G.A.; Burmeister, J.S.; Grapa, E.; Reichert, W.M. Total internal reflection fluorescence microscopy (TIRFM). II. Topographical mapping of relative cell/substratum separation distances. J. Cell Sci. 1992, 103 Pt 2, 491–499. [Google Scholar]
- Berdichevski, A.; Simaan Yameen, H.; Dafni, H.; Neeman, M.; Seliktar, D. Using bimodal MRI/fluorescence imaging to identify host angiogenic response to implants. Proc. Natl. Acad. Sci. USA 2015, 112, 5147–5152. [Google Scholar] [CrossRef] [PubMed] [Green Version]
- Lovati, A.B.; Lopa, S.; Talò, G.; Previdi, S.; Recordati, C.; Mercuri, D.; Segatti, F.; Zagra, L.; Moretti, M. In vivo evaluation of bone deposition in macroporous titanium implants loaded with mesenchymal stem cells and strontium-enriched hydrogel. J. Biomed. Mater. Res. Part B Appl. Biomater. 2015, 103, 448–456. [Google Scholar] [CrossRef] [PubMed]
- Markovic, S.; Belz, J.; Kumar, R.; Cormack, R.A.; Sridhar, S.; Niedre, M. Near-infrared fluorescence imaging platform for quantifying in vivo nanoparticle diffusion from drug loaded implants. Int. J. Nanomed. 2016, 11, 1213–1223. [Google Scholar] [CrossRef] [PubMed] [Green Version]
- Kubitscheck, U. Fluorescence Microscopy: From Principles to Biological Applications/Edited by Ulrich Kubitscheck, 2nd ed.; Wiley-VCH: Weinheim, Germany, 2017; ISBN 9783527687756. [Google Scholar]
- Liu, J.; Sun, Y.-Q.; Zhang, H.; Shi, H.; Shi, Y.; Guo, W. Sulfone-Rhodamines: A New Class of Near-Infrared Fluorescent Dyes for Bioimaging. Acs Appl. Mater. Interfaces 2016, 8, 22953–22962. [Google Scholar] [CrossRef]
- Yu, J.; Su, X.; Zhu, C.; Pan, Q.; Yang, J.; Ma, J.; Shen, L.; Cao, H.; Li, L. GFP Labeling and Hepatic Differentiation Potential of Human Placenta-Derived Mesenchymal Stem Cells. Cell. Physiol. Biochem. 2015, 35, 2299–2308. [Google Scholar] [CrossRef]
- Beija, M.; Afonso, C.A.M.; Martinho, J.M.G. Synthesis and applications of Rhodamine derivatives as fluorescent probes. Chem. Soc. Rev. 2009, 38, 2410–2433. [Google Scholar] [CrossRef] [Green Version]
- Xie, L.; Chen, Y.; Wu, W.; Guo, H.; Zhao, J.; Yu, X. Fluorescent coumarin derivatives with large stokes shift, dual emission and solid state luminescent properties: An experimental and theoretical study. Dye. Pigm. 2012, 92, 1361–1369. [Google Scholar] [CrossRef]
- Zhang, X.-F.; Zhang, J.; Liu, L. Fluorescence properties of twenty fluorescein derivatives: Lifetime, quantum yield, absorption and emission spectra. J. Fluoresc. 2014, 24, 819–826. [Google Scholar] [CrossRef]
- Reiss, P.; Quemard, G.; Carayon, S.; Bleuse, J.; Chandezon, F.; Pron, A. Luminescent ZnSe nanocrystals of high color purity. Mater. Chem. Phys. 2004, 84, 10–13. [Google Scholar] [CrossRef]
- Cui, R.; Liu, H.-H.; Xie, H.-Y.; Zhang, Z.-L.; Yang, Y.-R.; Pang, D.-W.; Xie, Z.-X.; Chen, B.-B.; Hu, B.; Shen, P. Living Yeast Cells as a Controllable Biosynthesizer for Fluorescent Quantum Dots. Adv. Funct. Mater. 2009, 19, 2359–2364. [Google Scholar] [CrossRef]
- Chen, H.-S.; Hsu, C.-K.; Hong, H.-Y. InGaN-CdSe-ZnSe quantum dots white LEDs. Ieee Photon. Technol. Lett. 2006, 18, 193–195. [Google Scholar] [CrossRef]
- Suzuki, T.; Fujikura, K.; Higashiyama, T.; Takata, K. DNA staining for fluorescence and laser confocal microscopy. J. Histochem. Cytochem. 1997, 45, 49–53. [Google Scholar] [CrossRef] [PubMed] [Green Version]
- Chazotte, B. Labeling cytoskeletal F-actin with rhodamine phalloidin or fluorescein phalloidin for imaging. Cold Spring Harb. Protoc. 2010, 2010, pdb.prot4947. [Google Scholar] [CrossRef] [PubMed]
- Macri-Pellizzeri, L.; de Melo, N.; Ahmed, I.; Grant, D.; Scammell, B.; Sottile, V. Live Quantitative Monitoring of Mineral Deposition in Stem Cells Using Tetracycline Hydrochloride. Tissue Eng. Part C Methods 2018, 24, 171–178. [Google Scholar] [CrossRef] [Green Version]
- Stiefel, P.; Schmidt-Emrich, S.; Maniura-Weber, K.; Ren, Q. Critical aspects of using bacterial cell viability assays with the fluorophores SYTO9 and propidium iodide. BMC Microbiol. 2015, 15, 36. [Google Scholar] [CrossRef] [Green Version]
- Cell Cycle- Materials and Methods; Pagano, M. (Ed.) Springer Verlag: New York, NY, USA, 1995; ISBN 9780387580661. [Google Scholar]
- Chalfie, M.; Kain, S. Green Fluorescent Protein: Properties, Applications and Protocols/Edited by Martin Chalfie, Steven, P. Kain, 2nd ed.; Wiley: New York, NY, USA, 2006; ISBN 0471736821. [Google Scholar]
- Hoffmann, C.; Gaietta, G.; Zürn, A.; Adams, S.R.; Terrillon, S.; Ellisman, M.H.; Tsien, R.Y.; Lohse, M.J. Fluorescent labeling of tetracysteine-tagged proteins in intact cells. Nat. Protoc. 2010, 5, 1666–1677. [Google Scholar] [CrossRef]
- Lichtman, J.W.; Conchello, J.-A. Fluorescence microscopy. Nat. Methods 2005, 2, 910–919. [Google Scholar] [CrossRef]
- Nkenke, E.; Kloss, F.; Wiltfang, J.; Schultze-Mosgau, S.; Radespiel-Troger, M.; Loos, K.; Neukam, F.W. Histomorphometric and fluorescence microscopic analysis of bone remodelling after installation of implants using an osteotome technique. Clin. Oral. Implant. Res. 2002, 13, 595–602. [Google Scholar] [CrossRef]
- Hennig, B.; Toborek, M.; McClain, C.J. Antiatherogenic properties of zinc: Implications in endothelial cell metabolism. Nutrition 1996, 12, 711–717. [Google Scholar] [CrossRef]
- Zreiqat, H.; Howlett, C.R.; Zannettino, A.; Evans, P.; Schulze-Tanzil, G.; Knabe, C.; Shakibaei, M. Mechanisms of magnesium-stimulated adhesion of osteoblastic cells to commonly used orthopaedic implants. J. Biomed. Mater. Res. 2002, 62, 175–184. [Google Scholar] [CrossRef]
- Michette, A.G.; Morrison, G.R.; Buckley, C.J. X-Ray Microscopy III: Proceedings of the Third International Conference, London, UK, 3–7 September 1990; Springer: Berlin/Heidelberg, Germany, 1992; ISBN 9783662138946. [Google Scholar]
- Nakasako, M. X-Ray Diffraction Imaging of Biological Cells; Springer: Tokyo, Japan, 2018; ISBN 4431566163. [Google Scholar]
- Hawkes, P.W.; Spence, J.C.H. Springer Handbook of Microscopy; Springer: Cham, Switzerland, 2019; ISBN 9783030000684. [Google Scholar]
- Rivers, M.L.; Sutton, S.R.; Jones, K.W. Synchrotron X-ray fluorescence microscopy. Synchrotron Radiat. News 1991, 4, 23–26. [Google Scholar] [CrossRef]
- Cheremisinoff, N.P. Elemental and Structural Characterization Tests. In Polymer Characterization: Laboratory Techniques and Analysis/by Nicholas, P. Cheremisinoff; Cheremisinoff, N.P., Ed.; Noyes Publications: Westwood, NJ, USA, 1996; pp. 43–81. ISBN 9780815514039. [Google Scholar]
- Matsumoto, B. Cell Biological Applications of Confocal Microscopy, 2nd ed.; Academic Press: Amsterdam, The Netherlands, 2002; ISBN 9780124802773. [Google Scholar]
- Pawley, J.B. Handbook of Biological Confocal Microscopy, 3rd ed.; Springer: New York, NY, USA, 2005; ISBN 9780387259215. [Google Scholar]
- Price, R.L.; Jerome, W.G. Basic Confocal Microscopy, 2nd ed.; Springer Science+Business Media, LLC: New York, NY, USA, 2018; ISBN 9780387781747. [Google Scholar]
- Nwaneshiudu, A.; Kuschal, C.; Sakamoto, F.H.; Anderson, R.R.; Schwarzenberger, K.; Young, R.C. Introduction to confocal microscopy. J. Investig. Dermatol. 2012, 132, e3. [Google Scholar] [CrossRef] [Green Version]
- Khosla, S.; Melton, L.J. Clinical practice. Osteopenia. N. Engl. J. Med. 2007, 356, 2293–2300. [Google Scholar] [CrossRef] [PubMed]
- Jurczak, P.; Witkowska, J.; Rodziewicz-Motowidlo, S.; Lach, S. Proteins, peptides and peptidomimetics as active agents in implant surface functionalization. Adv. Colloid Interface Sci. 2019, 102083. [Google Scholar] [CrossRef]
- Super-Resolution Microscopy: Methods and Protocols; Erfle, H. (Ed.) Springer: New York, NY, USA, 2017; ISBN 1493972650. [Google Scholar]
- Fluorescence Microscopy: Super-Resolution and Other Novel Techniques, 1st ed.; Cornea, A.; Conn, P.M. (Eds.) Academic/Elsevier Press: London, UK, 2014; ISBN 9780124167131. [Google Scholar]
- Birk, U.J. Super-resolution Microscopy: A Practical Guide; Wiley-VCH: Mainz, Germany; John Wiley & Sons, Inc.: Hoboken, NJ, USA, 2017; ISBN 9783527802067. [Google Scholar]
- Axelrod, D. Total internal reflection fluorescence microscopy in cell biology. Traffic 2001, 2, 764–774. [Google Scholar] [CrossRef]
- Poulter, N.S.; Pitkeathly, W.T.E.; Smith, P.J.; Rappoport, J.Z. The physical basis of total internal reflection fluorescence (TIRF) microscopy and its cellular applications. Methods Mol. Biol. 2015, 1251, 1–23. [Google Scholar] [CrossRef]
- Fu, Y.; Winter, P.W.; Rojas, R.; Wang, V.; McAuliffe, M.; Patterson, G.H. Axial superresolution via multiangle TIRF microscopy with sequential imaging and photobleaching. Proc. Natl. Acad. Sci. USA 2016, 113, 4368–4373. [Google Scholar] [CrossRef] [Green Version]
- Mattheyses, A.L.; Simon, S.M.; Rappoport, J.Z. Imaging with total internal reflection fluorescence microscopy for the cell biologist. J. Cell Sci. 2010, 123, 3621–3628. [Google Scholar] [CrossRef] [Green Version]
- Thompson, N.L.; Lagerholm, B.C. Total internal reflection fluorescence: Applications in cellular biophysics. Curr. Opin. Biotech. 1997, 8, 58–64. [Google Scholar] [CrossRef]
- Degasne, I.; Baslé, M.F.; Demais, V.; Huré, G.; Lesourd, M.; Grolleau, B.; Mercier, L.; Chappard, D. Effects of roughness, fibronectin and vitronectin on attachment, spreading, and proliferation of human osteoblast-like cells (Saos-2) on titanium surfaces. Calcif. Tissue Int. 1999, 64, 499–507. [Google Scholar] [CrossRef]
- Massia, S.P.; Hubbell, J.A. An RGD spacing of 440 nm is sufficient for integrin alpha V beta 3-mediated fibroblast spreading and 140 nm for focal contact and stress fiber formation. J. Cell Biol. 1991, 114, 1089–1100. [Google Scholar] [CrossRef] [PubMed]
Figure 1.
Spectroscopy utilizes parts of electromagnetic spectrum for analysis and studies of the processes occurring on the surface and in the subsurface regions of implants manufactured from metal alloys and bioceramic materials.
Figure 1.
Spectroscopy utilizes parts of electromagnetic spectrum for analysis and studies of the processes occurring on the surface and in the subsurface regions of implants manufactured from metal alloys and bioceramic materials.

Figure 2.
An Auger electron spectroscopy (AES) spectrum, for rutile TiO2 single crystal at different primary electron beam intensities. Figure adapted with permission from [39].
Figure 2.
An Auger electron spectroscopy (AES) spectrum, for rutile TiO2 single crystal at different primary electron beam intensities. Figure adapted with permission from [39].
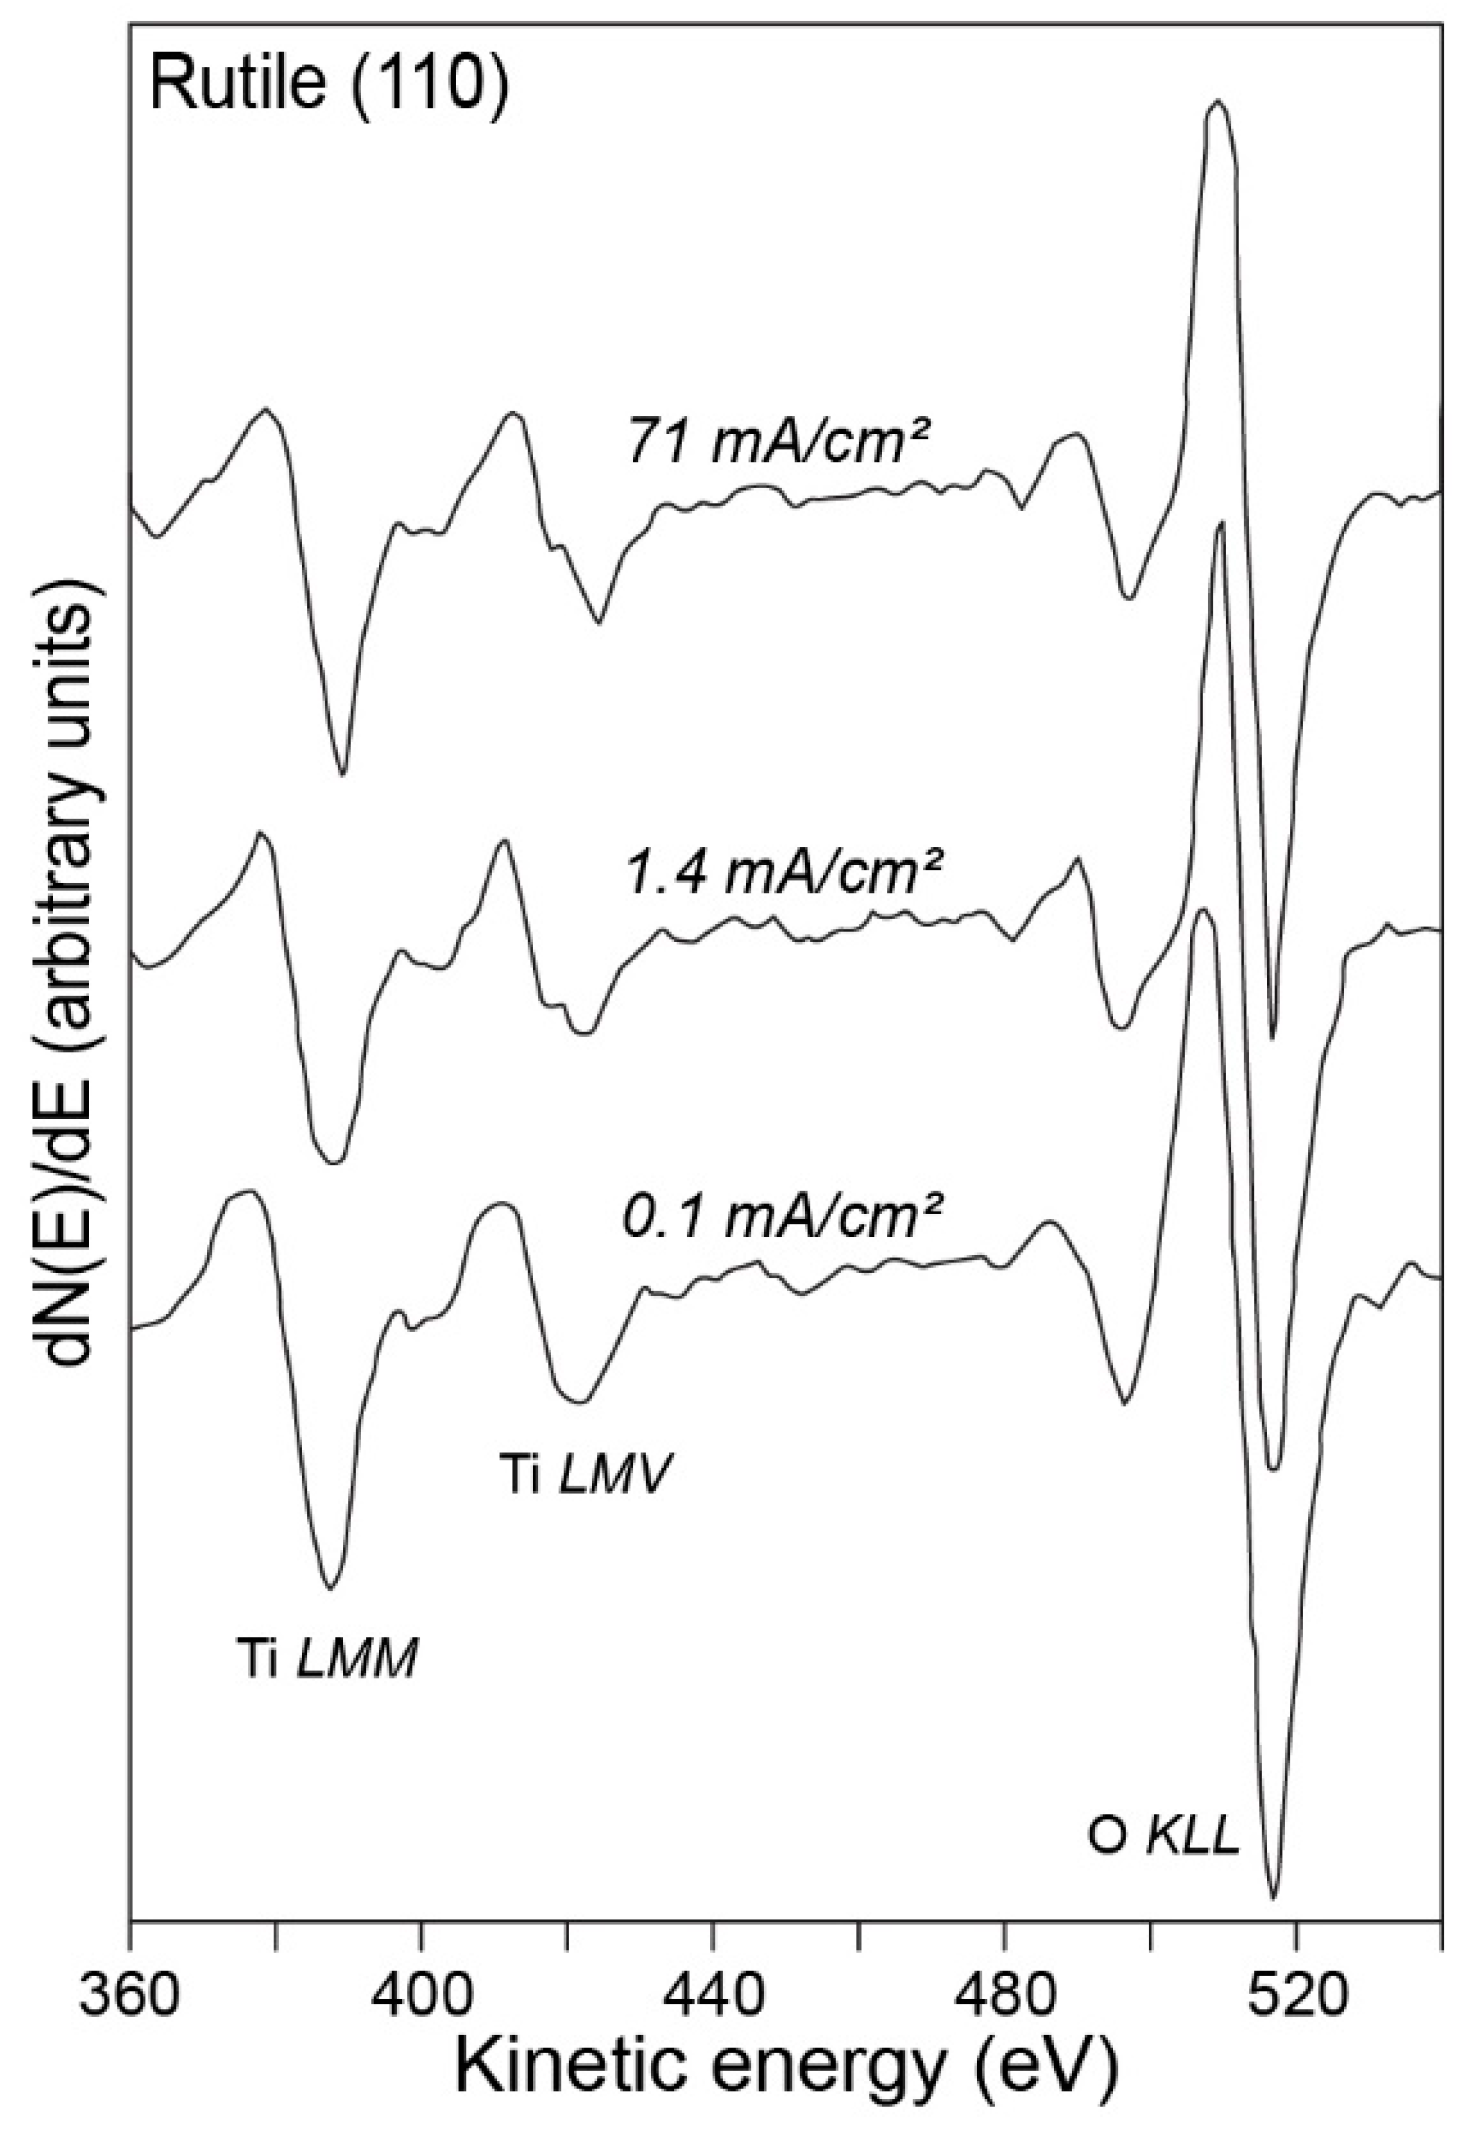
Figure 3.
Examples of AES spectra recorded during various experiments. (a) Anodic oxides of titanium prepared in several electrolytes, (b) comparison between machined (top) and nitrogen ion implanted (bottom) samples, and (c) thickness of an oxide layer as a function of temperature. Figure adapted with permission from [39].
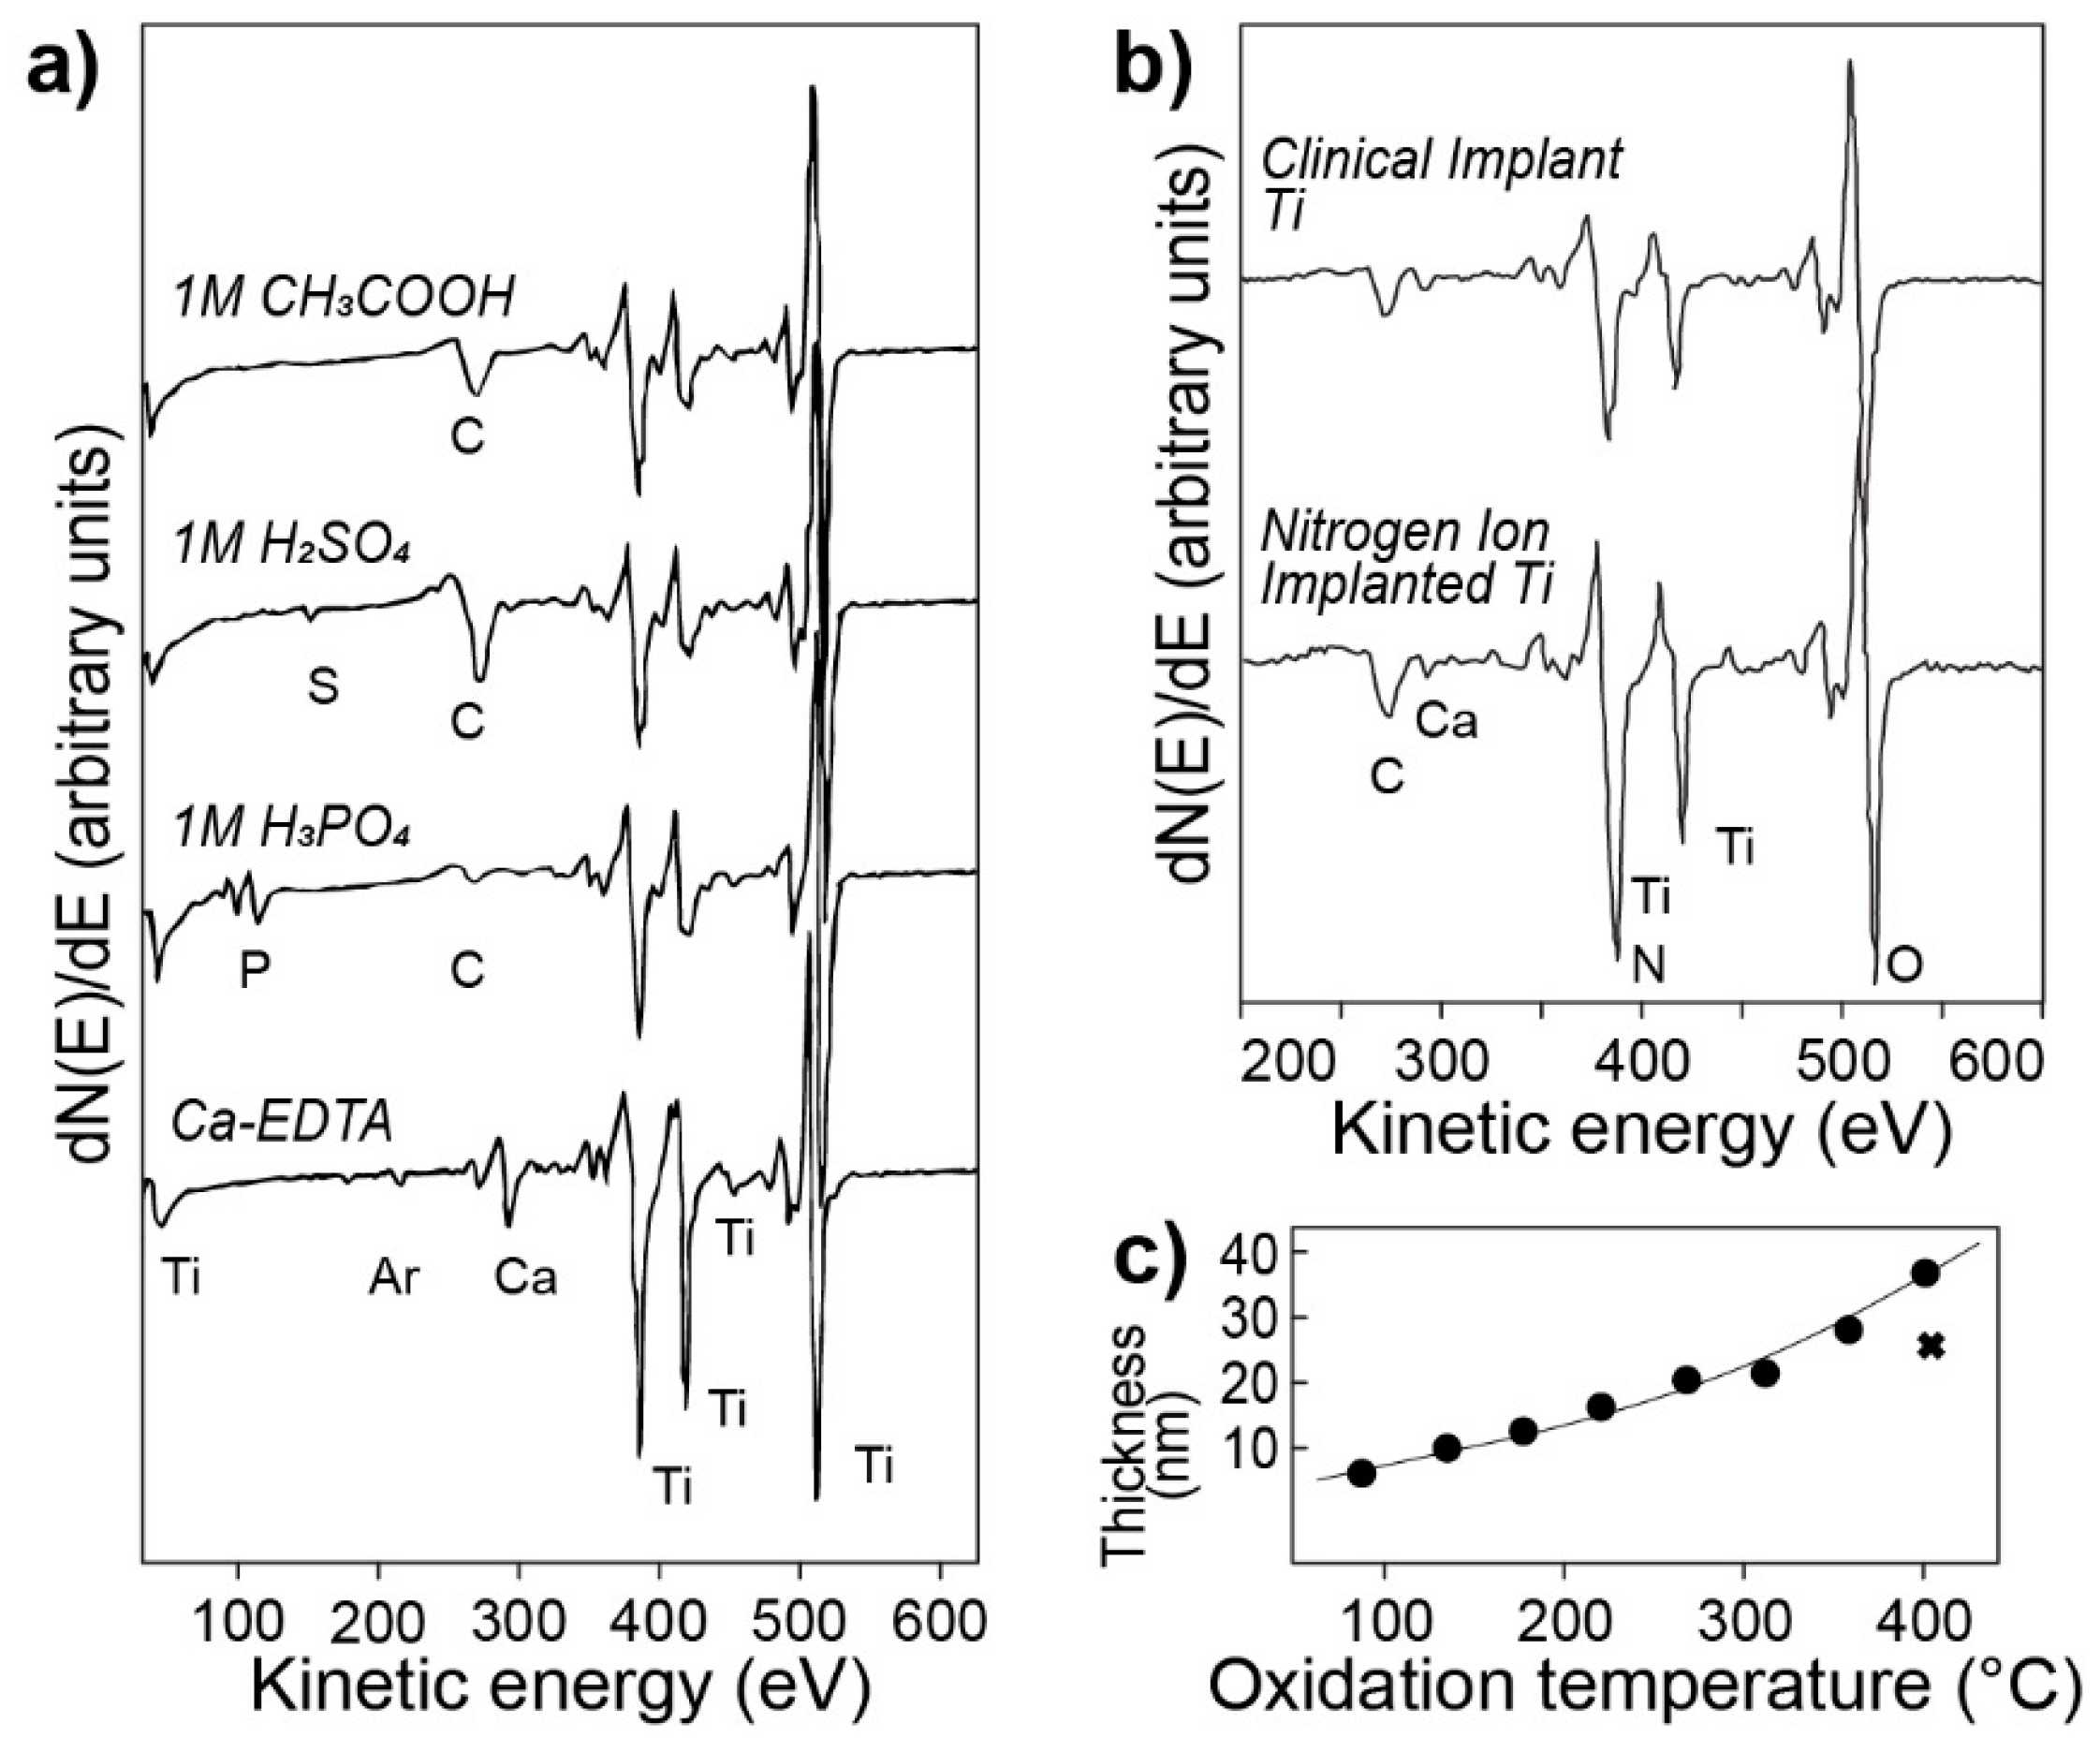
Figure 4.
X-ray photoelectron spectroscopy (XPS) spectrum of a titanium implant surface revealing its composition. Figure adapted with permission from [39].
Figure 4.
X-ray photoelectron spectroscopy (XPS) spectrum of a titanium implant surface revealing its composition. Figure adapted with permission from [39].

Figure 5.
Examples of XPS spectra of titanium implant surfaces. Figure adapted from [51] with permission from The Royal Society of Chemistry.
Figure 5.
Examples of XPS spectra of titanium implant surfaces. Figure adapted from [51] with permission from The Royal Society of Chemistry.

Figure 6.
XPS spectra of newly formed bone after (a) four weeks, (b) eight weeks in the proximity of the titanium implant, and (c) cortical bone, as a control. Figure adapted with permission from [52].
Figure 6.
XPS spectra of newly formed bone after (a) four weeks, (b) eight weeks in the proximity of the titanium implant, and (c) cortical bone, as a control. Figure adapted with permission from [52].
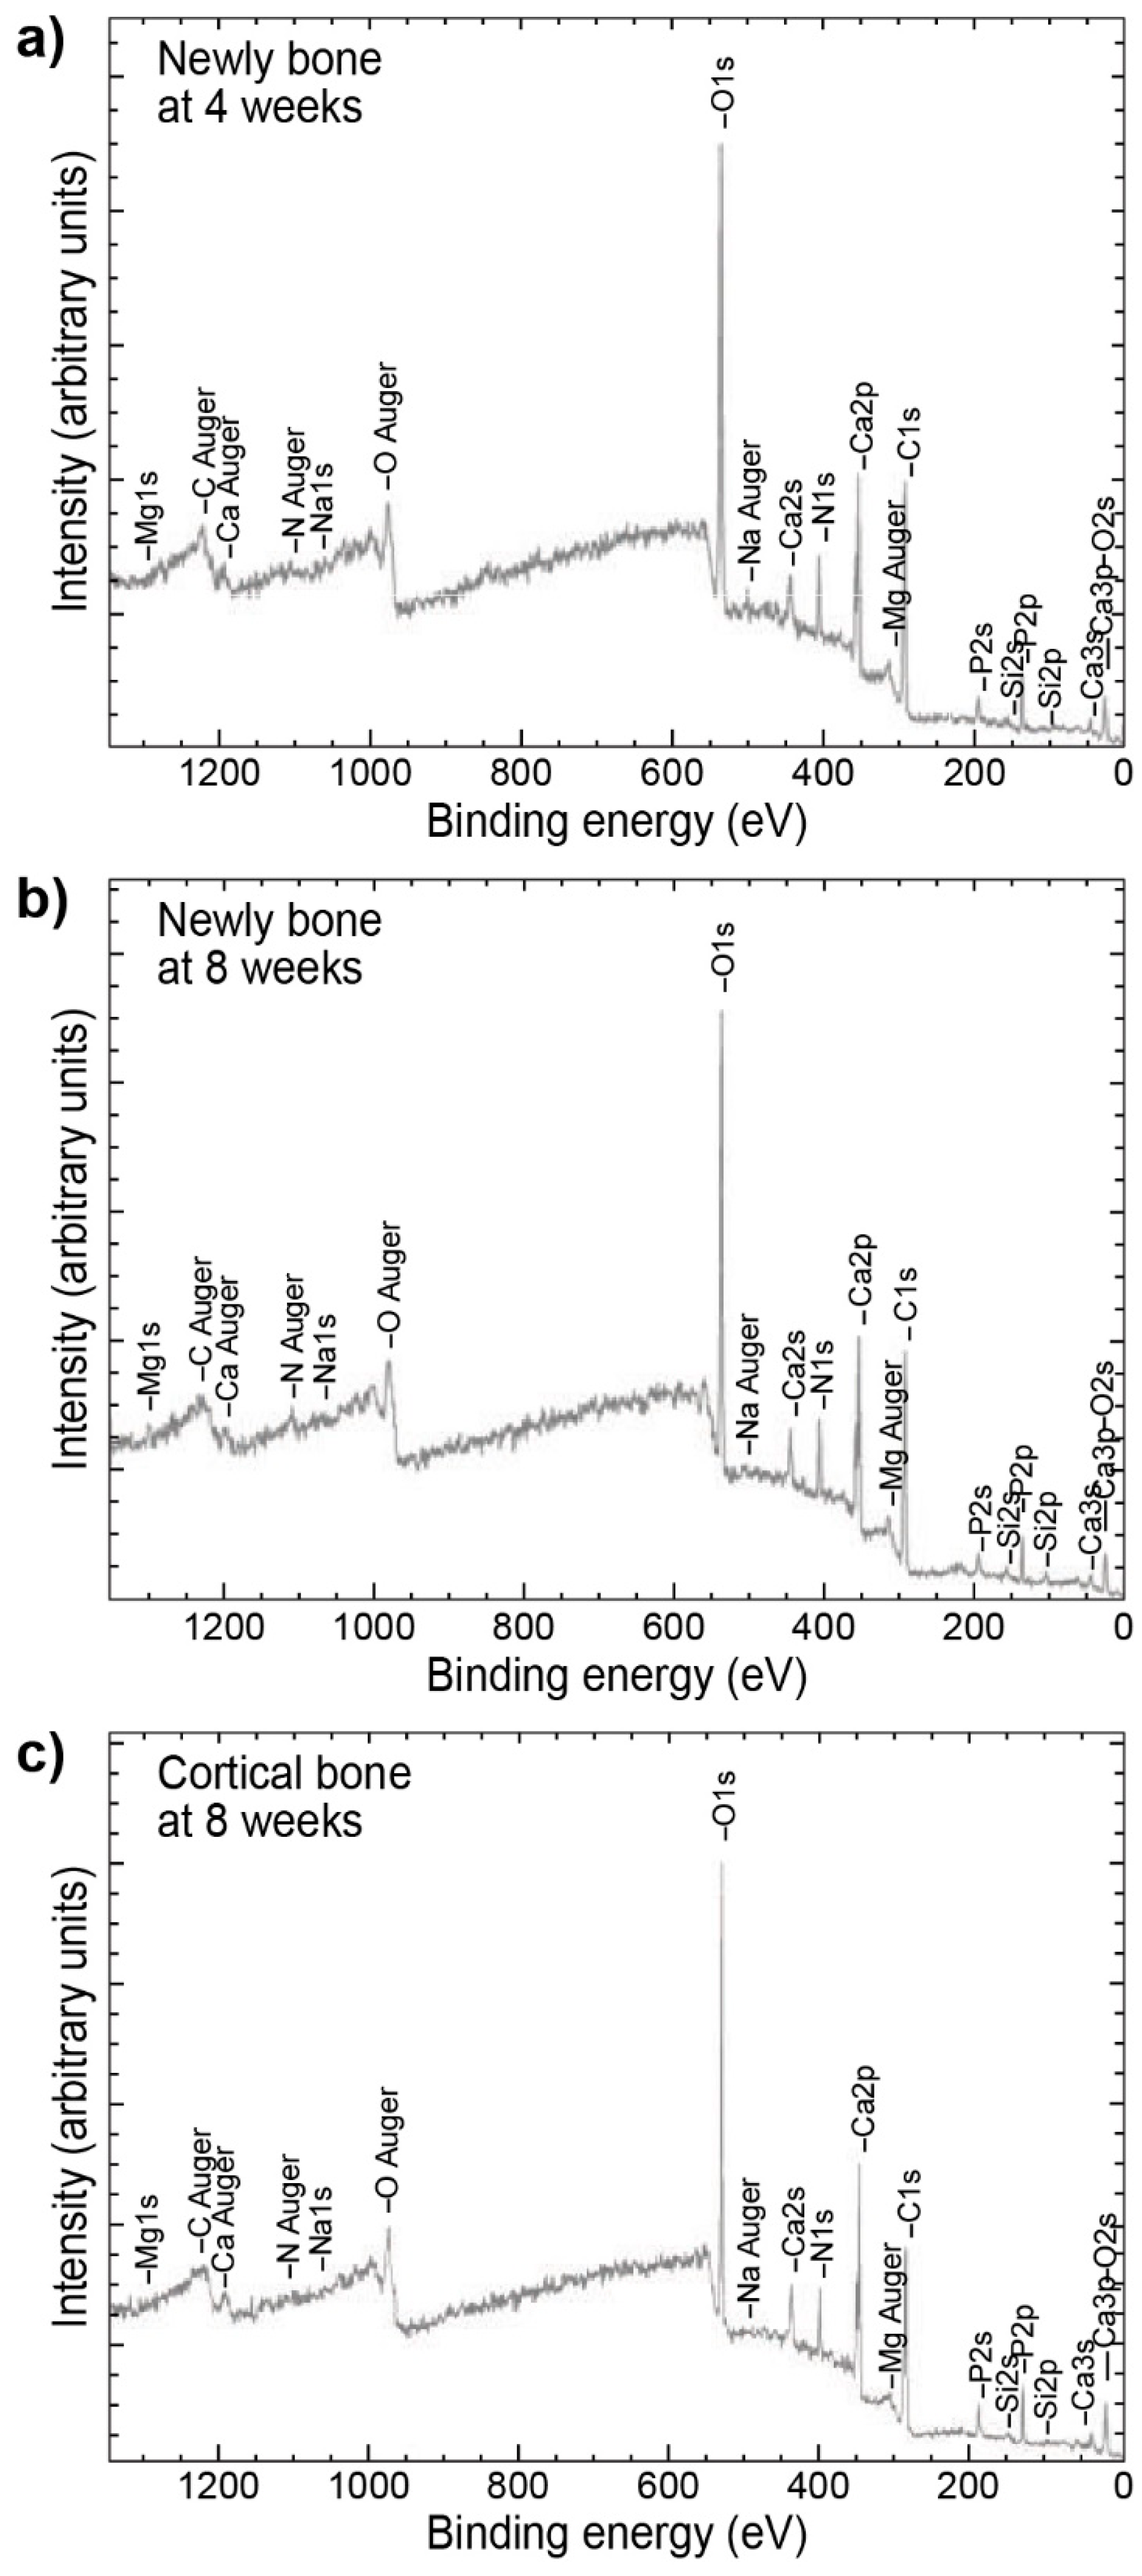
Figure 7.
Narrow scan XPS spectra comparing newly formed and cortical bone after (a) four and (b) eight weeks. Figure adapted with permission from [52].
Figure 7.
Narrow scan XPS spectra comparing newly formed and cortical bone after (a) four and (b) eight weeks. Figure adapted with permission from [52].
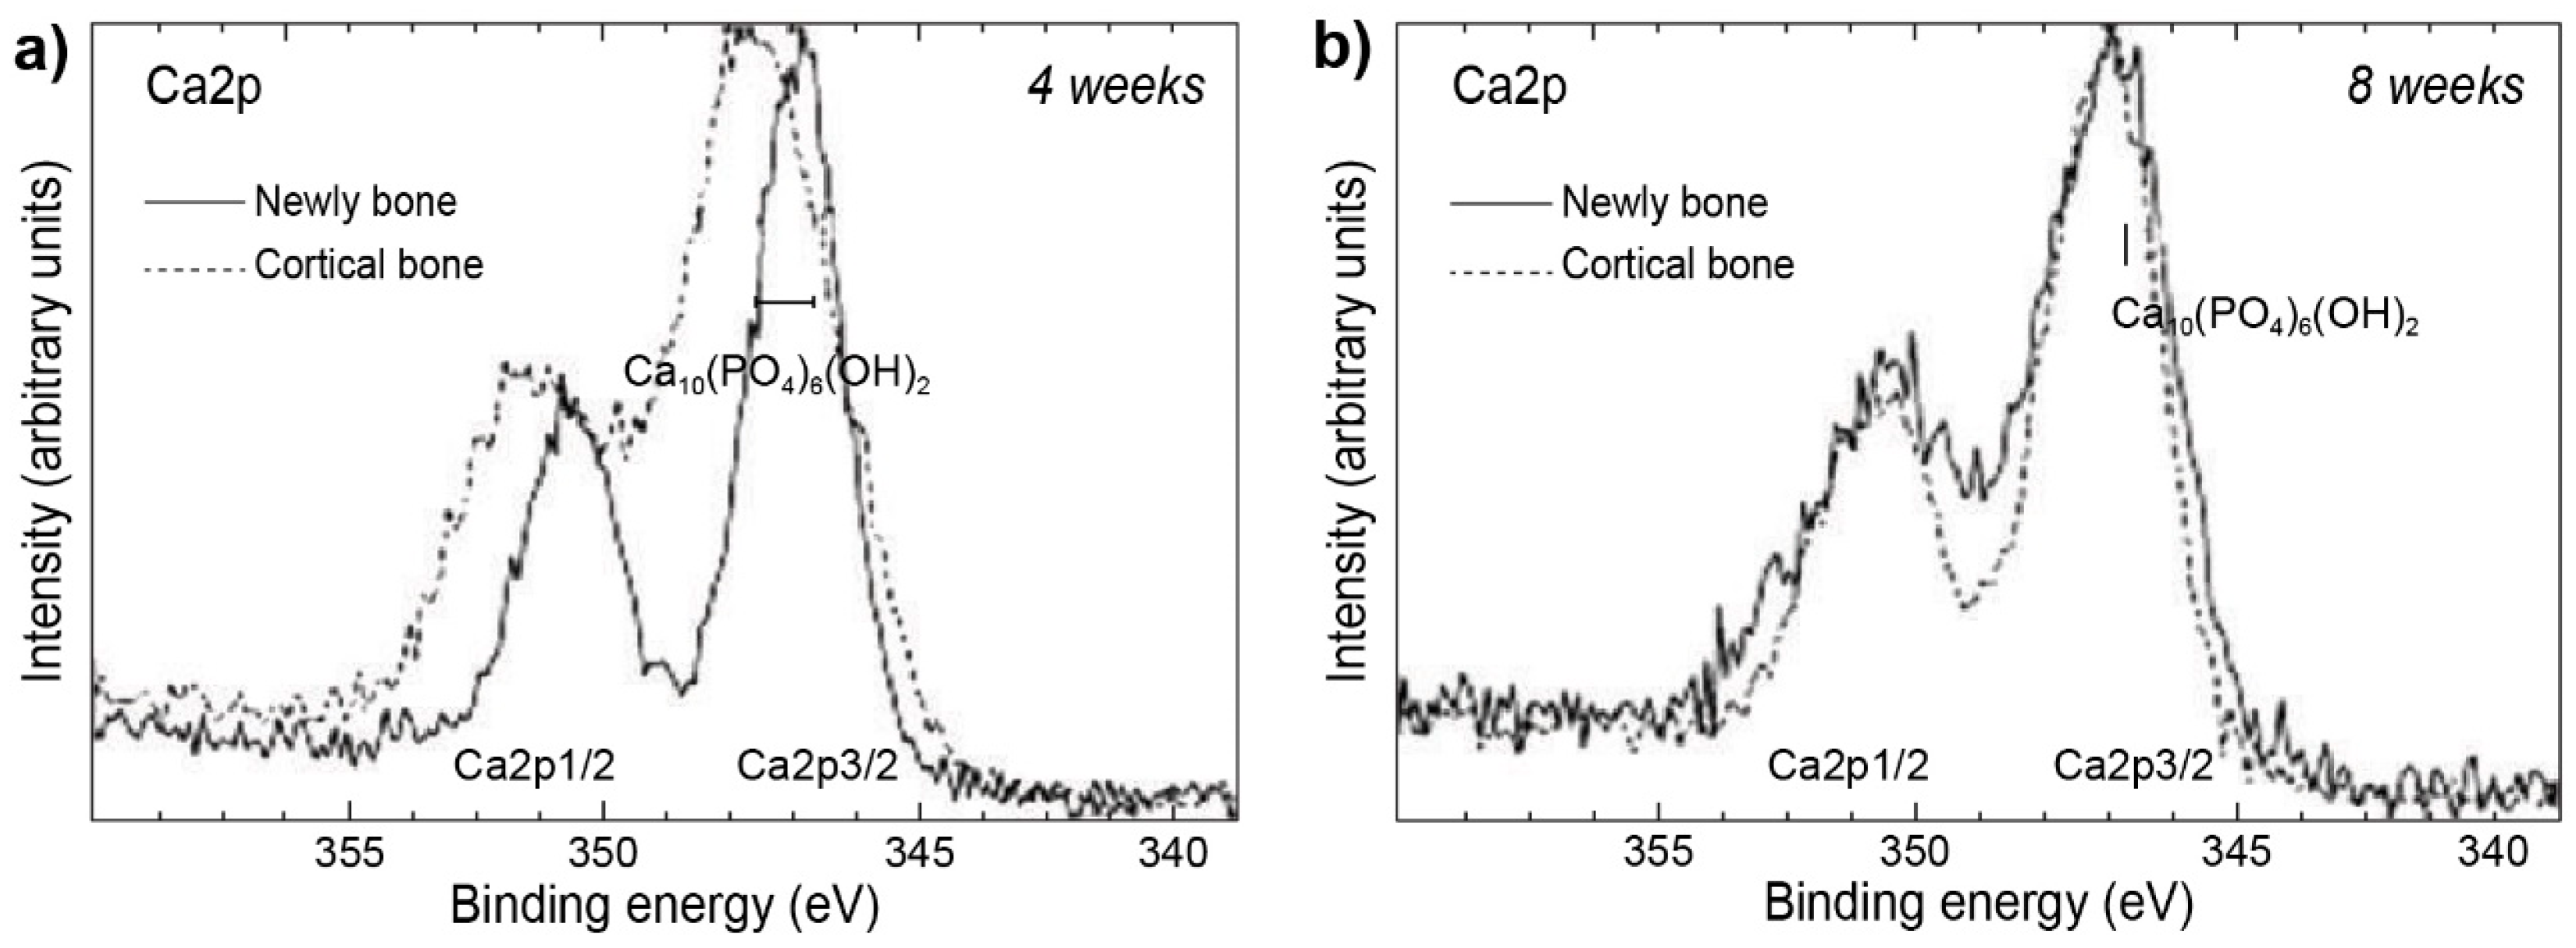
Figure 8.
Implant abutments. Examples of (a) of various geometries of abutments and (b) their placement in the oral cavity. Pictures (b) reproduced with permission from Reusing Titanium Healing Abutments, Darin Dichter, 4 April 2016.
Figure 8.
Implant abutments. Examples of (a) of various geometries of abutments and (b) their placement in the oral cavity. Pictures (b) reproduced with permission from Reusing Titanium Healing Abutments, Darin Dichter, 4 April 2016.
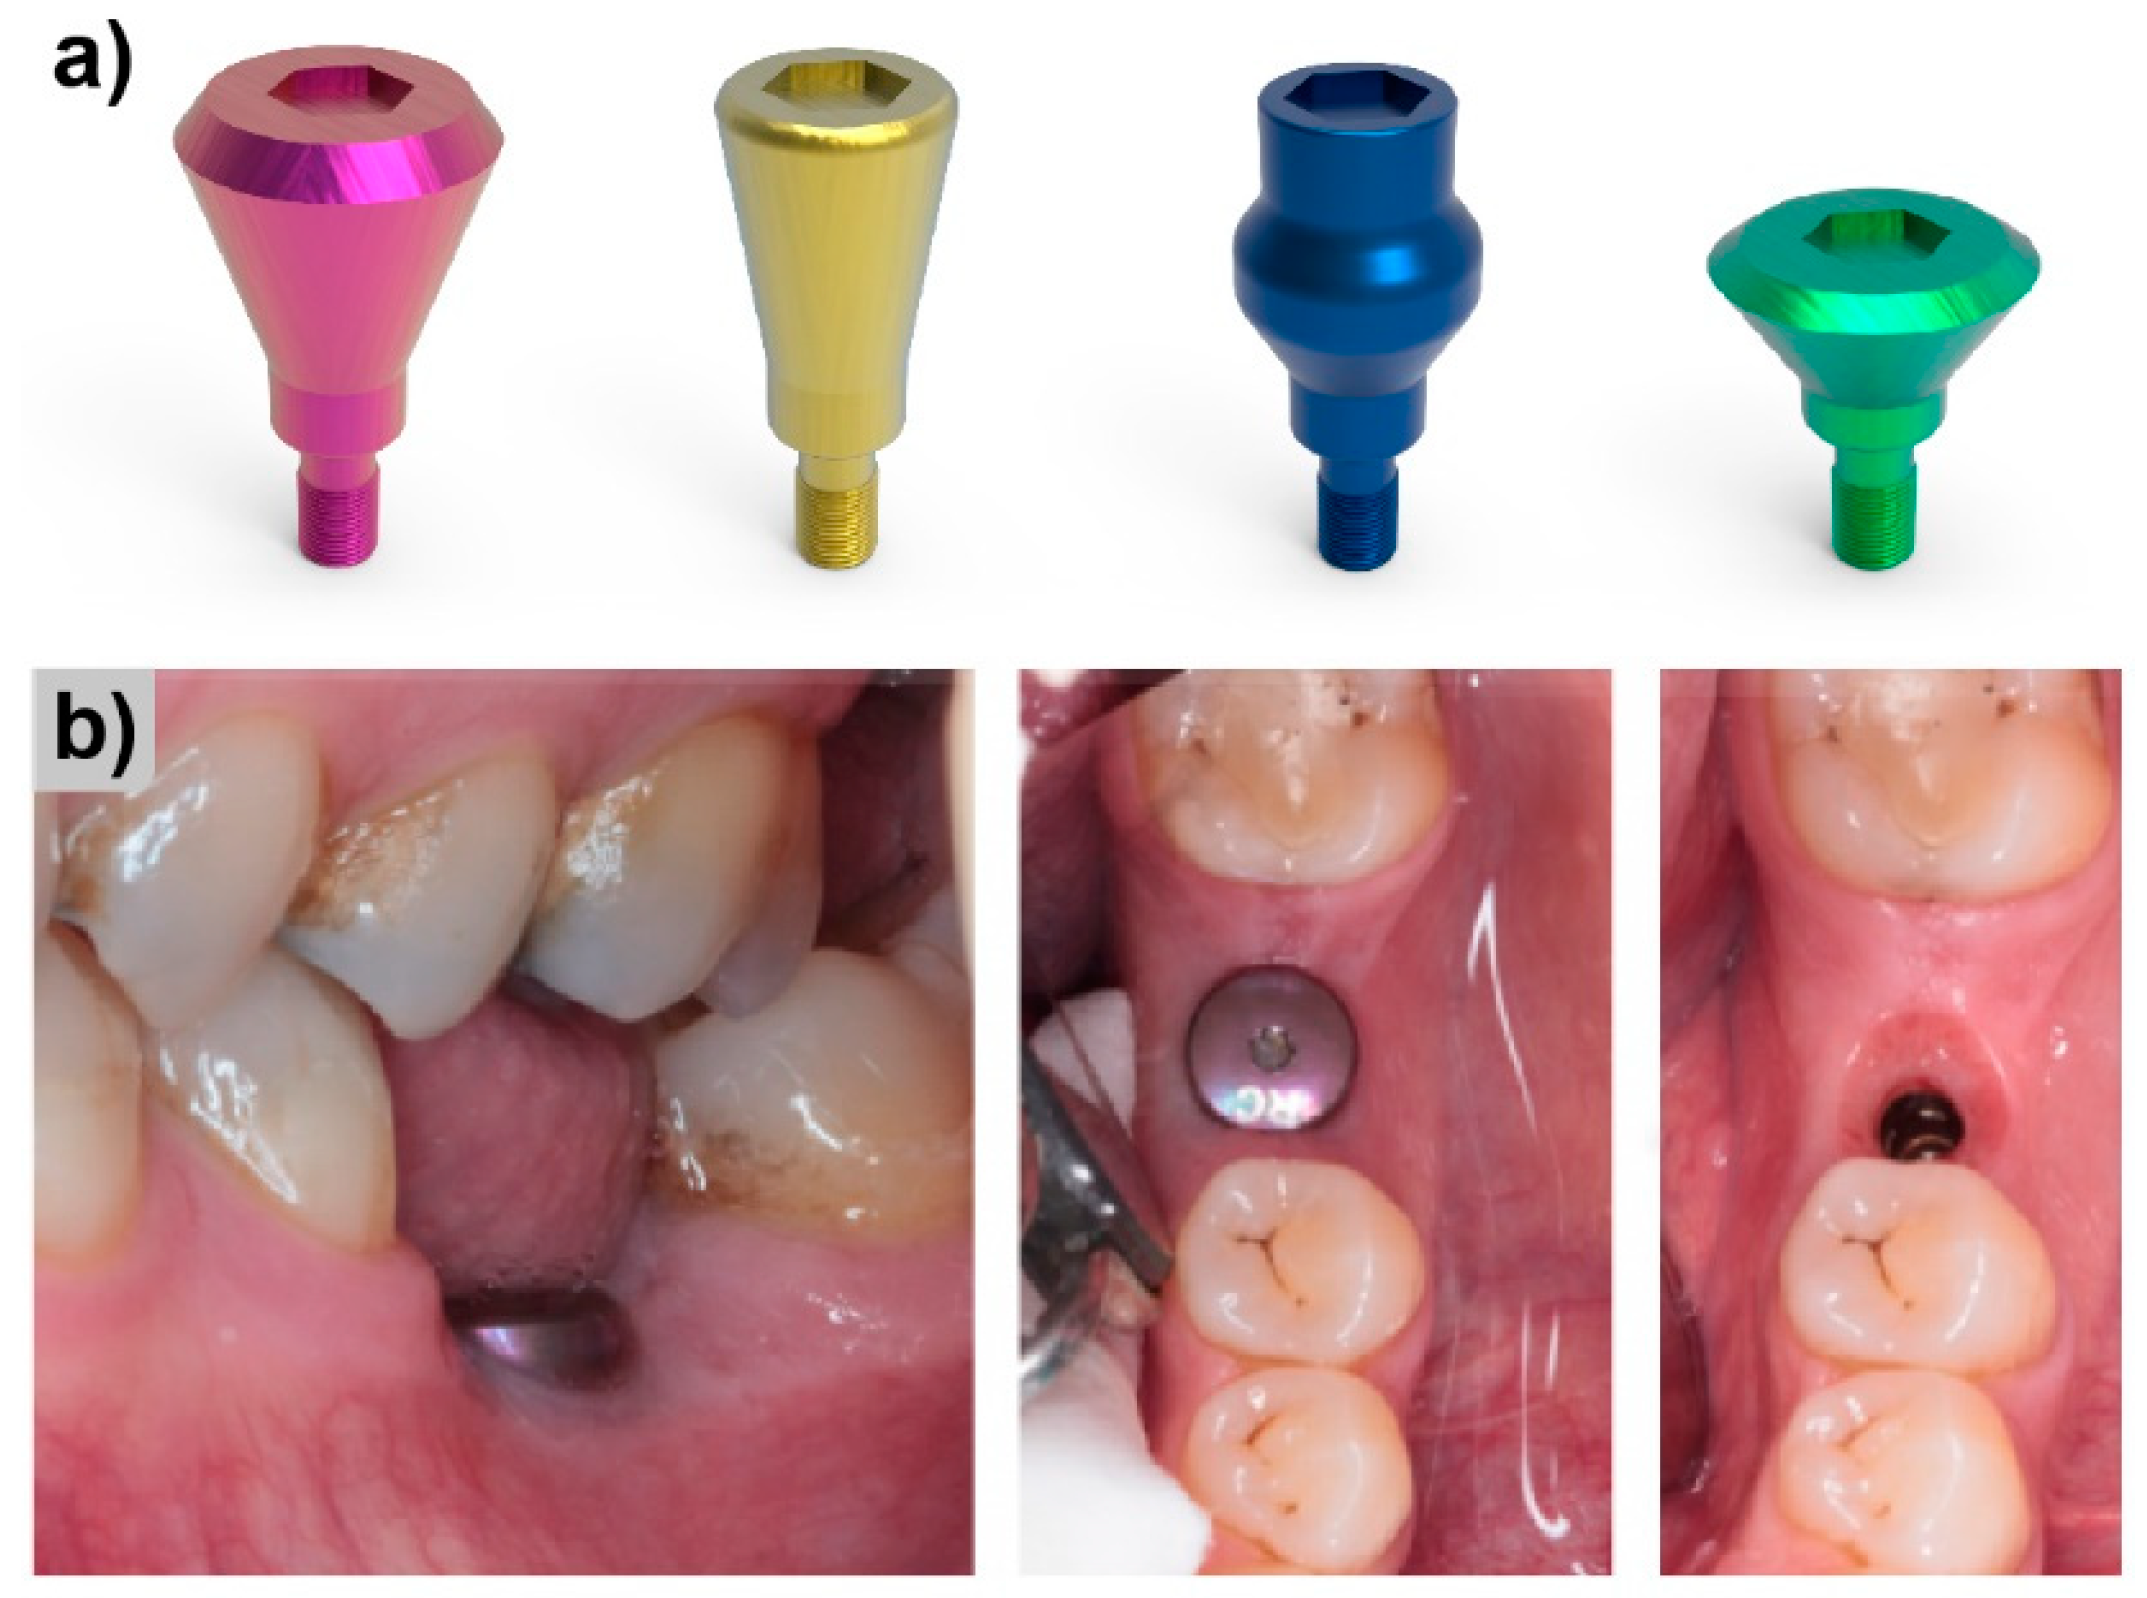
Figure 9.
Scanning electron microscopy (SEM) images: (a) Representing the bone-like augments on the Straumann ST implants followed by (b) a higher magnification of the implant surface, the boxed regions have been subjected to Raman analysis and (c) Raman spectrum depicting organic matrix deposition on Straumann ST and TiUnite systems. Figure adapted with permission from [68].

Figure 10.
Raman spectra of (a) LLK and (b) OSP implant. Original spectra are denoted by a dotted line, curve fitting by a solid line. Figure adapted with permission from [69].
Figure 10.
Raman spectra of (a) LLK and (b) OSP implant. Original spectra are denoted by a dotted line, curve fitting by a solid line. Figure adapted with permission from [69].
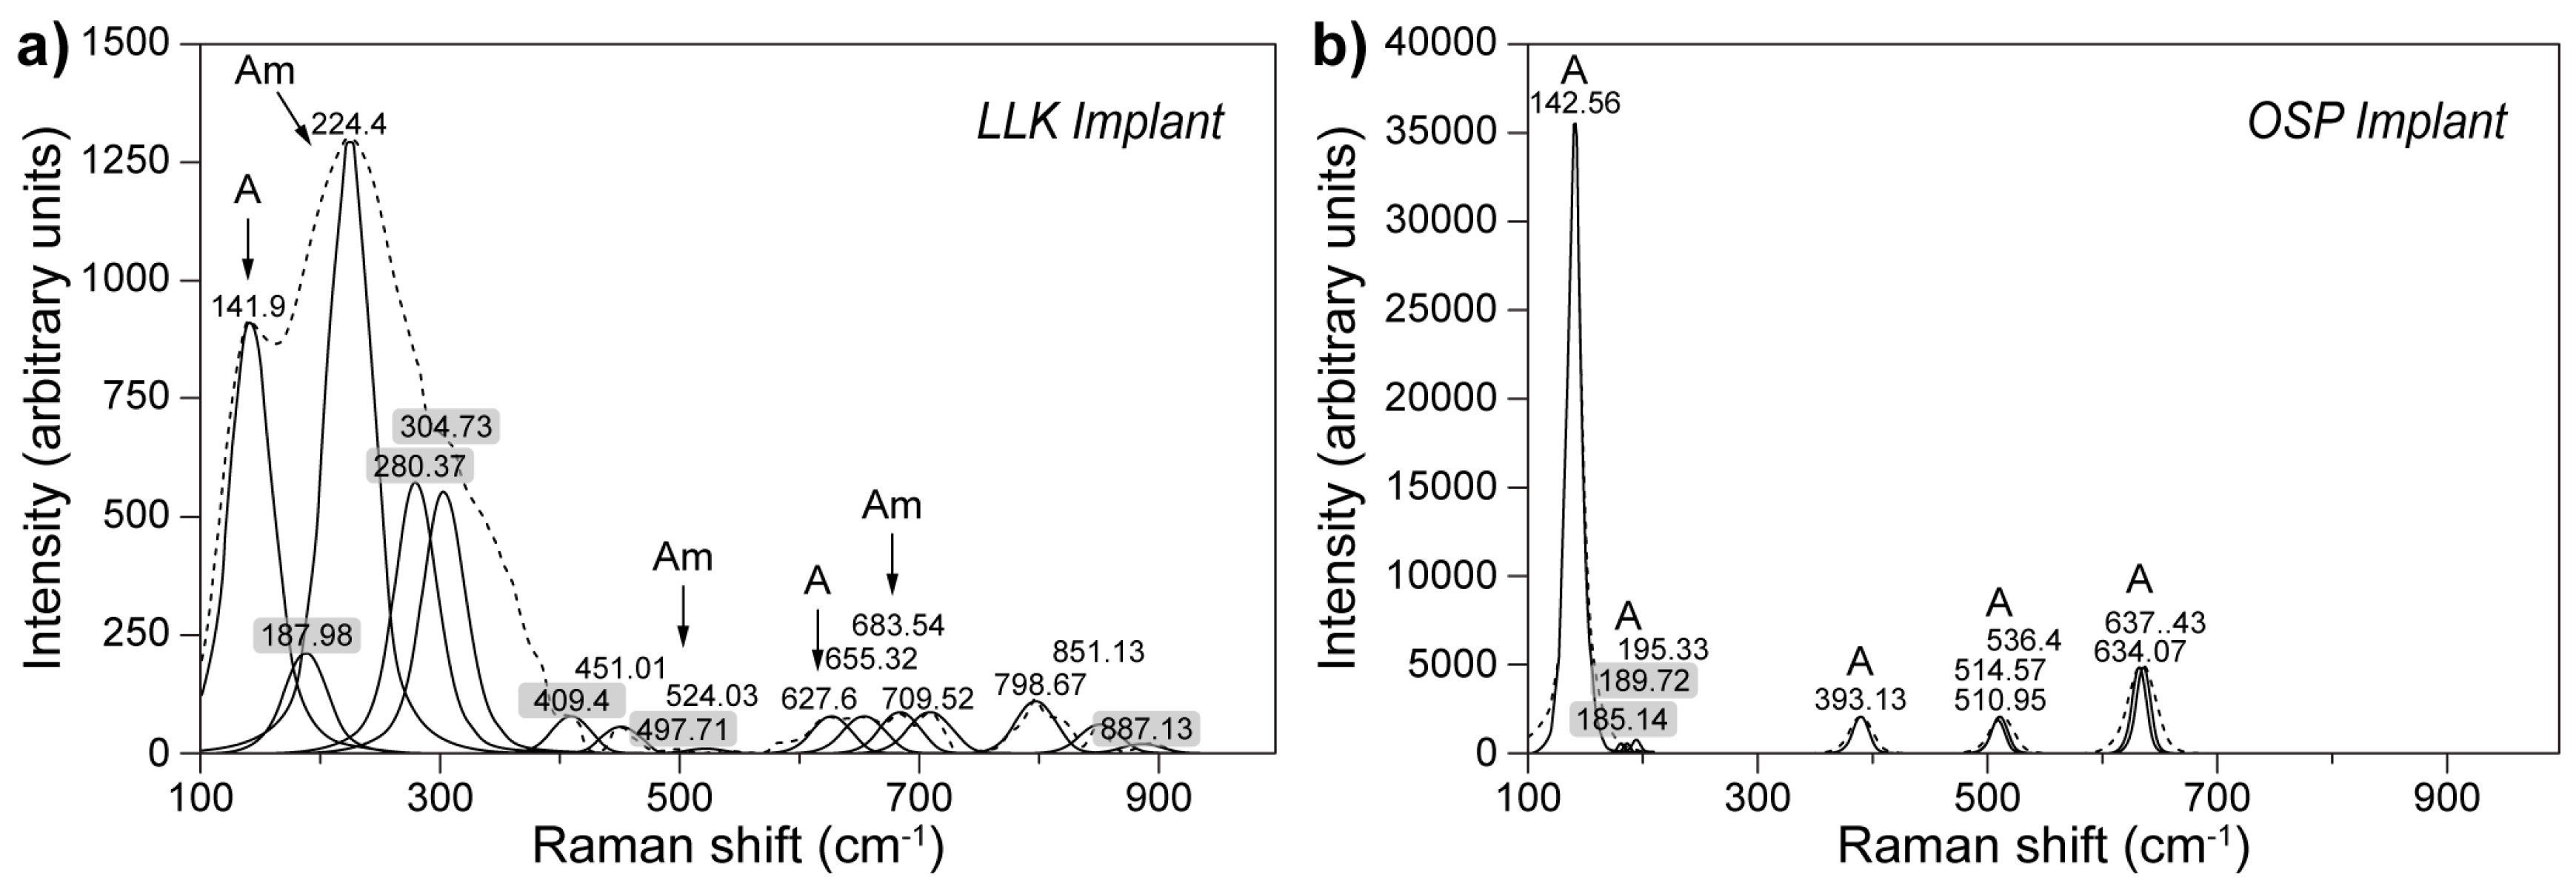
Figure 11.
Photoluminescence piezospectroscopy spectra: (a) spectrum of polycrystalline Al2O3 resulting from the native presence of Cr3+ impurities and (b) hypothetical spectra of the material under compressive (cyan) and tensile (violet) stress with respect to the optical levels R1 and R2 (in circles) assigned from (a). Figure (a) adapted with permission from [85].
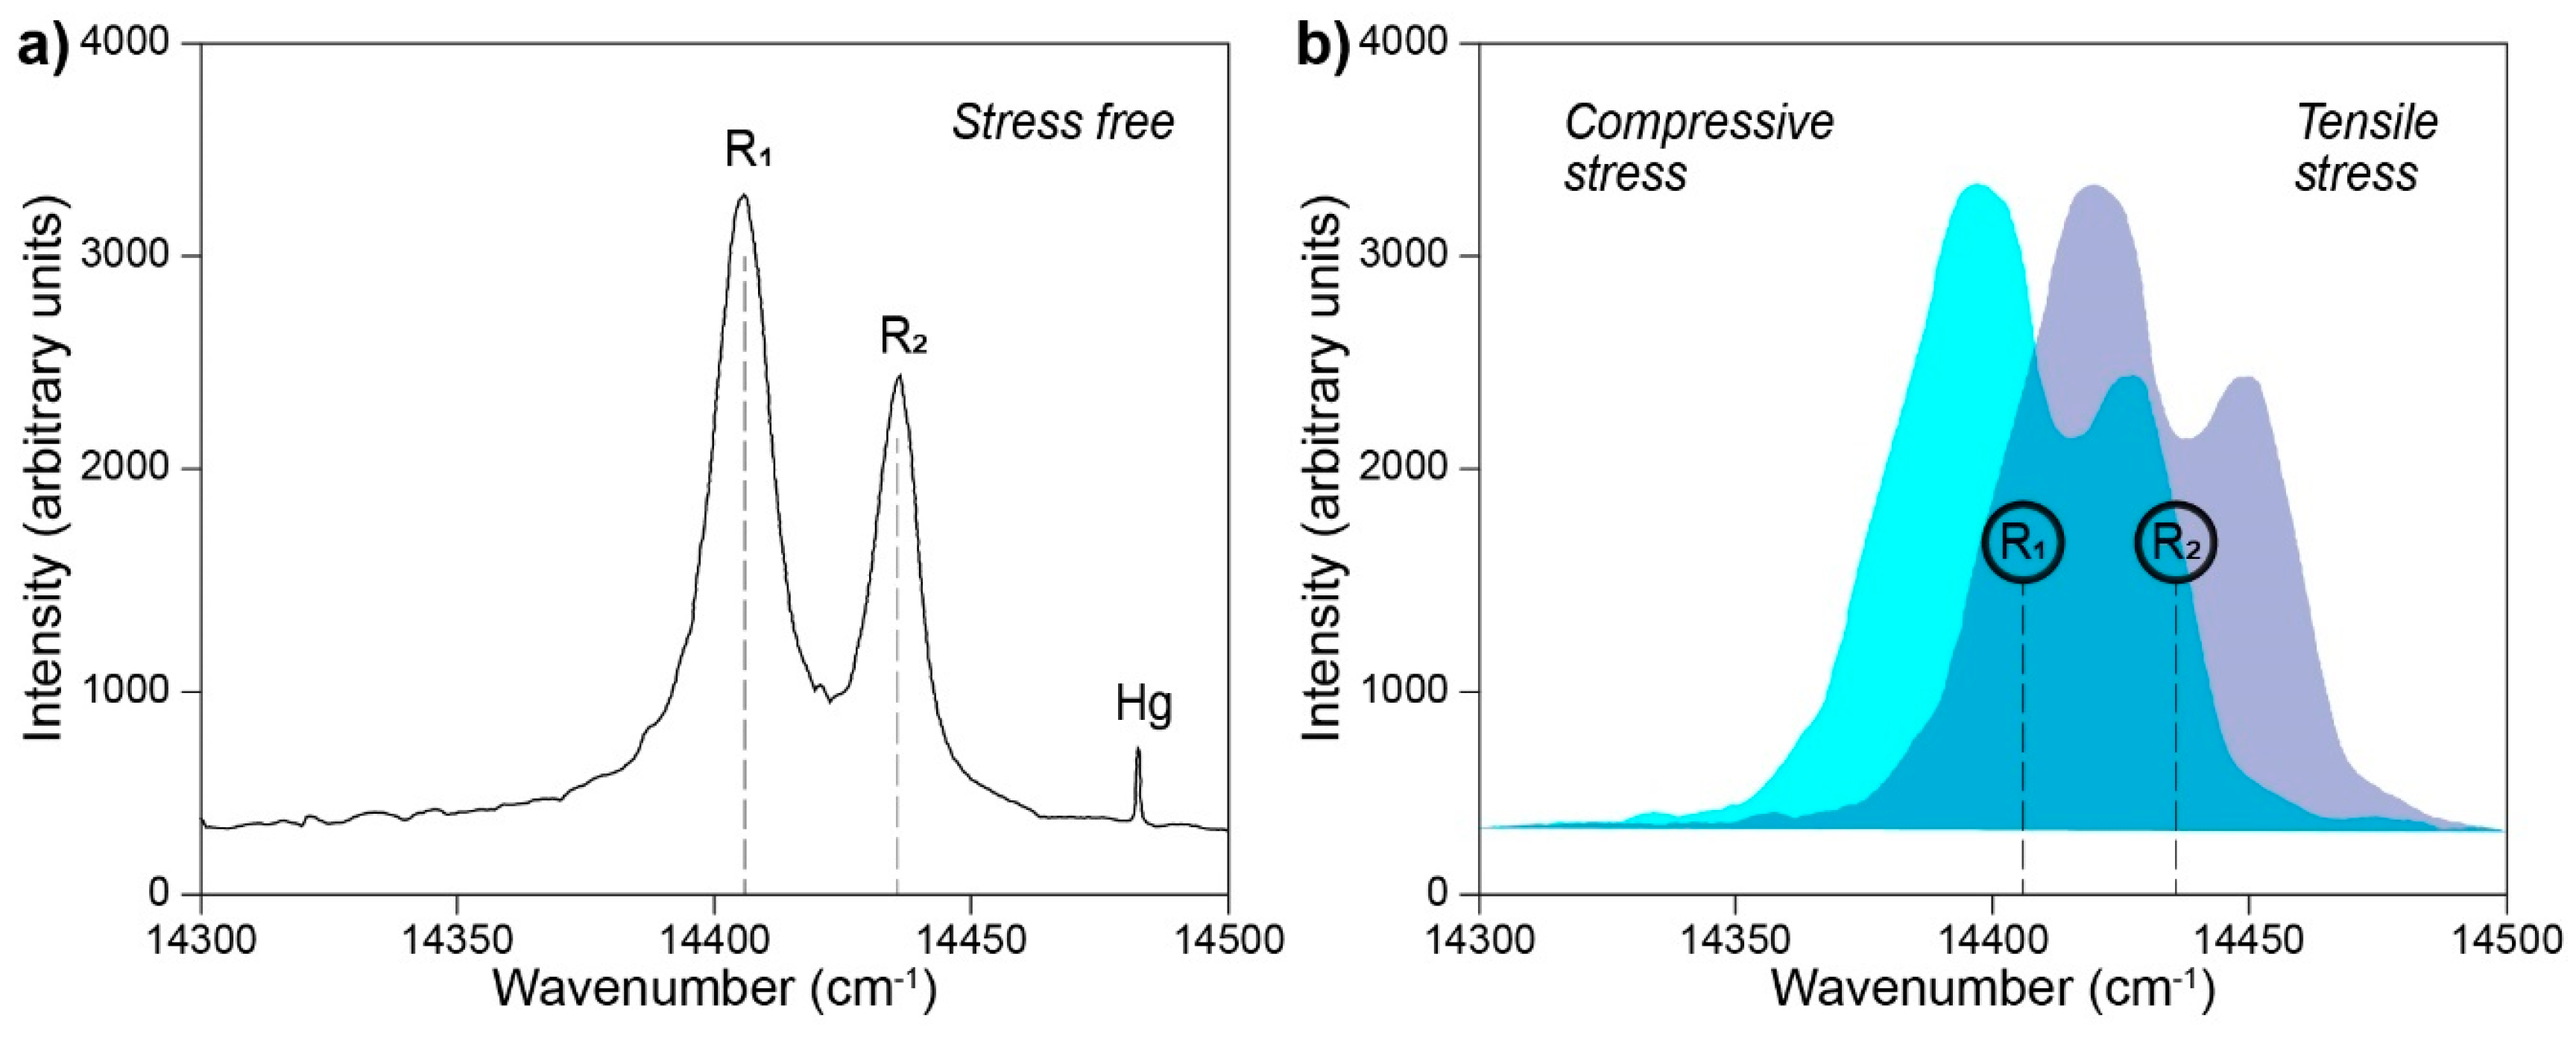
Figure 12.
Stress patterns collected from implant femoral heads for (a) the sample exposed for the longest time in vivo and (b,c) samples exposed for short periods of time, one month and two years and six months, respectively. Letters S and I indicate the superior and the inferior locations of the joint during in vivo implantation. Figure adapted with permission from [85].
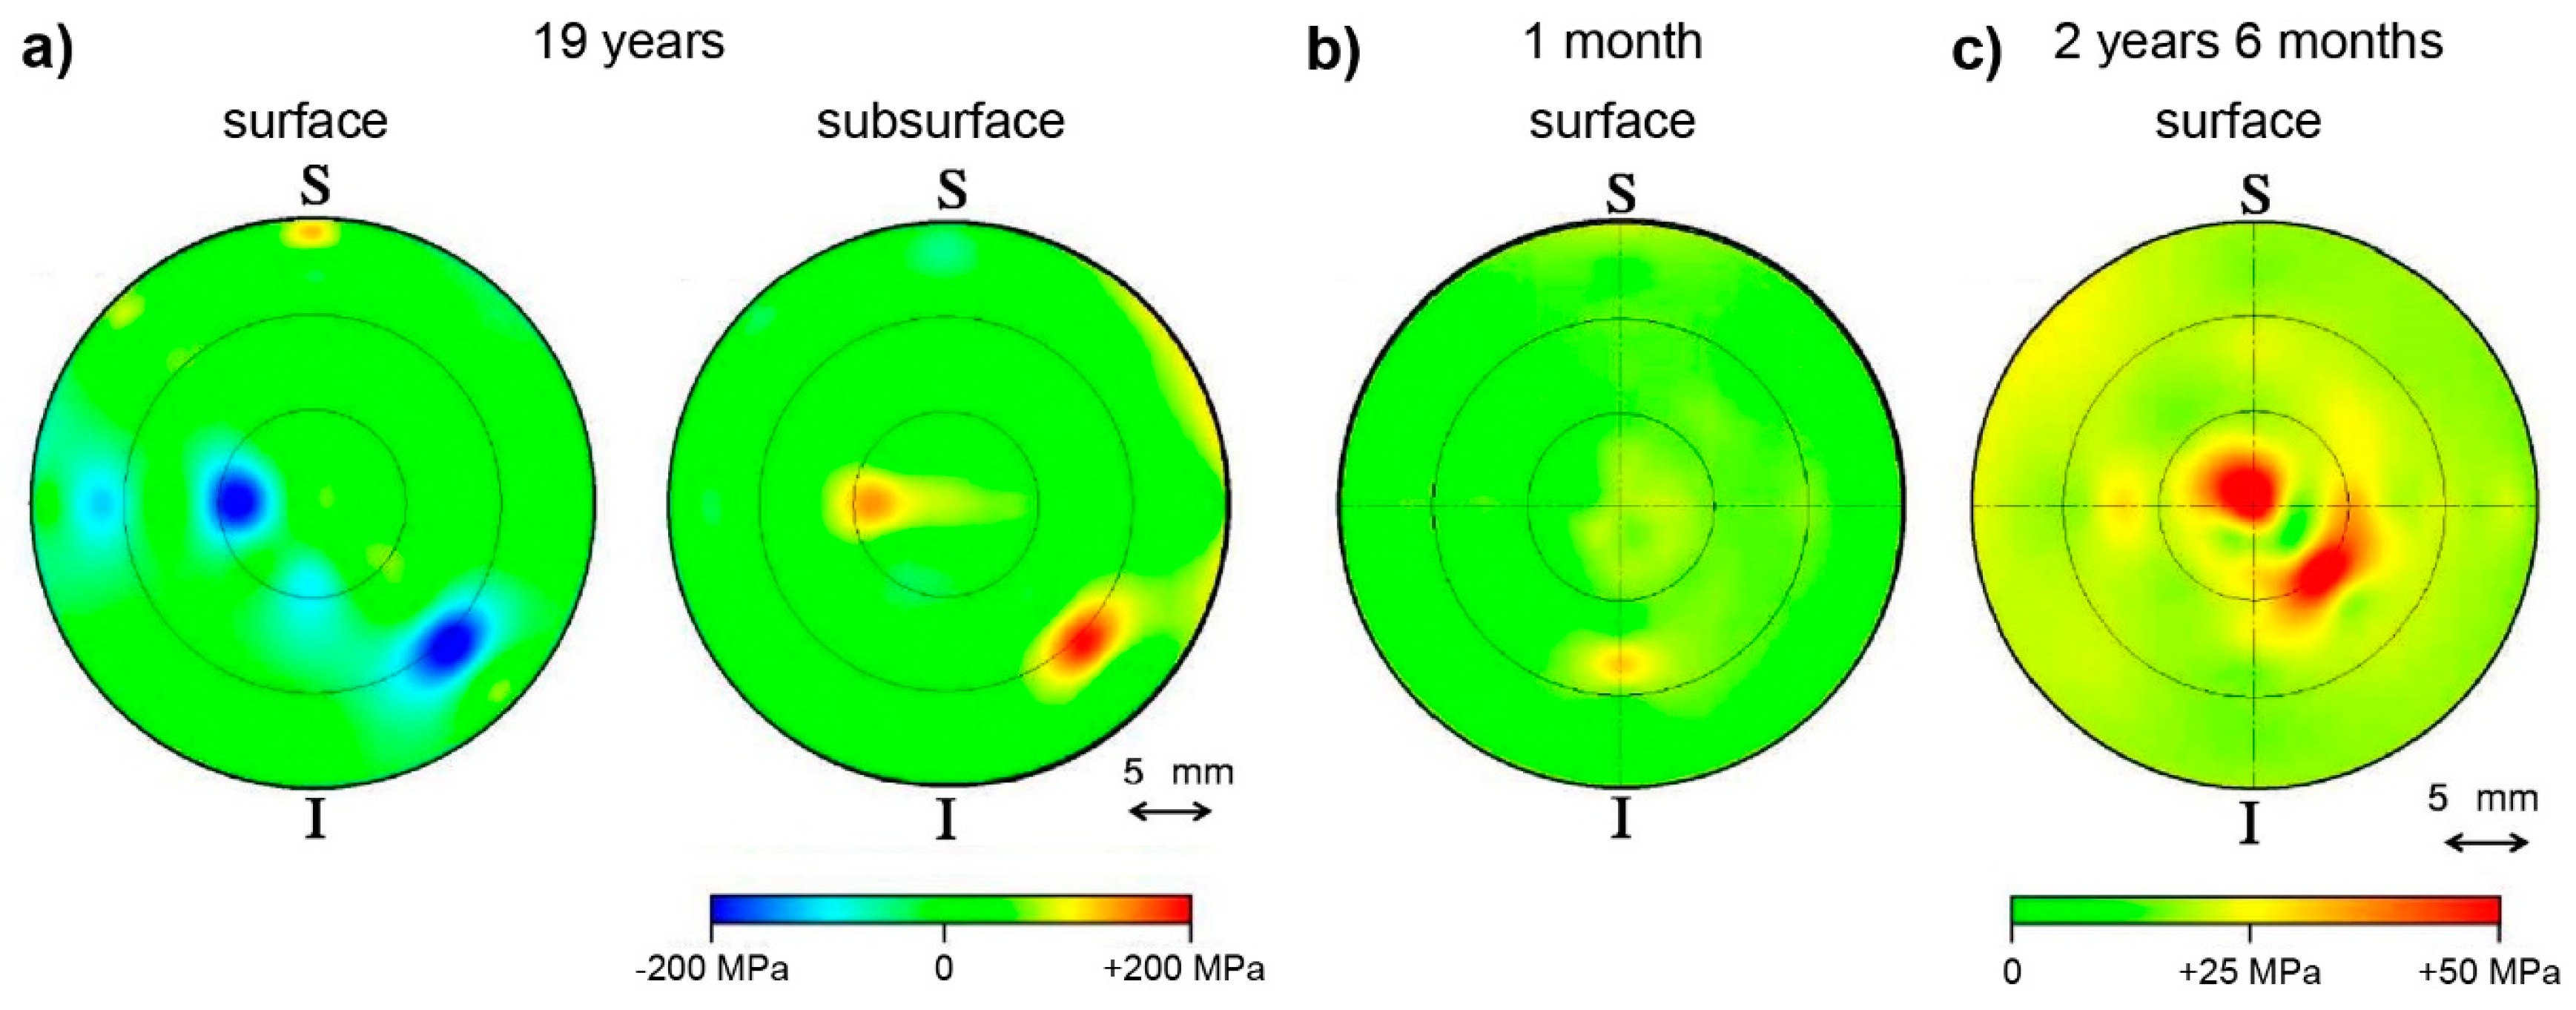
Figure 13.
Canine specimen: (a) microscopic section of a coated implant, eighteen months after implantation. Grey parts of the image represent bone tissue, while the hydroxyapatite (HA) coating and the prosthesis are in black, (b) Raman spectra of the ongrowth and ingrowth part of the bone and (c) hydroxyapatite content (χHA) at different lateral positions. Figure adapted with permission from [92].

Figure 14.
(a) Images from intravital observations of HA implanted within the calvaria, six months after surgery. Black arrows point to blood vessels within the bone and white arrows to implanted material. Scale bars correspond to 1 mm. (b) Eight months after surgery, the implanted β-TCP is not present. (c) Raman spectra of HA powder prior implantation (A), intravital hydroxyapatite spectra in rabbit calvaria after three (B), and twelve weeks (C). After implantation (top) and intravital bone two weeks after implantation (bottom). Figure adapted with permission from [94].
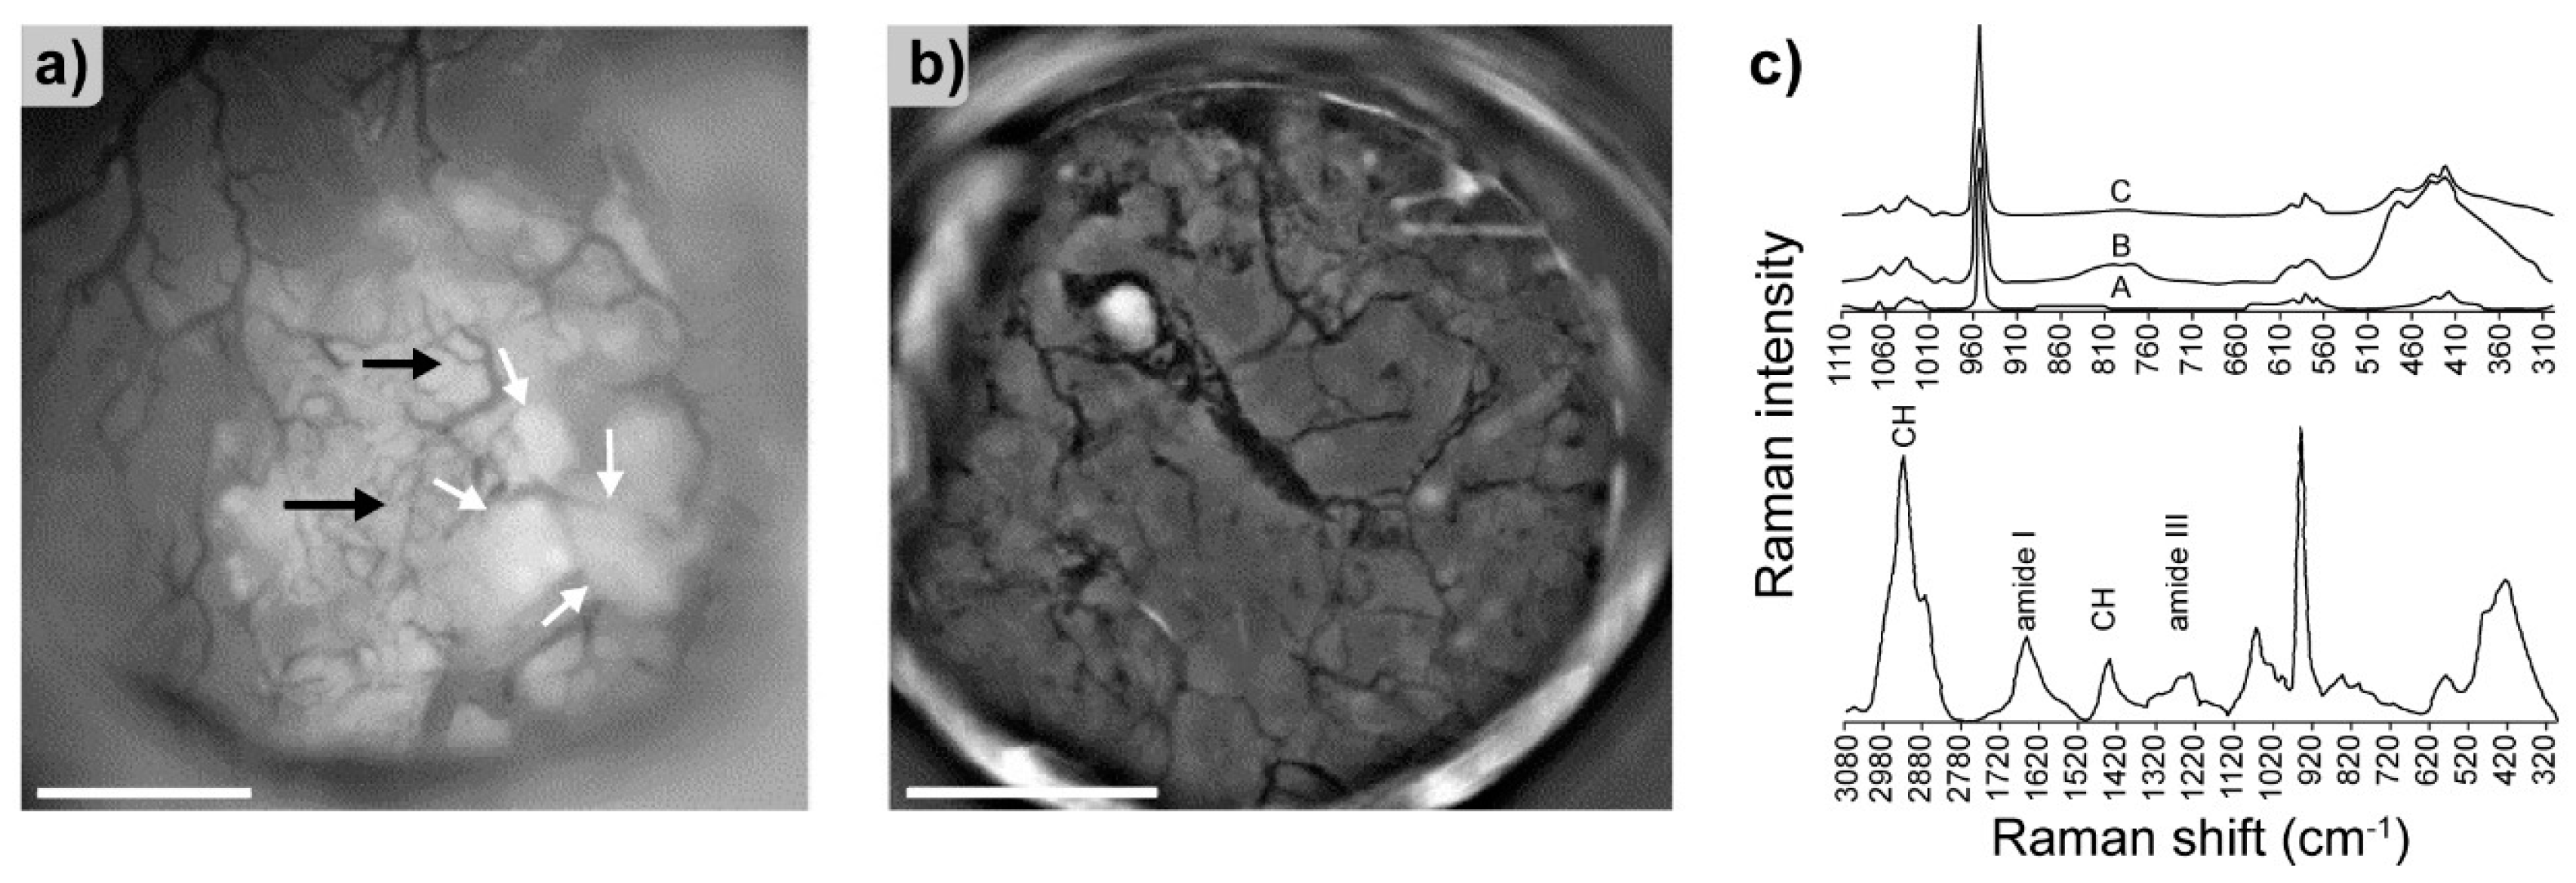
Figure 15.
Analysis of tooth caries formation. (a) Example of a tooth sample irradiated by a green laser. The inset presents the irradiated part magnified, denoting with an arrow a light region of demineralization. (b) Raman spectra comparing enamel and caries form the region denoted by the arrow in inset of (a). (c) Raman spectra of dicalcium phosphate dihydrate (DCPD) (top) and overlaid enamel and caries (bottom). Figure adapted with permission from [95].
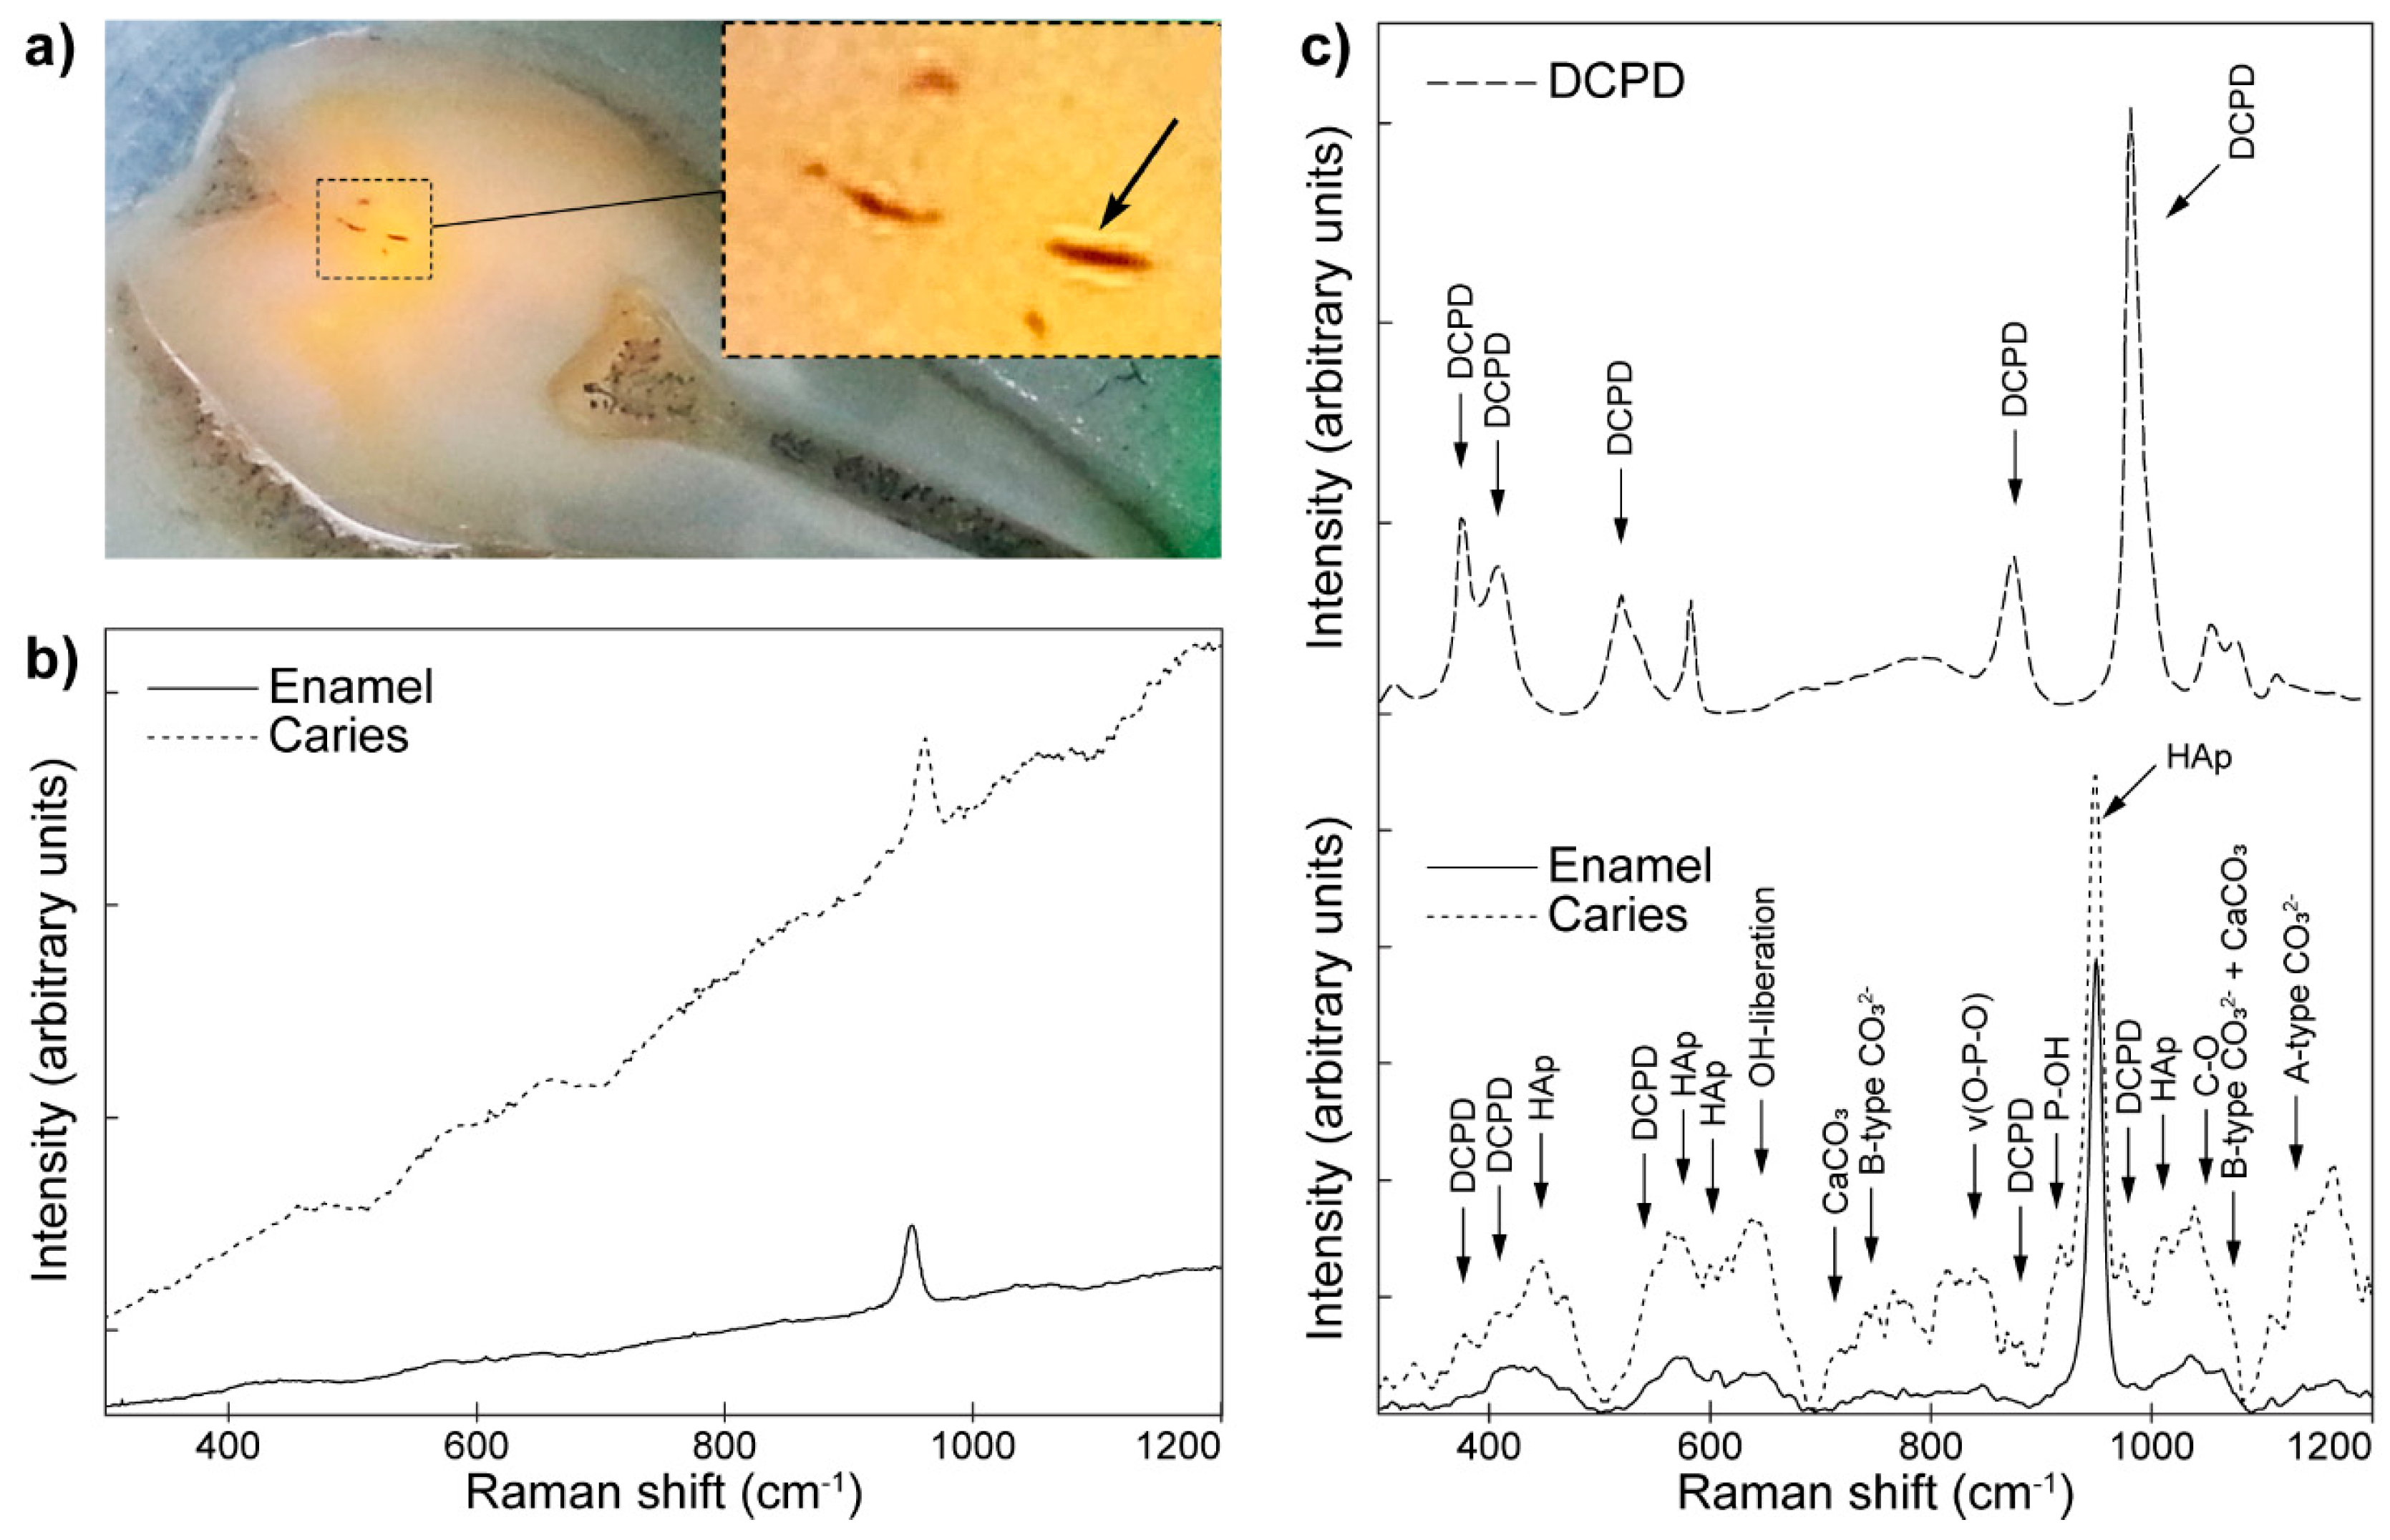
Figure 16.
Sol-gel method derived calcium hydroxyapatite (CHA). (a) Diffuse reflectance infrared Fourier transform spectroscopy (DRIFTS) spectra of respective CHA layers accompanied by (b) SEM micrographs taken at magnification of 15,000×. Scale bars correspond to 3 µm. Figure adapted with permission from [102].
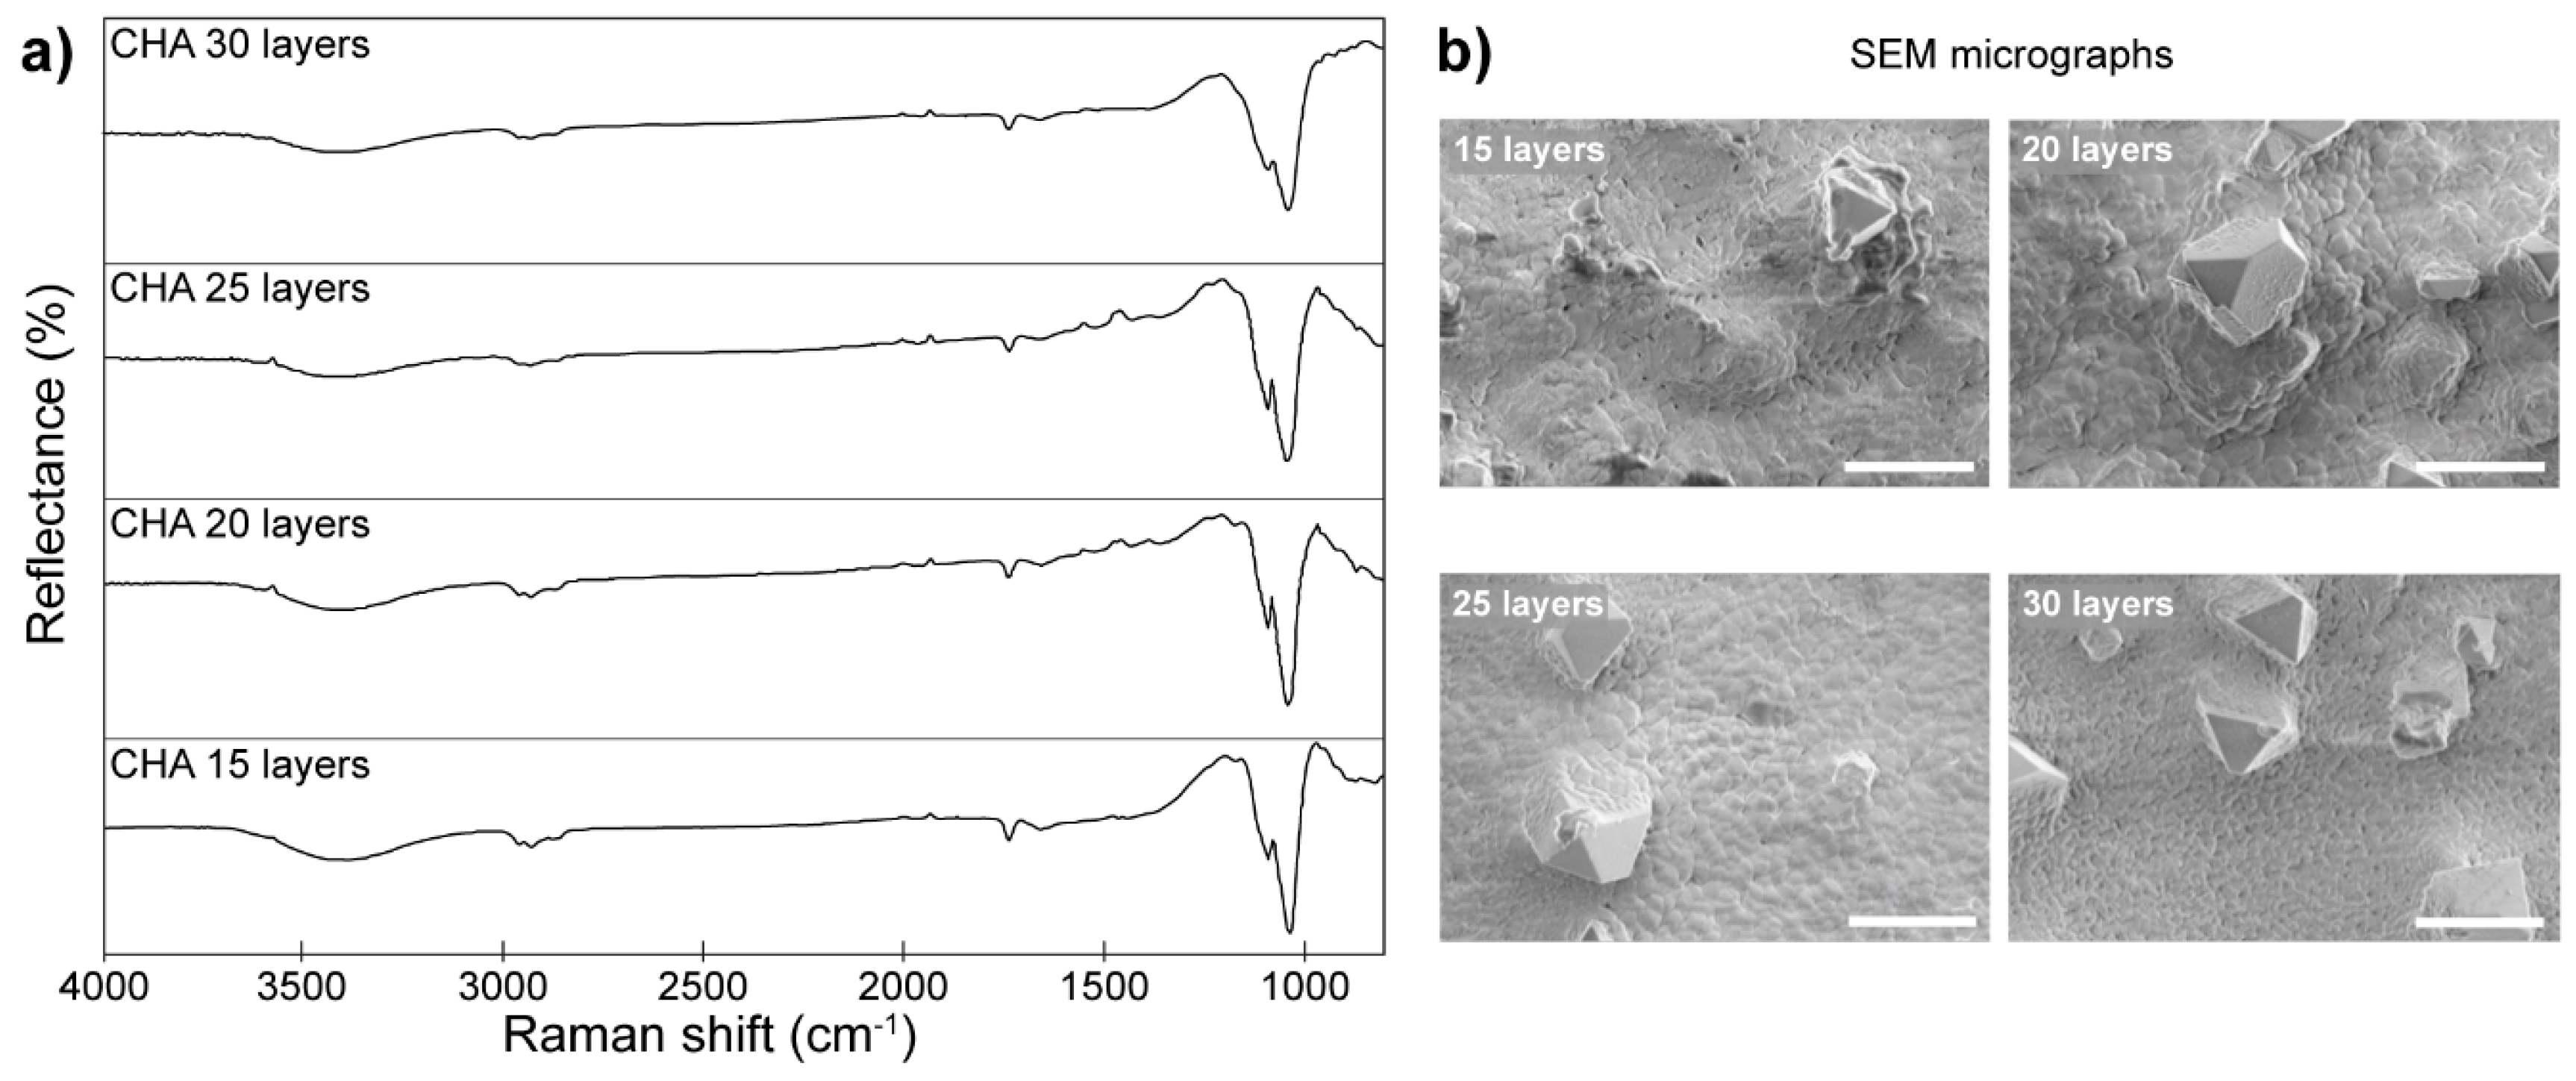
Figure 17.
Examples of fluorescent dies with the background colored according to the wavelength maxima of fluorescence emission and examples of modifications of the rhodamines dye family (marked by the red square).
Figure 17.
Examples of fluorescent dies with the background colored according to the wavelength maxima of fluorescence emission and examples of modifications of the rhodamines dye family (marked by the red square).

Figure 18.
Fluorescence microscopy image of the bone compressed by the implant interface. Labeling with oxytetracycline (green/yellow) and alizarin complexion (red). Registered after two weeks of healing. Blue filter, ×40 magnification. Figure adapted with permission from [144].
Figure 18.
Fluorescence microscopy image of the bone compressed by the implant interface. Labeling with oxytetracycline (green/yellow) and alizarin complexion (red). Registered after two weeks of healing. Blue filter, ×40 magnification. Figure adapted with permission from [144].

Figure 19.
Laser scanning confocal microscopy images of bone remodeling after different types of implantation procedures: (a) sham surgery, (b) ovariectomy, and (c) strontium coated implant insertion. Labeling performed with tetracycline hydrochloride and calcein. Registered 4 weeks post-implantation, x400 magnification. Figure adapted with permission from [112].

Figure 20.
In vivo fluorescence analysis of hydrogels, with Xenogen IVIS-200: (a) whole-animal images of the implanted plugs (P), microbeads (MB), and in situ polymerized (IS) hydrogels and (b) representative 3D plots of the fluorescence signal distribution and intensity. Data registered 0, 7, and 21 days post-implantation. Figure adapted with permission from [124].
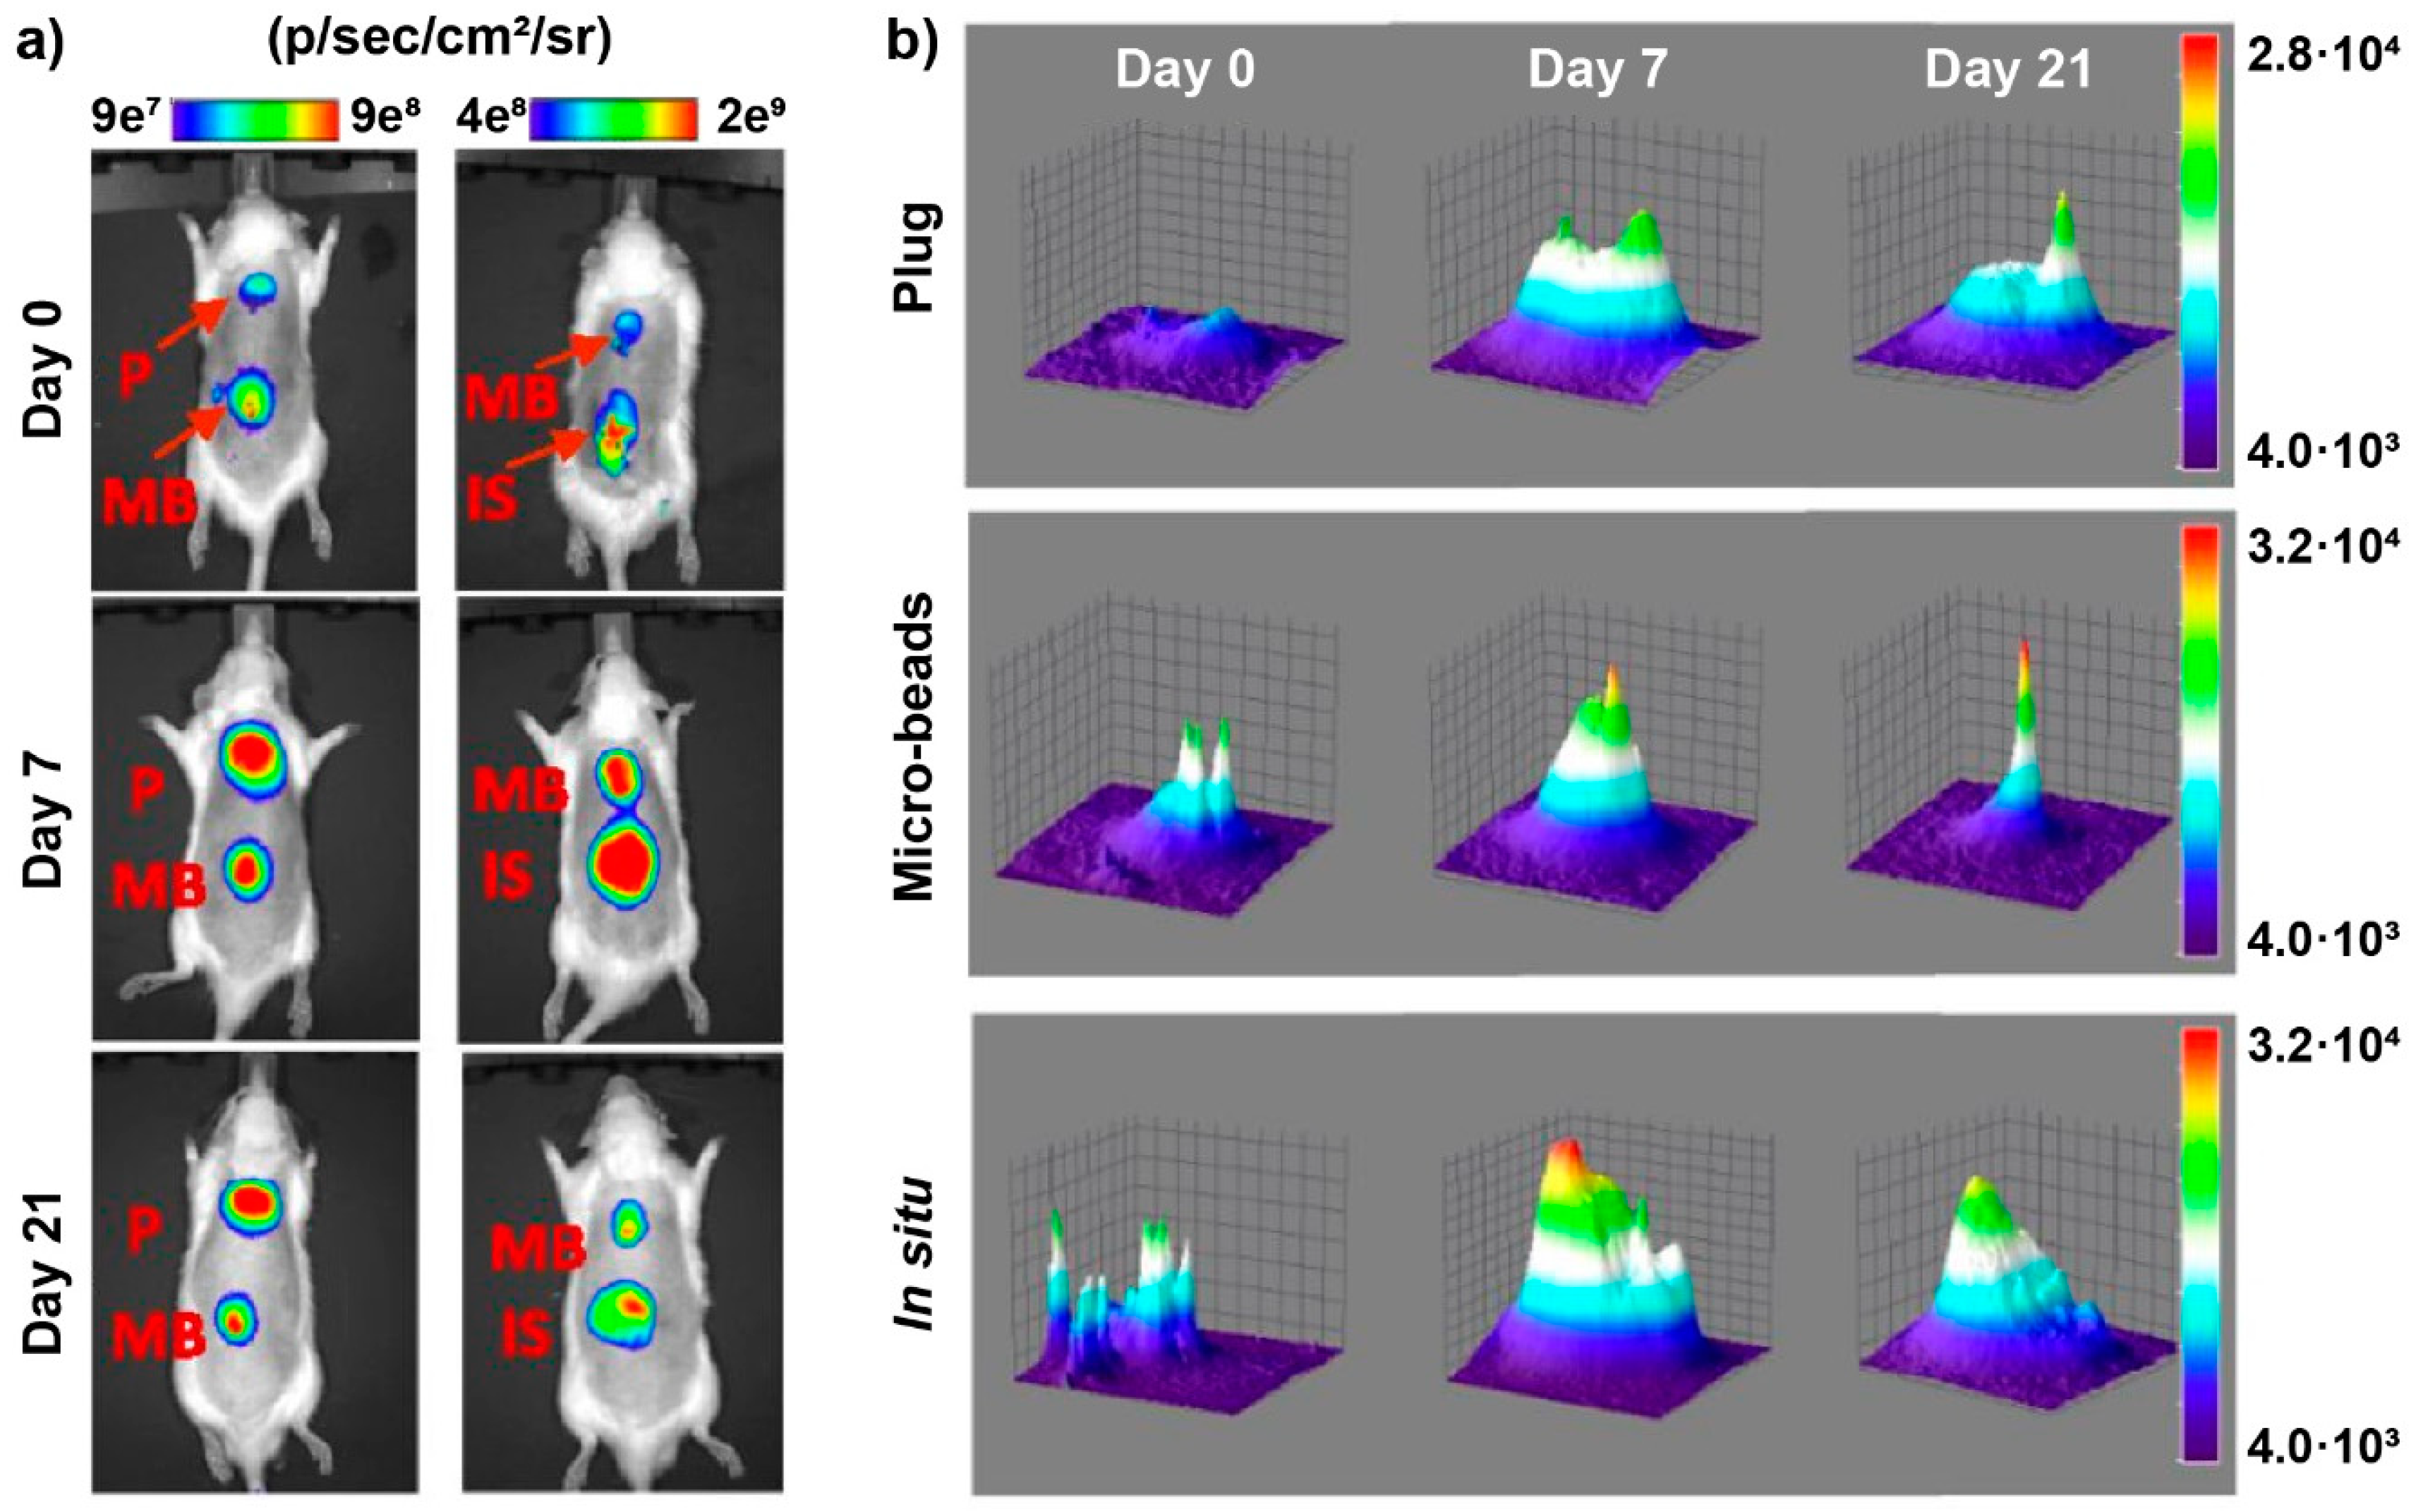
Figure 21.
The figure shows (a) a white light image of the mouse, (b) the normalized fluorescence image, (c) an overlay of (a) and (b) (reference), and (d) the residual fluorescence demonstrating continuous diffusion from the spacer over time (image registered after the animal was euthanized and its skin layer and the spacers were removed). Figure adapted with permission from [126].


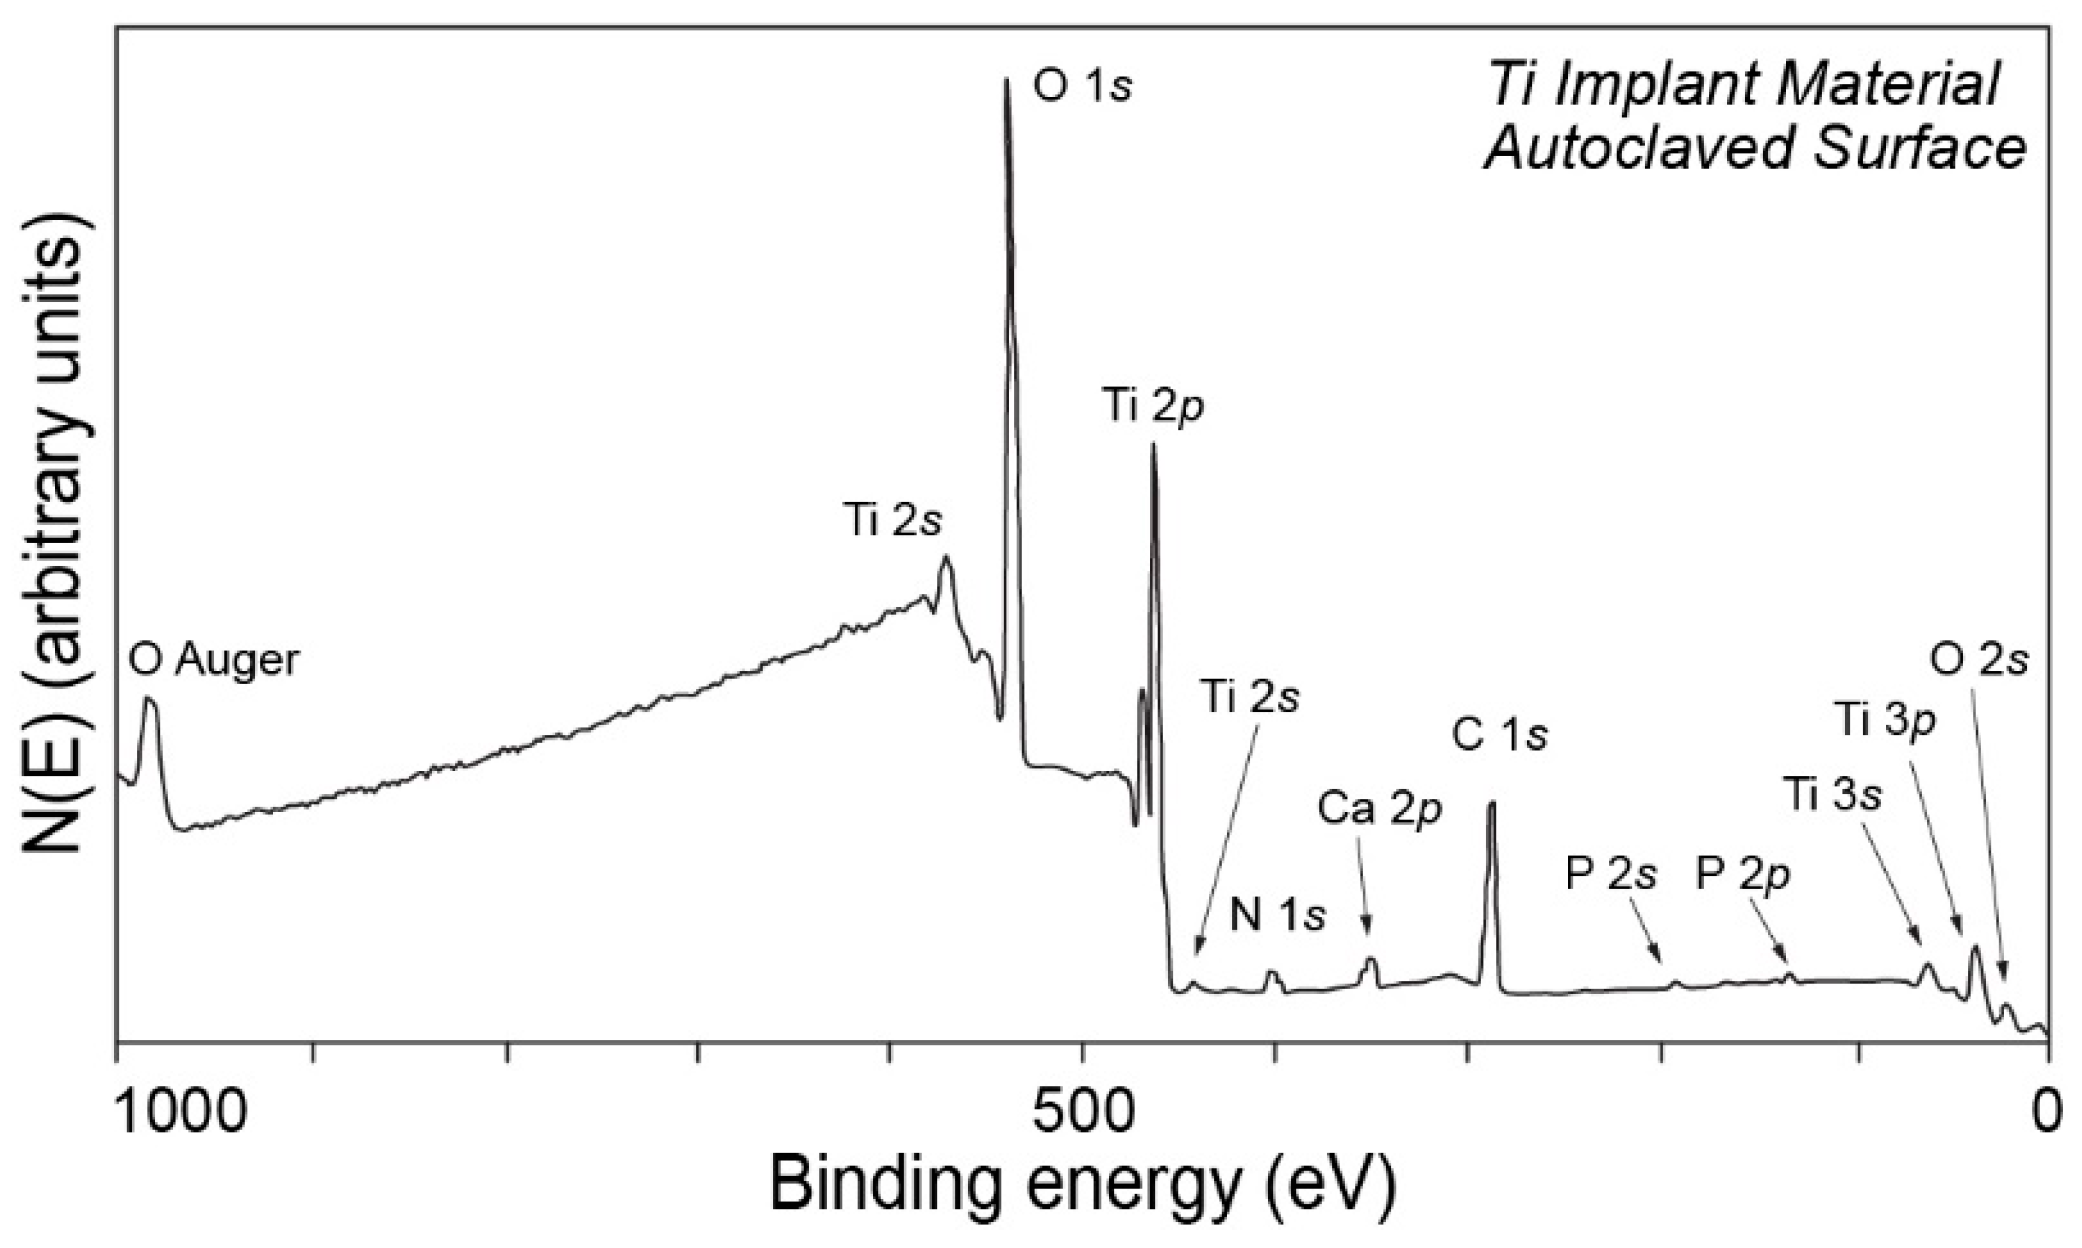
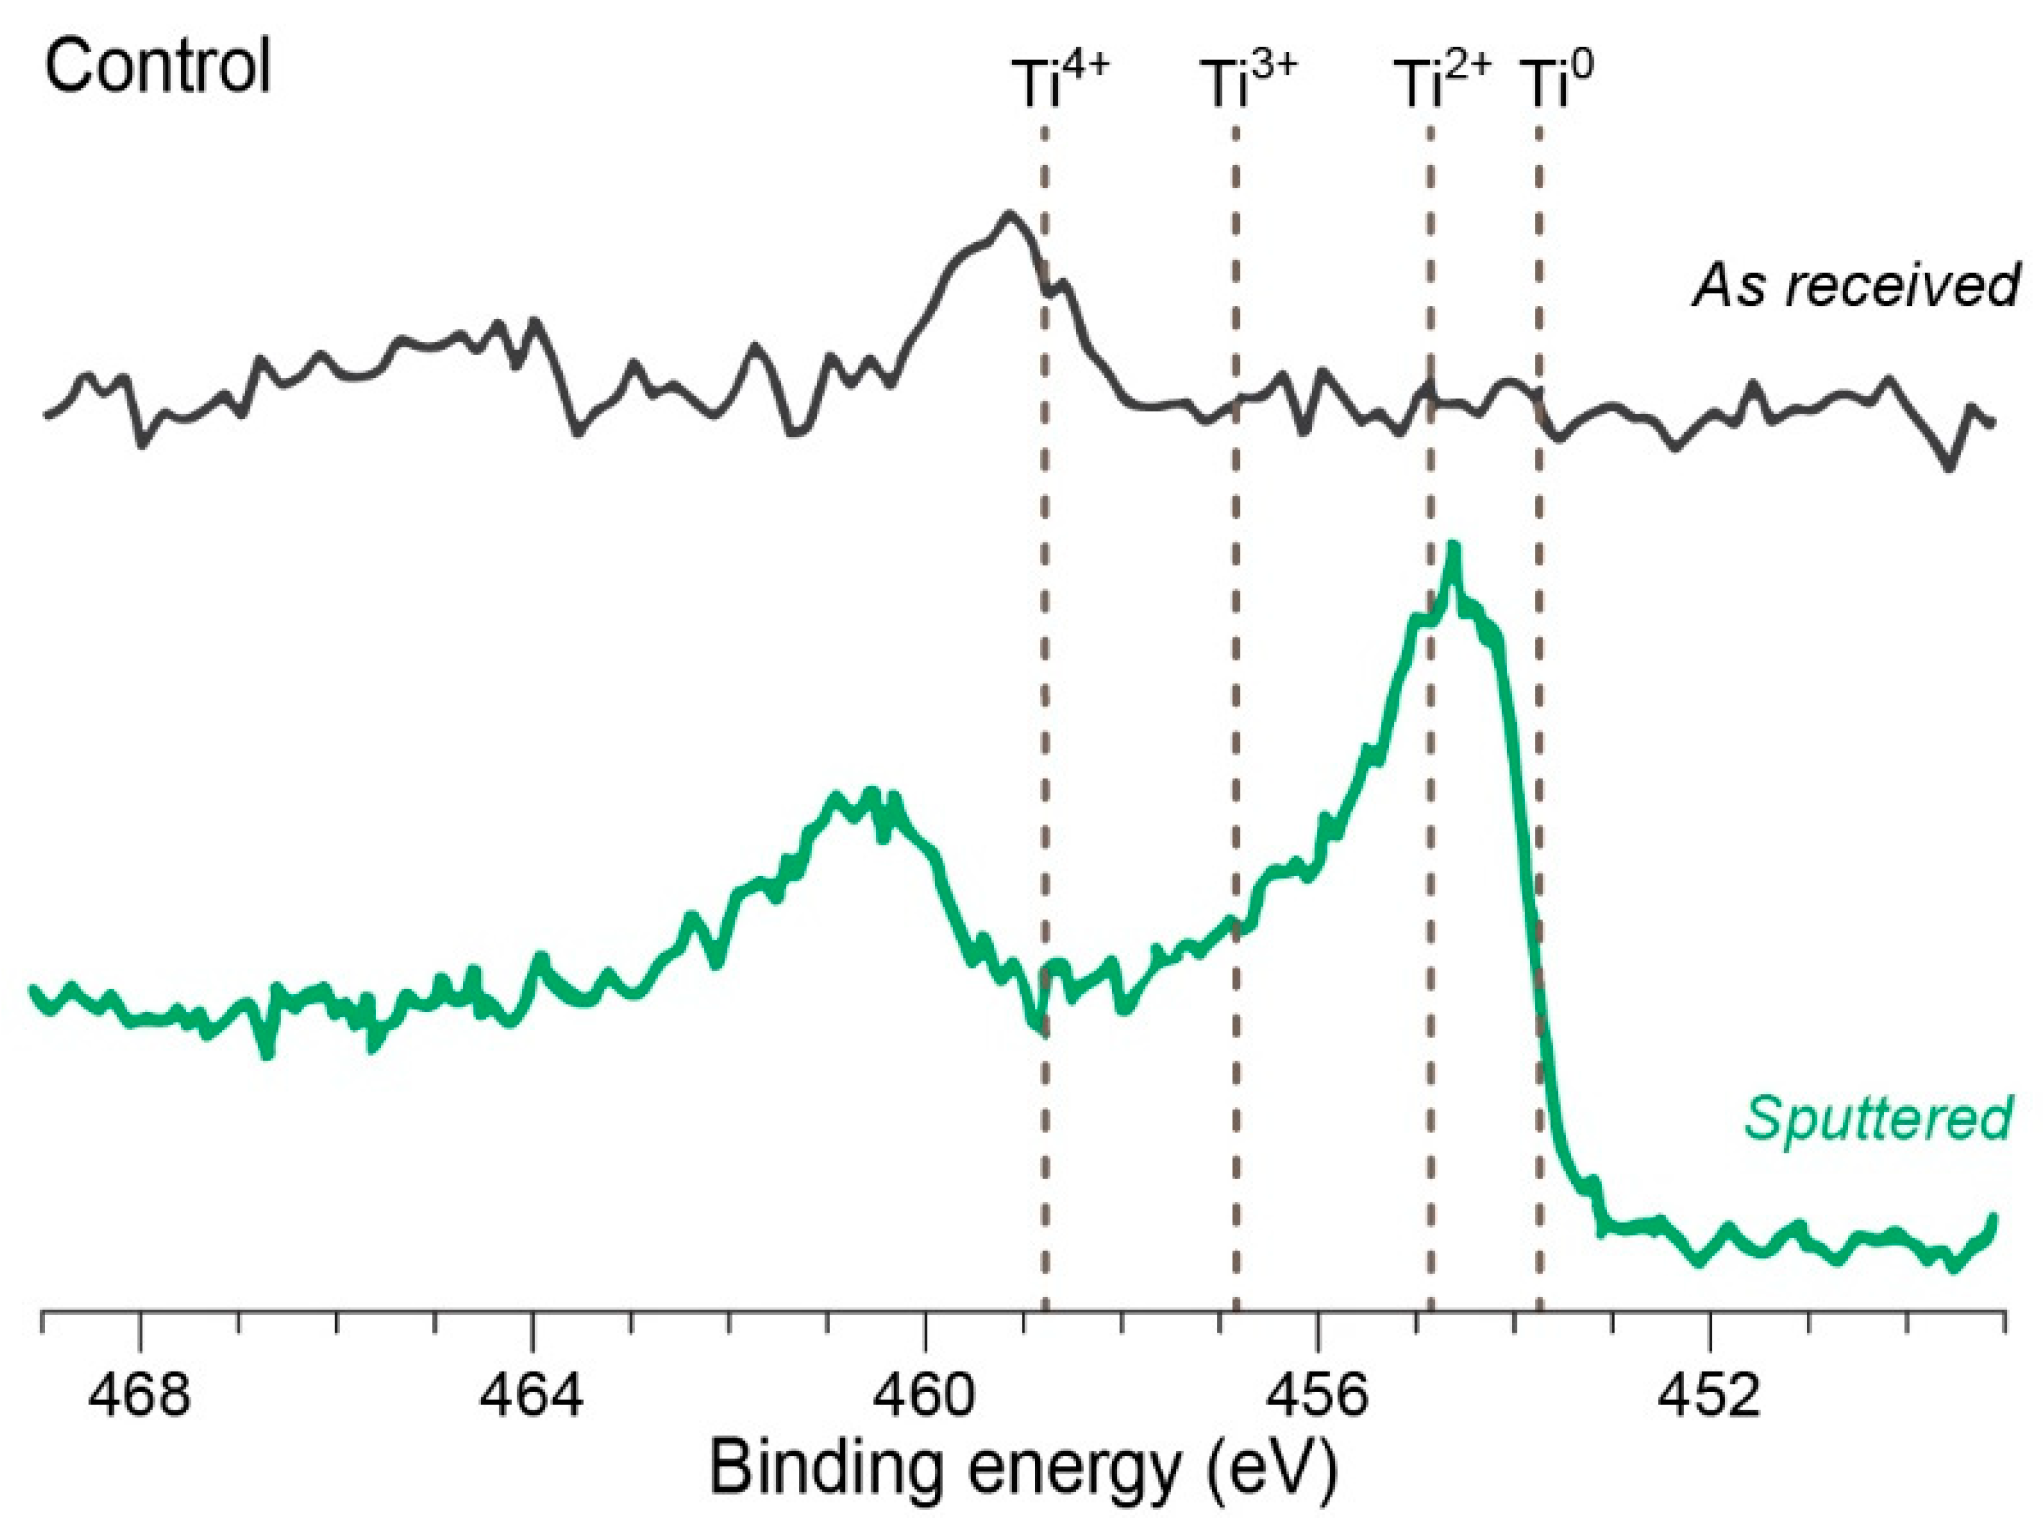
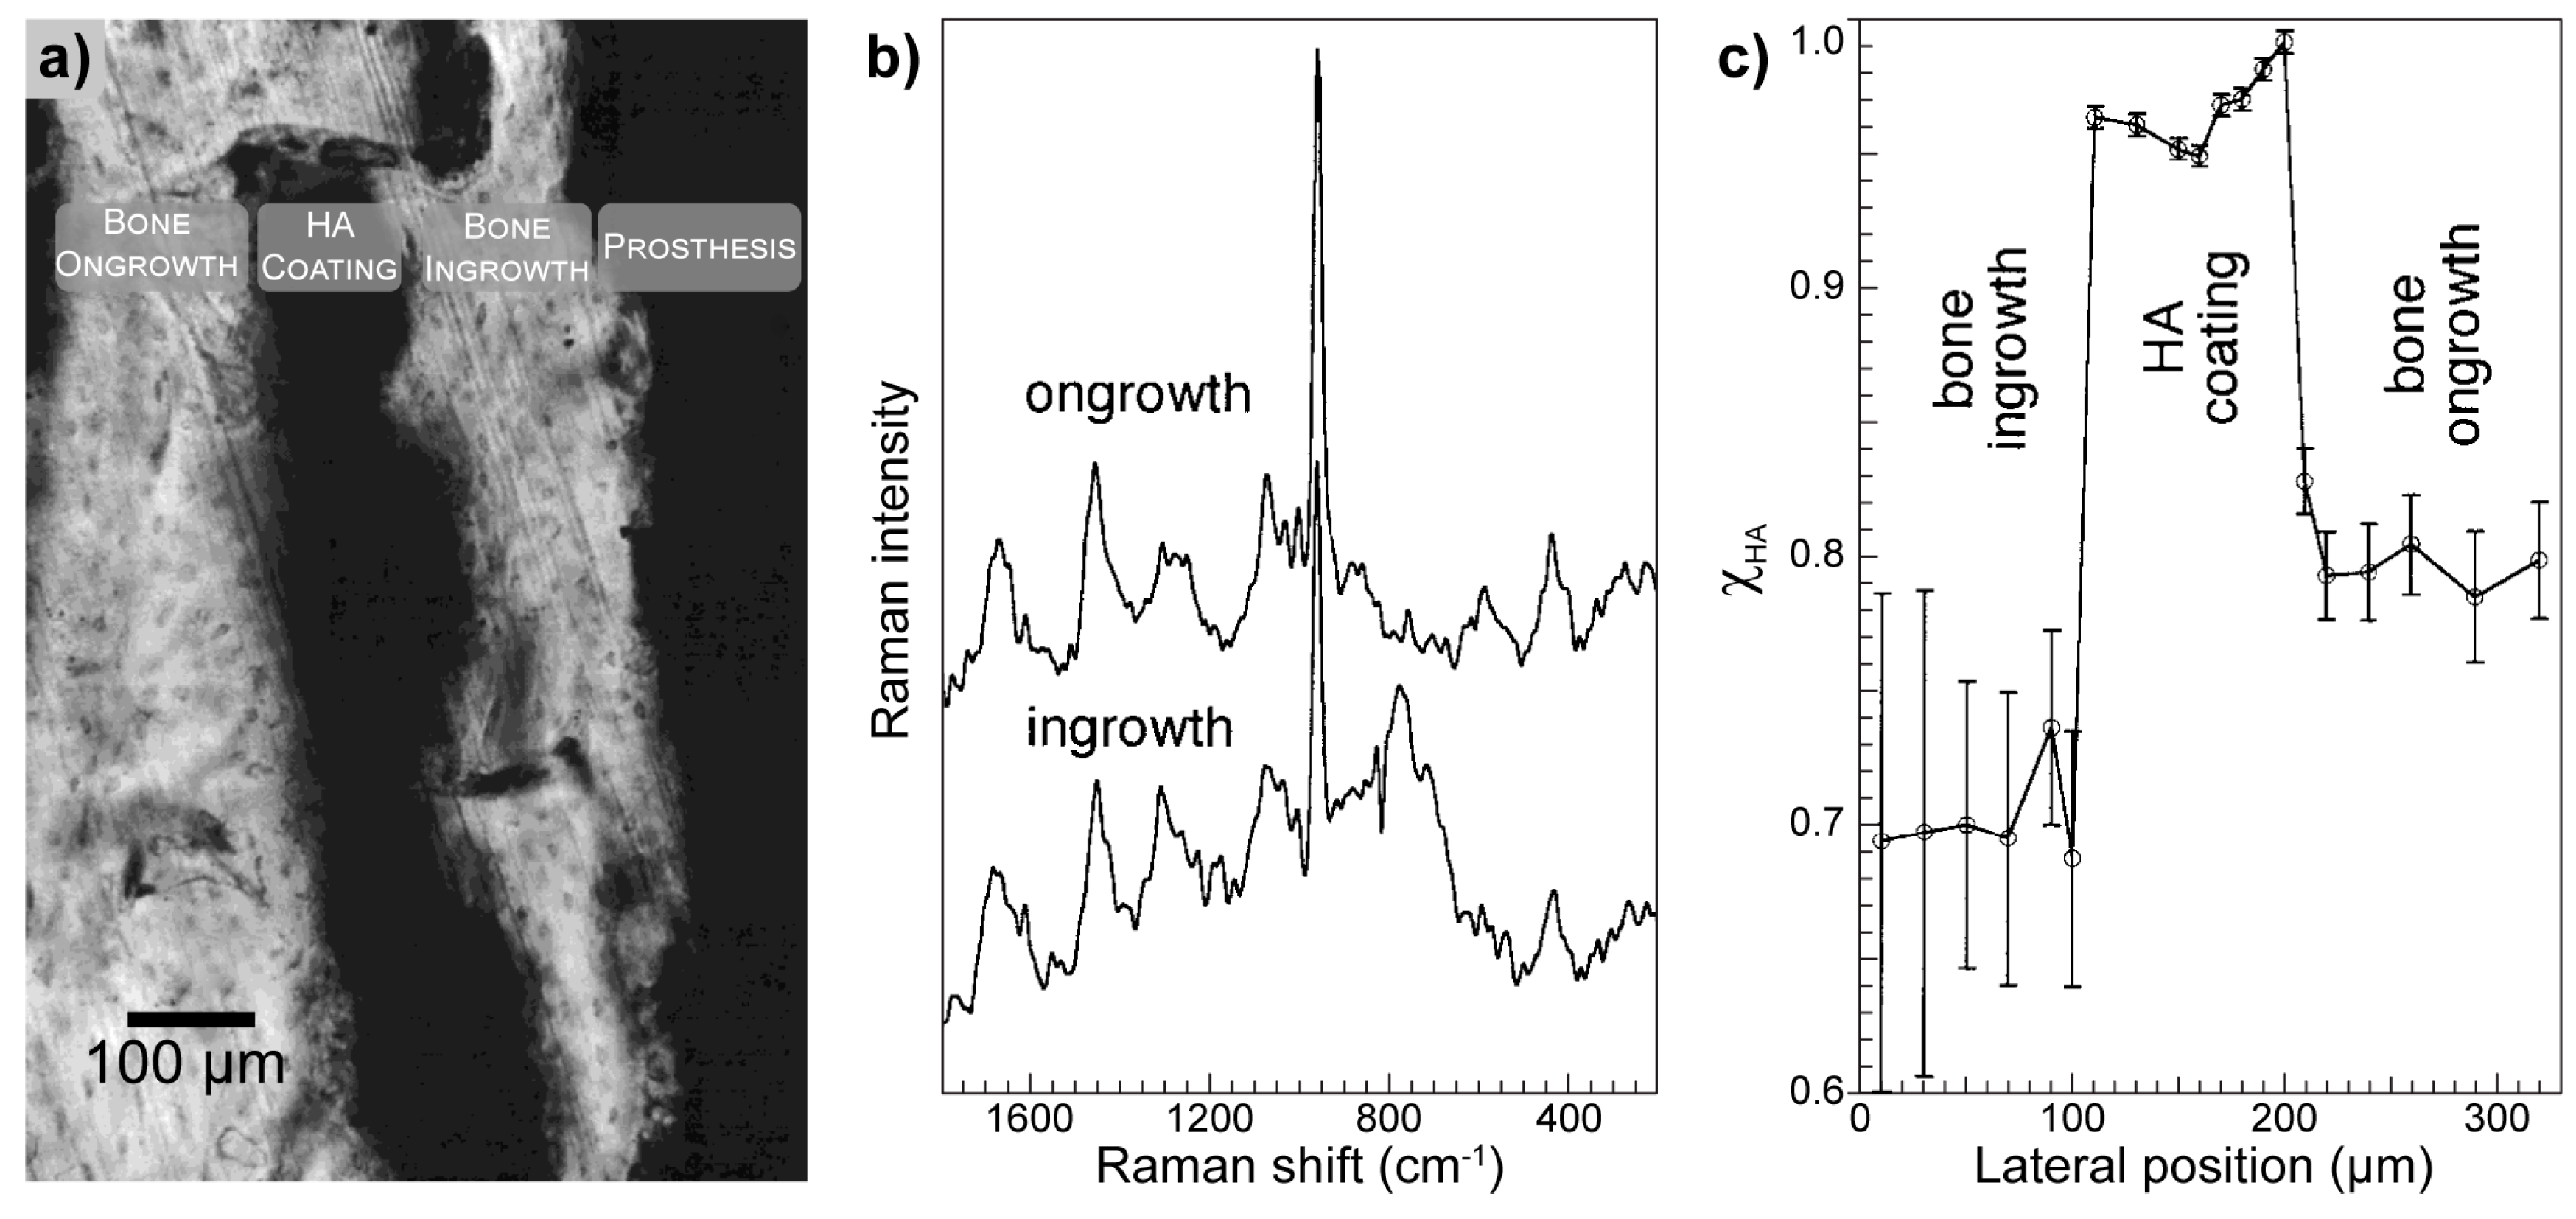
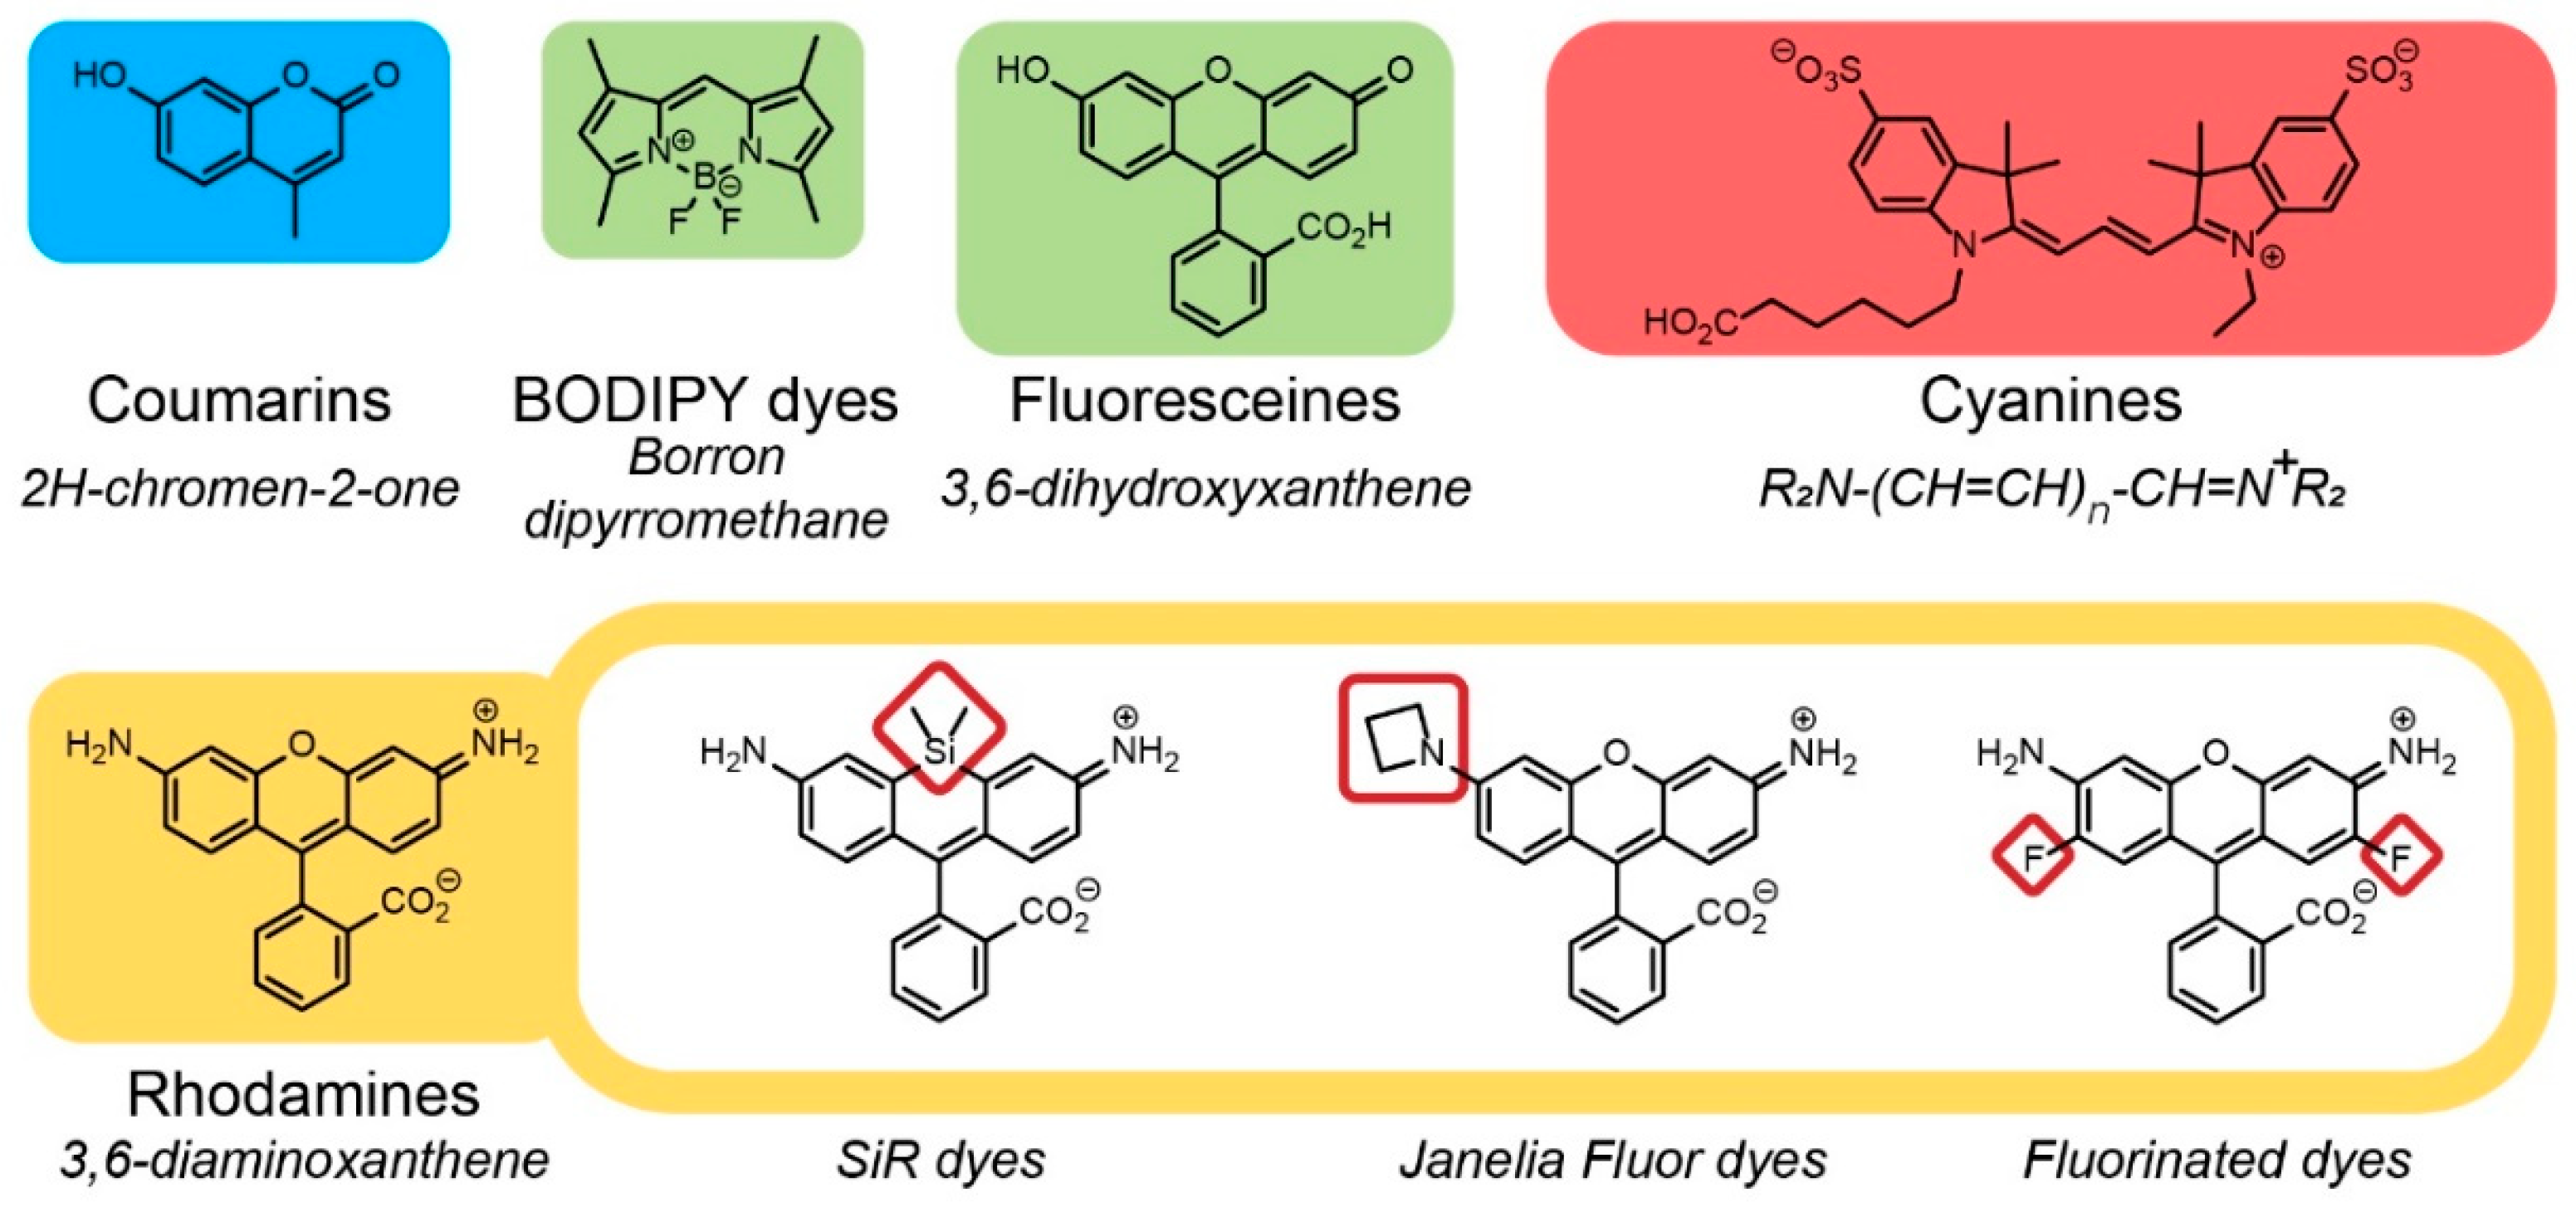
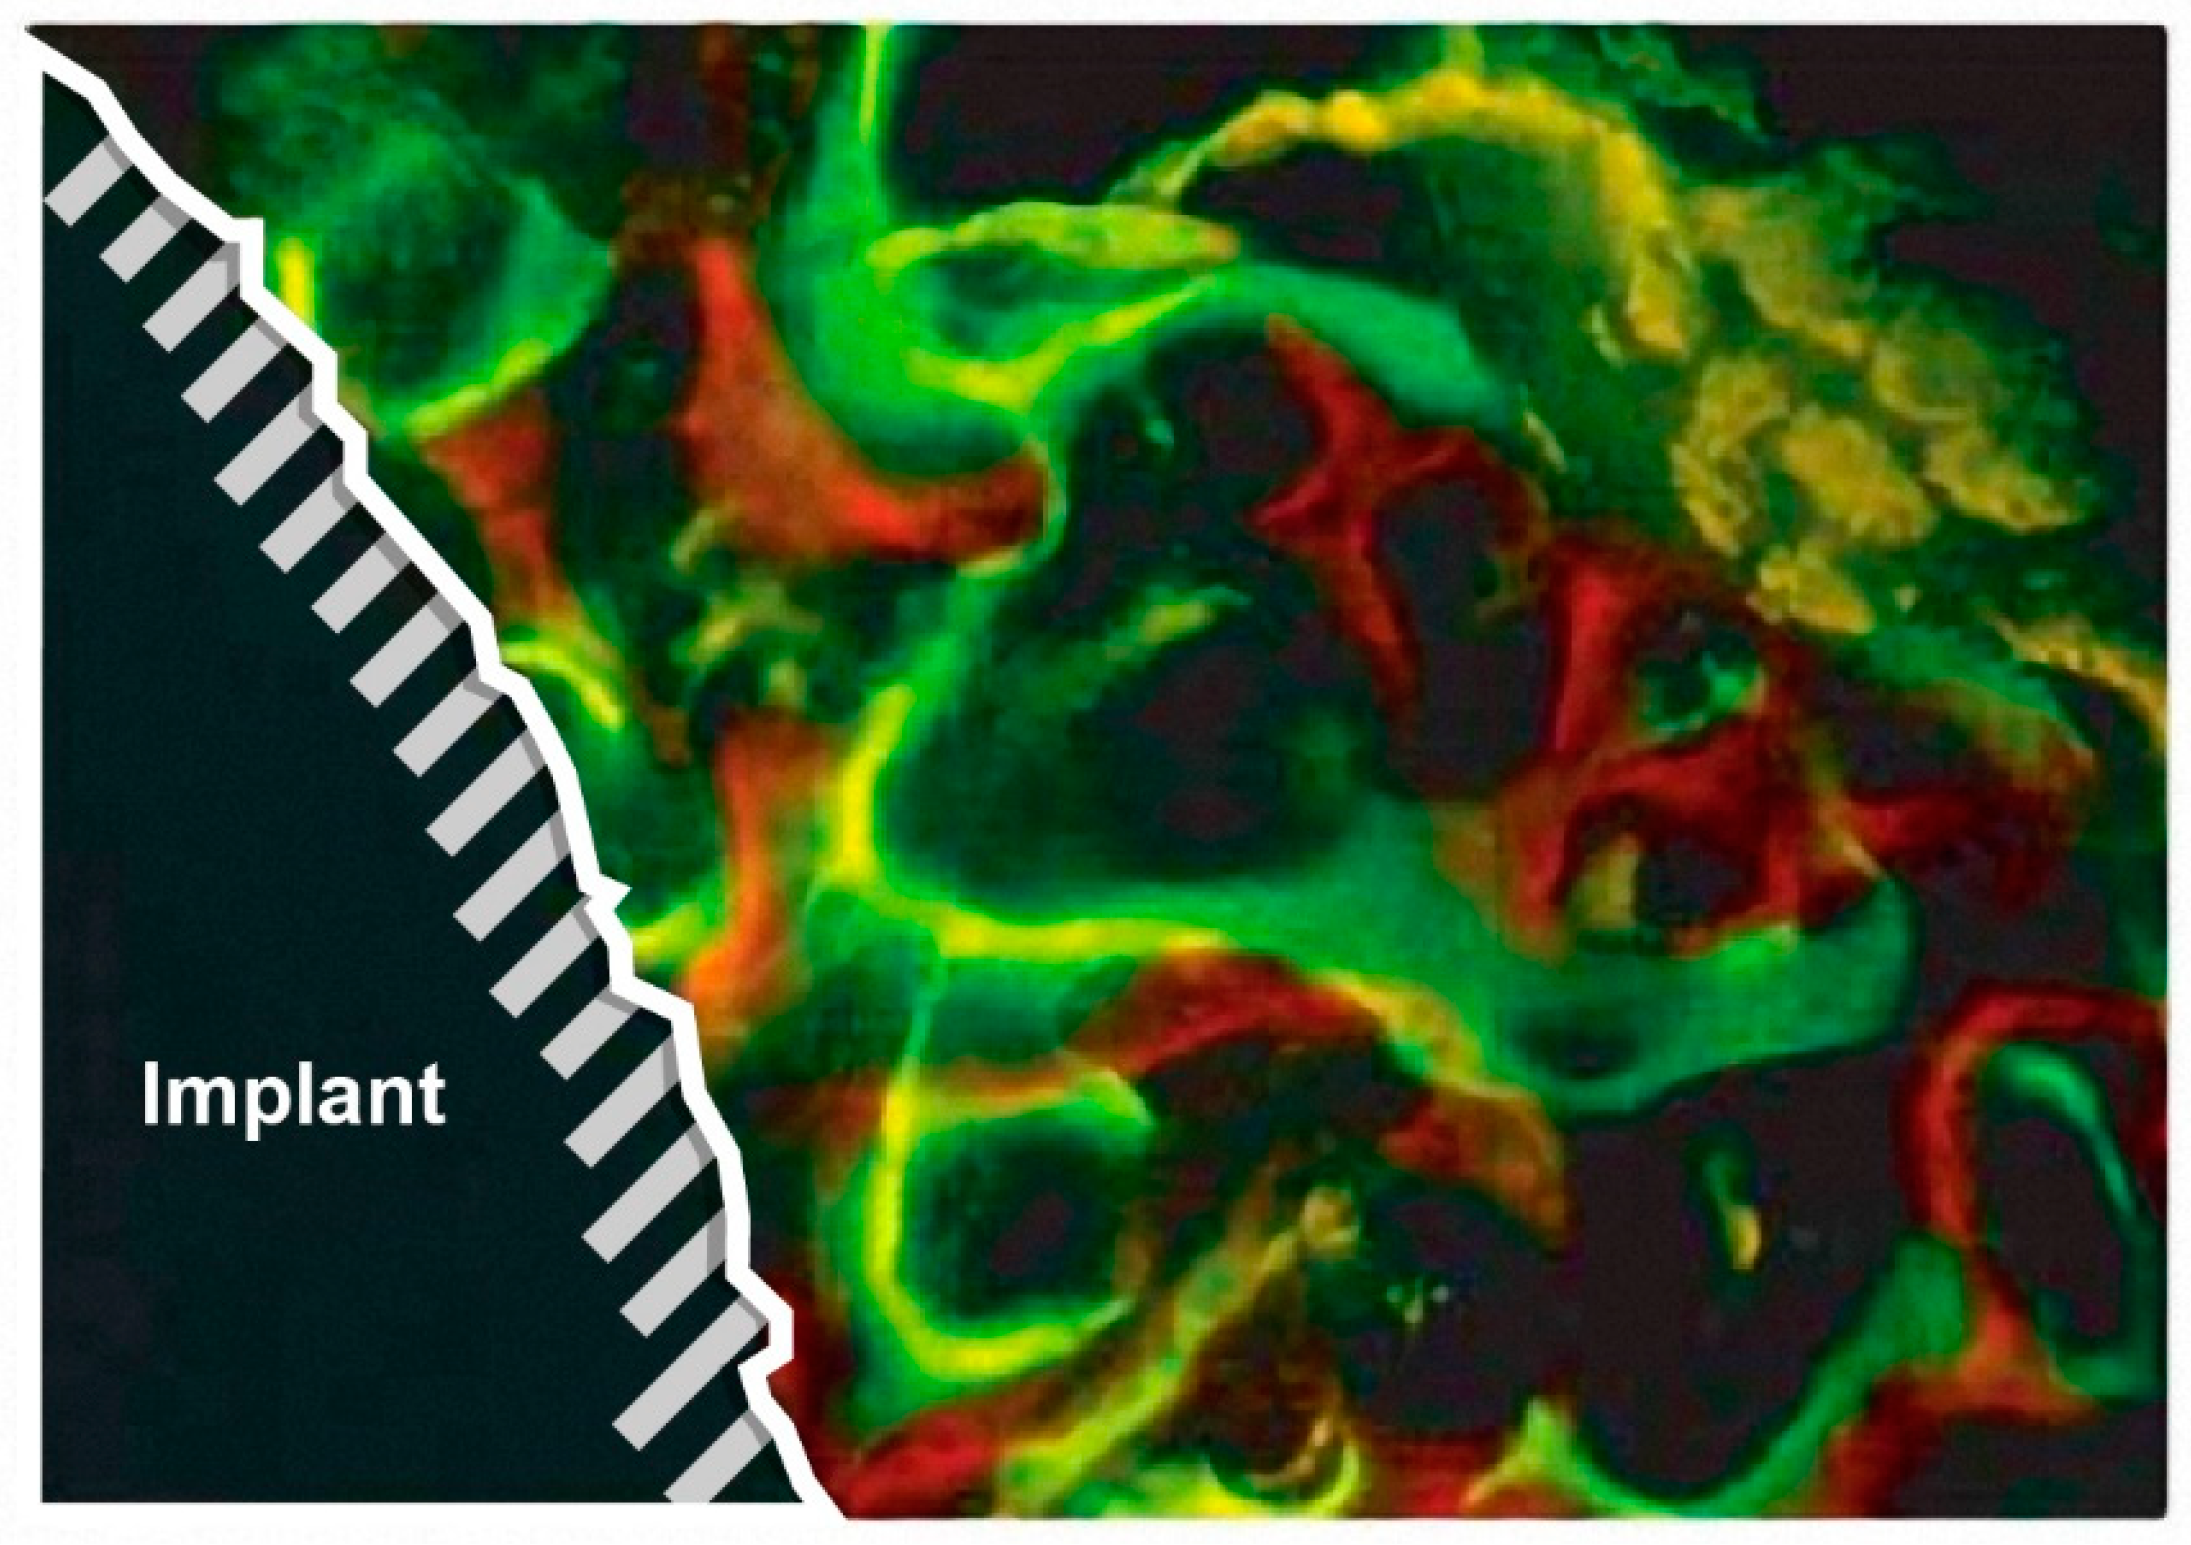
Table 1.
Results of the quantitative analysis of the newly formed bone around implants and cortical bone, after four and eight weeks. Table adapted with permission from [52].
Table 1.
Results of the quantitative analysis of the newly formed bone around implants and cortical bone, after four and eight weeks. Table adapted with permission from [52].
| Time | Weight % | Ratio | |
|---|---|---|---|
| Ca | P | Ca/P | |
| 15.07 ± 2.83 | 7.83 ± 1.56 | 1.93 ± 0.10 | |
| 19.77 ± 1.65 | 10.27 ± 1.05 | 1.93 ± 0.07 | |
| 17.33 ± 2.39 | 8.90 ± 0.80 | 1.94 ± 0.10 | |
| 21.33 ± 1.88 | 11.03 ± 0.70 | 1.93 ± 0.05 | |
NB, newly bone and CB, cortical bone.
Table 2.
List of commercially available implants tested. Table reproduced with permission from [69].
Table 2.
List of commercially available implants tested. Table reproduced with permission from [69].
| Product | Code | Surface Treatment * | Manufacturer |
|---|---|---|---|
| Allfit | ALF | Al2O3 blasted | Dr. Idhe Dental |
| Ice | ICE | Smooth machined | 3i |
| IMZ TPS | TPS | Titanium plasma sprayed | Friedrichsfeld |
| Laser Lok | LLK | Tricalcium phosphate/hydroxyapatite blasted | Biohorizons |
| PrimaConnex | PRC | Calcium phosphate blasted | Lifecore Biomedical |
| Ospol | OSP | Calcium-anodized | Ospol |
| Osseospeed TX | OSS | Titanium oxide blasted/fluoride treated | Astra Tech |
| Osseotite Full | OTF | Acid-etched (double) | 3i |
| Replace Select | RPS | Calcium phosphate anodized | Nobel Biocare |
| SLA | SLA | Al2O3 blasted/acid etched | Institute Straumann |
| Trilobe | TRB | Al2O3 blasted | Southern Implants |
* According to manufacturers’ information.
Table 3.
Summary of the fluorescence techniques and their applications in biomaterial studies and implantology.
Table 3.
Summary of the fluorescence techniques and their applications in biomaterial studies and implantology.
| Fluorescent Technique | Staining Method | Monitored Cells | Monitored Tissues | Principle Of The Study | Ref. |
|---|---|---|---|---|---|
| Fluorescence microscopy | Oxytetracycline, alizarin complexion, calcein, xylenol | - | Implant-surrounding fibrous tissue | Evaluation of the osteotome technique | [114] |
| Rhodamine-phalloidin, DAPI, fluorochrome-conjugated secondary antibody | rBMSC, HUVEC | - | Evaluation of the osteogenic and pro-angiogenic properties of Zn/Mg coating | [115] | |
| Bisbenzimide trihydrochloride, phalloidin Atto 488 | NIH 3T3 | - | Evaluation of the properties and cytocompatibility of silicon carbide ceramics | [116] | |
| FITC-phalloidin, DAPI, propidium iodide, acridine orange | MC3T3-E1, S. aureus, E. coli | - | Evaluation of the cytocompatibility and antibacterial properties of ZnO/Ag/PLGA coating | [117] | |
| X-ray fluorescence microscopy | - | - | Implant-surrounding fibrous tissue | Evaluate the level of corrosion of electrode implants | [118] |
| - | - | Implant-surrounding bone tissue | Monitoring of the release of cobalt and chromium from Co-Cr alloy implant | [119] | |
| - | - | Implant-surrounding connective tissue | Monitoring of the release of nickel from nickel-based implants | [120] | |
| Confocal microscopy | Tetracycline hydrochloride, calcein | - | Implant-surrounding bone tissue | Visualization of the process of the new bone formation | [112] |
| Phalloidin, DAPI, live/dead assay kit (in vitro), calcein (in vivo) | hMSC | Implant-surrounding bone tissue | Description of the influence of a coating on the new bone formation | [108] | |
| Immunostaining with goat anti-mouse IgG-FITC, rhodamine-phalloidin, DAPI, Live/Dead Bacterial Viability Kit | MC3T3-E1, E. coli | - | Evaluation of cytocompatibility and antibacterial properties of graphene/gelatin-based coating | [121] | |
| Total internal reflection fluorescence microscopy | 1,1′-dioctadecyl-3,3,3′,3′-tetramethylindocarbocyanineperchlorate (DiIC18(3)) | Bovine aortic endothelial cells | - | Description of dynamics of cell surface adhesion | [122,123] |
| 1,1′-dioctadecyl-3,3,3′,3′-tetramethylindocarbocyanineperchlorate (DiIC18(3)) | Endothelial cells | - | Description of dynamics of cell-implant contact | [122,123] | |
| Imaging systems | Cy5.5 N-hydroxysuccinimide | - | Hydrogel-surrounding soft tissue | Integration of biodegradable hydrogel implants containing VEGF | [124] |
| OsteoSenseTM750 | - | Bone tissue accumulated on the implants | Bone deposition on surface-modified titanium implants | [125] | |
| Cy7.5-NHS ester | - | Implant-surrounding soft tissue | Visualization and quantification of diffusion of fluorescently doped NPs | [126] |
© 2020 by the authors. Licensee MDPI, Basel, Switzerland. This article is an open access article distributed under the terms and conditions of the Creative Commons Attribution (CC BY) license (http://creativecommons.org/licenses/by/4.0/).
Share and Cite
MDPI and ACS Style
Lach, S.; Jurczak, P.; Karska, N.; Kubiś, A.; Szymańska, A.; Rodziewicz-Motowidło, S. Spectroscopic Methods Used in Implant Material Studies. Molecules 2020, 25, 579. https://doi.org/10.3390/molecules25030579
AMA Style
Lach S, Jurczak P, Karska N, Kubiś A, Szymańska A, Rodziewicz-Motowidło S. Spectroscopic Methods Used in Implant Material Studies. Molecules. 2020; 25(3):579. https://doi.org/10.3390/molecules25030579
Chicago/Turabian StyleLach, Sławomir, Przemysław Jurczak, Natalia Karska, Agnieszka Kubiś, Aneta Szymańska, and Sylwia Rodziewicz-Motowidło. 2020. "Spectroscopic Methods Used in Implant Material Studies" Molecules 25, no. 3: 579. https://doi.org/10.3390/molecules25030579