Article

Physicochemical Properties of Dried Apple Slices: Impact of Osmo-Dehydration, Sonication, and Drying Methods

by
Joanna Cichowska-Bogusz
1,*,
Adam Figiel
2,
Angel Antonio Carbonell-Barrachina
3,
Marta Pasławska
2 and
Dorota Witrowa-Rajchert
1
1
Department of Food Engineering and Process Management, Warsaw University of Life Sciences, 02-776 Warsaw, Poland
2
Institute of Agricultural Engineering, Wrocław University of Environmental and Life Sciences, 51-630 Wroclaw, Poland
3
Agro-Food Technology Department, Food Quality and Safety Group, Miguel Hernández University, Carretera de Beniel, Orihuela, Alicante 03312, Spain
*
Author to whom correspondence should be addressed.
Molecules 2020, 25(5), 1078; https://doi.org/10.3390/molecules25051078
Submission received: 28 January 2020 / Revised: 23 February 2020 / Accepted: 24 February 2020 / Published: 28 February 2020
(This article belongs to the Special Issue Physicochemical Properties of Food)

Abstract

:
Apple slices of the Elise variety were previously osmo-dehydrated in erythritol, xylitol, and sucrose for 2 h. In some parts of the experiment, 30 min of ultrasound pre-treatment (US) were applied. Afterwards, fruit samples were dried by convective (CD), microwave-vacuum (VM), and a combined method (CD/VM, mix two of them). The main aim of the research was to characterize an impact of osmotic dehydration, sonication pre-treatment, and drying method on the physicochemical properties of the dried apples. The use of sugar alcohols (xylitol, erythritol) in the production of dried apples did not badly affect the taste of the obtained dried products; it enabled a noticeable cooling/refreshing effect felt in the mouth when consuming a snack, and enabled the production of dried snacks with lower calorific value. Polyol residues in the product were at a level that was safe for consumers. The most popular convective drying was long lasting, whereas the VM drying method allowed for the shortest drying time, amounting to 76 min; moreover, additional application of ultrasounds reduced this time to 36 min. The combined drying method allowed the total duration of the process to be reduced 2–4.5 times. Ultrasound applied during osmotic dehydration did not significantly affect attributes of the descriptive sensory analysis for the obtained dried apples. The best hygroscopic properties, ensuring the storage stability of the dried product, showed dried apples previously osmo-dehydrated in erythritol and sucrose solutions.

1. Introduction

Apples are a natural source of sugars and dietary fiber (80% of which are soluble fibers), as well as various minerals, and vitamins. Consumers prefer dried apples to be as close as possible—in eating quality—to a fresh apple. Thus, the texture, color, and taste of dried apples are important [1]. Scientists and innovative food centers are looking for emerging food processing technologies to enable the introduction of new, safer, fresher, and better quality foods, with longer life for local and export markets. Among emerging technologies, ultrasonic dehydration is very promising, because the effects of power ultrasound are more significant at low temperature, which reduces the probability of food degradation [2]. Forced convection drying (CD) is one of the most common drying operations in the food industry and, together with ultrasound wave applied during the process, shortens the total drying time [3]. Vacuum-microwave (VM) drying of fruits is becoming more popular because of its advantages. In this method, microwaves penetrate the interior of the material subjected to drying, causing water to boil at low temperatures. This creates a large vapor pressure, differential between the center and the surface of the material, allowing rapid transport of moisture out of the product and preventing structural collapse [4]. A combined drying method (CD/VM), which includes convective pre-drying and microwave-vacuum finish-drying, shortens the drying time by about 50%, compared to other methods used for drying apple cubes [5]. Osmotic dehydration is the process that can be used as pre-treatment for conventional drying procedures. Removal of water and solutes in the food, as well as osmotic solute gain, are simultaneous isothermal flows without any phase change. The osmotic dehydration process provides the possibility of modifying properties of food with the aim of improving the quality of the final products [6]. Sugar alcohols could be an alternative to commercial sucrose osmotic agents in this process [7]. Moreover, additional sonication enhances efficiency (e.g., by reducing water activity) [8].
The aim of this study was to investigate the effect of osmotic dehydration, sonication pre-treatment, and the drying method on physicochemical properties of dried apples. To estimate that impact, drying kinetics were the model, and the following determinations were conducted: dry matter content with water activity, hygroscopicity, color changes, selected chemical analysis, as well as descriptive sensory analysis. The product safety of dried apple snacks (containing the rest of sugar alcohols, understood as not exceeding the dose resulting in gastric problems) was also estimated.

2. Results and Discussion

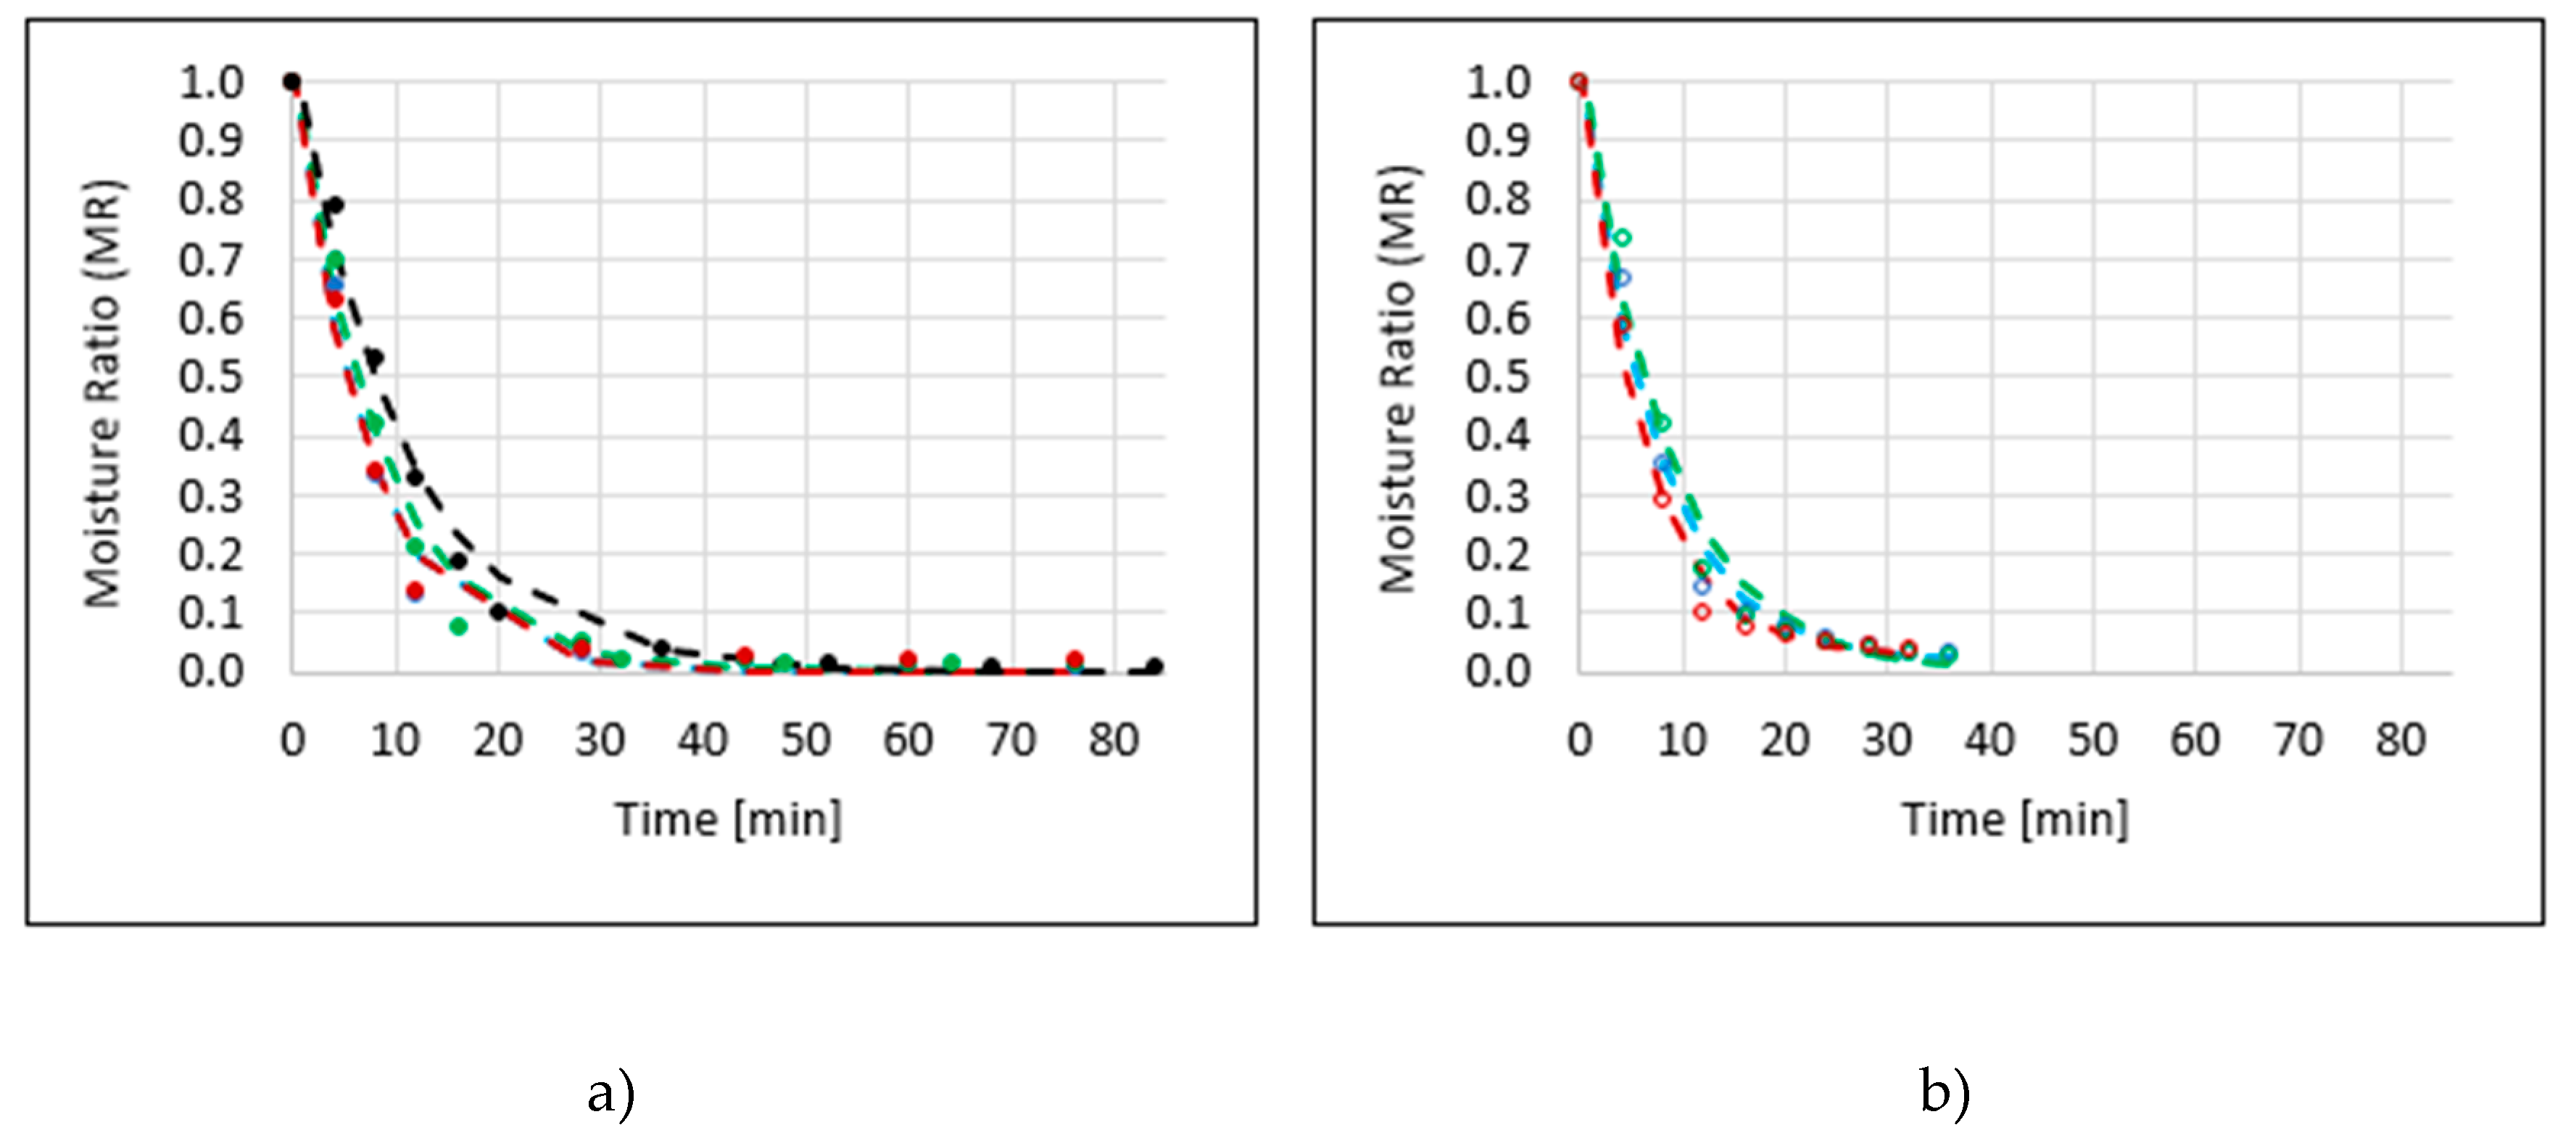
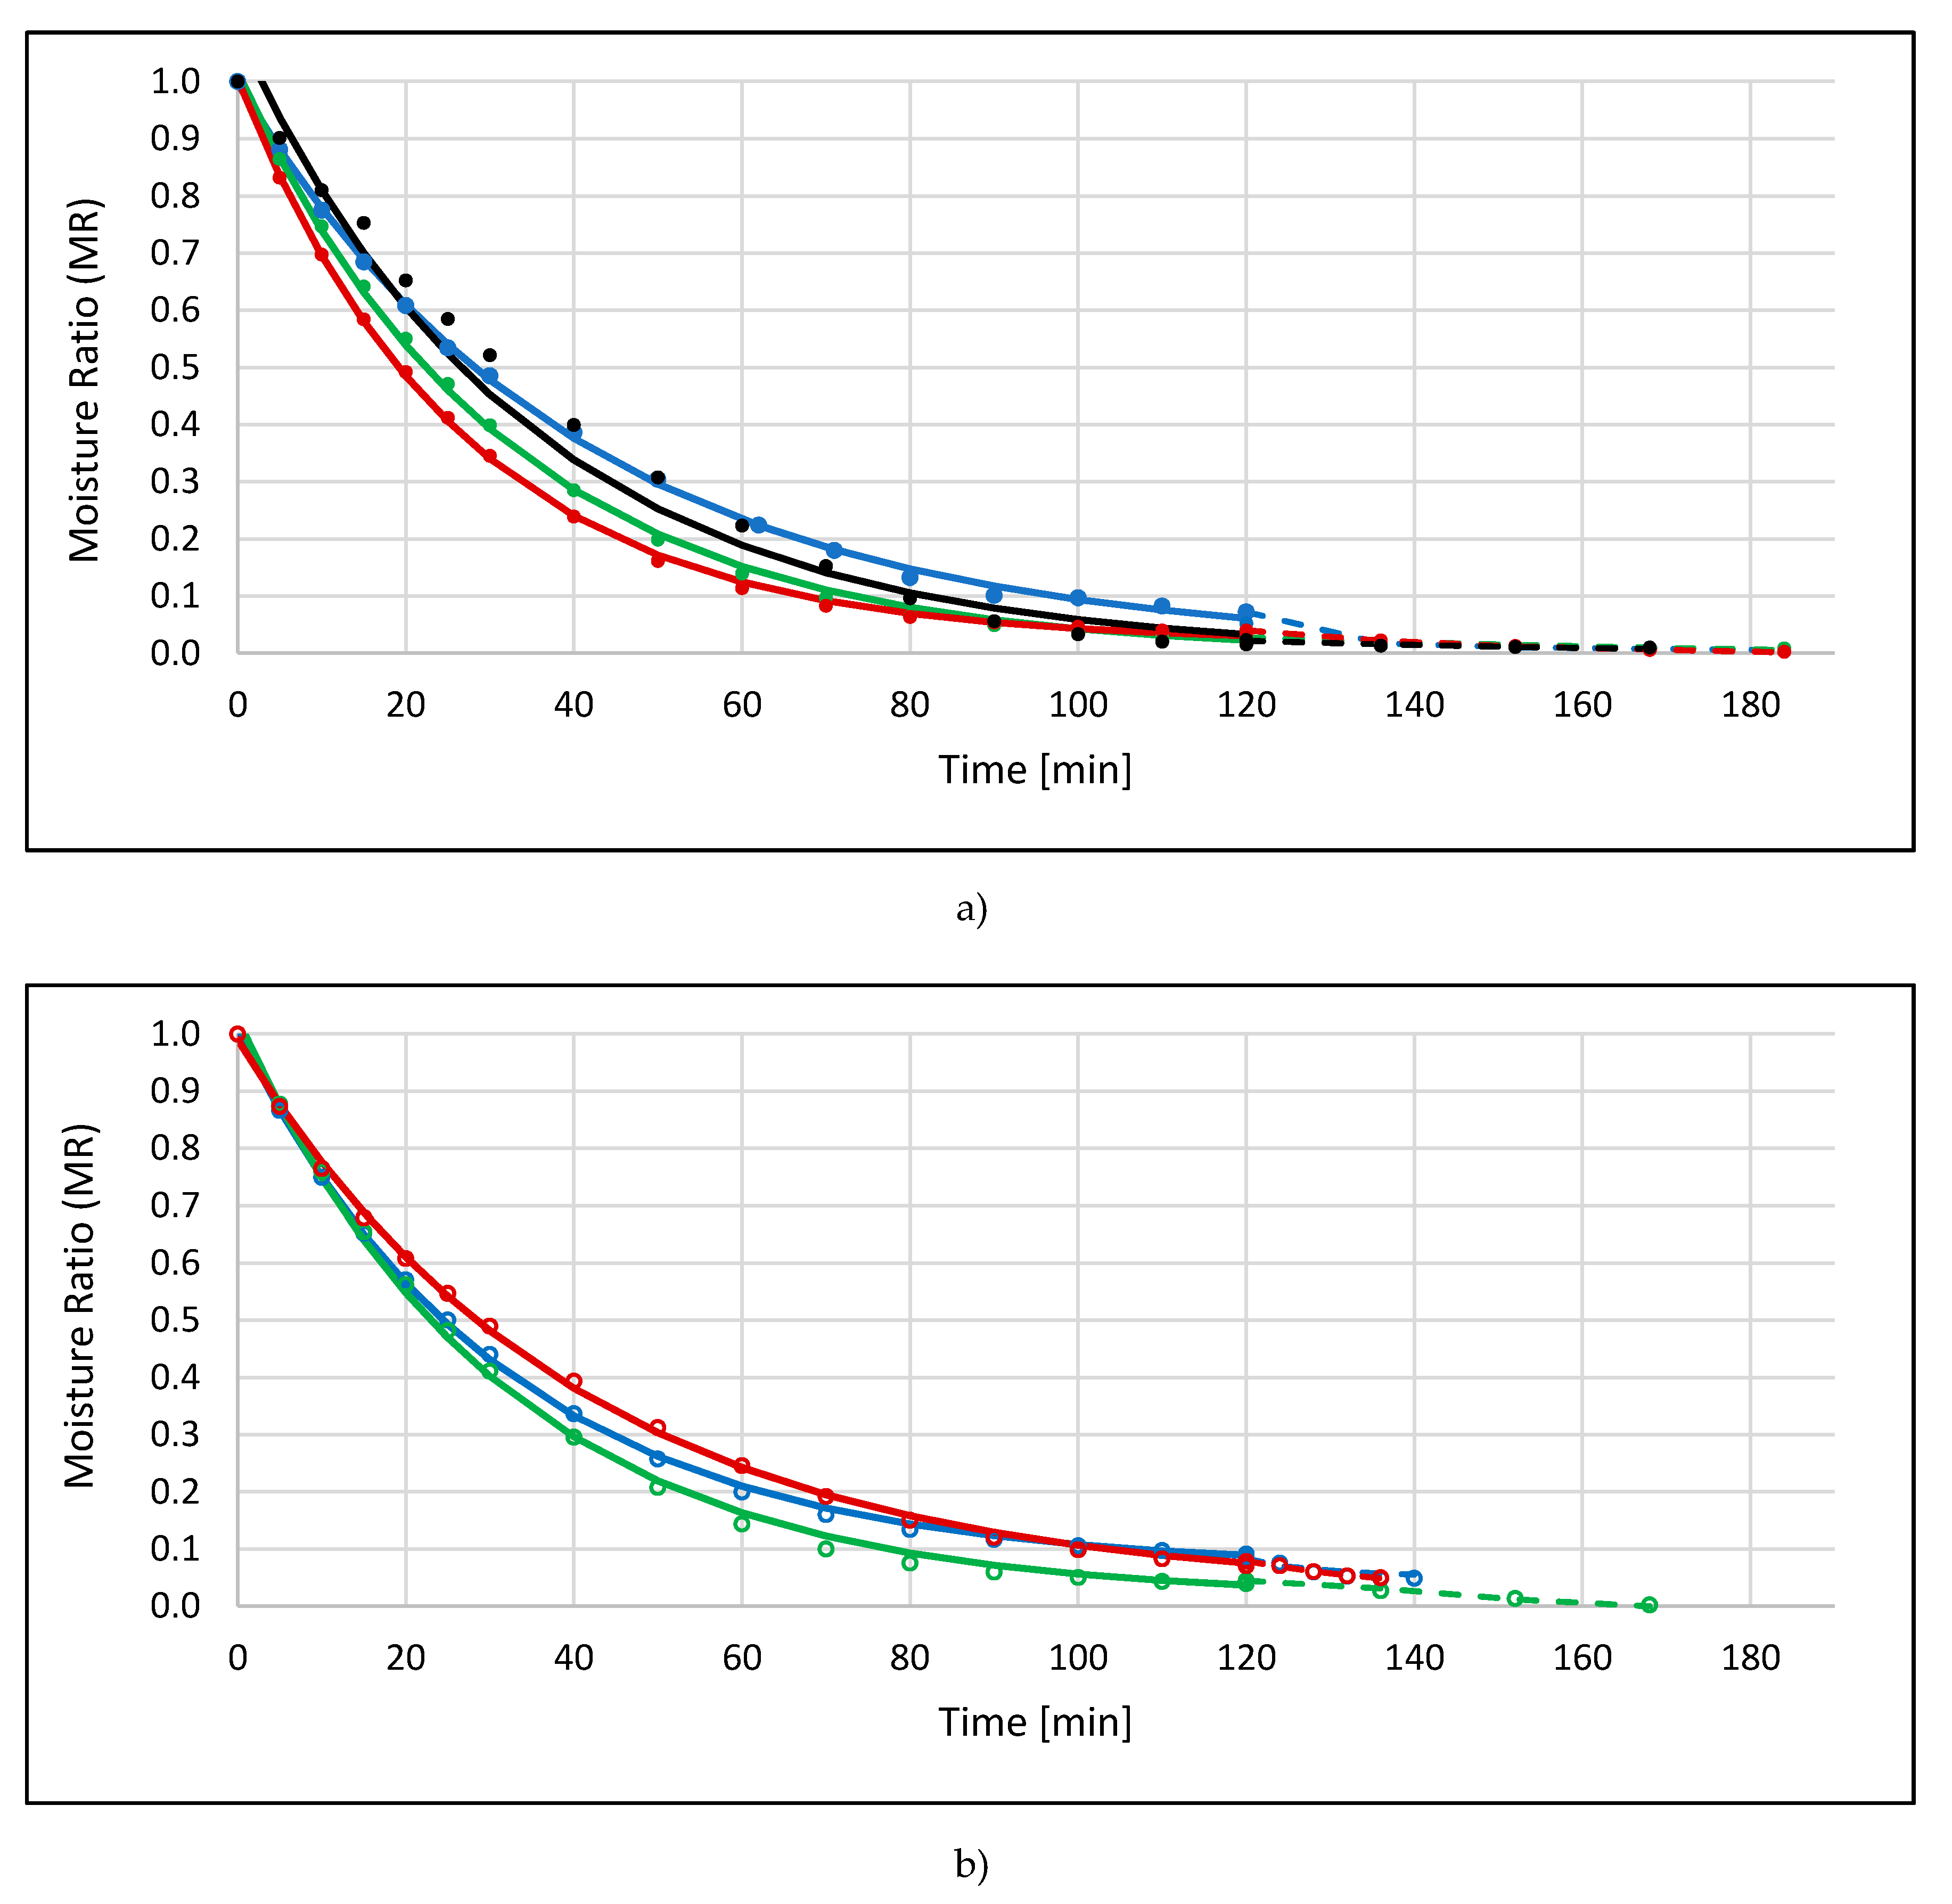
2.1. Drying Kinetics

The drying course is presented as MR (ratio of the actual moisture content to the initial moisture content—Equation (3)) changes at the time. Drying kinetics of apple samples osmo-dehydrated (or not) in different polyols solutions obtained by the convective method are shown in Figure 1a, b. Osmotic dehydration before drying had significant influence on the total drying time (Figure 1a, Table 1). The longest process of convective drying was in the case of erythritol, used as hypertonic solution (ECD)—405 min, and the shortest time was observed in the case of xylitol (XCD)—315 min, which allowed to shorten the total time of drying of half an hour, compared to control samples (RCD). Nomenclature of all of the samples is presented in Table A1.
The use of additional sonication during osmotic dehydration resulted in a significant extension of the duration of the convective drying process, from 2.5 h to 4 h, in the case of xylitol and sucrose solutions, respectively (Figure 1b, Table 1). Based on these observations, the impact of the use of ultrasound as pre-treatment was found to be unfavorable on convection drying after osmotic dehydration. The same observation was reported by Mierzwa and Kowalski [9], the ultrasound positively affects the drying kinetics for fresh—not pretreated—osmotic dehydration (OD) or ultrasound (US)-assisted OD samples. Unfortunately, the application of ultrasound did not influence the kinetics of initially osmo-dehydrated convectively dried samples. Researchers explain that this negative outcome was probably caused by sugar, which penetrated the material during osmotic processes. However, time reduction of convective drying time after application of the ultrasound was noticed in the literature for apple slices by 5–13% [10], and 27% for apple cubes [3] in relation to untreated material, but this material was not osmotic dehydrated before drying.
Another technique for drying apples was the microwave-vacuum method, which enabled a significant reduction of the process time to 76 min in the case of osmo-dehydrated apples in three variants (erythritol, xylitol, sucrose) and to 84 min in the case of control sample (Table 1). The drying kinetics of EVM (all abbreviations—Table A1) apples almost coincided with the kinetics of dried SVM, while being similar to the kinetics obtained for dried XVM (Figure 2a). The use of additional sonication during osmotic dehydration had a beneficial effect on the course of microwave-vacuum drying. The process time was shortened to dehydration, 36 min in the case of apples, which were dehydrated in polyol solutions, and to 32 min in the case of a sucrose solution (Figure 2b), which was the shortest of the noted drying times (Table 1). Fuente-Blanco et al. [2] noticed an influence of ultrasound on the creation of microscopic channels, reducing the diffusion boundary layer, and increasing the convective mass transfer in foodstuff. Ultrasonic waves increased the effective water diffusivity because water could use these microscopic channels as an easier pathway to diffuse towards the surface of the fruit. On the other hand, the osmotic dehydration increased the effective water diffusivity by breaking down part of the cell walls, reducing the resistance for water to diffuse through the cells [11].
The last used technique was combined drying (CD/VM), consisting of convective drying and microwave-vacuum drying. After elaborating the results, it was found that convective pre-drying took too long; as a result, the water content in the dried apples before VM drying was very low, and the reduction of the entire process time did not look as spectacular as in the case of tests carried out by Figiel [12]. The main difficulty of the CD/VM method concerns the times when CD should be replaced by VM drying. As the main role of convective pre-drying lies on maximal water removal (from the raw material) with a satisfactory drying rate (which represents the rate of MR change in the time unit), VM should start at a critical point of CD when drying kinetics is losing its linear character for the exponential decrease of moisture content in time characterized by the decreasing drying rate [13]. Presumably, in the meantime, one of the magnetrons was also turned off while the dryer was working at “half power”; it is not known when this situation began to affect the results. Figure 3 shows the kinetics of the combined drying of apples dehydrated in different solutions without (Figure 3a) and using ultrasound (Figure 3b). Comparing the total drying time (Table 1) of apple samples previously subjected to erythritol (blue lines), it can be stated that the combination of convective and microwave-vacuum drying reduced the drying time more than twice in the non-sonication option (from 405 to 184 min) and more than four times in the case with ultrasound pre-treatment (from 615 to 140 min). This observation is in agreement with other research [14], where it was reported that finish-drying of the apples with the VM method preliminary dried with the convective method, as well as considerably shortened the total time of drying, and reduced drying shrinkage.
Similar kinetics of combined drying was noted in the case of apples dehydrated in xylitol solution—the total drying time without US was also 184 min (Figure 3a, Table 1). The additional application of ultrasound allowed for reducing the process time to 168 min (Figure 3b, Table 1), but it was smaller compared to the previously discussed example of ECD/VM_US. Microwave-vacuum finish drying of apples osmo-dehydrated in a sucrose solution (SCD/VM) also lasted 184 min, which proves that the type of osmotic substance did not affect the length of combined drying time in variants without sonication. Pre-treatment of ultrasound during OD enabled the largest reduction of drying time, even 4.5 times (from 615 to 136 min) (Figure 3b). The combined drying method, also in the case of the control sample (black line in Figure 3a), allowed reduction by twice the drying time, compared to the convection (Table 1).
According to experimental data obtained during drying by three methods (CD, VM, CD/VM), it was stated that the loss of water content in apple samples could be described by means of a two-term exponential model function (Equation (1)):
M R = b 1 · e k 1 · t + b 2 · e k 2 · t .
or by an exponential function, Henderson–Pabis model (Equation (2)):
M R = b 1 · e k 1 · t
These models were chosen based on previous research, where similar methods of drying were used [5,12,15]. The mathematical structure of the first model indicates that the decrease in the moisture ratio occurs in two phases, which are characterized by the way the drying rate changes with the moisture ratio.
The faster decrease in the drying rate observed in the first phase of the process was associated with the drying parameter k1 10 times greater than the value of k2 (Table 1). The values b1 and b2 are ranges of MR values, where they decrease with different drying rates. For comparison: in about 98% of the MR range of convective drying of dehydrated apples in sucrose (SCD), a decrease in MR occurred at a high drying rate, while in the case of drying apples without pre-treatment (RCD) using the same drying method, a decrease in MR value was observed at low drying speed (in about 71% of the MR range).

2.2. Dry Matter Content and Water Activity

Table 2 presents the values of dry matter content and water activity in dried apples. All variants were characterized by a substantial amount of dry matter, as well as low values of water activity, which determines longer shelf life and microbiological safety of the product. Dried apples, which were previously osmo-dehydrated in polyols solutions, showed a significantly higher percentage of dry matter content (Table 2). The method of drying had significant influence on dry matter content only in the case of dried apples previously dehydrated in sucrose and erythritol (p-Value: 0.000 and 0.032, respectively). Xylitol, used as an osmotic substance during osmotic dehydration, had a significant influence on lowering the value of water activity in the case of dried apple samples obtained by the combined method. Significant influence of the osmotic agent on water activity was also observed in the samples after sonication. The lowest values were noticed for xylitol among CD-samples as well as apple samples that were osmo-dehydrated in sucrose solution for CD/VM samples.
Additional ultrasound application significantly reduced the dry matter content (p-Value: 0.000), which resulted in significantly higher values of water activity (p-Value: 0.000). This statement was also confirmed by t-Test between non-US vs. US data. The test has been constructed to determine whether the difference between the two means of dry matter content and/or water activity values equals 0.0, versus the alternative hypotheses that the mean dry matter content values of non-US samples are greater than US samples, as well as mean water activity values of non-US samples are lower, compared to US-samples. Since the computed p-values were less than 0.05 (p-Value: 0.042, t: 1.823; p-Value: 0.036, t: −1.908, respectively), we rejected the null hypotheses in favor of the alternative. This is probably due to the fact that during sonication, cavitation bubbles may form in the water, which may collapse, causing cell damage. This may promote leaching and ultimately diffusion of water and dry matter from the tissue into the environment [16]. This observation is in agreement with research carried out by Mierzwa and Kowalski [9], who also observed higher values of water activity in convective dried samples after OD with sonication. Pearson’s correlation, carried out between the obtained values presented in Table 2, showed a strong negative correlation with a correlation coefficient value of −0.74 (p-Value: 0.000). This means that the higher the percentage of dry matter, the lower the water activity value in the sample.

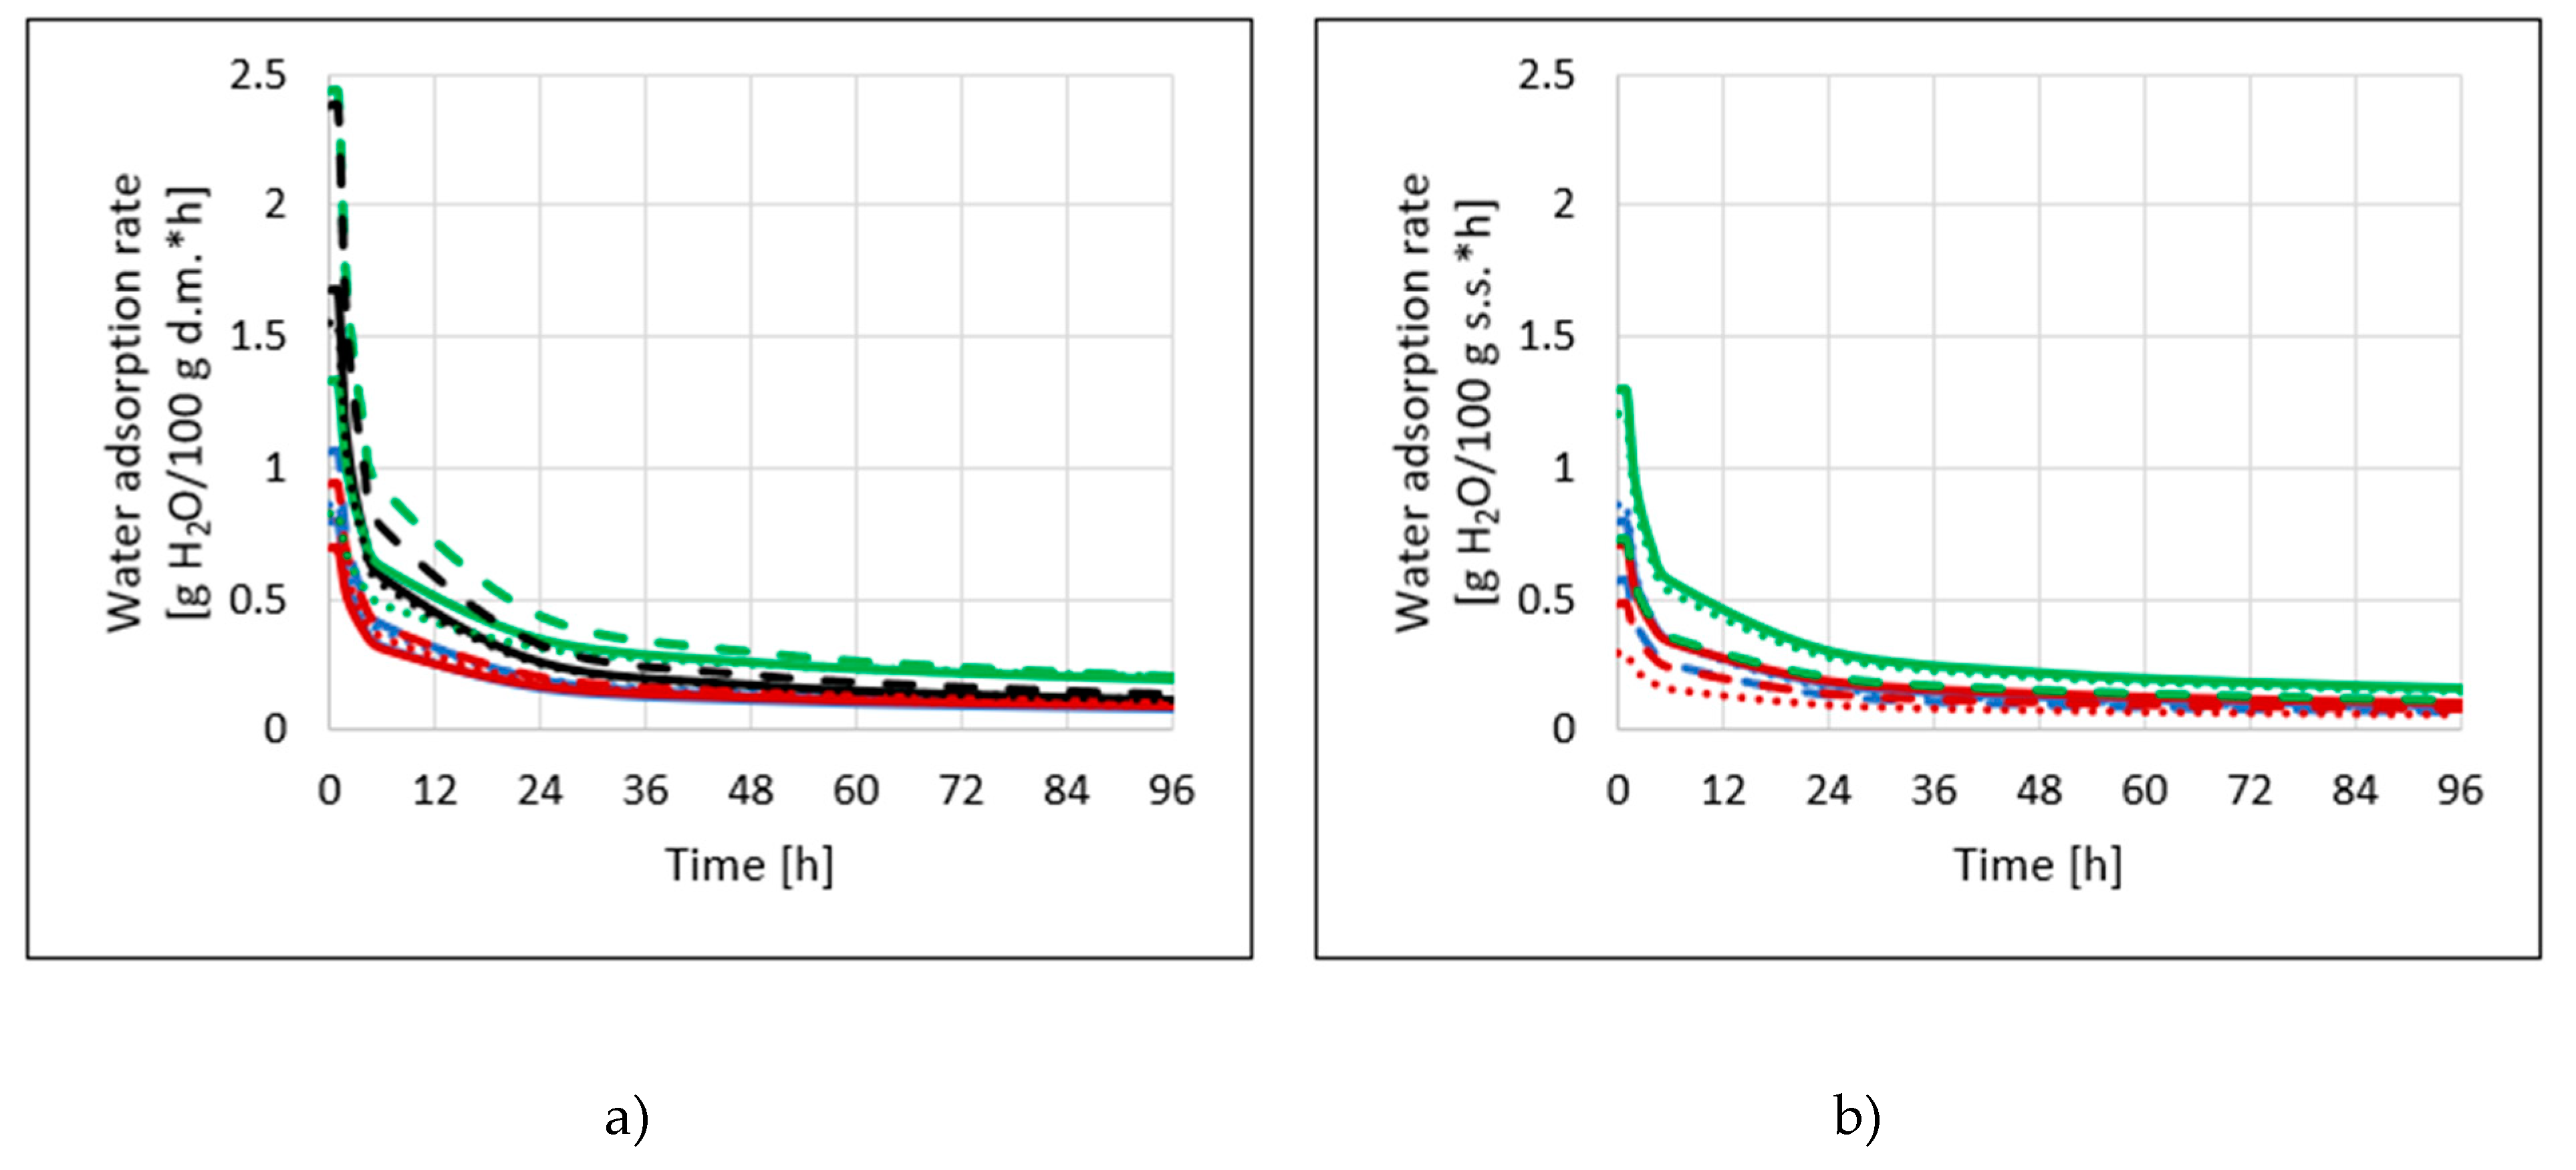
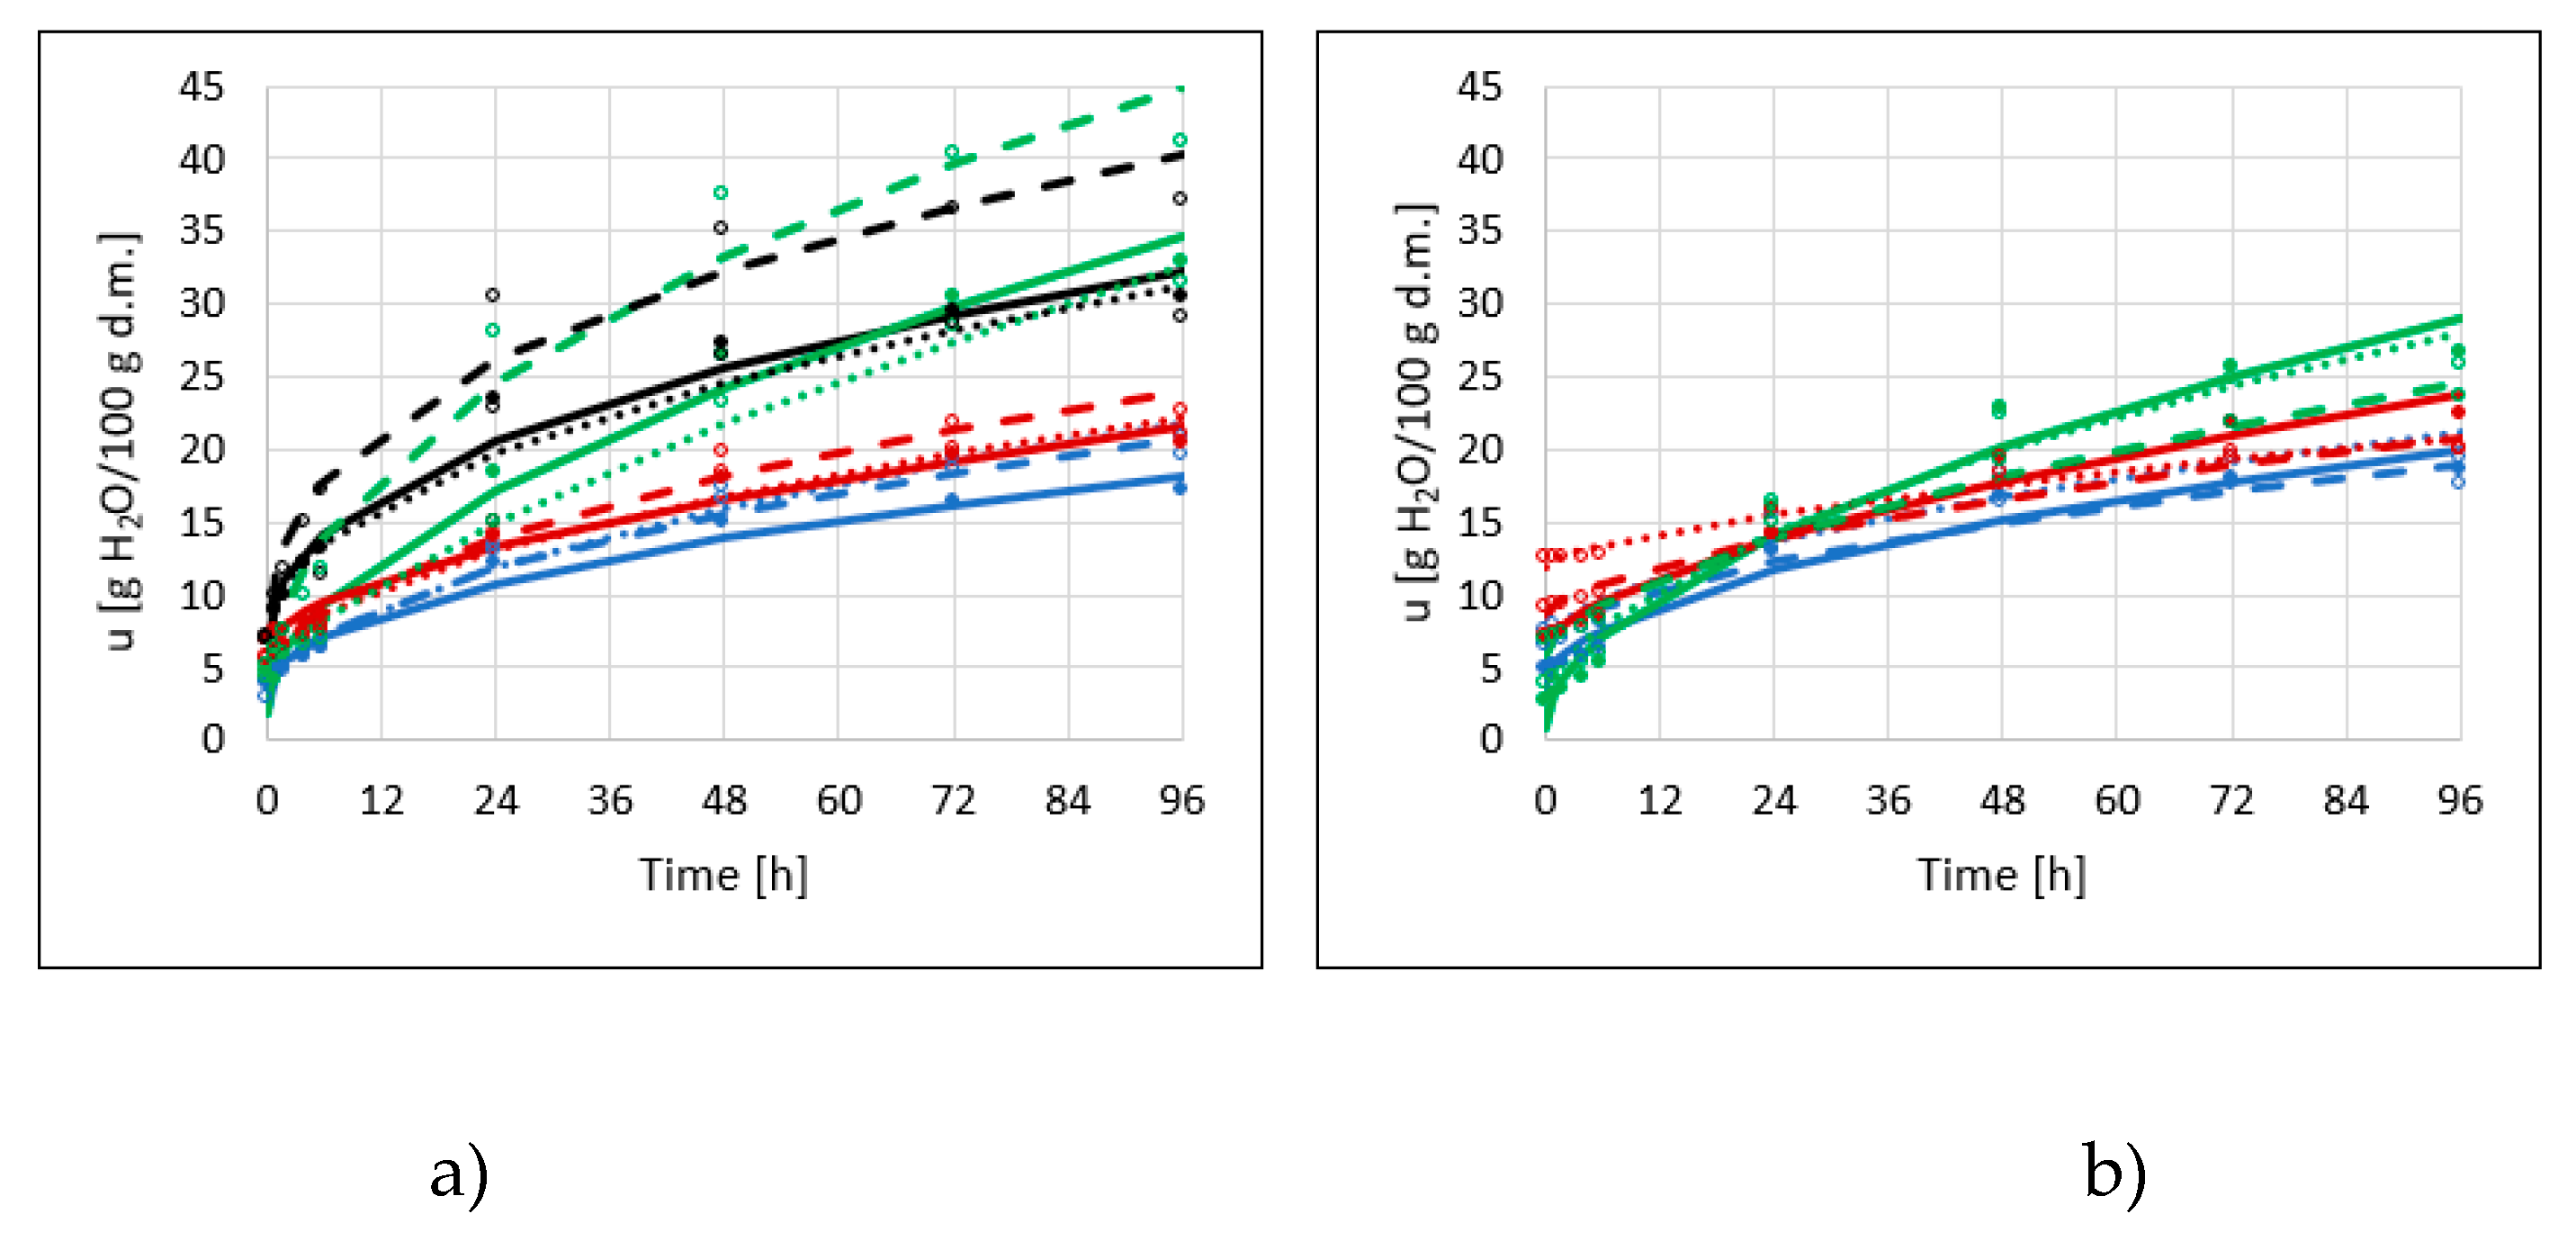
2.3. Hygroscopic Properties

The hygroscopic properties of dried products are associated with the ability to adsorb water in a humid environment [17] and are due to their composition of sugar and pectin in combination with their porous structure. Konopacka et al. [18] reported that at aw below 0.12 apple chips demonstrated excellent crispness. Changes in water content in dried apples were described by equations in the form u = a + btc. After 96 h of adsorption of water vapor from the NaCl solution (aw—0.75), the material reached a significantly different water content. Hygroscopic properties were closely related to the structure of the dried material. The greatest ability to adsorb moisture from the environment was demonstrated by dried apples obtained by the microwave-vacuum method, not subjected to OD (RVM), and dehydrated previously in xylitol solution (XVM)—after 96 h, these samples adsorbed about 40 g of water per 100 g of dry matter (Figure 4a). Water vapor sorption was the most intense in the case of microwave-vacuum drying, which has been proven by other researchers [19]. Slightly less water (about 30 g/100 g d.m.) adsorbed the same type of samples, obtained by convective and combined methods (RCD, RCD/VM and XCD, XCD/VM). These observations also coincide with research carried out by Nowacka and Witrowa-Rajchert [19]. Dried apples, which were osmo-dehydrated in sucrose and erythritol solutions, had about twice the amount of lower hygroscopicity, regardless of the drying method used. The statistical analysis confirmed the significance of all variable factors on the obtained water adsorption values (p-Value < 0.05).
Additional application of ultrasounds during the dehydration process significantly affected the changes in the hygroscopic properties of dried apple (Figure 4b). The obtained water adsorption values are much lower in all cases, except for samples containing erythritol (in this case the values were at a similar level). These values may indicate that, during sonication, some damage in plant tissue occurred, resulting in reduced binding capacity of water. Water vapor sorption after the pre-treatment was most intense in the case of apples previously dehydrated in xylitol solution, obtained by convective and combined methods. Fijałkowska et al. [10] also reported that apple tissue, after application of ultrasound, demonstrated lower hygroscopic properties compared to untreated material. However, obtained values of water adsorbed after 72 h were bigger (36–38 g H2O/100 g dry matter) than in the present research (Figure 4b). Lower hygroscopicity of the samples indicates greater storage stability for these dried apples.
Differentiation of equations describing changes in water content in dried apples over time has enabled the plotting of water vapor adsorption velocity curves (Figure 5a). Depending on the method of removing water, in the initial period, within one hour, the samples absorbed from 0.7 to 2.4 g water/100 g dry matter. The phenomenon was very intensive during the first 4 h of the process, during which its speed decreased more than twice. Similar values of water vapor adsorption rates for convective dried apples were observed by Witrowa-Rajchert et al. [17]. The rate of water vapor adsorption in apples treated with ultrasound during dehydration was dependent on the drying method. The values were from 0.3 to 1.3 g water/100 g dry matter per hour of the process (in the initial stage) (Figure 5b). The lower water content, as well as the rate of water vapor adsorption in these samples, indicates their weaker hygroscopic properties.

2.4. Color Changes

The color is one of the most important parameters, which determines the quality of raw materials and processed products. This characteristic affects the acceptability of a product by the consumer [20]. The lightest color was observed for dried apples without initial osmotic dehydration, subjected to convective (RCD) and combined drying methods (RCD/VM, Table 3). There were no significant differences in surface brightness between the other apple-dried variants. One-way ANOVA analysis of variance indicated a significant impact of the drying method (p-Value: 0.004) only in the case of samples without OD, in general, VM samples had a darker color compared to the other two methods. The impact of sonication was also significant (p-Value: 0.001), after which the dried samples also had a darker color. It was also confirmed by the t-Test (p-Value: 0.003, t: 3.104)—we rejected null hypothesis in favor of the alternative; that means of L* parameter of US-samples are smaller. The same observation was reported by Fijalkowska et al. [20] using the same ultrasound frequency. The L* parameter was influenced by the type of osmotic substance (p-Value: 0.027 and 0.000 for Non-US/US samples, respectively) only in the case of CD-samples. Control samples were characterized by the lightest surface of apple tissue.
Color changes after the technological process in relation to the appearance of a fresh apple are presented in Table 3. Definitely, the most similar appearance to raw material was demonstrated in the samples EVM (obtained after dehydration in erythritol and subjected to microwave-vacuum drying), followed by ECD samples, so dehydrated in the same polyol, but dried by convection. The most significant change in the appearance (absolute color differences) was observed in the RVM apples, which also coincides with the brightness observations for this sample. Statistical analysis showed that all factors had a significant impact on obtained ∆E values. The combined drying method turned out to be the most advantageous due to the smallest color changes after the process, while the highest ∆E values were obtained after the microwave-vacuum drying process (p-Value: 0.020). Statistical analysis indicated significant influence of the drying method on ∆E values only in the case of control samples (p-Value: 0.002). Among the osmotic substances tested, erythritol enabled the most similar appearance of dried apples, compared to the raw material (p-Value: 0.006). However, significant influence of osmotic solution was observed only in the case of Non-US samples, which were dried by VM methods and in CD-samples obtained with additional sonication. Application of ultrasounds resulted in significantly greater changes in the color of dried apples (p-Value: 0.000). In this case, the t-Test has been constructed to determine whether the difference between the two means equals 0.0 versus the alternative hypothesis—that the difference is less than 0.0. Since the computed P-value was less than 0.05 (p-Value: 0.000; t: −4.040), we rejected the null hypothesis. This result corresponds with other research [9]. Moreover, Fijalkowska et al. [20] indicated that lower frequency of ultrasound caused larger alterations of color.

2.5. Selected Chemical Analysis

Based on previous research, apples dried by the combined method (CD/VM) were selected for determining the impact of the kind of chosen osmotic substance on selected chemical properties of dried material. Products obtained after combination of osmotic dehydration, with pre-drying of raw materials by the convective method before VM finish-drying, were characterized by a higher quality, compared to other methods of drying [21]. Additionally, properly applied VM finish-drying may favor formation of biologically active constituents that were not present in the raw material [4], simultaneously providing the crispy texture of the final product [13]. This high crispiness intensity can be produced by the high temperature reached during CD/VM, leading to simultaneous high porosity and low moisture content [21]. Different types of osmotic solution were used in the osmotic dehydration before the drying process. A one-factor analysis of variance made it possible to determine the effect of the applied hypertonic solution before the drying process on the obtained values of chemical indicators contained in Table 4. The same letter next to the result in the same row means no statistically significant differences between the values.
Osmotic dehydration in polyols solutions results in changes in the sugar profile in apple tissue [22]. Comparing dried apples, previously dehydrated with a control-dried sample (RCD/VM), there was a decrease in the percentage of protein, ash, dietary fiber, fructose, and glucose. This can be explained by the increasing amount of osmotic substances, which penetrated from the solution into the apple tissue during dehydration. There were no statistically significant differences in fat content between different dried samples. The sodium content in the dried apple containing erythritol was at a similar level as in the case of the control samples, whereas in the dried apples containing xylitol and sucrose, the values were significantly higher. The energy value of the control sample was determined at a similar level as in the dried apple previously subjected to osmotic dehydration in 50% sucrose solution. The use of sugar alcohols, such as xylitol and erythritol as osmo-active substances, made it possible to obtain dried apples with significantly lower calorific value. The largest reduction in energy value was noted in the case of the erythritol solution.

2.6. Product Safety

Although acceptable daily intake (ADI) dose has not been specified for them, it is well established that the consumption of excessive amounts of polyols, and slowly digestible carbohydrates can provoke undesirable intestinal side effects, such as flatulence, abdominal cramps, laxation, and—in extreme cases—watery diarrhea. Some of these symptoms are the results of osmotic effects, and others are the results of the fermentative degradation of these compounds in the colon [23,24]. Therefore, in order to ensure consumers have adequate information, products containing more than 10% added polyols must include the advisory statement “excessive consumption may produce laxative effects” (in accordance with European Commission Directive 94/54/EC) [25]. The study on a group of volunteers (men) confirmed the thesis that repeated ingestion of erythritol at a daily dose of 1 g/kg body weight is well tolerated by the body [23]. It was also found that erythritol is characterized by similar tolerability between children and adults in terms of laxation on body weight basis, and the distribution of this substance in the human body is identical, regardless of the consumer’s age [26]. Additional studies have shown that females are more resistant than males to laxative effects when exceeding the safe limit for erythritol intake; 50% of laxative effects occurred at a dose of 1.58 g/kg body weight per day, whereas for men, it was a dose of 1.07 g/kg body weight (bw)/day. The same study also indicates that the diarrhea effect of sorbitol is stronger compared to erythritol, and that sucrose intake at a dose above 1.2 g/kg/day does not cause such problems [27]. Bornet et al. [28] observed biliousness in the form of nausea, rumbling in the stomach, flatulence, and soft feces after ingestion of erythritol at 0.4 and 0.8 g/kg bw by healthy people; however, the biliousness was not significantly different from those after taking equivalent doses of sucrose. Other studies indicate laxative threshold for erythritol (the maximum dose at which no individual responds with laxation) of 0.78 g/kg bw [29]. This indicates the ambiguity of literature reports regarding the maximum doses of polyol intake. Even fewer publications relate to experiments with xylitol intake. The most common is the safe value of daily xylitol intake by adults, up to 100 g [30,31]. Four out of 13 children had diarrhea after consuming over 65 g of xylitol per day [32]. Research conducted by Oku and Nakamura [33] indicates the following doses of xylitol intake: 0.38 g/kg and 0.42 g/kg, and erythritol: 0.46 g/kg and 0.68 g/kg for men and women, respectively.
On the basis of the above-mentioned research, it is worth estimating the safety of consumption of dried apples (Table 5). The following assumptions were made: an adult woman weighs 60 kg, an adult man 75 kg, and a 10-year-old child 30 kg. It is also assumed that the unit of package will contain 15 g of dried apple (it is lightweight after drying).
Any food ingredient supplied to the body in excessive amounts can be toxic to the body. Based on the above calculation (Table 5), it is assumed that a healthy, rationally thinking person is not able to exceed the safe amount of snack consumption in the form of dried apples, so the product has been recognized as safe for the consumer.

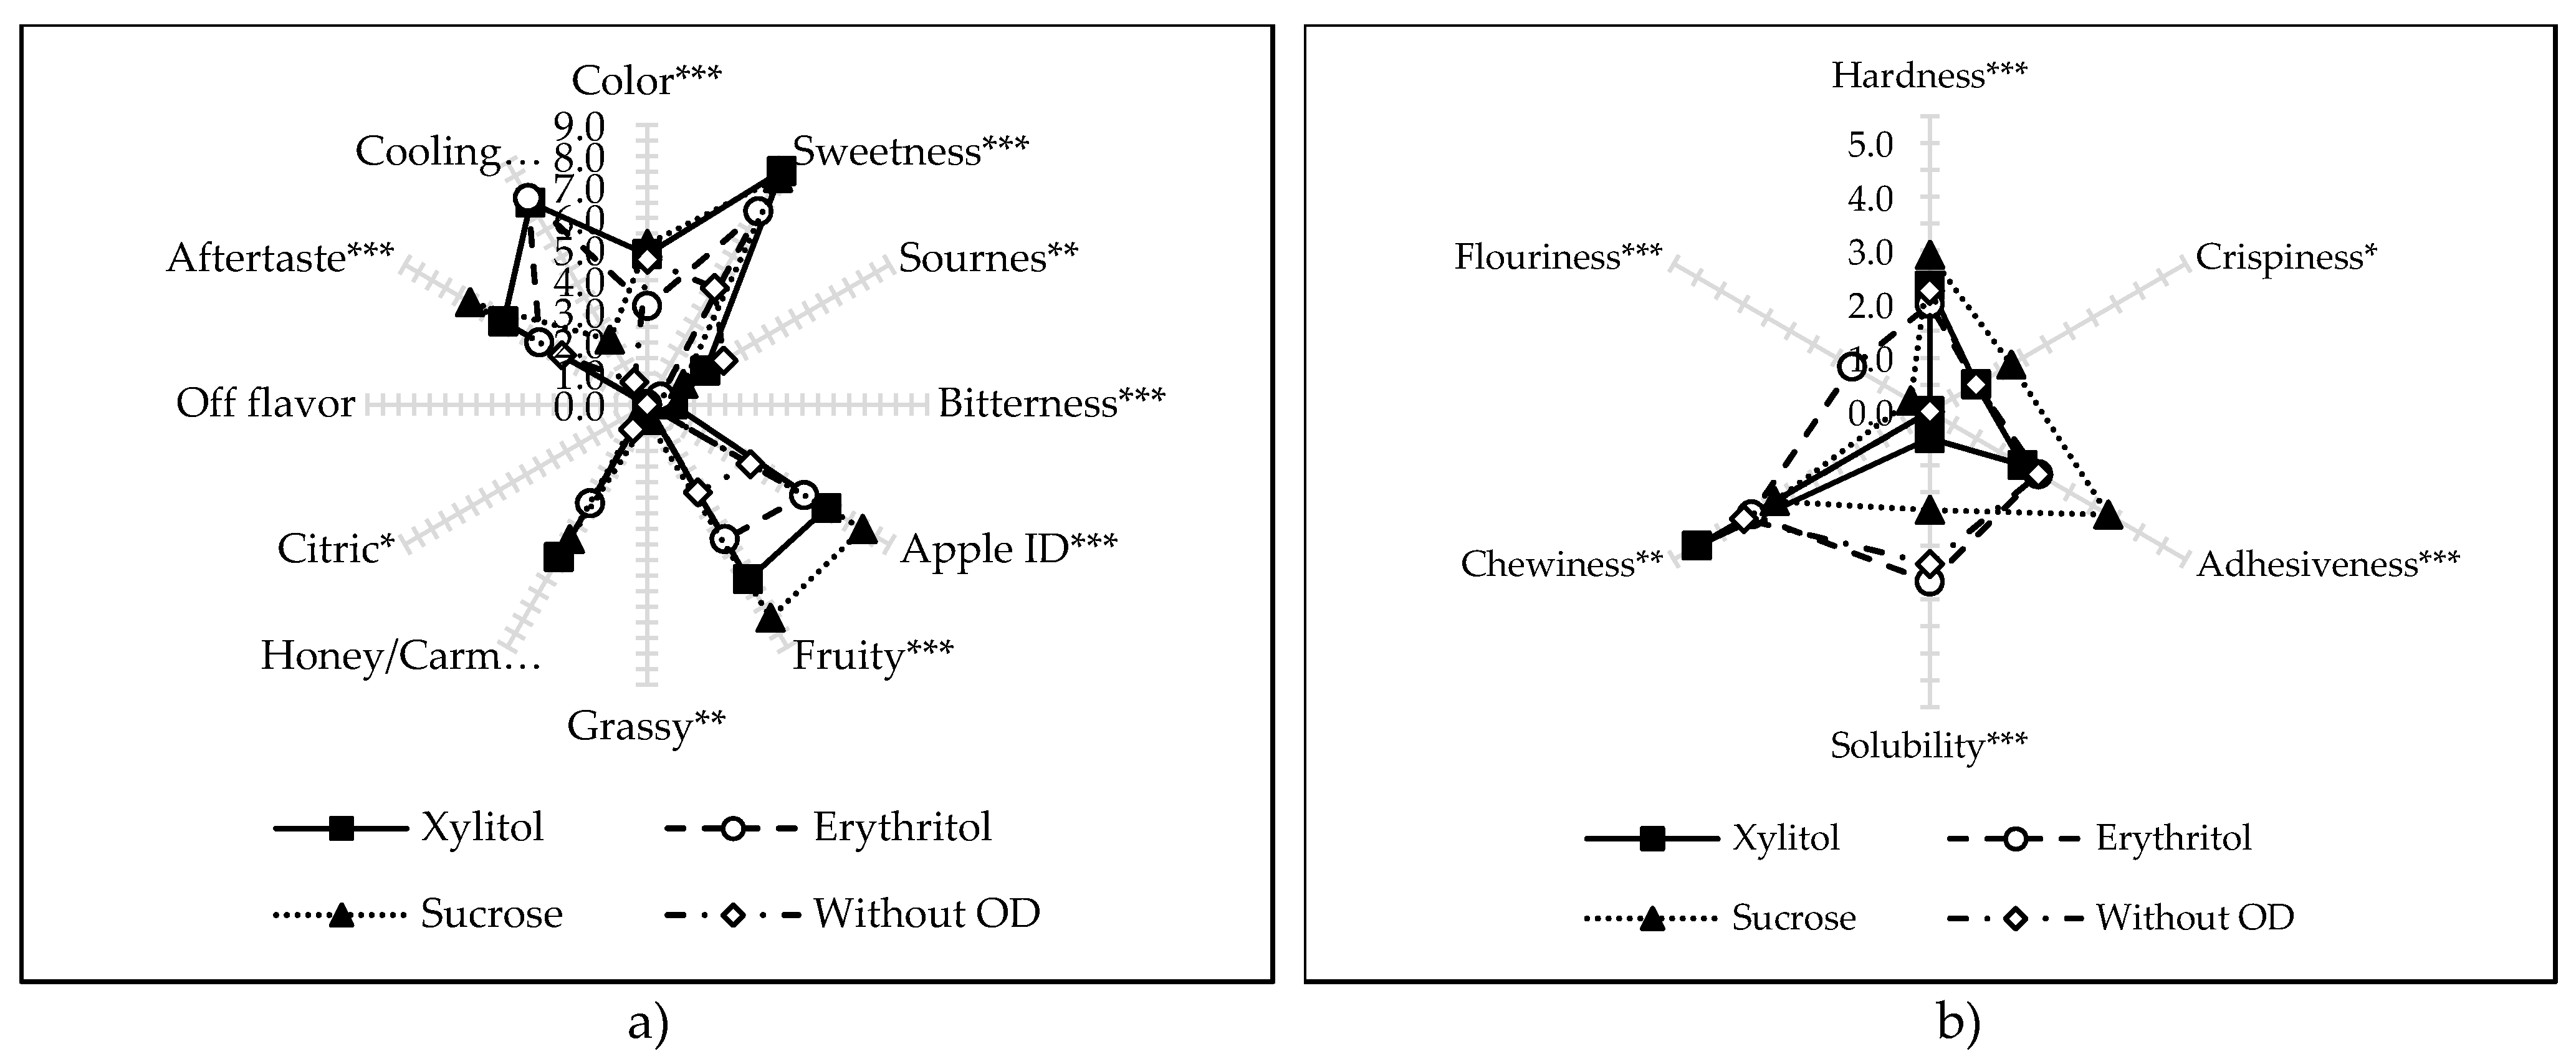
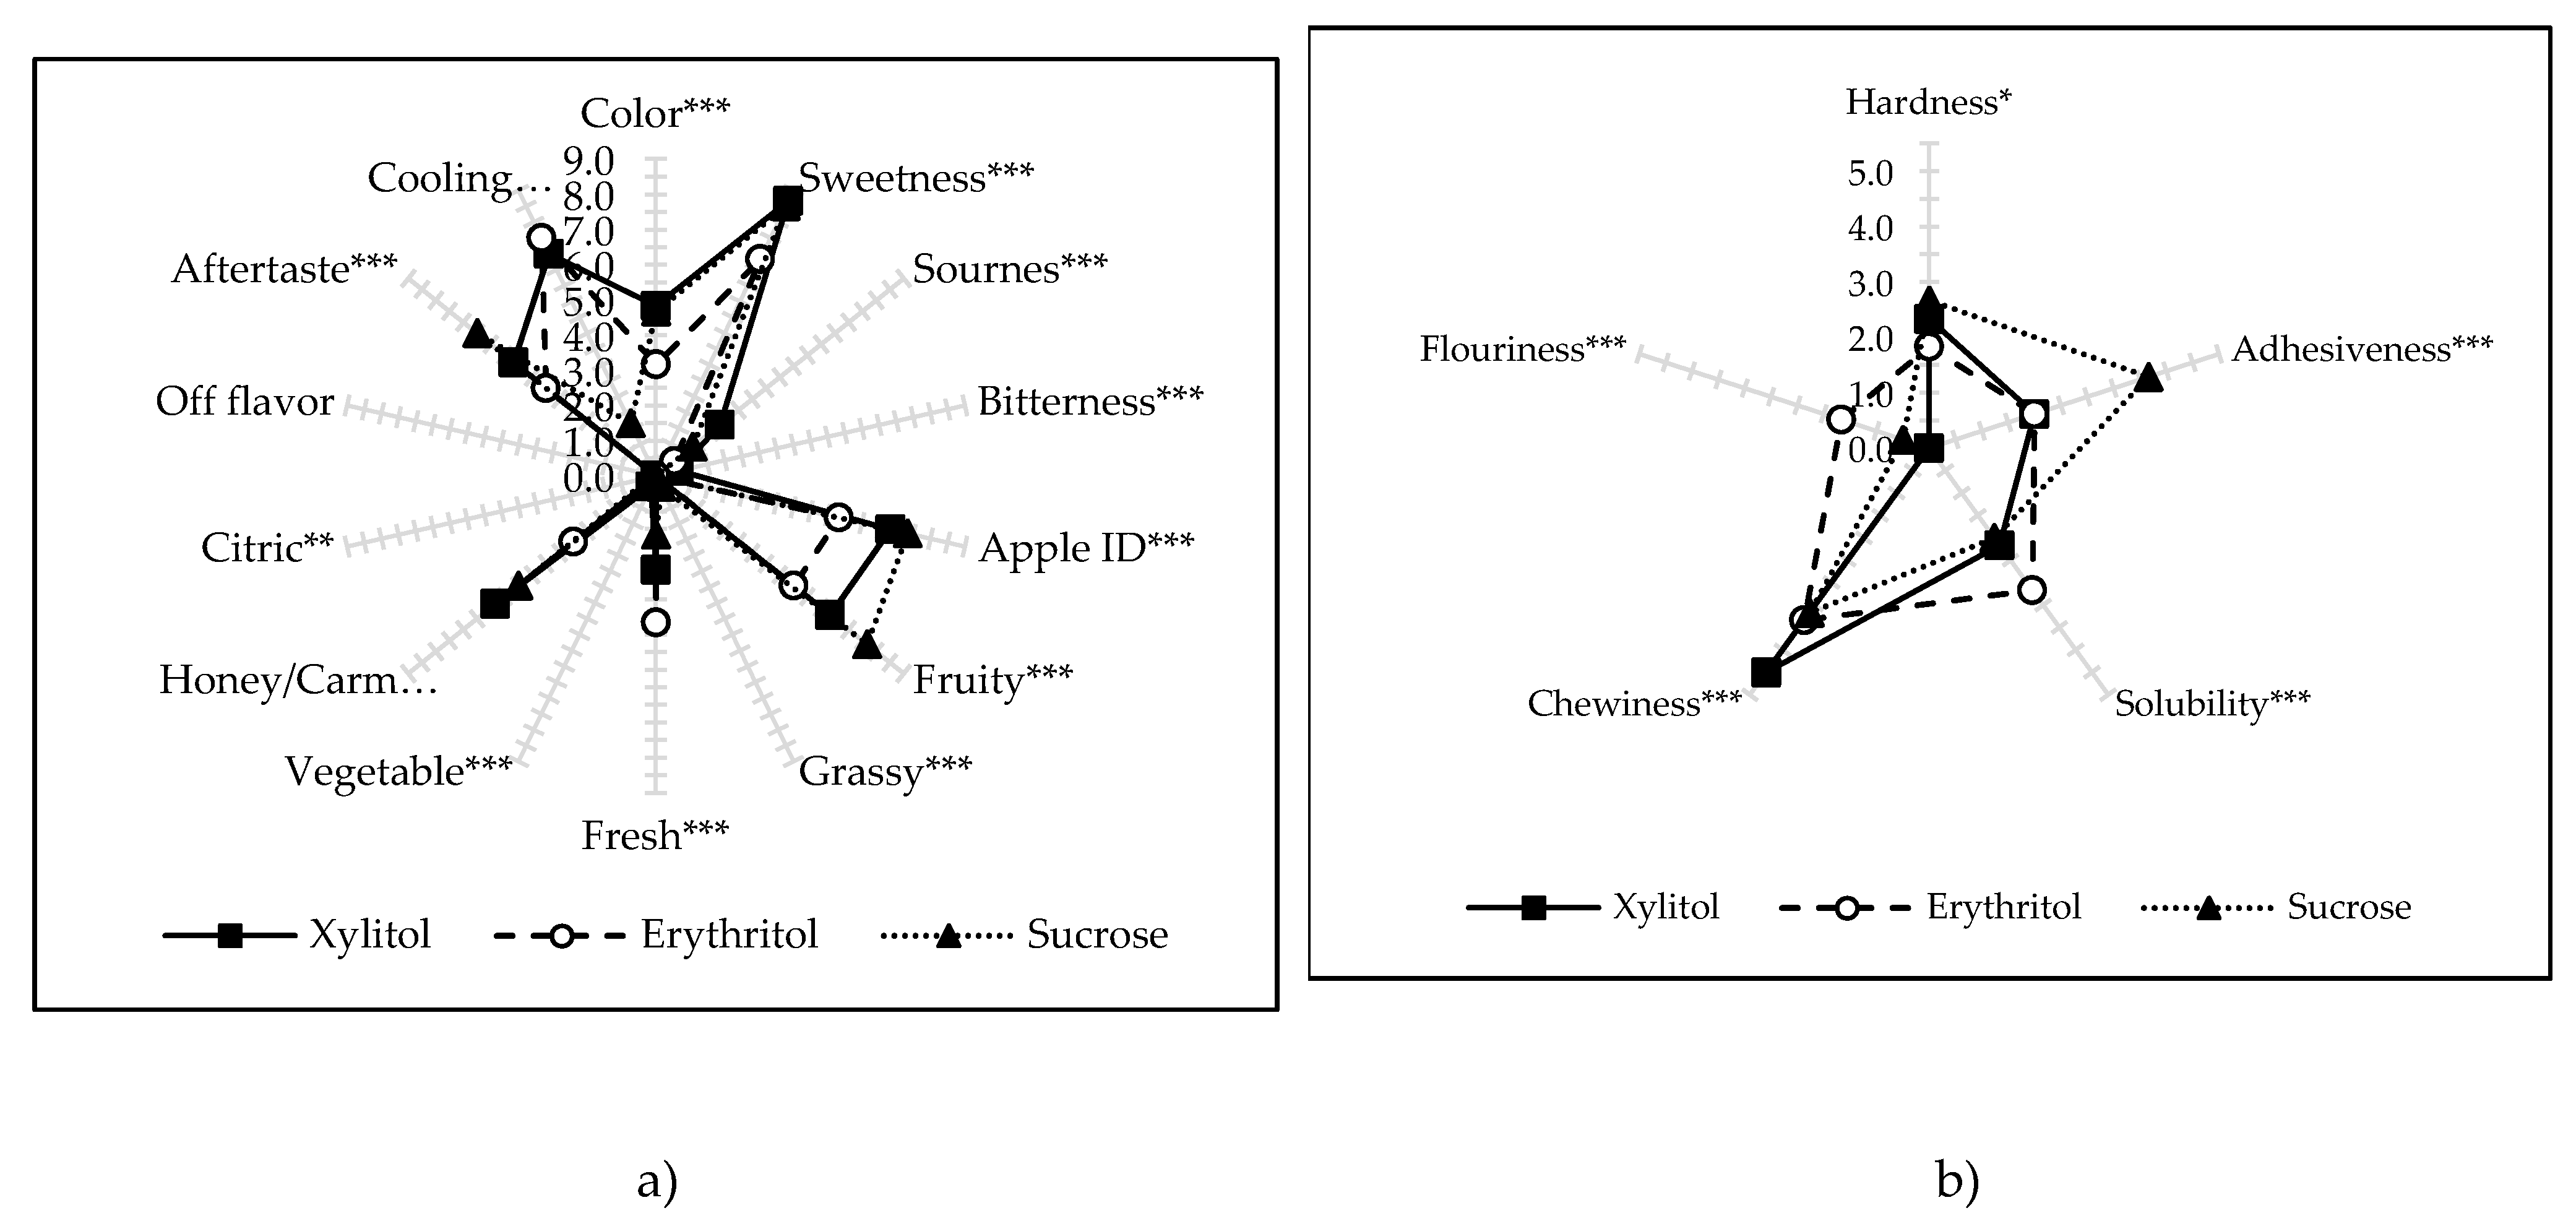
2.7. Descriptive Sensory Analysis (DSA)

Table S1 presents selected qualitative factors of the analyzed dried apple, due to the type of osmotic substance used before drying. Figure 6 only depicts descriptors that were considered statistically significant. There were no statistically significant differences between the values of sensory attributes between samples obtained by different drying methods; therefore, their values were not given. The only exception is the attribute “Off-flavor”, which was not statistically significant; however, it was placed on the chart because it contains valuable information. All variants of dried apples were characterized by a lack of foreign taste, which included the following aromas: hay, wood, earthy, and burnt.
The lowest intensity of the yellow color was demonstrated by samples that had been dehydrated previously in the erythritol solution (Figure 6a)—the samples were characterized by a clearly lighter color, which was also confirmed in the paragraph with color changes (2.4). Apples subjected to the OD before the drying process showed about twice the sweetness, compared to the untreated dried fruit (Table S1). The sour taste was barely discernible and was mainly noted in the samples without OD and using xylitol. This osmotic substance also influenced the occurrence of bitter taste; however, with a slight intensity (value <1). The most intense aroma, reminiscent of fresh apple (apple ID), as well as the fruity flavor was found in the case of dried apples obtained with the use of sucrose. Grass and lemon aromas were virtually undetectable in the samples, with all values being below one. A fairly intense honey/caramel flavor was noticeable in apples dehydrated in sucrose and xylitol solutions. A two-times bigger aftertaste was observed after consuming dried apples that had been previously osmo-dehydrated in sucrose solution, compared to dried raw material. The use of polyols as osmoactive agents in the production of dried apples enabled an interesting property—the cooling effect felt in the mouth while consuming a snack. A very intense effect was noted in both cases of sugar alcohols (erythritol, xylitol). There were no significant differences in the intensity of this effect between these variants. The occurrence of such an effect has also been documented in the literature [24] and is explained by the presence of high negative heat of the solution after dissolution: erythritol −45 kcal / kg, xylitol: −35 kcal / kg [34]. The texture attributes of the descriptive sensory analysis show the relationship between crispiness and hardness of dried apples—the highest values were observed in the samples containing sucrose (Figure 6b). However, values of crispiness were low (Table S1), which are related with water activity around 0.3. The researchers [18] assumed that in order to be accepted by a consumer, it should be scored at least 6 points on the 10-point scale (which means that dried product must have water activity below 0.2). It was also not surprising to obtain the highest adhesiveness values for dried apples containing sucrose. Control samples, and dehydrated in erythritol solution, showed the highest solubility in saliva. Noticeable chewiness was noted in the case of apples previously dehydrated in xylitol, and significant flouriness of samples in dried products containing erythritol.
The use of pre-treatment in the form of additional ultrasound application has changed some descriptor values of descriptive sensory analysis (Table S2). Fresh, and vegetable aromas, turned out to be statistically significant, while in the crispiness of dried apples obtained using different osmotic agents, no differences were noted. Similarly, to the dried apples not subjected to sonication, a product containing erythritol showed the lightest color. Basic flavors (sweet, sour, bitter) were similarly assessed as in the case of previous dried samples (without the application of ultrasound). Similarly, the most intense fruit flavor (and apple aroma) was noted in the material obtained using sucrose (Figure 7a). The pre-treatment in the form of ultrasound contributed to the appearance of aromas characterized as “fresh” in dried apples, an effect that was the most intense in the case of samples with erythritol. A slightly palpable vegetable aroma was also observed in the samples containing xylitol. No foreign taste was noted in any dried apples variant, also, when sonication was used. The cooling effect of the products containing polyols was still intense, while slightly less noticeable in dried apples osmo-dehydrated in sucrose solution. The texture attributes of the descriptive sensory analysis were evaluated similarly to the material obtained without sonication. The only difference was in increasing the value of solubility in saliva, in dried apples previously dehydrated in xylitol, subjected to ultrasound (Figure 7b).
In addition, sonication influenced the diversity of the values of sensory attributes in terms of the drying method used, and mutual interactions between factors, osmotic substance-drying method. For this reason, Table S3 is additionally attached, showing the same sensory attributes due to the drying method used. Still, a small number of descriptors was statistically significant, that is why Figure 8 combines sensory attributes from different groups (appearance, aroma, texture) on one radar chart. The lightest color appeared in dried samples obtained by the combined method (CD/VM), while the most intense were the dried apples obtained by the microwave-vacuum method (VM). The feeling of a sweet and bitter taste did not depend on the drying method used, while the bitter taste was more intensively felt in the case of convective dried apples (CD). At the same time, this material was characterized by the greatest similarity of the aroma to the classic apple flavor (apple ID) and characterized as fruit flavor (Figure 8). It is also worth noting that the occurrence of the cooling effect was only affected by the type of osmotic substance (sugar alcohols) used, whereas the drying method did not significantly change these values. Dried apples obtained by convective and microwave-vacuum methods showed significantly higher solubility and chewiness, compared to dried samples obtained by the combined method (Figure 8).

3. Materials and Methods

3.1. Sample Preparation

Fresh apples of the Elise variety were collected from the Experimental Fields (Orchards) of the Faculty of Horticulture and Landscape Architecture (Warsaw University of Life Sciences, Warshaw, Poland). The fruits were stored at 4 ± 1 °C and relative humidity of 85–90% in a refrigerator until use. Before the experiment, the apples were washed, stoned, and cut into 5 mm thick slices, and then each slice for 4 pieces.

3.2. Pre-Treatment Procedure

Methodics for osmotic dehydration, as well as the optimal process conditions—time and concentration—were selected for testing based on preliminary experiments in a previous work published by Cichowska et al. [7,8]. The 60 g ± 3 g of samples were placed in a 300 mL beaker into syrups in the ratio of 1:4 (fruit:solution) in order to avoid significant changes in the solution concentration. Osmotic solutions were prepared with selected substances from the polyol group (concentration 30%): erythritol and xylitol (Brenntag, Kędzierzyn-Koźle, Poland) as well as sucrose (concentration 50%) dissolved in distilled water. The temperature of the water bath was constant (40 °C). Osmotic dehydration (OD) was conducted for 120 min. Simultaneously, the second experiment was carried out: sonication in osmotic solutions was applied in ultrasonic bath MKD-3 (MKD Ultrasonics, Stary Konik, Poland, internal dimensions: 240 × 140 × 110 mm) for 30 min, at 40 °C and later beakers with samples were transferred to the water bath for additional time of 90 min. During sonication in OD solutions, no significant temperature changes were observed (±1 °C). The frequency used was 21 kHz and the total power generated by sonotrodes was 320 W, which corresponded to the ultrasound intensity of 8 W per gram of material. Afterwards, samples were removed from the osmotic solution, blotted with absorbent paper to remove osmotic liquid from their surface, and were weighed with the accuracy of ±0,01 g. The pre-treatment procedure was conducted one day before drying and stored in the refrigerator at 4 °C. Next day material was transferred quantitatively to the selected drier. After OD, dry matter content of the samples was determined in two repetitions.

3.3. Drying Procedure

Apple slices were subjected to drying with three methods. The first method was hot air convective drying (CD), the second one was vacuum-microwave drying (VM), while the third one was a combination of CD/VM. The apple slices obtained without pre-treatment (OD) and dried with different methods were considered to be control samples. Convective drying was performed in a drier designed and built in the Institute of Agriculture Engineering (Wrocław, Poland). The air temperature and velocity were 70 °C and 0.6 m/s, respectively. The portions of apple samples were spread on a round 100 mm tray in a single layer (the tray was loaded with about 2.55 kg/m2). The tray was placed on the top of a drying pipe. The convective drier, equipped with six pipes, enabled simultaneous drying of six portions. During the drying, the loss of material’s mass was noted using analytical scale (Axis A5000, Radwag, Radom, Poland) as follow: every 5 min during the first half hour, then every 10 min up to two hours, every 15 min up to 4 h, and then every half an hour. The process was stopped after achieving constant weight. The second type of apple samples were dried in the vacuum-microwave drier SM-200 (Plazmatronika, Wrocław, Poland; schematic diagram [5]). The samples were placed in a container made of organic glass with volume of 0.0068 m3. This container was connected to a vacuum system, which consisted of vacuum pump (“BL 30P, Tepro”, Koszalin, Poland), vacuum gauge (“MP 211, Elvac”, Bobolice, Poland), and compensation reservoir with volume of 0.15 m3. The pressure in the container varied from 4 to 6 kPa. The maximum temperature of apple samples was controlled and measured using infrared camera i50 (Flir Systems AB, Stockholm, Sweden), directly after taking out samples from the drier (after 4 min cycles). Simultaneously, the weight of the samples was measured. Two levels of microwave powers were used: 240 W during the first 4 cycles (to attain of the critical temperature of sample in the most warm place: 70 °C); afterward, the power was reduced to 60 W and was used in the next cycles until complete drying of biological material. Together with reducing the power of the microwaves, the rotation of a container was applied, providing mixing of samples and necessary to avoid local over-heating of apple slices while drying. Combined drying CD/VM consisted with convective drying for 2 h and pre-dried samples were additionally dried by VM at 60 W. Each type of drying was conducted in two technological repetitions.

3.4. Mathematical Modeling

Table Curve 2D version 5.01 (SYSTAT Software Inc., Chicago, IL, USA) enabled prediction of moisture ratio (MR) by fitting the mathematical model to experimental points with the possible highest values of the determination coefficient R2 and the lowest values of RMSE. MR was expressed as the ratio of the actual moisture content to the initial moisture content (Equation (3)):
M R = M M 0
where M is the actual moisture content and M0 is the initial moisture content [35].
The value of M0 amounting to about 6.62 g/g d. m was determined gravimetrically, taking into account the mass and dry matter content in a sample after drying in a convective drier (SUP-65 WG WAMED, Warsaw, Poland) at the temperature of 70 °C for 24 h. The values of M were predicted based on M0 and the actual mass of the dried samples. The final moisture content Mf was verified gravimetrically. The mass of samples was measured using an analytical balance XA 60/220X (Radwag, Radom, Poland) with an accuracy of 0.001 g.

3.5. Water Activity

Water activity was determined in dried samples using the device AquaLab CX-2 (Decagon Devices Inc., USA) apparatus, in accordance with the manufacturer’s instruction. The temperature of water activity determination was constant (25 °C). Each measurement was conducted in 4 repetitions.

3.6. Hygroscopicity

Hygroscopic properties, expressed as water vapor adsorption kinetics were determined by weighing the dried material with accuracy up to ± 0.0001 g on analytical scale type AE 204S (METTLER Company, Columbus, Ohio, USA) and then placed in a desiccator over saturated NaCl solution in an environment with aw = 0.75. Kinetics were determined for 72 h at a constant temperature of 25 °C. The samples were re-weighed after 0, 1, 2, 4, 6, 24, 48, 72, and 96 h. The measurement was performed in two repetitions for each kind of apple samples.

3.7. Color Measurement

Color analysis of the surface of the dried samples was determined with the use of Minolta Chroma Meter CR-200 (Minolta Corp., Osaka, Japan). The measurement conditions were: D65 standard illuminate, 2° Standard Observer, measurement diameter: 30 mm. The results were presented using the directly measured parameters: L* (lightness/darkness), a* (red/green), b* (yellow/blue). The measurements were made in 6 repetitions for every sample; the mean values were reported. The total color differences (ΔE – Equation (4)) were calculated according to the following formula:
Δ E = ( Δ L * ) 2 + ( Δ a * ) 2 + ( Δ b * ) 2
where ΔL*, Δa*, Δb* – the change of L*, a*, and b* parameter between raw material and samples after drying.

3.8. Descriptive Sensory Analysis (DSA)

Seven trained panelists (five women and two men) from the Department of Agro-Food Technology (Miguel Hernández University, Orihuela, Spain) participated in this study. The panel was selected and trained following the ISO standard 8586-1 (1993), and it is specialized in descriptive sensory evaluation of fruits and vegetables. The following attributes were chosen on the basis of the lexicon by [36]: (appearance) color; (basic tastes and chemical feelings) sweetness, sourness, bitterness, and astringency; (flavor) apple ID, fruity, grassy, fresh, vegetable, honey/caramel, citric, off-flavors, hay-like, earthy, woody, burnt, aftertaste, cooling effect; (texture) hardness, crispiness, adhesiveness, solubility in saliva, chewiness, and flouriness. The panel used a numerical scale for quantifying the intensity of the dried apples attributes where 0 represents none and 10 extremely strong with 0.5 increments. The samples were served into odor-free, disposable 90 mL covered plastic cups, at room temperature, and were coded using three-digit numbers. Unsalted crackers and distilled water were provided to panelists to clean their palates between samples.

3.9. Selected Chemical Analysis

Total protein content (N × 6.25) was determined by the Kjeldahl method according to PN-A-04018:1975. Total ash content was determined by the weight method according to PN-A-75101/08:1990, pkt. 2 (Test Report No 21/ZO/2019 dated 09.01.2019) in the Laboratory of Physicochemical and Sensorial Quality of Department of Fruit and Vegetable Product Technology, Warsaw, Poland. Total fat content was determined by titration-extraction method (Soxhlet) according to modification of PN-A-79011-4:1998. Total dietary fiber content was determined by the weight method (after enzymatic hydrolysis), according to AOAC 991.43, AACC 33-07, using Fibertec E Apparatus by FOSS. Total carbohydrate content was calculated from the difference based on the results of moisture, total protein, total ash, total polyols, and total dietary fiber content. Sugar content (fructose, glucose, and sucrose) and polyols content (xylitol, sorbitol, and erythritol) was determined by the HPLC-RID (High Performance Liquid Chromatography – Refractive Index Detectors) method, according to PN-EN 12630:2002 in the Technological Laboratory of Department of Fruit and Vegetable Product Technology, Warsaw, Poland. Sodium content was determined by flame atomic emission spectrometry (FAES) according to procedure *PB-ZA 01 ed. 5 dated 15.03.2016 (Test Report No 18/ZA/2019 dated 17.01.2019) in the Department of Food Analysis, Prof. Wacław Dąbrowski Institute of Agricultural and Food Biotechnology, Warsaw, Poland. Energy value was calculated based on amount of energy contained in: protein, fat, carbohydrates, polyols, and fiber, according to Regulation (EU) No 1169/2011 of the European Parliament and of The Council of 25 October 2011. The results represent the means of two independent determinations.

3.10. Statistical Analysis

The statistical software Statgraphics Plus ver. 5.1 (StatPoint) and Excel 2016 (Microsoft) were used for data analysis. The influence of pre-treatment (type of osmotic solution, application of ultrasound) as well as method of drying on dependent variables: (WC, aw, hygroscopic properties, color changes) was evaluated by means of a multifactorial analysis of variance (ANOVA) at a significance level α = 0.05. In the case of significant associations, a post-hoc Tukey’s test was performed. In the cases of samples of dried apples, which were selected for chemical and sensory analysis, one-factor (samples) analysis of variance was performed using Statgraphics Plus 5.0 software, whereas post-hoc mean separation was conducted using a Tukey’s multiple range test. Pearson’s correlation coefficient between water activity and moisture content was calculated. The t-Test between non-US vs. US values was also performed.

4. Conclusions

The microwave-vacuum drying method allowed for the shortest drying time of dehydrated apples, amounting to 76 min; moreover, the additional application of ultrasounds reduced this time to 36 min. The most popular convective drying was long-lasting; indeed, additional sonication during osmotic dehydration affected the extension of the process time. The combined drying method allowed the total duration of the process to be reduced several times. The use of sugar alcohols (xylitol, erythritol) in the production of dried apples did not badly affect the taste of the obtained dried products. The foreign taste (off-flavor), including the aromas of hay, wood, earthy, and burnt, was imperceptible in all dried samples. The use of polyols as osmoactive agents in the osmotic dehydration process as pre-treatment enabled to obtain a noticeable cooling/refreshing effect felt in the mouth while consuming a snack. The drying method did not have a significant impact on the perception of the intensity of this effect. Additional sonication during osmotic dehydration did not significantly affect attributes of the descriptive sensory analysis for the obtained dried apples. The use of sugar alcohols (xylitol and erythritol) enabled the production of dried snacks with lower calorific value, compared to dried apples obtained by the same method without initial osmotic dehydration. Polyol residues in the product were at a level that guaranteed consumer safety, understood as not exceeding the dose resulting in gastric problems. The best hygroscopic properties, ensuring the storage stability of the dried product, due to the low ability to absorb water from the environment, was observed in dried apples that were previously osmo-dehydrated in erythritol and sucrose solutions.

Supplementary Materials

Table S1: Attributes of descriptive sensory analysis of dried apples dehydrated (or not) without the application of ultrasound depending on the osmotic substance used, Table S2: Attributes of descriptive sensory analysis of dried apples dehydrated with the application of ultrasound depending on the osmotic substance used, Table S3: Attributes of descriptive sensory analysis of dried apples dehydrated with the application of ultrasound depending on the drying method used.

Author Contributions

Conceptualization, J.C.-B. and D.W.-R.; methodology, D.W.-R. and A.F.; software, J.C.-B. and A.F.; validation, D.W.-R., A.A.C.-B. and A.F.; formal analysis, J.C.-B.; investigation, J.C.-B. and M.P.; sensory analysis, A.A.C.-B.; resources, J.C.-B.; data curation, J.C.-B. and A.A.C.-B.; writing—original draft preparation, J.C.-B.; writing—review and editing, J.C.-B., D.W.-R and A.F.; visualization, J.C.-B.; supervision, D.W.-R. and A.F.; project administration, J.C.-B. All authors have read and agreed to the published version of the manuscript.

Funding

This research received no external funding.

Conflicts of Interest

The authors declare no conflict of interest. The funders had no role in the design of the study; in the collection, analyses, or interpretation of data; in the writing of the manuscript, or in the decision to publish the results.

Abbreviations

ODosmotic dehydration
USultrasound
CDconvective drying
VMvacuum-microwave drying
CD/VMcombined drying (convective-vacuum-microwave drying)

Appendix A

Table A1. Nomenclature.
NoSample CodeDrying MethodType of Hypertonic SolutionSonication
1.XCDCDXylitol
2.XVMVMXylitol
3.XCD/VMCD/VMXylitol
4.ECDCDErythritol
5.EVMVMErythritol
6.ECD/VMCD/VMErythritol
7.SCDCDSucrose
8.SVMVMSucrose
9.SCD/VMCD/VMSucrose
10.RCDCDWithout OD
11.RVMVMWithout OD
12.RCD/VMCD/VMWithout OD
13.XCD_USCDXylitol+
14.XVM_USVMXylitol
15.XCD/VM_USCD/VMXylitol
16.ECD_USCDErythritol+
17.EVM_USVMErythritol
18.ECD/VM_USCD/VMErythritol
19.SCD_USCDSucrose+
20.SVM_USVMSucrose
21.SCD/VM_USCD/VMSucrose

References

  1. Sinha, N.K. Apple: Production, Chemistry, and Processing. In Handbook of Food Products Manufacturing; Hui, Y.H., Ed.; John Wiley & Sons, Ltd.: Hoboken, NJ, USA, 2007; pp. 773–791. [Google Scholar]
  2. de la Fuente-Blanco, S.; Riera-Franco de Sarabia, E.; Acosta-Aparicio, V.M.; Blanco-Blanco, A.; Gallego-Juarez, J.A. Food drying process by power ultrasound. Ultrasonics 2006, 44, 523–527. [Google Scholar] [CrossRef] [PubMed]
  3. Schössler, K.; Jäger, H.; Knorr, D. Effect of continuous and intermittent ultrasound on drying time and effective diffusivity during convective drying of apple and red bell pepper. J. Food Eng. 2012, 108, 103–110. [Google Scholar] [CrossRef]
  4. Wojdyło, A.; Figiel, A.; Oszmiański, J. Effect of Drying Methods with the Application of Vacuum Microwaves on the Bioactive Compounds, Color, and Antioxidant Activity of Strawberry Fruits. J. Agric. Food Chem. 2009, 57, 1337–1343. [Google Scholar] [CrossRef] [PubMed]
  5. Chong, C.H.; Figiel, A.; Law, C.L.; Wojdyło, A. Combined Drying of Apple Cubes by Using of Heat Pump, Vacuum-Microwave, and Intermittent Techniques. Food Bioprocess. Technol. 2014, 7, 975–989. [Google Scholar] [CrossRef] [Green Version]
  6. Ramya, V.; Jain, N.K. A Review on Osmotic Dehydration of Fruits and Vegetables: An Integrated Approach. J. Food Process. Eng. 2017, 40, e12440. [Google Scholar] [CrossRef]
  7. Cichowska, J.; Figiel, A.; Stasiak-Różańska, L.; Witrowa-Rajchert, D. Modeling of Osmotic Dehydration of Apples in Sugar Alcohols and Dihydroxyacetone (DHA) Solutions. Foods 2019, 8, 20. [Google Scholar] [CrossRef] [Green Version]
  8. Cichowska, J.; Witrowa-Rajchert, D.; Stasiak-Rózánska, L.; Figiel, A. Ultrasound-assisted osmotic dehydration of apples in polyols and dihydroxyacetone (DHA) solutions. Molecules 2019, 24, 3429. [Google Scholar] [CrossRef] [Green Version]
  9. Mierzwa, D.; Kowalski, S.J. Ultrasound-assisted osmotic dehydration and convective drying of apples: Process kinetics and quality issues. Chem. Process. Eng. - Inz. Chem. i Proces. 2016, 37, 383–391. [Google Scholar] [CrossRef]
  10. Fijalkowska, A.; Nowacka, M.; Witrowa-Rajchert, D. The physical, optical and reconstitution properties of apples subjected to ultrasound before drying. Ital. J. Food Sci. 2017, 29, 343–356. [Google Scholar]
  11. Fernandes, F.A.N.; Gallão, M.I.; Rodrigues, S. Effect of osmotic dehydration and ultrasound pre-treatment on cell structure: Melon dehydration. LWT - Food Sci. Technol. 2008, 41, 604–610. [Google Scholar] [CrossRef]
  12. Figiel, A. Drying kinetics and quality of beetroots dehydrated by combination of convective and vacuum-microwave methods. J. Food Eng. 2010, 98, 461–470. [Google Scholar] [CrossRef]
  13. Figiel, A.; Michalska, A. Overall quality of fruits and vegetables products affected by the drying processes with the assistance of vacuum-microwaves. Int. J. Mol. Sci. 2017, 18, 71. [Google Scholar] [CrossRef] [PubMed] [Green Version]
  14. Figiel, A. Dehydration of Apples By a Combination of Convective and Vacuum-Microwave Drying. Pol. J. Food Nutr. Sci. 2007, 57, 131–135. [Google Scholar]
  15. Calín-Sánchez, Á.; Lech, K.; Szumny, A.; Figiel, A.; Carbonell-Barrachina, A.A. Volatile composition of sweet basil essential oil (Ocimum basilicum L.) as affected by drying method. Food Res. Int. 2012, 48, 217–225. [Google Scholar] [CrossRef]
  16. Wiktor, A.; Gondek, E.; Jakubczyk, E.; Dadan, M.; Nowacka, M.; Rybak, K.; Witrowa-Rajchert, D. Acoustic and mechanical properties of carrot tissue treated by pulsed electric field, ultrasound and combination of both. J. Food Eng. 2018, 238, 12–21. [Google Scholar] [CrossRef]
  17. Witrowa-Rajchert, D.; Fabisiak, A.; Stawczyk, J.; Li, S. Wpływ metody suszenia i temperatury procesu na właściwości higroskopijne suszu jabłkowego. Inżynieria Rol. 2006, 7, 457–463. [Google Scholar]
  18. Konopacka, D.; Plocharski, W.; Beveridge, T. Water sorption and crispness of fat-free apple chips. J. Food Sci. 2002, 67, 87–92. [Google Scholar] [CrossRef]
  19. Nowacka, M.; Witrowa-Rajchert, D. Changes of hygroscopic properties of dried apples during storage condition. Acta Agrophysica 2010, 15, 359–370. [Google Scholar]
  20. Fijalkowska, A.; Nowacka, M.; Wiktor, A.; Sledz, M.; Witrowa-Rajchert, D. Ultrasound as a Pretreatment Method to Improve Drying Kinetics and Sensory Properties of Dried Apple. J. Food Process. Eng. 2016, 39, 256–265. [Google Scholar] [CrossRef]
  21. Calín-Sánchez, Á.; Kharaghani, A.; Lech, K.; Figiel, A.; Carbonell-Barrachina, A.A.; Tsotsas, E. Drying Kinetics and Microstructural and SensoryProperties of Black Chokeberry (Aronia melanocarpa) as Affected by Drying Method. Food Bioprocess. Technol. 2015, 8, 63–74. [Google Scholar] [CrossRef]
  22. Cichowska, J.; Woźniak, Ł; Figiel, A.; Witrowa-Rajchert, D. The Influence of Osmotic Dehydration in Polyols Solutions on Sugar Profiles and Color Changes of Apple Tissue. Period. Polytech. Chem. Eng. 2019, 1–9. [Google Scholar] [CrossRef] [Green Version]
  23. Tetzloff, W.; Dauchy, F.; Medimagh, S.; Carr, D.; Bar, A. Tolerance to Subchronic, High-Dose Ingestion of Erythritol in Human Volunteers. Regul. Toxicol. Pharmacol. 1996, 24, S286–S295. [Google Scholar] [CrossRef] [PubMed]
  24. Grembecka, M. Sugar alcohols — their role in the modern world of sweeteners: A review. Eur. Food Res. Technol. 2015, 241, 1–14. [Google Scholar] [CrossRef] [Green Version]
  25. EFSA Panel on Dietetic Products N and A (NDA) Scientific Opinion on the substantiation of health claims related to the sugar replacers xylitol, sorbitol, mannitol, maltitol, lactitol, isomalt, erythritol, D-tagatose, isomaltulose, sucralose and polydextrose and maintenance of tooth mineralisation by decreasing tooth demineralisation. EFSA Journal 2011, 9, 2076.
  26. Grembecka, M. Sugar Alcohols as Sugar Substitutes in Food Industry. In Sweeteners; Springer International Publishing: Cham, Switzerland, 2016; pp. 1–27. [Google Scholar]
  27. Oku, T.; Okazaki, M. Laxative threshold of sugar alcohol erythritol in human subjects. Nutr. Res. 1996, 16, 577–589. [Google Scholar] [CrossRef]
  28. Bornet, F.R.J.; Blayo, A.; Dauchy, F.; Slama, G. Gastrointestinal Response and Plasma and Urine Determinations in Human Subjects Given Erythritol. Regul. Toxicol. Pharmacol. 1996, 24, 296–302. [Google Scholar] [CrossRef] [Green Version]
  29. Storey, D.; Lee, A.; Bornet, F.; Brouns, F. Gastrointestinal tolerance of erythritol and xylitol ingested in a liquid. Eur. J. Clin. Nutr. 2007, 61, 349–354. [Google Scholar] [CrossRef]
  30. Culbert, S.J.; Wang, Y.M.; Fritsche, H.A.; Carr, D.; Lantin, E.; van Eys, J. Oral xylitol in American adults. Nutr. Res. 1986, 6, 913–922. [Google Scholar] [CrossRef]
  31. Lee, B.D.; Park, M.K. Effects and Safety of Xylitol on Middle Ear Epithelial Cells. J. Int. Adv. Otol. 2014, 10, 19–24. [Google Scholar] [CrossRef]
  32. Wang, Y.M.; van Eys, J. Nutritional Significance of Fructose and Sugar Alcohols. Annu. Rev. Nutr. 1981, 1, 437–475. [Google Scholar] [CrossRef]
  33. Oku, T.; Nakamura, S. Threshold for Transitory Diarrhea Induced by Ingestion of Xylitol and Lactitol in Young Male and Female Adults. J. Nutr. Sci. Vitaminol. 2007, 53, 13–20. [Google Scholar] [CrossRef] [PubMed]
  34. de Cock, P.E. Erythritol. In Sweeteners and Sugar Alternatives in Food Technology; Donnell, K.O., Kearsley, M.W., Eds.; Black Well Publishing: Hoboken, NJ, USA, 2012; pp. 215–242. [Google Scholar]
  35. Lech, K.; Figiel, A.; Wojdyło, A.; Korzeniowska, M.; Serowik, M.; Szarycz, M. Drying Kinetics and Bioactivity of Beetroot Slices Pretreated in Concentrated Chokeberry Juice and Dried with Vacuum Microwaves. Dry. Technol. 2015, 33, 1644–1653. [Google Scholar] [CrossRef]
  36. Vázquez-Araújo, L.; Nuncio-Jáuregui, P.N.; Cherdchu, P.; Hernandez, F.; Chambers, E.; Carbonell-Barrachina, A.A. Physicochemical and descriptive sensory characterization of Spanish pomegranates: Aptitudes for processing and fresh consumption. Int. J. Food Sci. Technol. 2013, 49, 1663–1672. [Google Scholar] [CrossRef]
Sample Availability: Samples of the osmotic agents: erythritol, xylitol, sucrose are available from the authors.
Figure 1. Drying kinetics of apple samples by the convective method (CD), previously osmo-dehydrated in erythritol (blue line), xylitol (green line), sucrose (red line), and without osmotic dehydration (OD) (black line), without application of ultrasound (a) or with ultrasound (US) pre-treatment (b). Parameters of drying models and statistical values of root-mean-square error (RMSE) and R2 are presented in Table 1.
Molecules 25 01078 g001
Figure 2. Drying kinetics of apple samples by the microwave-vacuum method (VM), previously osmo-dehydrated in erythritol (blue line), xylitol (green line), sucrose (red line), and without OD (black line), without application of ultrasound (a) or with US pre-treatment (b). Parameters of drying models and statistical values of RMSE and R2 are presented in Table 1.
Molecules 25 01078 g002
Figure 3. Drying kinetics of apple samples by the combined method (CD/VM), previously osmo-dehydrated in erythritol (blue line), xylitol (green line), sucrose (red line), and without OD (black line), without application of ultrasound (a) or with US pre-treatment (b). Solid lines are model of convective pre-drying; dashed lines are model of microwave-vacuum finish drying. Parameters of drying models and statistical values of RMSE and R2 are presented in Table 1.
Molecules 25 01078 g003
Figure 4. Water adsorption kinetics of dried apples obtained by different drying methods (CD—solid lines, VM—dashed line, CD/VM— dotted line), previously osmo-dehydrated in erythritol (blue lines), xylitol (green lines), sucrose (red lines), and without OD (black lines), without application of ultrasound (a) or with US pre-treatment (b).
Molecules 25 01078 g004
Figure 5. Water adsorption rate of dried apples obtained by different drying methods (CD—solid lines, VM—dashed line, CD/VM—dotted line), previously osmo-dehydrated in erythritol (blue lines), xylitol (green lines), sucrose (red lines), and without OD (black lines), without application of ultrasound (a) or with US pre-treatment (b).
Molecules 25 01078 g005
Figure 6. Descriptive sensory analysis of dried apples previously osmo-dehydrated in different solutions (or without OD): attributes for appearance, basic taste, and flavor (a), texture attributes (b). *, ** and *** -- significant at p < 0.05, 0.01, and 0.001, respectively.
Molecules 25 01078 g006
Figure 7. Descriptive sensory analysis of dried apples previously osmo-dehydrated in different solutions with ultrasound pre-treatment: attributes for appearance, basic taste, and flavor (a), texture attributes (b). *, ** and *** -- significant at p < 0.05, 0.01, and 0.001, respectively.
Molecules 25 01078 g007
Figure 8. Descriptive sensory analysis of dried apples previously osmo-dehydrated in different solutions with ultrasound pre-treatment for appearance, basic taste, flavor, and texture attributes. *, ** and *** -- significant at p < 0.05, 0.01, and 0.001, respectively.
Molecules 25 01078 g008
Table 1. Values of the parameters b1, k1, b2, k2, R2, and RMSE of the functions describe the drying kinetics, as well as total drying time of apple samples dried by different methods.
Sample CodeModelb1k1b2k2R2RMSEDrying Time [min]
Non-US
Erythritol
CDtwo-term exponential0.83040.02510.16580.00640.99980.0037405
VMtwo-term exponential0.58570.13730.43810.13730.98870.034576
CD/VMtwo-term exponential0.05490.16650.02630.00930.99920.0090184
Xylitol
CDtwo-term exponential0.56700.03160.44860.03190.99900.0093315
VMtwo-term exponential0.59600.11720.43210.11720.98930.034276
CD/VMtwo-term exponential0.01900.01440.01900.01250.89530.0018184
Sucrose
CDtwo-term exponential0.97790.03760.02560.00220.99970.0048375
VMtwo-term exponential0.64670.13750.37070.13730.99130.030876
CD/VMtwo-term exponential0.03050.10180.04980.00840.99770.0005184
Without ODtwo-term exponential0.38430.09400.66280.09390.98690.037884
CDtwo-term exponential0.34110.02550.70590.02570.99360.0255345
VM
CD/VMHenderson–Pabis0.02210.02110.91130.0016168
US
Erythritol
CDtwo-term exponential0.92620.03190.07860.00110.99970.0045615
VMtwo-term exponential1.00970.13890.01640.00010.98930.032136
CD/VMtwo-term exponential−0.29430.03990.34520.03990.94430.0063140
Xylitol
CDtwo-term exponential1.01150.03190.0134−0.00070.99860.0103465
VMtwo-term exponential0.99300.12250.05100.12300.97850.044736
CD/VMHenderson-Pabis0.08100.0298--0.98680.0025168
Sucrose
CDtwo-term exponential0.95130.02530.03900.00240.99960.0054615
VMtwo-term exponential0.99080.16570.02560.00010.98900.027732
CD/VMtwo-term exponential0.05480.04980.03940.00000.98950.0011136
US – osmotic dehydration with ultrasound pre-treatment, Non-US – osmotic dehydration without ultrasound pre-treatment, CD – convective drying, VM – vacuum-microwave drying, CD/VM – combined drying (convective-vacuum-microwave drying).
Table 2. Dry matter and water activity in dried apple samples. Means within one column with a different letter superscript are significantly different – homogeneous groups (p < 0.05). Lowercase (a,b and c)—factor: osmotic substance/without OD, among the same drying method; uppercase (A,B and C) – factor: drying method, among the same osmotic substance).
Dry matter [%]Water Activity [-]
Non-USUSNon-USUS
Erythritol
CD96.37 ± 0.19 c, A95.37 ± 0.04 b, A0.296 ± 0.00 a, B0.316 ± 0.01 b, A
VM96.92 ± 0.31 d, B93.10 ± 1.20 a, A0.256 ± 0.03 a, A0.404 ± 0.08 a, A
CD/VM96.38 ± 0.32 c, A, B93.95 ± 1.63 b, A0.284 ± 0.01 b, A, B0.342 ± 0.03 b, A
Xylitol
CD95.35 ± 0.18 b, A97.40 ± 0.12 c, A0.298 ± 0.01 a, A0.217 ± 0.04 a, A
VM96.05 ± 0.26 c, A93.62 ± 1.70 a, A0.285 ± 0.00 a, A0.329 ± 0.01 a, B
CD/VM96.56 ± 0.52 b, c, A96.32 ± 1.66 b, A0.295 ± 0.00 a, A0.225 ± 0.01 a, A
Sucrose
CD93.40 ± 0.15 a, A93.34 ± 0.43 a, C0.298 ± 0.01 a, A0.331 ± 0.01 b, A
VM94.75 ± 0.02 b, B91.61 ± 0.24 a, B0.277 ± 0.03 a, A0.345 ± 0.01 a, A
CD/VM94.80 ± 0.16 b, B88.85 ± 0.53 a, A0.289 ± 0.01 b, A0.392 ± 0.01 c, B
Without OD
CD93.74 ± 0.31 a, A0.287 ± 0.01 a, A
VM93.69 ± 0.41 a, A0.288 ± 0.00 a, A
CD/VM93.91 ± 0.47 a, A0.284 ± 0.00 a, b, A
US – osmotic dehydration with ultrasound pre-treatment, Non-US – osmotic dehydration without ultrasound pre-treatment, CD – convective drying, VM – vacuum-microwave drying, CD/VM – combined drying (convective-vacuum-microwave drying).
Table 3. Values of the L * parameter characterizing brightness and absolute color differences (∆E) in dried apple obtained by various methods. Means within one column with a different letter superscript are significantly different – homogeneous groups (p < 0.05). Lowercase (a, b and c) —factor: osmotic substance/without OD, among the same drying method; uppercase (A and B) – factor: drying method, among the same osmotic substance).
L*∆E
Non-USUSNon-USUS
Erythritol
CD80.32 ± 1.57 a, A74.58 ± 2.79 b, A4.79 ± 1.34 a, A14.94 ± 0.59 a, A
VM82.03 ± 2.29 a, A72.15 ± 3.81 a, A2.48 ± 0.33 a, A15.24 ± 2.14 a, A
CD/VM76.93 ± 3.01 a, A75.29 ± 2.72 a, A7.62 ± 1.81 a, A11.07 ± 3.34 a, A
Xylitol
CD79.88 ± 0.95 a, A74.81 ± 1.96 c, A8.01 ± 0.72 a, A18.89 ± 1.04 c, A
VM74.14 ± 0.32 a, A68.62 ± 6.66 a, A12.98 ± 1.81 a, b, A20.09 ± 4.20 a, A
CD/VM77.27 ± 2.70 a, A72.72 ± 3.58 a, A7.66 ± 2.60 a, A15.28 ± 5.97 a, A
Sucrose
CD80.49 ± 0.99 a, A72.55 ± 2.05 a, A9.72 ± 1.71 a, A18.45 ± 2.01 b, A
VM73.42 ± 6.05 a, A70.32 ± 1.73 a, A10.07 ± 5.34 a, b, A17.28 ± 1.43 a, A
CD/VM76.49 ± 3.83 a, A75.64 ± 2.23 a, A9.03 ± 2.02 a, A12.40 ± 6.04 a, A
Without OD
CD84.80 ± 0.31 b, B7.87 ± 1.18 a, A
VM68.90 ± 2.77 a, A20.16 ± 1.31 b, B
CD/VM83.79 ± 0.91 a, B7.71 ± 0.60 a, A
US – osmotic dehydration with ultrasound pre-treatment, Non-US – osmotic dehydration without ultrasound pre-treatment, CD – convective drying, VM – vacuum-microwave drying, CD/VM – combined drying (convective-vacuum-microwave drying).
Table 4. Results of chemical analysis of raw apple tissue, and dried by combined method – previously osmo-dehydrated in erythritol (ECD/VM), xylitol (XCD/VM), sucrose (SCD/VM), without OD (RCD/VM).
ECD/VMXCD/VMSCD/VMRCD/VMRaw Apple
Total protein content (N × 6.25) [g/100 g]1.43 ± 0.09 a1.22 ± 0.03 a1.52 ± 0.04 a, b1.77 ± 0.11 b0.34 ± 0.00
Total ash [g/100 g]0.51 ± 0.00 b0.47 ± 0.01 a0.46 ± 0.00 a0.56 ± 0.01 c0.17 ± 0.00
Total fat [g/100 g]0.33 ± 0.06 a0.36 ± 0.09 a0.25 ± 0.03 a0.33 ± 0.06 a0.06 ± 0.00
Total dietary fiber [g/100 g]6.81 ± 0.30 a7.42 ± 0.08 a7.23 ± 0.01 a8.52 ± 0.08 b1.74 ± 0.03
Total carbohydrates [g/100 g]49.5449.4780.8477.6414.06
Sugars: [g/100 g]46.5548.6578.2877.5612.93
fructose g/100 g]22.32 ± 0.11 b22.46 ± 0.08 b20.38 ± 0.09 a36.04 ± 0.25 c6.86 ± 0.05
glucose [g/100 g]7.39 ± 0.11 b6.22 ± 0.04 a6.20 ± 0.07 a11.06 ± 0.11 c2.32 ± 0.01
sucrose [g/100 g]16.84 ± 0.05 a19.98 ± 0.09 b51.70 ± 0.14 d30.46 ± 0.04 c3.75 ± 0.04
Polyols: [g/100 g]34.85 ± 0.29 c35.79 ± 0.30 c2.05 ± 0.02 a3.33 ± 0.08 b0.68 ± 0.02
Sorbitol + xylitol [g/100 g]2.26 ± 0.04 a35.79 ± 0.30 c2.05 ± 0.02 a3.33 ± 0.08 b0.68 ± 0.02
erythritol [g/100 g]32.59 ± 0.25 b0.00 ± 0.00 a0.00 ± 0.00 a0.00 ± 0.00 a0.00 ± 0.00
Sodium (Na) [mg/kg]16.9 ± 0.14 a19.65 ± 0.21 b19.95 ± 0.35 b17.15 ± 0.49 a2.8 ± 0.14
Energy value [kJ/100 g]225.8306.7351.1345.063.3
Energy value [kcal/100 g]955.51292.31487.81460.8267.7
Means within one row with a different lowercase letters superscript (a, b and c) are significantly different – homogeneous groups (p < 0.05).
Table 5. Summary of product safety calculations containing the following polyols.
ErythritolXylitol
According [23]According [33]According [30,32]According [33]
Adult female 60 kg60 g of erythritol contains in 184 g
of the product → 12 packages
41 g of erythritol contains in 126 g
of the product → 8 packages
100 g of xylitol contains in 279 g
of the product → 18 packages
25 g of xylitol contains in 70 g of
the product → 5 packages
Adult male 75 kg75 g of erythritol contains in 215 g
of the product → 14 packages
35 g of erythritol contains in 107 g
of the product → 7 packages
100 g of xylitol contains in 279 g
of the product → 18 packages
29 g of xylitol contains in 81 g
of the product → 5 packages
10-years girl 30 kg30 g of erythritol contains in 92 g
of the product → 6 packages
20 g of erythritol contains in 61 g
of the product → 4 packages
65 g of xylitol contains in 182 g
of the product → 12 packages
13 g of xylitol contains in 36 g
of the product → 2 packages
10-years boy 30 kg30 g of erythritol contains in 92 g
of the product → 6 packages
14 g of erythritol contains in 43 g
of the product → 3 packages
65 g of xylitol contains in 182 g
of the product → 12 packages
11 g of xylitol contains in 31 g
of the product → 2 packages

