Calculation of the Isobaric Heat Capacities of the Liquid and Solid Phase of Organic Compounds at 298.15K by Means of the Group-Additivity Method


Abstract
1. Introduction
2. Method
3. Sources of Heat-Capacity Data
4. Results
4.1. General Remarks
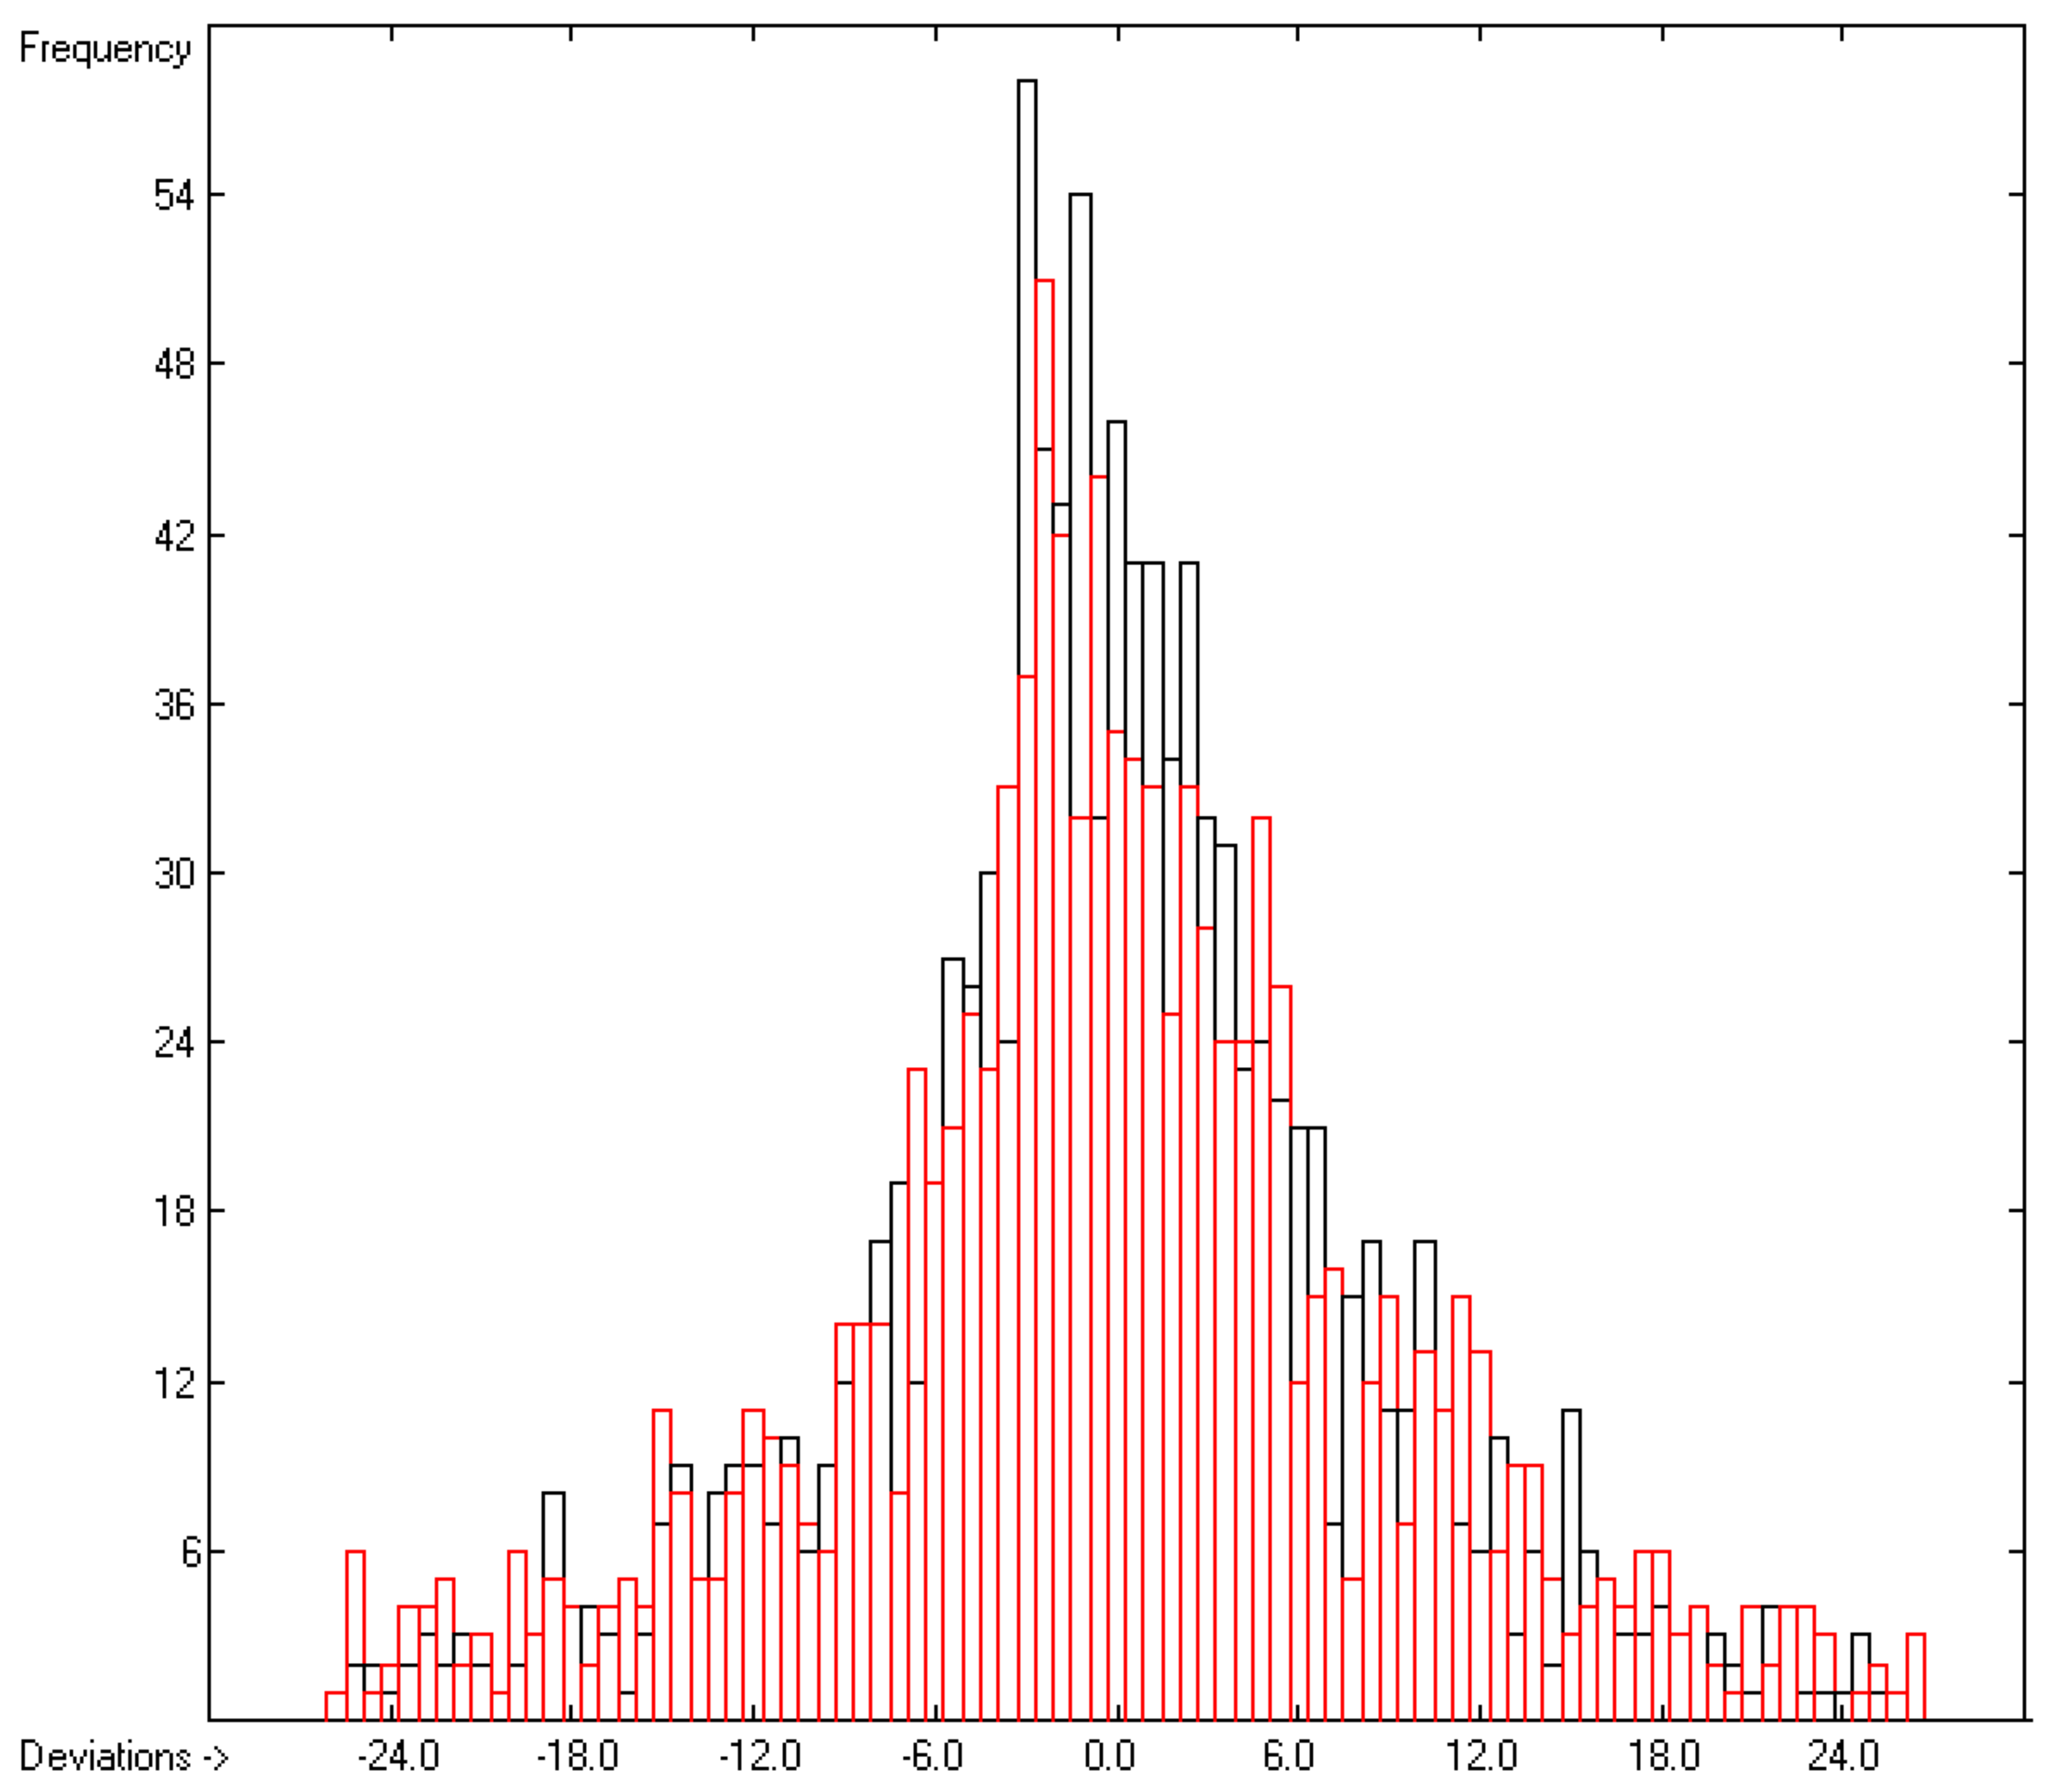
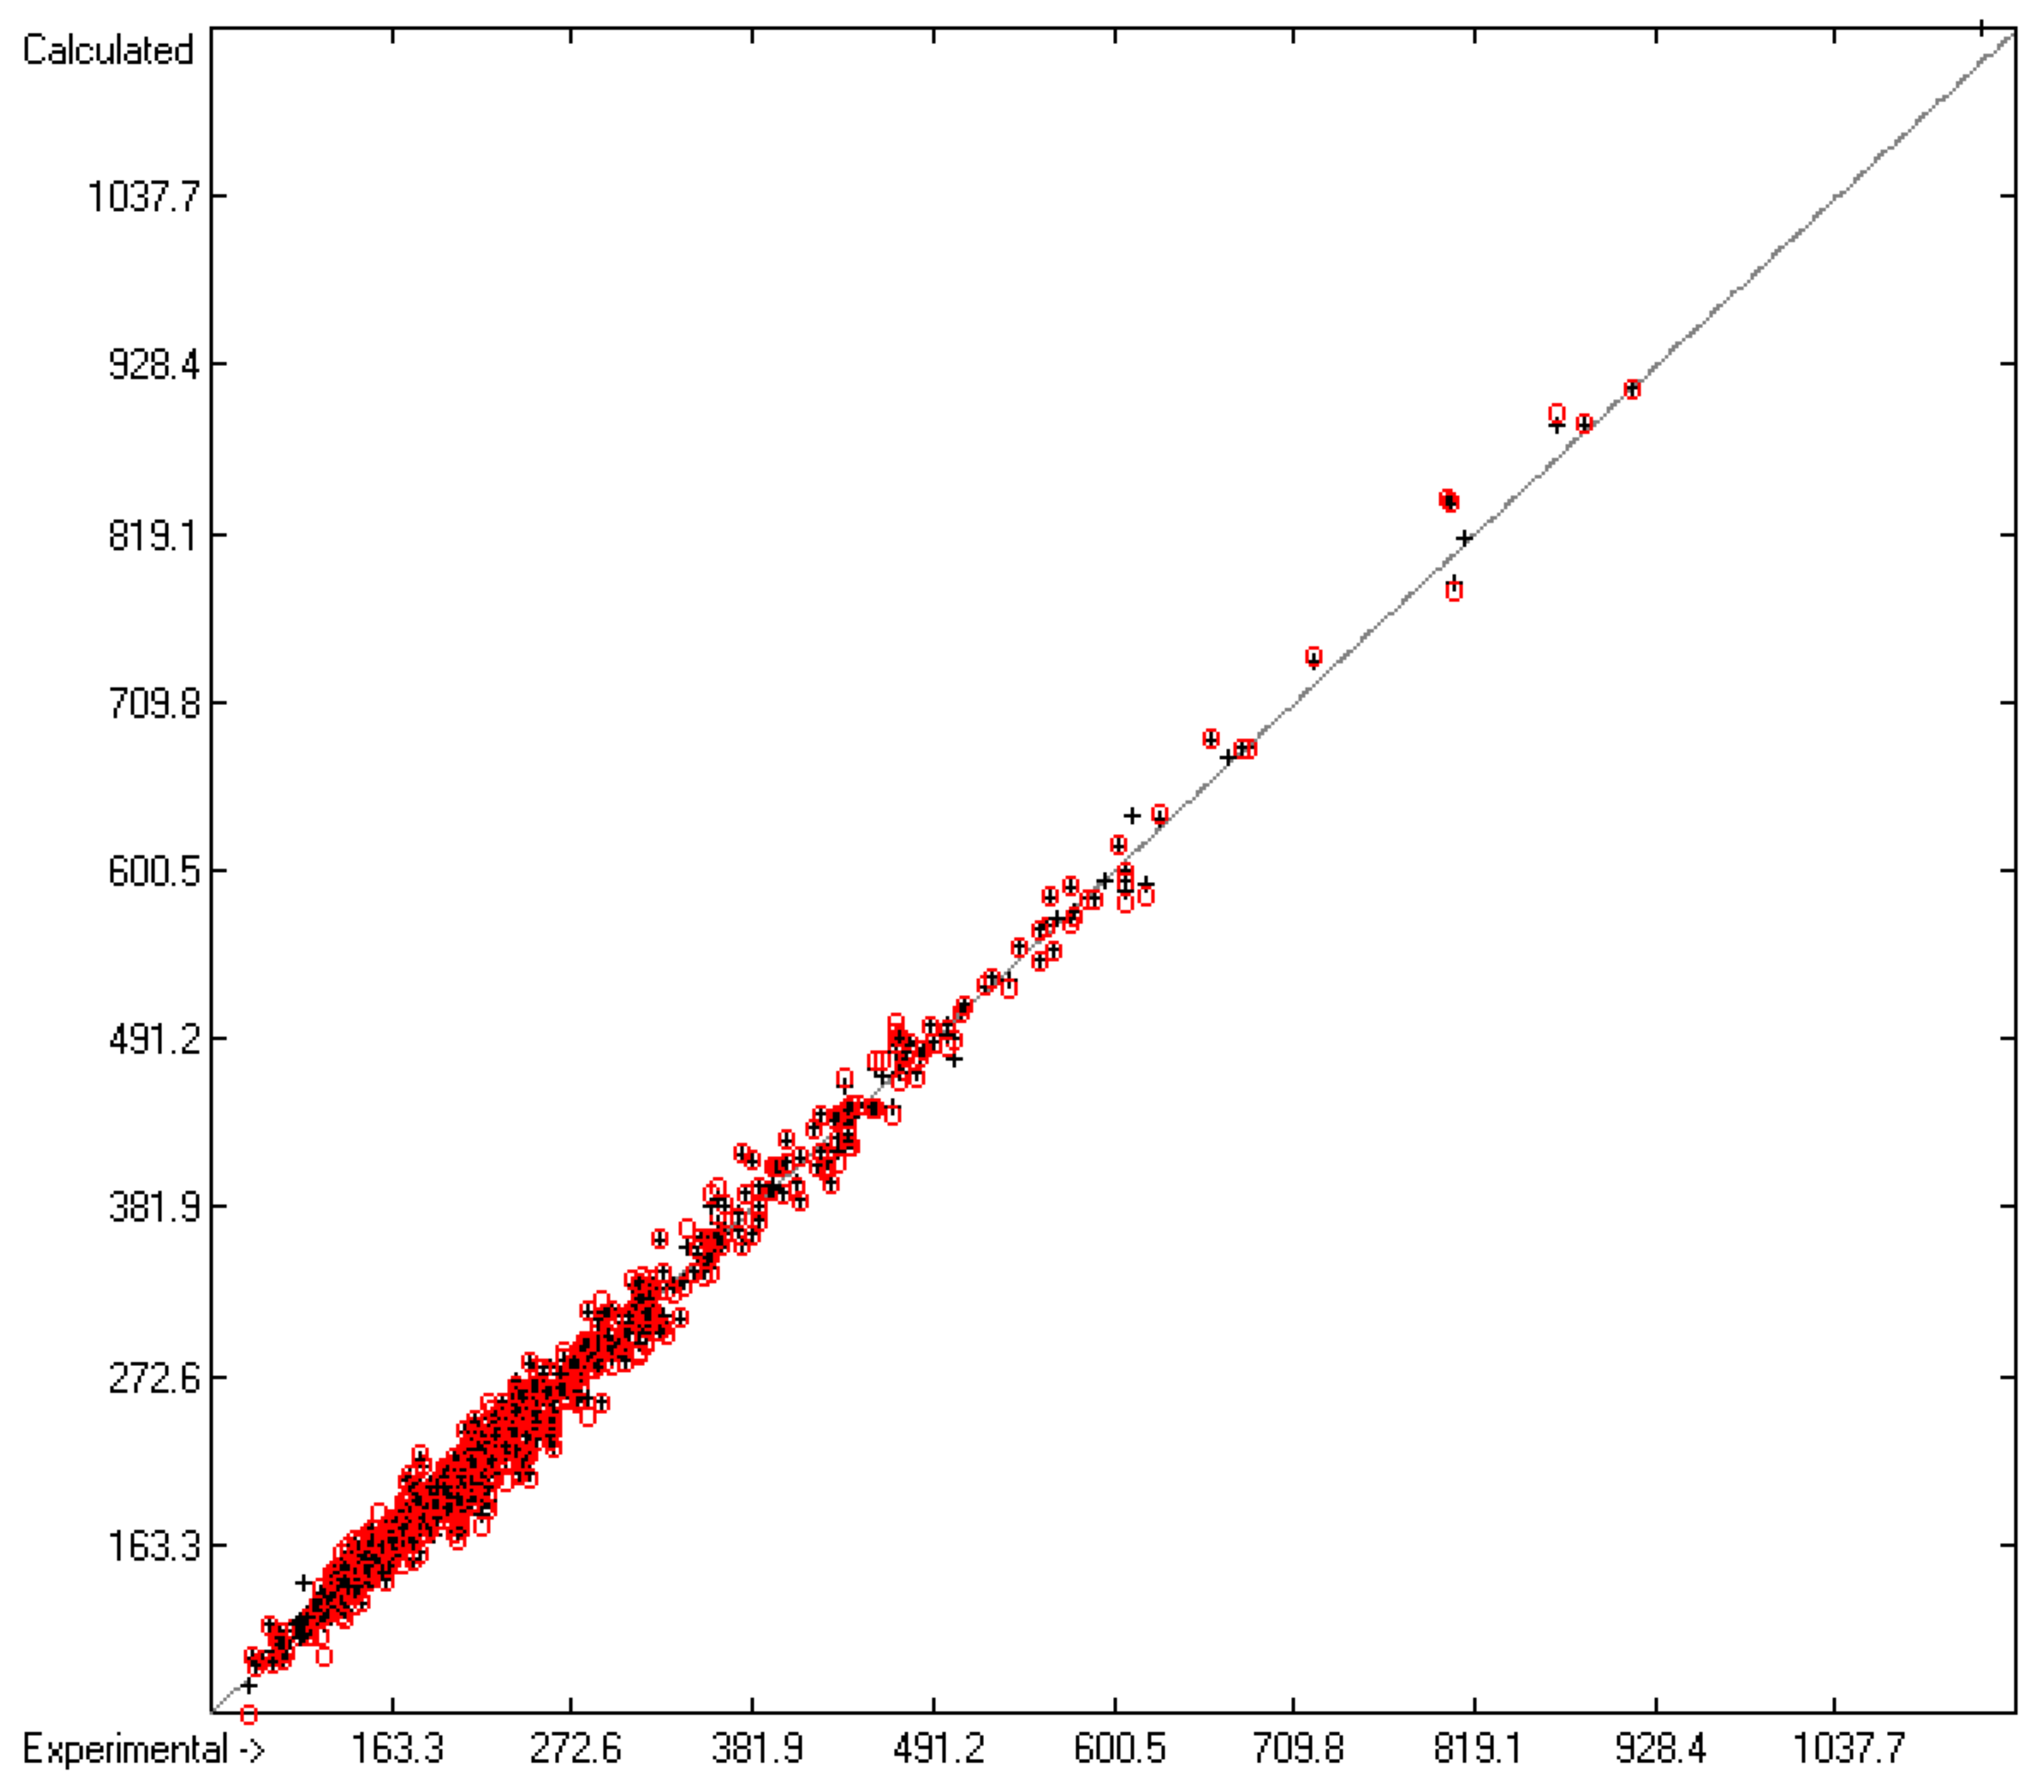
- In the subsequent figures, the results of the cross-validation calculations have been superimposed in red over the training data drawn in black.
- The complete lists of compounds with known heat capacities used in this study are available as SDF files in the Supplementary Materials, downloadable by external chemistry software. In addition, the Supplementary Materials provides the results lists containing the molecules’ names and experimental, training, and cross-validation data. Beyond this, the lists of outliers of both heat-capacity calculations are also available in the Supplementary Materials.
4.2. Heat Capacity of Liquids
4.3. Heat Capacity of Solids
5. Conclusions
Supplementary Materials
Funding
Acknowledgments
Conflicts of Interest
Abbreviations
- GA: atom-group additivity
- Vm: "true" molecular volume
References
- Naef, R. Calculation of the isobaric heat capacities of the liquid and solid phase of organic compounds at and around 298.15 K based on their “True” molecular volume. Molecules 2019, 24, 1626. [Google Scholar] [CrossRef] [PubMed]
- Gardas, R.L.; Coutinho, J.A.P. A group contribution method for heat capacity estimation of ionic liquids. Ind. Eng. Chem. Res. 2008, 47, 5751–5757. [Google Scholar] [CrossRef]
- Benson, S.W.; Buss, J.H. Additivity rules for the estimation of molecular properties. Thermodynamic properties. J. Chem. Phys. 1958, 29, 546–572. [Google Scholar] [CrossRef]
- Zàbransky, M.; Ruzicka, V. Estimation of the heat capacities of organic liquids as a function of temperature using group additivity: An amendment. J. Phys. Chem. Ref. Data 2004, 33, 1071–1081. [Google Scholar]
- Chickos, J.S.; Hesse, D.G.; Liebman, J.F. A group additivity approach for the estimation of heat capacities of organic liquids and solids at 298 K. Struct. Chem. 1993, 4, 261–269. [Google Scholar] [CrossRef]
- Naef, R. A generally applicable computer algorithm based on the group additivity method for the calculation of seven molecular descriptors: Heat of combustion, LogPO/W, LogS, refractivity, polarizability, toxicity and LogBB of organic compounds; scope and limits of applicability. Molecules 2015, 20, 18279–18351. [Google Scholar] [CrossRef]
- Naef, R.; Acree, W.E. Calculation of five thermodynamic molecular descriptors by means of a general computer algorithm based on the group-additivity method: Standard enthalpies of vaporization, sublimation and solvation, and entropy of fusion of ordinary organic molecules and total phase-change entropy of liquid crystals. Molecules 2017, 22, 1059. [Google Scholar] [CrossRef]
- Naef, R.; Acree, W.E. Application of a general computer algorithm based on the group-additivity method for the calculation of two molecular descriptors at both ends of dilution: Liquid viscosity and activity coefficient in water at infinite dilution. Molecules 2018, 23, 5. [Google Scholar] [CrossRef]
- Naef, R.; Acree, W.E., Jr. Calculation of the surface tension of ordinary organic and ionic liquids by means of a generally applicable computer algorithm based on the group-additivity method. Molecules 2018, 23, 1224. [Google Scholar] [CrossRef]
- Hardtwig, E. Fehler-und Ausgleichsrechnung. Hochschultaschenbücher 262/262a; Bibliographisches Institut AG: Mannheim, Germany, 1968. [Google Scholar]
- Wong, W.-K.; Westrum, E.F., Jr. Thermodynamics of globular molecules. XVII. Heat capacities and transition behavior of bicyclo[2.2.2]octane and bicyclo[2.2.2]octene. J. Phys. Chem. 1970, 74, 1303–1308. [Google Scholar] [CrossRef]
- Figueroa-Gerstenmaier, S.; Cabanas, A.; Costas, M. Self-association and complex formation in alcohol-unsaturated hydrocarbon systems. Heat capacities of linear alcohols mixed with alkenes and alkynes. Phys. Chem. Chem. Phys. 1999, 1, 665–674. [Google Scholar] [CrossRef]
- Zaitsau, D.H.; Emel’yanenko, V.N.; Pimerzin, A.A.; Verevkin, S.P. Benchmark properties of biphenyl as a liquid organic hydrogen carrier: Evaluation of thermochemical data with complementary experimental and computational methods. J. Chem. Thermodyn. 2018, 122, 1–12. [Google Scholar] [CrossRef]
- Mahnel, T.; Pokorny, V.; Fulem, M.; Sedmidubskym, D.; Ruzicka, K. Measurement of low-temperature heat capacity by relaxation technique: Calorimeter performance testing and heat capacity of benzo[b]fluoranthene, benzo[k]fluoranthene, and indeno[1,2,3-cd]pyrene. J. Chem. Thermodyn. 2020, 142, 105964. [Google Scholar] [CrossRef]
- Chang, S.-S.; Westrum, E.F., Jr. Heat Capacities and Thermodynamic Properties of Globular Molecules. I. Adamantane and Hexamethylenetetramine. J. Phys. Chem. 1960, 64, 1547–1551. [Google Scholar] [CrossRef]
- Mendoza-Ruiz, E.A.; Mentado-Morales, J.; Flores-Segura, H. Standard molar enthalpies of formation and phase changes of Tetra-N-phenylbenzidine and 4,4′-Bis (N-carbazolyl)-1,1′-biphenyl. J. Therm. Anal. Calor. 2019, 135, 2337–2345. [Google Scholar] [CrossRef]
- Van Bommel, M.J.; Van Miltenburg, J.C.; Schuijff, A. Heat-capacity measurements and thermodynamic functions of 1,3,5-triazine and 1,3,5-trioxane. J. Chem. Thermodyn. 1988, 20, 397–403. [Google Scholar] [CrossRef]
- Piekarski, H.; Tkaczyk, M.; Tyczynska, M. Heat capacity and phase behavior of aqueous diethylene glycol n-pentyl ether by DSC. Thermochim. Acta 2012, 550, 19–26. [Google Scholar] [CrossRef]
- Wasiak, M.; Tkaczyk, M.; Piekarski, H. Heat capacity and phase behaviour of aqueous solutions of triethylene glycol monopentyl ether. Two point scaling analysis. Fluid Phase Equil. 2017, 431, 16–23. [Google Scholar] [CrossRef]
- Emel’yanenko, V.N.; Zaitsau, D.H.; Pimerzin, A.A.; Verevkin, S.P. Benchmark properties of diphenyl oxide as a potential liquid organic hydrogen carrier: Evaluation of thermochemical data with complementary experimental and computational methods. J. Chem. Thermodyn. 2018, 125, 149–158. [Google Scholar] [CrossRef]
- Ashrafi, F.; Saadati, R.; Behboodi, A. Modeling and theoretical calculation of liquid heat capacity of alcohols and aldehydes using QSPR. African J. Pure Appl. Chem. 2008, 2, 116–120. [Google Scholar]
- Campos, J.B.; Martinez-Gomez, A.J.; Orozco-Guareno, E. Design and building of an isoperibolic calorimeter: Measurements of enthalpy of formation for derivatives of glycidol. Meas. Sci. Technol. 2019, 30, 035902. [Google Scholar] [CrossRef]
- Buchholz, H.; Hylton, R.K.; Brandenburg, J.G.; Seidel-Morgenstern, A.; Lorenz, H.; Stein, M.; Price, S.L. The thermochemistry of racemic and enantiopure molecular crystals for predicting enantiomer separation. Cryst. Growth Des. 2017, 17, 4676–4686. [Google Scholar] [CrossRef]
- Nikitin, E.D.; Popov, A.P.; Bogatishcheva, N.S.; Faizullin, M.Z. Critical temperatures and pressures, heat capacities, and thermal diffusivities of levulinic acid and four n-alkyl levulinates. J. Chem. Thermodyn. 2019, 135, 233–240. [Google Scholar] [CrossRef]
- Su, C.; Zhu, C.; Ye, F.Y.Z.; Liu, X.; He, M. Isobaric molar heat capacity of ethyl octanoate and ethyl decanoate at pressures up to 24 Mpa. Chem. Eng. Data 2018, 63, 2252–2256. [Google Scholar] [CrossRef]
- Van Bommel, M.J.; Oonk, H.A.J.; Van Miltenburg, J.C. Heat Capacity measurements of 13 methyl esters of n-carboxylic acids from methyl octanoate to methyl eicosanoate between 5 K and 350 K. J. Chem. Eng. Data 2004, 49, 1036–1042. [Google Scholar] [CrossRef]
- Xu, J.; Li, S.; Zeng, Z.; Xue, W. Heat capacity, density, vapor pressure, and enthalpy of vaporization of isoamyl DL-lactate. J. Chem. Eng. Data 2019, 64, 3793–3798. [Google Scholar] [CrossRef]
- Neau, S.H.; Flynn, G.L. Solid and liquid heat capacities of n-alkyl para-aminobenzoates near the melting point. Pharmaceut. Res. 1990, 7, 1157–1162. [Google Scholar] [CrossRef]
- Chorazewski, M.; Goralski, P.; Tkaczyk, M. Heat capacities of 1-chloroalkanes and 1-bromoalkanes within the temperature range from 284.15 K to 353.15 K. A group additivity and molecular connectivity analysis. J. Chem. Eng. Data 2005, 50, 619–624. [Google Scholar] [CrossRef]
- Goralski, P.; Tkaczyk, M.; Chorazewski, M. Heat capacities of α,ω-dichloroalkanes at temperatures from 284.15 K to 353.15 K and a group additivity analysis. J. Chem. Eng. Data 2003, 48, 492–496. [Google Scholar] [CrossRef]
- Lipovska, M.; Schmidt, H.-G.; Rohac, V.; Ruzicka, V.; Wolf, G.; Zabransky, M. Heat capacities of three isomeric chlorobenzenes and of three isomeric chlorophenols. J. Therm. Anal. Calor. 2002, 68, 753–766. [Google Scholar] [CrossRef]
- Goralski, P.; Piekarski, H. Heat capacities and densities of some liquid chloro-, bromo-, and bromochloro-substituted benzenes. J. Chem. Eng. Data 2007, 52, 655–659. [Google Scholar] [CrossRef]
- Michalski, D.; Perry, R.T.; White, M.A. Additivity of guest and host properties in clathrates: A thermodynamic and Raman spectroscopic investigation of HPTB-based solids. J. Phys.: Condens. M. 1996, 8, 1647–1661. [Google Scholar] [CrossRef]
- Roux, M.V.; Temprado, M.; Jimenez, P.; Guzman-Mejia, R.; Juaristi, E.; Chickos, J.S. Heat capacities of thiane sulfones and thiane sulfoxide Refining of Cp group values for organosulfur compounds and their oxides. Thermochim. Acta 2003, 406, 9–16. [Google Scholar] [CrossRef]
- Zhang, Z.Y.; Yang, M.L. Heat capacity and phase transition of 2-amino-2-methyl-1,3-propanediol from 280K to the melting point. Thermochim. Acta 1990, 169, 263–269. [Google Scholar] [CrossRef]
- Chiu, L.-F.; Liu, H.-F.; Li, M.-H. Heat capacity of alkanolamines by differential scanning calorimetry. J. Chem. Eng. Data 1999, 44, 631–636. [Google Scholar] [CrossRef]
- Soares, B.P.; Stejfa, V.; Ferreira, O.; Pinho, S.P.; Ruzicka, K.; Fulem, M. Vapor pressures and thermophysical properties of selected ethanolamines. Fluid Phase Equil. 2018, 473, 245–254. [Google Scholar] [CrossRef]
- Perisanu, S.; Contineanu, I.; Neacsu, A.; Notario, R.; Roux, M.V.; Liebman, J.F.; Dodson, B.J. Thermochemistry and quantum chemical calculations of two dibenzocycloalkane nitriles. Struct. Chem. 2011, 22, 89–94. [Google Scholar] [CrossRef]
- Stejfa, V.; Fulem, M.; Ruzicka, K. Vapor pressure of 4-ethylmorpholine revisited: Thermodynamically consistent vapor pressure equation. J. Chem. Eng. Data 2019, 644, 1605–1610. [Google Scholar] [CrossRef]
- Tyunina, V.V.; Krasnov, A.V.; Tyunina, E.Y.; Badelin, V.G.; Rybkin, V.V. Enthalpies of sublimation of L-methionine and DL-methionine: Knudsen’s effusion mass spectrometric study. J. Chem. Thermodyn. 2019, 135, 287–295. [Google Scholar] [CrossRef]
- Abdelaziz, A.; Zaitsau, D.H.; Buzyurov, A.; Minakov, A.A.; Verevkin, S.P.; Schick, C. Fast scanning calorimetry: Sublimation thermodynamics of low volatile and thermally unstable compounds. Thermochim. Acta 2019, 676, 249–262. [Google Scholar] [CrossRef]
- Stejfa, V.; Fulem, M.; Ruzicka, K. Thermodynamic study of selected monoterpenes IV. J. Chem. Thermodyn. 2019. [Google Scholar] [CrossRef]
- Zhang, G.-Y.; Jin, S.-H.; Li, L.-J.; Li, Z.-H.; Shu, Q.-H.; Wang, D.-Q.; Zhang, B.; Li, Y.-K. Evaluation of thermal hazards and thermokinetic parameters of 3-amino-4-amidoximinofurazan by ARC and TG. J. Therm. Anal. Calor. 2016, 126, 1223–1230. [Google Scholar] [CrossRef]
- Li, R.; Hua, Y.; Tan, Z.; Shi, Q. Low temperature calorimetry of 3-fluoro-5-(3-pyridinyloxy) benzenamine and N-[3-fluoro-5-(3-Pyridinyloxy)phenyl]-N’-3-pyridinyl urea. Intern. J. Thermodyn. 2017, 20, 153–157. [Google Scholar] [CrossRef]
- Baird, Z.S.; Dahlberg, A.; Uusi-Kyyny, P.; Osmanbegovic, N.; Witos, J.; Helminen, J.; Cederkrantz, D.; Hyväri, P.; Alopaeus, V.; Kilpeläinen, I.; et al. Physical properties of 7-methyl-1,5,7-triazabicyclo[4.4.0]dec-5-ene (mTBD). Intern. J. Thermophys. 2019, 40, 71. [Google Scholar] [CrossRef]
- Liu, Y.; Di, Y.; Di, Y.; Qiao, C.; Che, F.; Yuan, F.; Yue, K.; Zhou, C. The studies of structure, thermodynamic properties and theoretical analyses of 2-[(4-nitro-benzoyl)-hydrazone]-propionic acid. J. Mol. Struct. 2019, 1184, 532–537. [Google Scholar] [CrossRef]
- Vilas-Boas, S.M.; Pokorny, V.; Stejfa, V.; Ferreira, O.; Pinho, S.P.; Ruzicka, K.; Fulem, M. Vapor pressure and thermophysical properties of eugenol and (+)-carvone. Fluid Phase Equil. 2019, 499, 112248. [Google Scholar] [CrossRef]
- Skotnicki, M.; Drogon, A.; Calvin, J.J.; Rosen, P.F.; Woodfield, B.F.; Pyda, M. Heat capacity and enthalpy of indapamide. Thermochim. Acta 2019, 674, 36–43. [Google Scholar] [CrossRef]
- Cai, M.; Zhou, T.-H.; Li, Y.-N.; Xu, K.-Z. Two interesting derivatives of 1-amino-1-hydrazino-2,2-dinitroethylene (AHDNE): Synthesis and thermal properties. J. Therm. Anal. Calor. 2019. [Google Scholar] [CrossRef]
- Doncaster, A.M.; Walsh, R. Thermochemistry of silicon-containing compounds. J. Chem. Soc. Faraday Trans. 1986, 82, 707–717. [Google Scholar] [CrossRef]
- Waliszewski, D.; Stepniak, I.; Piekarski, H.; Lewandowski, A. Heat capacities of ionic liquids and their heats of solution in molecular liquids. Thermochim. Acta 2005, 433, 149–152. [Google Scholar] [CrossRef]
- Lopez-Bueno, C.; Bugallo, D.; Leboran, V.; Rivadulla, F. Sub-μL measurements of the thermal conductivity and heat capacity of liquids. Phys.Chem.Chem.Phys. 2018, 20, 7277. [Google Scholar] [CrossRef] [PubMed]
- Zaitsau, D.H.; Schmitz, A.; Janiak, C.; Verevkin, S.P. Heat capacities of ionic liquids based on tetrahydrothiophenium cation and NTf2 anion. Thermochim. Acta 2020, 686, 178547. [Google Scholar] [CrossRef]
- Huelsekopf, M.; Ludwig, R. Temperature dependence of hydrogen bonding. J. Mol. Liq. 2000, 85, 105–125. [Google Scholar] [CrossRef]
- Steele, W.V. The standard enthalpies of formation of a series of C7 bridged-ring hydrocarbons: Norbornane, norbornene, nortricyclene, norbornadiene, and quadricyclane. J. Chem. Thermodyn. 1978, 10, 919–927. [Google Scholar] [CrossRef]
- Parker, W.; Steele, W.V.; Watt, I. A high-precision aneroid static-bomb combustion calorimeter for samples of about 20 mg. The standard enthalpy of formation of bicyclo[3.3.3]undecane. J. Chem. Thermodyn. 1975, 7, 795–802. [Google Scholar] [CrossRef]
Sample Availability: Samples of the compounds are not available. |


| Atom Type | Neighbours | Meaninga | Example |
|---|---|---|---|
| B(-) | F4 | BF4- | tetrafluoroborate |
| C sp3 | H2CN(+) | CCH2N(+) | C1 in tetraalkylammonium |
| C sp3 | H2CP(+) | CCH2P(+) | C1 in tetraalkylphosphonium |
| C sp3 | H2CS(+) | CCH2S(+) | C1 in trialkylsulfonium |
| C(-) sp3 | C3 | C3C- | central C- in tricyanocarbeniate |
| C aromatic | H:C:N(+) | C:CH:N+ | C2 in pyridinium |
| C(+) aromatic | H:N2 | N:C+H:N | C2 in imidazolium |
| C sp | B#N(-) | B-(C#N) | C in tetracyanoborate |
| C sp | C#N(-) | C-(C#N) | cyano-C in tricyanocarbeniate |
| C sp | N#N(-) | N-(C#N) | C in dicyanoamide |
| C sp | =N=S(-) | N=C=S- | thiocyanate |
| N(+) sp3 | C4 | N+C4 | tetraalkylammonium |
| N(+) sp2 | O2=O(-) | NO3- | nitrate |
| N aromatic | C2:C(+) | C-N(C):C+ | N1 and N3 in 1,3-dialkylimidazolium |
| N(+) aromatic | C:C2 | C:N+(C):C | N in 1-alkylpyridinium |
| N(-) | C2 | C-N--C | N- in dicyanoamide |
| N(-) | CS | C-N--S | N- in saccharinate |
| N(-) | S2 | S-N--S | bis(trifluoromethanesulfonyl)amide |
| P4 | CO2=O(-) | CPO3- | alkylphosphonate |
| P(+) | C4 | PC4+ | tetraalkylphosphonium |
| P(-) | C3F3 | F3P-C3 | tris(pentafluoroethyl)trifluorophosphate |
| P(-) | F6 | PF6- | hexafluorophosphate |
| S(+) | C3 | C3S+ | trialkylsulfonium |
| S4 | CN=O2(-) | CS(O2)N- | bis(trifluoromethanesulfonyl)amide |
| S4 | CO=O2(-) | CSO3- | alkylsulfonate |
| S4 | O2=O2(-) | SO4- | alkylsulfate |
| Atom Type | Neighbours | Meaning |
|---|---|---|
| O(prim) | HC | Primary alcohol |
| O(sec) | HC | Secondary alcohol |
| O(tert) | HC | Tertiary alcohol |
| Endocyclic bonds | No of single bonds | Count single bonds in cyclic ring |
| Angle60 | Bond angle < 60 deg | |
| Angle 90 | Bond angle between 60 and 90 deg | |
| Angle102 | Bond angle between 90 and 102 deg | |
| (COH)n | n > 1 | Molecule contains more than 1 OH group |
| H | H Acceptor | Intramolecular H bridge between acidic H (on O, N or S) and basic acceptor (O, N or F) |
| Entry | Atom Type | Neighbours | Contribution | Occurrences | Molecules |
|---|---|---|---|---|---|
| 1 | B | C3 | 240 | 1 | 1 |
| 2 | B(-) | C4 | 698.66 | 2 | 2 |
| 3 | B(-) | F4 | 51.21 | 6 | 6 |
| 4 | C sp3 | H3C | 37.03 | 1555 | 790 |
| 5 | C sp3 | H3N | 100.02 | 127 | 101 |
| 6 | C sp3 | H3N(+) | 147.91 | 20 | 18 |
| 7 | C sp3 | H3O | 81.29 | 84 | 66 |
| 8 | C sp3 | H3S | 84.43 | 17 | 13 |
| 9 | C sp3 | H3S(+) | 172.17 | 1 | 1 |
| 10 | C sp3 | H3P | 217.59 | 1 | 1 |
| 11 | C sp3 | H3Si | 71 | 71 | 18 |
| 12 | C sp3 | H2BC | –37.03 | 3 | 1 |
| 13 | C sp3 | H2C2 | 30.06 | 3249 | 696 |
| 14 | C sp3 | H2CN | 90.52 | 222 | 146 |
| 15 | C sp3 | H2CN(+) | 142.85 | 78 | 52 |
| 16 | C sp3 | H2CO | 73.86 | 477 | 243 |
| 17 | C sp3 | H2CS | 75.25 | 38 | 27 |
| 18 | C sp3 | H2CS(+) | 136.25 | 29 | 10 |
| 19 | C sp3 | H2CP | 252.08 | 2 | 1 |
| 20 | C sp3 | H2CP(+) | 71.8 | 12 | 3 |
| 21 | C sp3 | H2CCl | 63.67 | 38 | 30 |
| 22 | C sp3 | H2CBr | 63.93 | 26 | 21 |
| 23 | C sp3 | H2CJ | 67.73 | 10 | 9 |
| 24 | C sp3 | H2CSi | 60.71 | 18 | 8 |
| 25 | C sp3 | H2N2 | 151.55 | 4 | 2 |
| 26 | C sp3 | H2NO | 157.51 | 12 | 12 |
| 27 | C sp3 | H2O2 | 111.47 | 4 | 4 |
| 28 | C sp3 | H2S2 | 128.41 | 1 | 1 |
| 29 | C sp3 | HC3 | 21.11 | 303 | 196 |
| 30 | C sp3 | HC2N | 81.86 | 14 | 14 |
| 31 | C sp3 | HC2N(+) | 159.6 | 3 | 3 |
| 32 | C sp3 | HC2O | 67.45 | 107 | 87 |
| 33 | C sp3 | HC2S | 67.46 | 10 | 9 |
| 34 | C sp3 | HC2Si | 36.48 | 1 | 1 |
| 35 | C sp3 | HC2Cl | 56.56 | 9 | 9 |
| 36 | C sp3 | HC2Br | 56.84 | 4 | 4 |
| 37 | C sp3 | HC2J | 62.21 | 2 | 2 |
| 38 | C sp3 | HCNO(+) | 176.8 | 3 | 1 |
| 39 | C sp3 | HCO2 | 96.7 | 3 | 3 |
| 40 | C sp3 | HCF2 | 157.26 | 1 | 1 |
| 41 | C sp3 | HCFCl | 73.89 | 1 | 1 |
| 42 | C sp3 | HCCl2 | 86.15 | 9 | 8 |
| 43 | C sp3 | HCClBr | 89.68 | 1 | 1 |
| 44 | C sp3 | HCBr2 | 82.85 | 2 | 1 |
| 45 | C sp3 | C4 | 7.78 | 62 | 51 |
| 46 | C sp3 | C3N | 81.33 | 5 | 4 |
| 47 | C sp3 | C3N(+) | 55.23 | 3 | 3 |
| 48 | C sp3 | C3O | 57.44 | 23 | 21 |
| 49 | C sp3 | C3S | 57.43 | 7 | 5 |
| 50 | C sp3 | C3F | 43.66 | 5 | 3 |
| 51 | C sp3 | C3Cl | 50.92 | 1 | 1 |
| 52 | C sp3 | C3Br | 54.62 | 1 | 1 |
| 53 | C sp3 | C2N2(+) | 223.66 | 2 | 2 |
| 54 | C sp3 | C2O2 | 99.71 | 1 | 1 |
| 55 | C sp3 | C2F2 | 50.88 | 78 | 13 |
| 56 | C sp3 | C2FCl | 64.31 | 5 | 2 |
| 57 | C sp3 | C2Cl2 | 87.42 | 2 | 2 |
| 58 | C sp3 | CNF2 | 112.99 | 3 | 1 |
| 59 | C sp3 | CF3 | 66.92 | 31 | 23 |
| 60 | C sp3 | CSF2 | 0 | 1 | 1 |
| 61 | C sp3 | CPF2(-) | 44.23 | 6 | 2 |
| 62 | C sp3 | CF2Cl | 89.67 | 4 | 4 |
| 63 | C sp3 | CF2Br | 86.41 | 7 | 4 |
| 64 | C sp3 | CFCl2 | 88.11 | 3 | 2 |
| 65 | C sp3 | CCl3 | 102.55 | 8 | 8 |
| 66 | C sp3 | SF3 | 102.78 | 151 | 78 |
| 67 | C(-) sp3 | C3 | 131.76 | 1 | 1 |
| 68 | C sp2 | H2=C | 35.64 | 61 | 59 |
| 69 | C sp2 | HC=C | 22.79 | 195 | 107 |
| 70 | C sp2 | HC=N | 95.94 | 4 | 4 |
| 71 | C sp2 | HC=O | 54.97 | 23 | 23 |
| 72 | C sp2 | H=CN | 92.25 | 166 | 87 |
| 73 | C sp2 | H=CO | 42.8 | 11 | 10 |
| 74 | C sp2 | H=CS | 87.41 | 5 | 5 |
| 75 | C sp2 | H=CCl | 56.41 | 5 | 3 |
| 76 | C sp2 | H=CSi | 43.69 | 4 | 4 |
| 77 | C sp2 | HN=N | 32.91 | 3 | 3 |
| 78 | C sp2 | HN=O | 100.63 | 3 | 3 |
| 79 | C sp2 | HO=O | 58.82 | 7 | 7 |
| 80 | C sp2 | H=NS | 15.48 | 2 | 2 |
| 81 | C sp2 | C2=C | 16.22 | 54 | 44 |
| 82 | C sp2 | C2=N | 333.48 | 1 | 1 |
| 83 | C sp2 | C=CN | 89.61 | 3 | 2 |
| 84 | C sp2 | C2=O | 50.28 | 49 | 49 |
| 85 | C sp2 | C=CO | 36.16 | 5 | 5 |
| 86 | C sp2 | C=CS | 74.31 | 5 | 4 |
| 87 | C sp2 | C=CCl | 160.28 | 1 | 1 |
| 88 | C sp2 | CN=O | 87.09 | 12 | 12 |
| 89 | C sp2 | CN=O(-) | 87.78 | 1 | 1 |
| 90 | C sp2 | C=NS | 8.06 | 1 | 1 |
| 91 | C sp2 | CO=O | 43.25 | 216 | 158 |
| 92 | C sp2 | CO=O(-) | 27.63 | 8 | 7 |
| 93 | C sp2 | C=OS | 0 | 1 | 1 |
| 94 | C sp2 | C=OCl | 70.53 | 7 | 6 |
| 95 | C sp2 | =CF2 | 56.5 | 2 | 1 |
| 96 | C sp2 | =CCl2 | 77.26 | 5 | 4 |
| 97 | C sp2 | N2=N | 56.88 | 1 | 1 |
| 98 | C sp2 | N2=O | 131.83 | 3 | 3 |
| 99 | C sp2 | NO=O | 98.32 | 1 | 1 |
| 100 | C sp2 | O2=O | 50.04 | 5 | 5 |
| 101 | C aromatic | H:C2 | 22 | 1115 | 238 |
| 102 | C aromatic | H:C:N | 42.32 | 19 | 13 |
| 103 | C aromatic | H:C:N(+) | –9.45 | 53 | 32 |
| 104 | C aromatic | H:N2 | 0 | 0 | |
| 105 | C aromatic | :C3 | 9.57 | 19 | 11 |
| 106 | C aromatic | C:C2 | 11.58 | 251 | 152 |
| 107 | C aromatic | C:C:N | 30.59 | 8 | 7 |
| 108 | C aromatic | C:C:N(+) | –2.69 | 11 | 11 |
| 109 | C aromatic | :C2N | 71.34 | 31 | 29 |
| 110 | C aromatic | :C2N(+) | 118.05 | 11 | 8 |
| 111 | C aromatic | :C2:N | 31.72 | 3 | 3 |
| 112 | C aromatic | :C2O | 33.82 | 46 | 28 |
| 113 | C aromatic | :C2S | 88.68 | 7 | 7 |
| 114 | C aromatic | :C2Si | 37.2 | 10 | 7 |
| 115 | C aromatic | :C2F | 37.06 | 54 | 17 |
| 116 | C aromatic | :C2Cl | 41.28 | 19 | 15 |
| 117 | C aromatic | :C2Br | 52.57 | 11 | 8 |
| 118 | C aromatic | :C2J | 43.43 | 3 | 3 |
| 119 | C(+) aromatic | H:N2 | –155.06 | 74 | 74 |
| 120 | C sp | B#N(-) | –130.93 | 8 | 2 |
| 121 | C sp | H#C | 38.78 | 6 | 5 |
| 122 | C sp | C#C | 23.99 | 10 | 7 |
| 123 | C sp | =C2 | 25.16 | 4 | 4 |
| 124 | C sp | C#N | 48.78 | 35 | 31 |
| 125 | C sp | C#N(-) | –9.81 | 3 | 1 |
| 126 | C sp | #CSi | 49.58 | 2 | 1 |
| 127 | C sp | N#N(-) | –2.88 | 12 | 6 |
| 128 | C sp | =N2 | –89.69 | 1 | 1 |
| 129 | C sp | =N=O | –20.75 | 8 | 5 |
| 130 | C sp | =N=S(-) | 43.63 | 3 | 3 |
| 131 | N sp3 | H2C | –4.35 | 33 | 28 |
| 132 | N sp3 | H2C(pi) | 0.31 | 9 | 9 |
| 133 | N sp3 | H2N | 48.67 | 5 | 4 |
| 134 | N sp3 | HC2 | –71.79 | 21 | 20 |
| 135 | N sp3 | HC2(pi) | –72.44 | 14 | 14 |
| 136 | N sp3 | HC2(2pi) | –103.28 | 6 | 6 |
| 137 | N sp3 | HCN | –15.74 | 4 | 3 |
| 138 | N sp3 | HCN(pi) | –13 | 1 | 1 |
| 139 | N sp3 | HCS(pi) | –21.52 | 1 | 1 |
| 140 | N sp3 | C3 | –160.23 | 33 | 28 |
| 141 | N sp3 | C3(pi) | –149.65 | 17 | 14 |
| 142 | N sp3 | C3(2pi) | –180.02 | 3 | 3 |
| 143 | N sp3 | C3(3pi) | –165.46 | 1 | 1 |
| 144 | N sp3 | C2N | –91.6 | 2 | 2 |
| 145 | N sp3 | C2N(2pi) | –143.37 | 2 | 2 |
| 146 | N sp3 | C2N(3pi) | –160.71 | 1 | 1 |
| 147 | N sp2 | H=C | –243.13 | 1 | 1 |
| 148 | N sp2 | C=C | 15.82 | 17 | 13 |
| 149 | N sp2 | C=N | –20.24 | 2 | 1 |
| 150 | N sp2 | C=N(+) | –42.22 | 1 | 1 |
| 151 | N sp2 | =CN | 0 | 3 | 3 |
| 152 | N sp2 | =CO | –53.43 | 1 | 1 |
| 153 | N aromatic | C2:C(+) | –0.31 | 148 | 74 |
| 154 | N aromatic | :C2 | −16.75 | 15 | 15 |
| 155 | N(+) sp3 | H3C | −44.33 | 1 | 1 |
| 156 | N(+) sp3 | H2C2 | −140.41 | 4 | 4 |
| 157 | N(+) sp3 | HC3 | −291.64 | 1 | 1 |
| 158 | N(+) sp3 | C4 | −372.93 | 13 | 13 |
| 159 | N(+) sp2 | C=NO(-) | 0 | 1 | 1 |
| 160 | N(+) sp2 | CO=O(-) | −45.71 | 25 | 17 |
| 161 | N(+) sp2 | O2=O(-) | 5.99 | 4 | 4 |
| 162 | N(+) aromatic | C:C2 | 14.22 | 32 | 32 |
| 163 | N(-) | C2 | 62.36 | 6 | 6 |
| 164 | N(-) | CS | −32.57 | 1 | 1 |
| 165 | N(-) | S2 | 33.36 | 73 | 73 |
| 166 | O(prim) | HC | 14.35 | 102 | 89 |
| 167 | O(sec) | HC | 36.17 | 47 | 47 |
| 168 | O(tert) | HC | 58 | 11 | 11 |
| 169 | O | HC(pi) | 48.39 | 57 | 46 |
| 170 | O | HP | −119.34 | 1 | 1 |
| 171 | O | HS | 39.11 | 1 | 1 |
| 172 | O | C2 | −59.32 | 170 | 98 |
| 173 | O | C2(pi) | −26.57 | 191 | 149 |
| 174 | O | C2(2pi) | −15.47 | 22 | 12 |
| 175 | O | CN(+)(pi) | 55.55 | 3 | 3 |
| 176 | O | CN(2pi) | 0 | 1 | 1 |
| 177 | O | CS | 16.03 | 8 | 8 |
| 178 | O | CP(pi) | 22.25 | 3 | 1 |
| 179 | O | CSi | −22.04 | 20 | 5 |
| 180 | O | Si2 | −21.83 | 19 | 7 |
| 181 | P4 | C2O=O(-) | −344.96 | 1 | 1 |
| 182 | P4 | CO2=O(-) | 0 | 1 | 1 |
| 183 | P4 | O3=O | 0 | 1 | 1 |
| 184 | P(+) | C4 | −95.06 | 3 | 3 |
| 185 | P(-) | C3F3 | 33.12 | 2 | 2 |
| 186 | P(-) | F6 | 96.53 | 9 | 9 |
| 187 | S2 | HC | 0.94 | 19 | 19 |
| 188 | S2 | HC(pi) | −25.44 | 1 | 1 |
| 189 | S2 | C2 | −53.94 | 19 | 19 |
| 190 | S2 | C2(pi) | −77.07 | 2 | 2 |
| 191 | S2 | C2(2pi) | −89.86 | 7 | 7 |
| 192 | S2 | CS | −11.11 | 8 | 4 |
| 193 | S4 | C2=O | −23.45 | 2 | 2 |
| 194 | S4 | C2=O2 | −18.86 | 1 | 1 |
| 195 | S4 | CN=O2 | 0 | 1 | 1 |
| 196 | S4 | CN=O2(-) | 5.69 | 147 | 74 |
| 197 | S4 | CO=O2(-) | 4.61 | 9 | 9 |
| 198 | S4 | O2=O2(-) | 0 | 9 | 9 |
| 199 | S(+) | C3 | −203.28 | 10 | 10 |
| 200 | Si | C4 | −89.09 | 11 | 10 |
| 201 | Si | C3O | −49.41 | 6 | 3 |
| 202 | Si | C3Cl | −25.49 | 1 | 1 |
| 203 | Si | C2O2 | 9.5 | 16 | 6 |
| 204 | Si | C2Cl2 | 25.44 | 3 | 3 |
| 205 | Si | CCl3 | 86.83 | 3 | 3 |
| 206 | Si | O4 | 0 | 5 | 5 |
| 207 | (COH)n | n > 1 | −27.73 | 20 | 19 |
| 208 | H | H Acceptor | −21.43 | 3 | 3 |
| 209 | Endocyclic bonds | No of single bds | −3.92 | 1341 | 243 |
| 210 | Angle60 | 4.13 | 69 | 19 | |
| 211 | Angle90 | 1.7 | 63 | 19 | |
| A | Based on | Valid groups | 134 | 1176 | |
| B | Goodness of fit | R2 | 0.998 | 1111 | |
| C | Deviation | Average | 6.09 | 1111 | |
| D | Deviation | Standard | 8.24 | 1111 | |
| E | K-fold cv | K | 10 | 1060 | |
| F | Goodness of fit | Q2 | 0.9975 | 1060 | |
| G | Deviation | Average (cv) | 6.85 | 1060 | |
| H | Deviation | Standard (cv) | 9.19 | 1060 |
| Molecule Name | Cp(liq,298) calc. (GA) | Dev. (%) | Cp(liq,298) exp. | Dev. (%) | Cp(liq,298) calc. (Vm) |
|---|---|---|---|---|---|
| 1-Propanol | 155.30 | −5.73 | 146.88 | −8.12 | 158.80 |
| 2-Propanol | 177.70 | −15.07 | 154.43 | −2.83 | 158.80 |
| 2-Methyl-1-propanol | 183.40 | −1.30 | 181.05 | −5.05 | 190.20 |
| 1-Butanol | 185.40 | −4.65 | 177.16 | −7.81 | 191.00 |
| Cyclopentanol | 204.20 | −10.14 | 185.40 | −9.76 | 203.50 |
| 2-Butanol | 207.70 | −5.61 | 196.67 | 3.34 | 190.10 |
| Isopentyl alcohol | 213.50 | −1.86 | 209.60 | −5.92 | 222.00 |
| 1-Pentanol | 215.40 | −3.49 | 208.14 | −7.19 | 223.10 |
| 2-Methyl-2-propanol | 226.50 | −3.61 | 218.60 | 12.76 | 190.70 |
| Cyclohexanol | 230.40 | −7.97 | 213.40 | −9.89 | 234.50 |
| 3-Methyl-2-butanol | 235.80 | 4.11 | 245.90 | 9.68 | 222.10 |
| Cyclohexanemethanol | 236.10 | 0.17 | 236.50 | −12.05 | 265.00 |
| 3,3-Dimethyl-1-butanol | 237.10 | −0.43 | 236.08 | −7.51 | 253.80 |
| 3-Pentanol | 237.80 | 0.79 | 239.70 | 6.76 | 223.50 |
| 2-Ethyl-1-butanol | 243.50 | 1.28 | 246.65 | −2.74 | 253.40 |
| 2-Methyl-1-pentanol | 243.50 | 1.97 | 248.40 | −2.62 | 254.90 |
| 1-Hexanol | 245.50 | −1.15 | 242.70 | −5.44 | 255.90 |
| Cycloheptanol | 256.50 | −2.51 | 250.22 | −6.03 | 265.30 |
| 2-Methyl-2-butanol | 256.60 | −3.76 | 247.30 | 10.31 | 221.80 |
| trans-2-Methylcyclohexanol | 258.50 | 1.70 | 262.98 | −1.30 | 266.40 |
| cis-2-Methylcyclohexanol | 258.50 | 3.89 | 268.95 | 1.51 | 264.90 |
| 4-Methyl-2-pentanol | 265.90 | 2.36 | 272.34 | 6.66 | 254.20 |
| 3-Methyl-2-pentanol | 265.90 | 3.62 | 275.89 | 7.93 | 254.00 |
| Cyclohexaneethanol | 266.20 | −0.08 | 266.00 | −12.03 | 298.00 |
| 2-Hexanol | 267.90 | −4.52 | 256.31 | 0.20 | 255.80 |
| 3-Hexanol | 267.90 | 0.51 | 269.27 | 5.49 | 254.50 |
| 1-Heptanol | 275.50 | −0.25 | 274.81 | −4.84 | 288.10 |
| 1-Methylcyclohexanol | 279.20 | −0.05 | 279.05 | 5.03 | 265.00 |
| 2-Methyl-2-pentanol | 286.70 | 0.81 | 289.03 | 11.84 | 254.80 |
| 3-Methyl-3-pentanol | 286.70 | 2.25 | 293.30 | 13.57 | 253.50 |
| 2,4-Dimethyl-3-pentanol | 294.00 | 5.77 | 312.00 | 8.53 | 285.40 |
| 5-Methyl-2-hexanol | 296.00 | −0.27 | 295.20 | 2.74 | 287.10 |
| Cyclohexanepropanol | 296.20 | −1.09 | 293.00 | −12.70 | 330.20 |
| 2-Heptanol | 297.90 | 0.24 | 298.63 | 3.59 | 287.90 |
| 3-Heptanol | 297.90 | 5.19 | 314.20 | 8.37 | 287.90 |
| 4-Heptanol | 297.90 | 2.89 | 306.77 | 6.15 | 287.90 |
| 2-Ethyl-1-hexanol | 303.60 | 4.38 | 317.50 | −0.28 | 318.40 |
| 2-Methyl-1-heptanol | 303.60 | 3.00 | 313.00 | −2.01 | 319.30 |
| 5-Methyl-1-heptanol | 303.60 | 0.20 | 304.20 | −4.73 | 318.60 |
| 1-Octanol | 305.60 | 2.08 | 312.10 | −2.40 | 319.60 |
| 2-Methyl-2-hexanol | 316.70 | −1.01 | 313.54 | 8.50 | 286.90 |
| 2,5-Dimethyl-3-hexanol | 324.00 | 4.54 | 339.40 | 6.25 | 318.20 |
| 2-Methyl-4-heptanol | 326.00 | 1.75 | 331.80 | 4.01 | 318.50 |
| 4-Methyl-2-heptanol | 326.00 | −4.32 | 312.50 | −1.70 | 317.80 |
| 4-Methyl-3-heptanol | 326.00 | −5.43 | 309.20 | −2.81 | 317.90 |
| 6-Methyl-2-heptanol | 326.00 | −3.46 | 315.10 | −1.30 | 319.20 |
| 6-Methyl-3-heptanol | 326.00 | −4.99 | 310.50 | −2.77 | 319.10 |
| 2-Octanol | 328.00 | 0.64 | 330.10 | 3.00 | 320.20 |
| 3-Octanol | 328.00 | 3.10 | 338.50 | 5.44 | 320.10 |
| 4-Octanol | 328.00 | 1.23 | 332.09 | 3.64 | 320.00 |
| 1-Nonanol | 335.70 | 1.55 | 341.00 | −3.37 | 352.50 |
| 2-Methyl-2-heptanol | 346.80 | −2.73 | 337.60 | 5.45 | 319.20 |
| 4-Methyl-4-heptanol | 346.80 | 5.48 | 366.90 | 13.25 | 318.30 |
| 2-Nonanol | 358.00 | −0.47 | 356.32 | 1.10 | 352.40 |
| 3-Nonanol | 358.00 | 4.18 | 373.63 | 5.71 | 352.30 |
| 4-Nonanol | 358.00 | 2.68 | 367.86 | 4.26 | 352.20 |
| 5-Nonanol | 358.00 | 3.44 | 370.75 | 4.98 | 352.30 |
| 3,7-Dimethyl-1-octanol | 361.80 | 1.47 | 367.21 | −4.05 | 382.10 |
| n-Decyl alcohol | 365.70 | 3.00 | 377.00 | −1.83 | 383.90 |
| 5-Decanol | 388.10 | 4.35 | 405.77 | 5.24 | 384.50 |
| 1-Undecanol | 395.80 | 2.59 | 406.34 | −2.60 | 416.90 |
| 1-Dodecanol | 425.80 | 2.88 | 438.42 | −2.44 | 449.10 |
| 1-Tridecanol | 455.90 | 4.22 | 476.00 | −1.11 | 481.30 |
| Myristyl alcohol | 486.00 | 3.91 | 505.80 | −1.52 | 513.50 |
| 1-Pentadecanol | 516.00 | 3.57 | 535.10 | −1.98 | 545.70 |
| 1-Hexadecanol | 546.10 | −4.26 | 523.80 | −10.33 | 577.90 |
| MAPD | 3.02 | 5.51 |
| Molecule Name | Cp(liq,298) calc. (GA) | Dev. (%) | Cp(liq,298) Exp. | Dev. (%) | Cp(liq,298) Calc.(Vm) |
|---|---|---|---|---|---|
| Cyclopentane | 130.70 | −1.48 | 128.80 | −15.30 | 148.50 |
| Pentane | 164.30 | 1.73 | 167.19 | −0.01 | 167.20 |
| Cyclohexane | 156.80 | 0.82 | 158.10 | −12.14 | 177.30 |
| Hexane | 194.30 | 1.70 | 197.66 | 0.08 | 197.50 |
| Cycloheptane | 183.00 | −1.32 | 180.61 | −13.23 | 204.50 |
| Heptane | 224.40 | 0.41 | 225.33 | −1.10 | 227.80 |
| Cyclooctane | 209.10 | 2.98 | 215.53 | −10.29 | 237.70 |
| Octane | 254.40 | 0.50 | 255.68 | −0.99 | 258.20 |
| Molecule Name | Cp(liq,298) GA-Calc. | Dev. (%) | Cp(liq,298) Exp. | Dev. (%) | Cp(liq,298) Vm-Calc. |
|---|---|---|---|---|---|
| 1-Ethyl-3-methylimidazolium bromide | 256.40 | 3.17 | 264.80 | 3.29 | 256.10 |
| 1-Propyl-3-methylimidazolium bromide | 286.50 | −1.81 | 281.40 | −1.92 | 286.80 |
| 1-Ethyl-3-methylimidazolium thiocyanate | 300.00 | −6.59 | 281.45 | −4.96 | 295.40 |
| 1-Ethyl-3-methylimidazolium acetate | 321.10 | 0.25 | 321.90 | 7.86 | 296.60 |
| 1-Ethyl-3-methylimidazolium tetrafluoroborate | 307.60 | 0.16 | 308.10 | 1.95 | 302.10 |
| 1,3-Dimethylimidazolium methosulfate | 326.20 | 4.34 | 341.00 | 10.50 | 305.20 |
| 1-Butyl-3-methylimidazolium chloride | 316.50 | 0.16 | 317.00 | 3.63 | 305.50 |
| 1-Ethyl-3-methylimidazolium dicyanamide | 313.00 | 0.52 | 314.64 | −0.08 | 314.90 |
| 1-Butyl-3-methylimidazolium bromide | 316.50 | 0.06 | 316.70 | −0.38 | 317.90 |
| N-Methyl-2-hydroxyethylammonium propionate | 333.30 | −1.62 | 328.00 | 2.10 | 321.10 |
| 1-Ethyl-3-methylimidazolium methanesulfonate | 345.40 | 0.03 | 345.50 | 6.80 | 322.00 |
| 1-Ethyltetrahydrothiophenium dicyanamide | 339.60 | −1.26 | 335.38 | 1.34 | 330.90 |
| 1-Ethyl-3-methylimidazolium methylsulfate | 353.70 | −3.72 | 341.00 | 0.67 | 338.70 |
| 1-Ethyl-3-methylimidazolium hexafluorophosphate | 353.00 | −2.74 | 343.60 | 0.67 | 341.30 |
| 1-Butyl-3-methylimidazolium iodide | 316.50 | −0.80 | 314.00 | −8.82 | 341.70 |
| 1-Benzyl-3-methylimidazolium chloride | 341.00 | −0.47 | 339.40 | −1.30 | 343.80 |
| 1-Ethylpyridinium triflate | 348.70 | 0.88 | 351.80 | 0.71 | 349.30 |
| 1-Ethyl-3-methylimidazolium trifluoromethylsulfonate | 363.80 | −0.28 | 362.80 | 3.64 | 349.60 |
| N-Methyl-2-hydroxyethylammonium butanoate | 363.40 | −0.66 | 361.00 | 2.13 | 353.30 |
| 1-Butyl-3-methylimidazolium thiocyanate | 360.20 | 6.44 | 385.00 | 7.53 | 356.00 |
| 1-Butyl-3-methylimidazolium acetate | 381.20 | 0.52 | 383.20 | 6.16 | 359.60 |
| 1-Butyl-3-methylimidazolium tetrafluoroborate | 367.70 | −0.79 | 364.80 | 0.63 | 362.50 |
| 1-Ethyl-3-methylimidazolium ethosulfate | 383.30 | −1.40 | 378.00 | 2.99 | 366.70 |
| 1-Propyl-3-methylimidazolium hexafluorophosphate | 383.00 | −2.30 | 374.40 | 0.64 | 372.00 |
| 1-Butyl-3-methylimidazolium dicyanoamide | 373.10 | −2.22 | 365.00 | −2.19 | 373.00 |
| 1-Butyl-3-methylimidazolium trifluoroacetate | 411.10 | −0.71 | 408.20 | 5.66 | 385.10 |
| N-Methyl-2-hydroxyethylammonium pentanoate | 393.40 | 1.90 | 401.00 | 3.87 | 385.50 |
| 1-Butyltetrahydrothiophenium dicyanamide | 399.70 | −1.14 | 395.19 | 0.96 | 391.40 |
| 1-Butyl-3-methylpyridinium tetrafluoroborate | 379.20 | 2.27 | 388.00 | −1.26 | 392.90 |
| 1-Ethyl-3-methylpyridinium ethylsulfate | 394.70 | −1.47 | 389.00 | −2.08 | 397.10 |
| 1-Butyl-3-methylimidazolium methosulfate | 413.80 | 0.53 | 416.00 | 4.50 | 397.30 |
| 1-Benzyl-3-methylimidazolium tetrafluoroborate | 392.20 | −1.21 | 387.50 | −3.23 | 400.00 |
| 1-Butyl-3-methylimidazolium hexafluorophosphate | 413.10 | −1.32 | 407.70 | 1.37 | 402.10 |
| 1-Butyl-1-methylpyrrolidinium dicyanamide | 397.80 | 3.68 | 413.00 | 1.86 | 405.30 |
| 1-Butyl-3-methylimidazolium trifluoromethylsulfonate | 423.90 | −1.65 | 417.00 | 1.75 | 409.70 |
| 1-Hexyl-3-methylimidazolium tetrafluoroborate | 427.90 | −2.86 | 416.00 | −1.32 | 421.50 |
| 1-Pentyl-3-methylimidazolium hexafluorophosphate | 443.10 | −1.30 | 437.40 | 1.03 | 432.90 |
| 1-Butyl-1-methylpyrrolidinium trifluoromethanesulfonate | 448.70 | −3.15 | 435.00 | −0.55 | 437.40 |
| 1-Ethyl-3-methylimidazolium toluenesulfonate | 486.30 | −0.43 | 484.20 | 6.84 | 451.10 |
| 1-Hexyl-3-methylimidazolium trifluoromethylsulfonate | 484.00 | 3.64 | 502.30 | 6.43 | 470.00 |
| 1-Octyl-3-methylimidazolium tetrafluoroborate | 488.00 | 2.01 | 498.00 | 2.99 | 483.10 |
| 1-Ethyl-3-methylimidazolium bis(trifluoromethanesulfonyl) amide | 506.70 | −1.34 | 500.00 | 3.36 | 483.20 |
| N-Ethylpyridinium bis(trifluoromethylsulfonyl)amide | 491.50 | 2.12 | 502.15 | 2.98 | 487.20 |
| 1-Ethyl-3-methylimidazolium 2-(2-methoxyethoxy)ethylsulfate | 530.50 | −0.86 | 526.00 | 6.29 | 492.90 |
| 1-Heptyl-3-methylimidazolium hexafluorophosphate | 503.30 | −0.54 | 500.60 | 1.34 | 493.90 |
| 1-Isopropyl-3-methylimidazolium bis(trifluoromethanesulfonyl) amide | 535.20 | −1.00 | 529.90 | 3.25 | 512.70 |
| 1-Propyl-3-methylimidazolium bis(trifluoromethanesulfonyl) amide | 536.70 | −0.34 | 534.90 | 4.08 | 513.10 |
| 1-Butyl-3-methylimidazolium toluenesulfonate | 546.40 | 0.36 | 548.40 | 6.20 | 514.40 |
| N-Ethyl-2-methylpyridinium bis(trifluoromethylsulfonyl)amide | 535.30 | −0.15 | 534.50 | 3.55 | 515.50 |
| 1-Octyl-3-methylimidazolium hexafluorophosphate | 533.30 | 0.52 | 536.10 | 2.16 | 524.50 |
| 1-Cyclopropylmethyl-3-methylimidazolium bis(trifluoromethanesulfonyl) amide | 551.50 | −2.30 | 539.10 | 1.21 | 532.60 |
| Trimethyl butylammonium bis(trifluoromethylsulfonyl)amide | 561.10 | −0.34 | 559.20 | 4.02 | 536.70 |
| 1,2-Diethylpyridinium bis(trifluoromethanesulfonyl) amide | 565.40 | 0.12 | 566.10 | 4.82 | 538.80 |
| 1-Butyl-3-methylimidazolium bis(trifluoromethanesulfonyl) amide | 566.80 | −0.16 | 565.90 | 4.22 | 542.00 |
| 1-sec-Butyl-3-methylimidazolium bis(trifluoromethanesulfonyl) amide | 565.30 | −1.47 | 557.10 | 2.64 | 542.40 |
| 1-Methyl-1-propylpyrrolidinium bis(trifluoromethanesulfonyl) amide | 561.50 | −1.35 | 554.00 | 1.93 | 543.30 |
| 1-Isobutyl-3-methylimidazolium bis(trifluoromethanesulfonyl) amide | 564.80 | −1.38 | 557.10 | 2.48 | 543.30 |
| N-Propyl-2-methylpyridinium bis(trifluoromethylsulfonyl)amide | 565.40 | −1.33 | 557.96 | 2.18 | 545.80 |
| N-Butylpyridinium bis(trifluoromethanesulfonyl) amide | 551.60 | 2.63 | 566.52 | 3.50 | 546.70 |
| 1-Nonyl-3-methylimidazolium hexafluorophosphate | 563.40 | 1.05 | 569.40 | 2.79 | 553.50 |
| N-Octylisoquinolinium thiocyanate | 528.30 | −1.21 | 522.00 | −6.88 | 557.90 |
| 1-Butyltetrahydrothiophenium bis(trifluoromethylsulfonyl) amide | 593.40 | 0.44 | 596.00 | 6.12 | 559.50 |
| N-Ethyl-4-dimethylaminopyridinium bis(trifluoromethanesulfonyl) amide | 591.20 | 0.52 | 594.30 | 4.37 | 568.30 |
| 1-Pentyl-3-methylimidazolium bis(trifluoromethanesulfonyl) amide | 596.90 | −0.22 | 595.60 | 4.08 | 571.30 |
| 1-Ethyl-2-propylpyridinium bis(trifluoromethanesulfonyl) amide | 595.40 | −0.25 | 593.90 | 3.25 | 574.60 |
| 1-Isobutyl-1-methylpyrrolidinium bis(trifluoromethylsulfonyl)amide | 589.60 | −1.27 | 582.20 | 1.03 | 576.20 |
| 1-Isobutyl-3-methylpyridinium bis(trifluoromethylsulfonyl)amide | 576.30 | 0.47 | 579.00 | 0.40 | 576.70 |
| N-Butyl-3-methylpyridinium bis(trifluoromethylsulfonyl)amide | 578.20 | −0.02 | 578.10 | 0.14 | 577.30 |
| 1-Butyl-1-methylpyrrolidinium bis(trifluoromethylsulfonyl)amide | 591.50 | −3.41 | 572.00 | −1.05 | 578.00 |
| 1-Butyl-3-cyanopyridinium bis(trifluoromethylsulfonyl)amide | 590.00 | −0.68 | 586.00 | 1.11 | 579.50 |
| 1-Benzyl-3-methylimidazolium bis(trifluoromethylsulfonyl) amide | 591.20 | 2.73 | 607.80 | 4.34 | 581.40 |
| 1-Decyl-3-methylimidazolium hexafluorophosphate | 593.40 | 1.64 | 603.30 | 3.03 | 585.00 |
| 1-Pentyltetrahydrothiophenium bis(trifluoromethylsulfonyl) amide | 623.50 | 0.56 | 627.00 | 6.19 | 588.20 |
| 1-Hexyl-3-methylimidazolium bis(trifluoromethanesulfonyl) amide | 626.90 | 0.37 | 629.20 | 4.04 | 603.80 |
| 1-Butyl-1-methylpiperidinium bis(trifluoromethylsulfonyl)amide | 617.70 | −1.68 | 607.50 | 0.23 | 606.10 |
| 1-Ethyl-2-butylpyridinium bis(trifluoromethanesulfonyl) amide | 625.50 | −0.30 | 623.60 | 2.79 | 606.20 |
| N-Hexylpyridinium bis(trifluoromethanesulfonyl) amide | 611.80 | 0.03 | 612.00 | 0.83 | 606.90 |
| 1-Methyl-1-pentylpyrrolidinium bis(trifluoromethanesulfonyl) amide | 621.60 | 0.16 | 622.60 | 2.28 | 608.40 |
| 1-Butyl-3-methylimidazolium octylsulfate | 623.80 | 1.76 | 635.00 | 3.92 | 610.10 |
| 1-Cyclohexylmethyl-3-methylimidazolium bis(trifluoromethanesulfonyl) amide | 617.50 | −0.06 | 617.10 | 0.26 | 615.50 |
| 1-Hexyltetrahydrothiophenium bis(trifluoromethylsulfonyl) amide | 653.60 | −1.18 | 646.00 | 4.30 | 618.20 |
| N-Butyl-4-dimethylaminopyridinium bis(trifluoromethanesulfonyl) amide | 651.40 | 0.96 | 657.71 | 4.71 | 626.70 |
| 1-Heptyl-3-methylimidazolium bis(trifluoromethanesulfonyl) amide | 657.00 | 0.33 | 659.20 | 4.31 | 630.80 |
| 1-Ethyl-2-pentylpyridinium bis(trifluoromethanesulfonyl) amide | 655.60 | −0.44 | 652.70 | 2.47 | 636.60 |
| 1-Hexyl-3-methylpyridinium bis(trifluoromethylsulfonyl)amide | 638.30 | −2.29 | 624.00 | −2.20 | 637.70 |
| 1-Hexyl-1-methylpyrrolidinium bis(trifluoromethanesulfonyl) amide | 651.70 | 0.52 | 655.10 | 2.49 | 638.80 |
| 1-Hexyl-4-cyanopyridinium bis(trifluoromethylsulfonyl)amide | 650.10 | −2.70 | 633.00 | −1.04 | 639.60 |
| 1-Hexyl-3-cyanopyridinium bis(trifluoromethylsulfonyl)amide | 650.10 | 1.20 | 658.00 | 2.78 | 639.70 |
| 1-Dodecyl-3-methylimidazolium hexafluorophosphate | 653.60 | 1.91 | 666.30 | 2.97 | 646.50 |
| 1-Heptyltetrahydrothiophenium bis(trifluoromethylsulfonyl) amide | 683.60 | 0.20 | 685.00 | 5.37 | 648.20 |
| 1-Octyl-3-methylimidazolium bis(trifluoromethanesulfonyl) amide | 687.10 | 0.45 | 690.20 | 3.80 | 664.00 |
| 1-Methyl-1-heptylpyrrolidinium bis(trifluoromethanesulfonyl) amide | 681.70 | 0.50 | 685.10 | 2.96 | 664.80 |
| 1-Octylpyridinium bis(trifluoromethylsulfonyl)amide | 671.90 | 2.06 | 686.00 | 2.93 | 665.90 |
| 1-Ethyl-2-hexylpyridinium bis(trifluoromethanesulfonyl) amide | 685.60 | −0.01 | 685.50 | 2.68 | 667.10 |
| 1-Octyltetrahydrothiophenium bis(trifluoromethylsulfonyl) amide | 713.70 | 0.74 | 719.00 | 5.63 | 678.50 |
| 1-(3,4,5,6-Perfluorohexyl)-3-methylimidazolium-3-methylimidazolium bis(trifluoromethanesulfonyl) amide | 719.30 | 0.79 | 725.00 | 6.40 | 678.60 |
| 4-Dimethylamino-1-hexylpyridinium bis(trifluoromethanesulfonyl) amide | 711.50 | 2.67 | 731.00 | 5.99 | 687.20 |
| 1-Ethyl-2-heptylpyridinium bis(trifluoromethanesulfonyl) amide | 715.70 | 0.25 | 717.50 | 2.80 | 697.40 |
| 1-Methyl-1-octylpyrrolidinium bis(trifluoromethanesulfonyl) amide | 711.80 | 0.63 | 716.30 | 2.36 | 699.40 |
| 1-Octyl-3-cyanopyridinium bis(trifluoromethylsulfonyl)amide | 710.20 | −0.17 | 709.00 | 1.26 | 700.10 |
| N-Hexyl-3-methyl-4-dimethylaminopyridinium bis(trifluoromethanesulfonyl) amide | 738.10 | −1.81 | 725.00 | 1.94 | 710.90 |
| 1-Nonyltetrahydrothiophenium bis(trifluoromethylsulfonyl) amide | 743.70 | −0.36 | 741.00 | 4.01 | 711.30 |
| Butyl 1-butylnicotinate bis(trifluoromethylsulfonyl)amide | 728.90 | −3.10 | 707.00 | −0.91 | 713.40 |
| 1-Decyl-3-methylimidazolium bis(trifluoromethanesulfonyl) amide | 747.20 | 1.01 | 754.80 | 4.03 | 724.40 |
| 1-Ethyl-2-octylpyridinium bis(trifluoromethanesulfonyl) amide | 745.70 | 0.49 | 749.40 | 3.26 | 725.00 |
| 1-Methyl-3-menthyloxymethylimidazolium bis(trifluoromethylsulfonyl)imide | 785.90 | −0.58 | 781.40 | 4.20 | 748.60 |
| 1-Ethyl-2-nonylpyridinium bis(trifluoromethanesulfonyl) amide | 775.80 | 0.35 | 778.50 | 3.48 | 751.40 |
| 1-Methyl-1-decylpyrrolidinium bis(trifluoromethanesulfonyl) amide | 771.90 | 0.90 | 778.90 | 2.40 | 760.20 |
| 1-Ethyl-3-menthyloxymethylimidazolium bis(trifluoromethylsulfonyl)imide | 813.40 | 0.61 | 818.40 | 4.55 | 781.20 |
| 1-Dodecyl-3-methylimidazolium bis(trifluoromethanesulfonyl) amide | 807.30 | 1.57 | 820.20 | 4.04 | 787.10 |
| 1-Ethyl-2-decylpyridinium bis(trifluoromethanesulfonyl) amide | 805.80 | 0.67 | 811.20 | 2.79 | 788.60 |
| 1-Propyl-3-menthyloxymethylimidazolium bis(trifluoromethylsulfonyl)imide | 843.50 | −0.49 | 839.40 | 3.71 | 808.30 |
| 1-Butyl-3-menthyloxymethylimidazolium bis(trifluoromethylsulfonyl)imide | 873.50 | –0.84 | 866.20 | 3.20 | 838.50 |
| 1-Pentyl-3-menthyloxymethylimidazolium bis(trifluoromethylsulfonyl)imide | 903.60 | 0.15 | 905.00 | 3.55 | 872.90 |
| 1-Hexyl-3-menthyloxymethylimidazolium bis(trifluoromethylsulfonyl)imide | 933.70 | 1.15 | 944.60 | 4.74 | 899.80 |
| 1-Heptyl-3-menthyloxymethylimidazolium bis(trifluoromethylsulfonyl)imide | 963.70 | –0.33 | 960.50 | 3.25 | 929.30 |
| 1-Octyl-3-menthyloxymethylimidazolium bis(trifluoromethylsulfonyl)imide | 993.80 | 0.12 | 995.00 | 3.59 | 959.30 |
| 1-Nonyl-3-menthyloxymethylimidazolium bis(trifluoromethylsulfonyl)imide | 1023.80 | −0.02 | 1023.60 | 2.83 | 994.60 |
| 1-Decyl-3-menthyloxymethylimidazolium bis(trifluoromethylsulfonyl)imide | 1053.90 | –0.76 | 1045.90 | 2.31 | 1021.70 |
| 1-Undecyl-3-menthyloxymethylimidazolium bis(trifluoromethylsulfonyl)imide | 1084.00 | 0.40 | 1088.30 | 3.55 | 1049.70 |
| 1-Dodecyl-3-menthyloxymethylimidazolium bis(trifluoromethylsulfonyl)imide | 1114.00 | 0.35 | 1117.90 | 2.85 | 1086.00 |
| Tetradecyl trihexylphosphonium bis(trifluoromethylsulfonyl)amide | 1312.10 | −1.02 | 1298.80 | −1.35 | 1316.30 |
| MAPD | 1.13 | 3.08 |
| Entry | Atom Type | Neighbours | Contribution | Occurrences | Molecules |
|---|---|---|---|---|---|
| 1 | B(-) | F4 | 2.99 | 1 | 1 |
| 2 | C sp3 | H3C | 37.12 | 569 | 246 |
| 3 | C sp3 | H3N | 101.28 | 50 | 34 |
| 4 | C sp3 | H3N(+) | 99.59 | 7 | 4 |
| 5 | C sp3 | H3O | 68.06 | 51 | 35 |
| 6 | C sp3 | H3S | 45.85 | 3 | 3 |
| 7 | C sp3 | H3P | 131.12 | 1 | 1 |
| 8 | C sp3 | H3Si | 59.18 | 14 | 5 |
| 9 | C sp3 | H2C2 | 25.45 | 1427 | 249 |
| 10 | C sp3 | H2CN | 82.72 | 89 | 56 |
| 11 | C sp3 | H2CN(+) | 81.35 | 19 | 15 |
| 12 | C sp3 | H2CO | 64.67 | 210 | 108 |
| 13 | C sp3 | H2CS | 72.27 | 22 | 12 |
| 14 | C sp3 | H2CF | 53.68 | 4 | 1 |
| 15 | C sp3 | H2CCl | 50.12 | 4 | 1 |
| 16 | C sp3 | H2CBr | 54.73 | 5 | 2 |
| 17 | C sp3 | H2CJ | 52.94 | 4 | 1 |
| 18 | C sp3 | H2CSi | 63.12 | 1 | 1 |
| 19 | C sp3 | H2N2 | 134.39 | 13 | 3 |
| 20 | C sp3 | H2O2 | 108.47 | 12 | 3 |
| 21 | C sp3 | H2S2 | −6.67 | 3 | 3 |
| 22 | C sp3 | HC3 | 11.92 | 164 | 73 |
| 23 | C sp3 | HC2N | 72.94 | 28 | 23 |
| 24 | C sp3 | HC2N(+) | 70.74 | 29 | 28 |
| 25 | C sp3 | HC2O | 51.84 | 161 | 63 |
| 26 | C sp3 | HC2S | 47.22 | 4 | 2 |
| 27 | C sp3 | HC2Si | 142.27 | 1 | 1 |
| 28 | C sp3 | HCN2 | 137.04 | 1 | 1 |
| 29 | C sp3 | HCNO | 119.89 | 7 | 5 |
| 30 | C sp3 | HCNS | 116.08 | 2 | 1 |
| 31 | C sp3 | HCO2 | 112.62 | 17 | 14 |
| 32 | C sp3 | HCF2 | 246.8 | 1 | 1 |
| 33 | C sp3 | HCBr2 | 68.67 | 1 | 1 |
| 34 | C sp3 | C4 | −2.17 | 81 | 48 |
| 35 | C sp3 | C3N | 62.09 | 11 | 9 |
| 36 | C sp3 | C3N(+) | 19.23 | 2 | 2 |
| 37 | C sp3 | C3O | 27.59 | 10 | 10 |
| 38 | C sp3 | C3Cl | 78.13 | 1 | 1 |
| 39 | C sp3 | C3Br | 44.34 | 1 | 1 |
| 40 | C sp3 | C2NO | 89.86 | 1 | 1 |
| 41 | C sp3 | C2O2 | 91.75 | 6 | 5 |
| 42 | C sp3 | C2S2 | 43.86 | 5 | 2 |
| 43 | C sp3 | CF3 | 69.89 | 2 | 2 |
| 44 | C sp3 | CSF2 | 0 | 1 | 1 |
| 45 | C sp3 | CCl3 | 92.28 | 4 | 3 |
| 46 | C sp2 | H2=C | 39.96 | 6 | 6 |
| 47 | C sp2 | HC=C | 16.95 | 109 | 65 |
| 48 | C sp2 | HC=N | 99.99 | 13 | 13 |
| 49 | C sp2 | HC=O | 43.05 | 14 | 12 |
| 50 | C sp2 | H=CN | 33.94 | 25 | 17 |
| 51 | C sp2 | H=CO | 41.99 | 3 | 3 |
| 52 | C sp2 | H=CS | 36.19 | 7 | 5 |
| 53 | C sp2 | H=CCl | 19.44 | 1 | 1 |
| 54 | C sp2 | HN=N | 102.56 | 17 | 14 |
| 55 | C sp2 | HN=O | 28.91 | 4 | 3 |
| 56 | C sp2 | H=NO | 112.57 | 1 | 1 |
| 57 | C sp2 | C2=C | 5.77 | 29 | 22 |
| 58 | C sp2 | C2=N | 95.44 | 14 | 10 |
| 59 | C sp2 | C2=N(+) | −9.61 | 2 | 2 |
| 60 | C sp2 | C=CN | 18.4 | 16 | 15 |
| 61 | C sp2 | C2=O | 27.68 | 44 | 30 |
| 62 | C sp2 | C=CO | 25.28 | 15 | 13 |
| 63 | C sp2 | C=CS | 29.08 | 5 | 4 |
| 64 | C sp2 | C=CCl | 35.2 | 6 | 3 |
| 65 | C sp2 | =CN2 | 38.93 | 14 | 14 |
| 66 | C sp2 | =CN2(+) | 78.32 | 7 | 7 |
| 67 | C sp2 | CN=N | 87.15 | 19 | 13 |
| 68 | C sp2 | CN=N(+) | 118.23 | 2 | 1 |
| 69 | C sp2 | CN=O | 37.33 | 131 | 92 |
| 70 | C sp2 | =CNO | 55.09 | 1 | 1 |
| 71 | C sp2 | CN=S | 46.51 | 3 | 3 |
| 72 | C sp2 | CO=O | 51.25 | 208 | 155 |
| 73 | C sp2 | CO=O(-) | 15.25 | 41 | 40 |
| 74 | C sp2 | C=OCl | 61.46 | 2 | 1 |
| 75 | C sp2 | =CS2 | 45.53 | 12 | 2 |
| 76 | C sp2 | N2=N | 113.97 | 5 | 3 |
| 77 | C sp2 | N2=O | 55.72 | 43 | 38 |
| 78 | C sp2 | N=NO | 91.56 | 1 | 1 |
| 79 | C sp2 | N2=S | 67.02 | 7 | 7 |
| 80 | C sp2 | N=NS | 105.95 | 7 | 7 |
| 81 | C sp2 | NO=O | 63.43 | 8 | 8 |
| 82 | C sp2 | NO=S | 64.85 | 3 | 3 |
| 83 | C sp2 | =NOS | 108.01 | 1 | 1 |
| 84 | C sp2 | NS=S | 62.46 | 4 | 3 |
| 85 | C sp2 | O2=O | 58.47 | 5 | 5 |
| 86 | C sp2 | OS=S | 63.23 | 1 | 1 |
| 87 | C aromatic | H:C2 | 17.96 | 3232 | 437 |
| 88 | C aromatic | H:C:N | 24.16 | 37 | 20 |
| 89 | C aromatic | H:C:N(+) | 21.47 | 2 | 1 |
| 90 | C aromatic | H:N2 | 7.08 | 3 | 3 |
| 91 | C aromatic | :C3 | 8.04 | 171 | 57 |
| 92 | C aromatic | C:C2 | 6.56 | 699 | 307 |
| 93 | C aromatic | C:C:N | 5.85 | 13 | 9 |
| 94 | C aromatic | :C2N | 24.29 | 172 | 107 |
| 95 | C aromatic | :C2N(+) | 49.48 | 57 | 42 |
| 96 | C aromatic | :C2:N | 19.63 | 13 | 7 |
| 97 | C aromatic | :C2O | 29.21 | 184 | 113 |
| 98 | C aromatic | :C2P | 15.1 | 6 | 2 |
| 99 | C aromatic | :C2S | 27.43 | 43 | 28 |
| 100 | C aromatic | :C2Si | 58.51 | 53 | 12 |
| 101 | C aromatic | :C2F | 31.08 | 25 | 9 |
| 102 | C aromatic | :C2Cl | 34.35 | 57 | 25 |
| 103 | C aromatic | :C2Br | 37.48 | 18 | 9 |
| 104 | C aromatic | :C2J | 48.49 | 5 | 3 |
| 105 | C aromatic | C:N2 | 18.81 | 3 | 1 |
| 106 | C aromatic | :CN:N | 39.03 | 7 | 5 |
| 107 | C aromatic | :C:NO | 53.92 | 1 | 1 |
| 108 | C aromatic | :C:NCl | 49.04 | 3 | 3 |
| 109 | C aromatic | N:N2 | 36.22 | 4 | 2 |
| 110 | C aromatic | :N2O | 40.81 | 3 | 1 |
| 111 | C(+) aromatic | H:N2 | −39.63 | 3 | 3 |
| 112 | C(+) aromatic | :N3 | −20.94 | 2 | 2 |
| 113 | C sp | H#C | 103.03 | 2 | 1 |
| 114 | C sp | C#C | 14.95 | 8 | 3 |
| 115 | C sp | C#N | 39.64 | 28 | 20 |
| 116 | C sp | C#N(+) | 62.56 | 1 | 1 |
| 117 | C sp | #CSi | 0 | 2 | 1 |
| 118 | C sp | #NO | 58.07 | 2 | 1 |
| 119 | C sp | =N=O | 110.98 | 6 | 3 |
| 120 | N sp3 | H2C | −18.62 | 5 | 5 |
| 121 | N sp3 | H2C(pi) | 15.49 | 129 | 98 |
| 122 | N sp3 | H2N | 9.51 | 4 | 3 |
| 123 | N sp3 | H2S | 45.92 | 9 | 9 |
| 124 | N sp3 | HC2 | −104.07 | 6 | 3 |
| 125 | N sp3 | HC2(pi) | −56.77 | 78 | 57 |
| 126 | N sp3 | HC2(2pi) | −9.78 | 82 | 61 |
| 127 | N sp3 | HCN(pi) | 21.22 | 7 | 5 |
| 128 | N sp3 | HCN(2pi) | 36.09 | 7 | 7 |
| 129 | N sp3 | C3 | −159.23 | 15 | 10 |
| 130 | N sp3 | C3(pi) | −123.38 | 10 | 9 |
| 131 | N sp3 | C3(2pi) | −83.83 | 27 | 21 |
| 132 | N sp3 | C3(3pi) | −43.15 | 12 | 6 |
| 133 | N sp3 | C2N(pi) | −75.07 | 3 | 3 |
| 134 | N sp3 | C2N(+)(pi) | −52.69 | 7 | 2 |
| 135 | N sp3 | C2N(2pi) | 25.39 | 3 | 3 |
| 136 | N sp3 | C2N(+)(2pi) | −41.18 | 2 | 2 |
| 137 | N sp2 | C=C | −74.59 | 54 | 44 |
| 138 | N sp2 | C=N | 2.46 | 5 | 3 |
| 139 | N sp2 | =CN | −98.01 | 7 | 7 |
| 140 | N sp2 | =CN(+) | −14.76 | 1 | 1 |
| 141 | N sp2 | =CO | −44.63 | 24 | 11 |
| 142 | N sp2 | N=N | 17.43 | 3 | 2 |
| 143 | N aromatic | H2:C(+) | 4.65 | 4 | 2 |
| 144 | N aromatic | HC:C(+) | 40.44 | 1 | 1 |
| 145 | N aromatic | C2:C(+) | −3.11 | 7 | 4 |
| 146 | N aromatic | :C2 | −0.16 | 50 | 33 |
| 147 | N(+) sp3 | H3C | −6.7 | 35 | 34 |
| 148 | N(+) sp3 | H2C2 | −73.79 | 4 | 4 |
| 149 | N(+) sp3 | HC3 | −156.71 | 1 | 1 |
| 150 | N(+) sp3 | C4 | −233.93 | 2 | 2 |
| 151 | N(+) sp2 | CO=O(-) | 9.71 | 72 | 49 |
| 152 | N(+) sp2 | =CO2(-) | −7.42 | 2 | 2 |
| 153 | N(+) sp2 | NO=O(-) | −2.08 | 10 | 5 |
| 154 | N(+) aromatic | C:C2 | 0 | 1 | 1 |
| 155 | N(+) sp | C#C(-) | 25.34 | 3 | 3 |
| 156 | N(+) sp | #CO(-) | 0 | 1 | 1 |
| 157 | O(prim) | HC | −23.36 | 106 | 60 |
| 158 | O(sec) | HC | −16.25 | 117 | 50 |
| 159 | O(tert) | HC | −3.34 | 6 | 6 |
| 160 | O | HC(pi) | 4.78 | 218 | 157 |
| 161 | O | HN(pi) | 16.33 | 3 | 3 |
| 162 | O | HSi | 16.93 | 8 | 2 |
| 163 | O | C2 | −70.39 | 60 | 29 |
| 164 | O | C2(pi) | −39.71 | 125 | 88 |
| 165 | O | C2(2pi) | −23.91 | 47 | 41 |
| 166 | O | CN(2pi) | −28.51 | 5 | 5 |
| 167 | O | CSi | −30.4 | 36 | 9 |
| 168 | O | N2(2pi) | 1.1 | 7 | 4 |
| 169 | O | N2(+)(2pi) | −2.2 | 2 | 2 |
| 170 | O | Si2 | −7.14 | 39 | 8 |
| 171 | P3 | C3 | −2.25 | 1 | 1 |
| 172 | P4 | C3=O | 2.25 | 1 | 1 |
| 173 | P4 | C=OCl2 | 0 | 1 | 1 |
| 174 | S2 | HC | 10.73 | 1 | 1 |
| 175 | S2 | HC(pi) | 16.07 | 5 | 5 |
| 176 | S2 | C2 | −15.43 | 12 | 8 |
| 177 | S2 | C2(pi) | −30.85 | 14 | 6 |
| 178 | S2 | C2(2pi) | −10.04 | 24 | 17 |
| 179 | S2 | CS | −20.66 | 4 | 2 |
| 180 | S2 | CS(pi) | 6.91 | 6 | 3 |
| 181 | S4 | C2=O | 5.33 | 2 | 2 |
| 182 | S4 | C2=O2 | 15.56 | 5 | 5 |
| 183 | S4 | CN=O2 | 2.75 | 9 | 9 |
| 184 | S4 | CO=O2(-) | −118.41 | 1 | 1 |
| 185 | Si | C4 | −197.51 | 3 | 3 |
| 186 | Si | C3O | −100.79 | 4 | 2 |
| 187 | Si | C3Cl | −107.38 | 1 | 1 |
| 188 | Si | C2O2 | −38.26 | 11 | 3 |
| 189 | Si | CO3 | 10.05 | 20 | 3 |
| 190 | Si | CCl3 | 57.89 | 2 | 2 |
| 191 | Si | O4 | 0 | 9 | 9 |
| 192 | (COH)n | n>1 | 3.46 | 145 | 59 |
| 193 | H | H Acceptor | 1.19 | 61 | 43 |
| 194 | Endocyclic bonds | No of single bds | −1.44 | 998 | 149 |
| 195 | Angle60 | 0.97 | 15 | 2 | |
| 196 | Angle90 | 0.31 | 12 | 6 | |
| 197 | Angle102 | 2.16 | 284 | 83 | |
| A | Based on | Valid groups | 126 | 802 | |
| B | Goodness of fit | r2 | 0.9915 | 734 | |
| C | Deviation | Average | 9.36 | 734 | |
| D | Deviation | Standard | 12.21 | 734 | |
| E | K-fold cv | K | 10 | 663 | |
| F | Goodness of fit | q2 | 0.9874 | 663 | |
| G | Deviation | Average (cv) | 11.1 | 663 | |
| H | Deviation | Standard (cv) | 14.23 | 663 |
| Molecule Name | Cp(sol,298) GA-calc | Dev. (%) | Cp(sol,298) exp. | Dev. (%) | Cp(sol,298) Vm−calc. [1] |
|---|---|---|---|---|---|
| 2-Methyl-2-propanol | 135.90 | 6.99 | 146.11 | 18.28 | 119.40 |
| 2,2-Dimethyl-1,3-propanediol | 158.00 | 13.75 | 183.18 | 13.42 | 158.60 |
| Erythritol | 164.20 | −1.42 | 161.90 | 0.99 | 160.30 |
| cis-1,2-Cyclohexanediol | 168.00 | −4.74 | 160.40 | −4.68 | 167.90 |
| trans-1,2-Cyclohexanediol | 168.00 | −2.94 | 163.20 | −3.00 | 168.10 |
| Pentaerythritol | 174.40 | 7.43 | 188.40 | 3.24 | 182.30 |
| Hexamethyleneglycol | 187.90 | 1.11 | 190.00 | 2.47 | 185.30 |
| Xylitol | 206.90 | 0.05 | 207.00 | 10.14 | 186.00 |
| Ethriol | 191.10 | 10.62 | 213.80 | 7.86 | 197.00 |
| Inositol | 223.60 | −2.57 | 218.00 | 0.50 | 216.90 |
| 2-Adamantanol | 193.30 | 6.71 | 207.20 | −6.13 | 219.90 |
| 1-Adamantanol | 195.60 | 0.56 | 196.70 | −12.10 | 220.50 |
| Dulcose | 246.00 | −3.14 | 238.50 | 3.31 | 230.60 |
| Isoborneol | 243.10 | 6.88 | 261.06 | 10.21 | 234.40 |
| Borneol | 243.10 | 6.88 | 261.06 | 9.68 | 235.80 |
| 1,8-Octanediol | 238.90 | −1.07 | 236.36 | −0.23 | 236.90 |
| Sorbitol | 242.30 | −1.38 | 239.00 | 0.50 | 237.80 |
| Menthol | 250.70 | −0.24 | 250.10 | −0.72 | 251.90 |
| 1,9-Nonanediol | 264.30 | −2.94 | 256.74 | −2.36 | 262.80 |
| 1,10-Decanediol | 289.80 | −3.77 | 279.26 | −3.34 | 288.60 |
| 1,11-Undecanediol | 315.20 | −5.85 | 297.79 | −5.58 | 314.40 |
| Tri-t-butylmethanol | 351.80 | −0.34 | 350.60 | 6.36 | 328.30 |
| 1,12-Dodecanediol | 340.70 | −3.17 | 330.23 | −3.05 | 340.30 |
| 1-Tridecanol | 358.60 | 5.13 | 378.00 | 8.41 | 346.20 |
| 1,13-Tridecanediol | 366.20 | 0.19 | 366.88 | 0.21 | 366.10 |
| Myristyl alcohol | 384.00 | 1.03 | 388.00 | 4.28 | 371.40 |
| 1,14-Tetradecanediol | 391.60 | −3.16 | 379.61 | −3.24 | 391.90 |
| 1-Pentadecanol | 409.50 | −2.38 | 400.00 | 0.88 | 396.50 |
| 1,15-Pentadecanediol | 417.10 | −10.50 | 377.45 | −10.66 | 417.70 |
| 1-Hexadecanol | 435.00 | −3.08 | 422.00 | 0.09 | 421.60 |
| 1,16-Hexadecanediol | 442.50 | −3.83 | 426.18 | −4.06 | 443.50 |
| MAPD | 4.00 | 5.16 |
| Molecule Name | Cp(sol,298) GA-Calc. | Dev. (%) | Cp(sol,298) exp. | Dev. (%) | Cp(sol,298) Vm-Calc. [1] |
|---|---|---|---|---|---|
| Nortricyclene | 130.70 | −1.32 | 129.00 | −9.15 | 140.80 |
| Norbornane | 163.80 | −8.48 | 151.00 | 0.93 | 149.60 |
| Bicyclo[2.2.2]octane | 163.80 | −3.87 | 157.69 | −8.44 | 171.00 |
| Adamantane | 183.30 | 3.53 | 190.00 | −5.95 | 201.30 |
| Bicyclo[3.3.3]undecane | 236.10 | −10.74 | 213.20 | −9.19 | 232.80 |
| Diamantane | 222.10 | 0.58 | 223.40 | −17.32 | 262.10 |
| Perhydrophenanthrene | 279.60 | 3.42 | 289.50 | −0.73 | 291.60 |
| Tri-t-butylmethane | 339.50 | 4.31 | 354.80 | 15.30 | 300.50 |
| Cetane | 431.00 | 2.44 | 441.80 | 13.26 | 383.20 |
| Octadecane | 481.90 | 0.77 | 485.64 | 11.70 | 428.80 |
| Docosane | 583.80 | −3.58 | 563.60 | 7.59 | 520.80 |
| 2,11-Dicyclohexyldodecane | 563.40 | −1.09 | 557.30 | 4.65 | 531.40 |
| 1,1-Dicyclohexyldodecane | 565.20 | −0.46 | 562.60 | 5.44 | 532.00 |
| Hexacosane | 685.60 | −3.69 | 661.20 | 7.43 | 612.10 |
| Triacontane | 787.40 | 2.65 | 808.80 | 13.03 | 703.40 |
| Dotriacontane | 838.40 | −4.02 | 806.00 | 7.07 | 749.00 |
| Tetratriacontane | 889.30 | −0.21 | 887.40 | 10.45 | 794.70 |
| Pentatriacontane | 914.70 | 0.13 | 915.90 | 10.74 | 817.50 |
| MAPD | 3.07 | 8.80 |
| Molecule name | Cp(sol,298) GA-calc. | Cp(sol,298) Exp. | Cp(sol,298) Vm-Calc. [1] | ||
|---|---|---|---|---|---|
| Non-Ionic | Zwitter-Ionic | Zwitter-Ionic | Non-Ionic | ||
| Glycine | 120.20 | 89.90 | 99.30 | 95.90 | 91.30 |
| Alanine | 147.60 | 116.50 | 119.90 | 118.50 | 116.10 |
| N-Methylglycine | 136.00 | 122.40 | 118.20 | 119.10 | 116.90 |
| Serine | 152.70 | 121.70 | 135.60 | 126.20 | 126.50 |
| Aminobutyric acid | 173.00 | 142.00 | 146.40 | 140.90 | 140.70 |
| Proline | 162.20 | 137.30 | 150.40 | 149.80 | 150.90 |
| Threonine | 183.00 | 152.00 | 155.31 | 153.30 | 154.70 |
| Aspartic acid | 193.00 | 162.00 | 155.18 | 155.10 | 156.00 |
| Asparagine | 189.80 | 158.70 | 159.80 | 157.60 | 159.30 |
| Valine | 196.70 | 165.60 | 165.00 | 162.90 | 165.40 |
| 5-Aminopentanoic acid | 196.60 | 166.30 | 163.70 | 164.30 | 166.60 |
| Ornithine | 225.40 | 194.40 | 191.20 | 179.20 | 183.60 |
| Glutamine | 214.00 | 183.00 | 184.18 | 182.30 | 186.50 |
| Leucine | 222.10 | 191.10 | 200.80 | 183.90 | 188.20 |
| Isoleucine | 222.10 | 191.10 | 188.28 | 184.70 | 189.90 |
| Methionine | 238.50 | 207.40 | 205.16 | 189.10 | 194.30 |
| N-Phenylglycine | 196.10 | 162.20 | 177.40 | 194.60 | 198.60 |
| Phenylalanine | 232.20 | 201.10 | 203.10 | 215.50 | 221.60 |
| 8-Aminooctanoic acid | 273.00 | 242.70 | 251.70 | 232.80 | 241.90 |
| Tyrosine | 248.20 | 217.10 | 216.44 | 236.20 | 238.10 |
| Tryptophane | 268.30 | 237.20 | 238.15 | 252.00 | 263.90 |
© 2020 by the author. Licensee MDPI, Basel, Switzerland. This article is an open access article distributed under the terms and conditions of the Creative Commons Attribution (CC BY) license (http://creativecommons.org/licenses/by/4.0/).
Share and Cite
Naef, R. Calculation of the Isobaric Heat Capacities of the Liquid and Solid Phase of Organic Compounds at 298.15K by Means of the Group-Additivity Method. Molecules 2020, 25, 1147. https://doi.org/10.3390/molecules25051147
Naef R. Calculation of the Isobaric Heat Capacities of the Liquid and Solid Phase of Organic Compounds at 298.15K by Means of the Group-Additivity Method. Molecules. 2020; 25(5):1147. https://doi.org/10.3390/molecules25051147
Chicago/Turabian StyleNaef, Rudolf. 2020. "Calculation of the Isobaric Heat Capacities of the Liquid and Solid Phase of Organic Compounds at 298.15K by Means of the Group-Additivity Method" Molecules 25, no. 5: 1147. https://doi.org/10.3390/molecules25051147
APA StyleNaef, R. (2020). Calculation of the Isobaric Heat Capacities of the Liquid and Solid Phase of Organic Compounds at 298.15K by Means of the Group-Additivity Method. Molecules, 25(5), 1147. https://doi.org/10.3390/molecules25051147