1. Introduction
Psidium guajava, an important
Myrtaceae family plant cultivated in tropical and subtropical regions, is widely used as food crop and folk medicine around the world [
1].
P. guajava has been planted in southern China, including Guangxi, Guangdong and Fujian provinces [
2]. Current pharmacological studies revealed that
P. guajava displayed a broad spectrum of pharmacologic activities, such as anti-diabetes [
3], anti-cancer [
4,
5], anti-diarrhea [
6], anti-oxidation [
7], gastro [
8] and liver protection [
9] and anti-inflammation [
10]. The leaves and fruits of
P. guajava have been widely used for the treatment of diabetes and obesity in East Asia. The
P. guajava leaf extract was approved as an antidiabetic agent in Korea [
11]. Triterpenoids are the major components in the leaf of
P. guajava. The total triterpenoids could ameliorate the development of diabetic peripheral neuropathy in rats, and improved insulin resistance in 3T3-L1 adipocytes [
12,
13]. Corosolic acid, the major triterpenoid in the leaf, is a very potent α-glucosidase inhibitor. Some herbs containing corosolic acid such as banaba have been used as antidiabetics [
14]. Many corosolic derivatives also showed
α-glucosidase inhibitory activities. The α-glucosidase, secreted in small intestine, hydrolyzes the carbohydrate into glucose before absorption into the blood stream. The inhibition of α-glucosidase retards the breakdown of carbohydrates and reduces the postprandial glycemia surge, which is beneficial for the treatment of diabetes [
15].
Up to now, dozens of terpenoids have been isolated from
P. guajava [
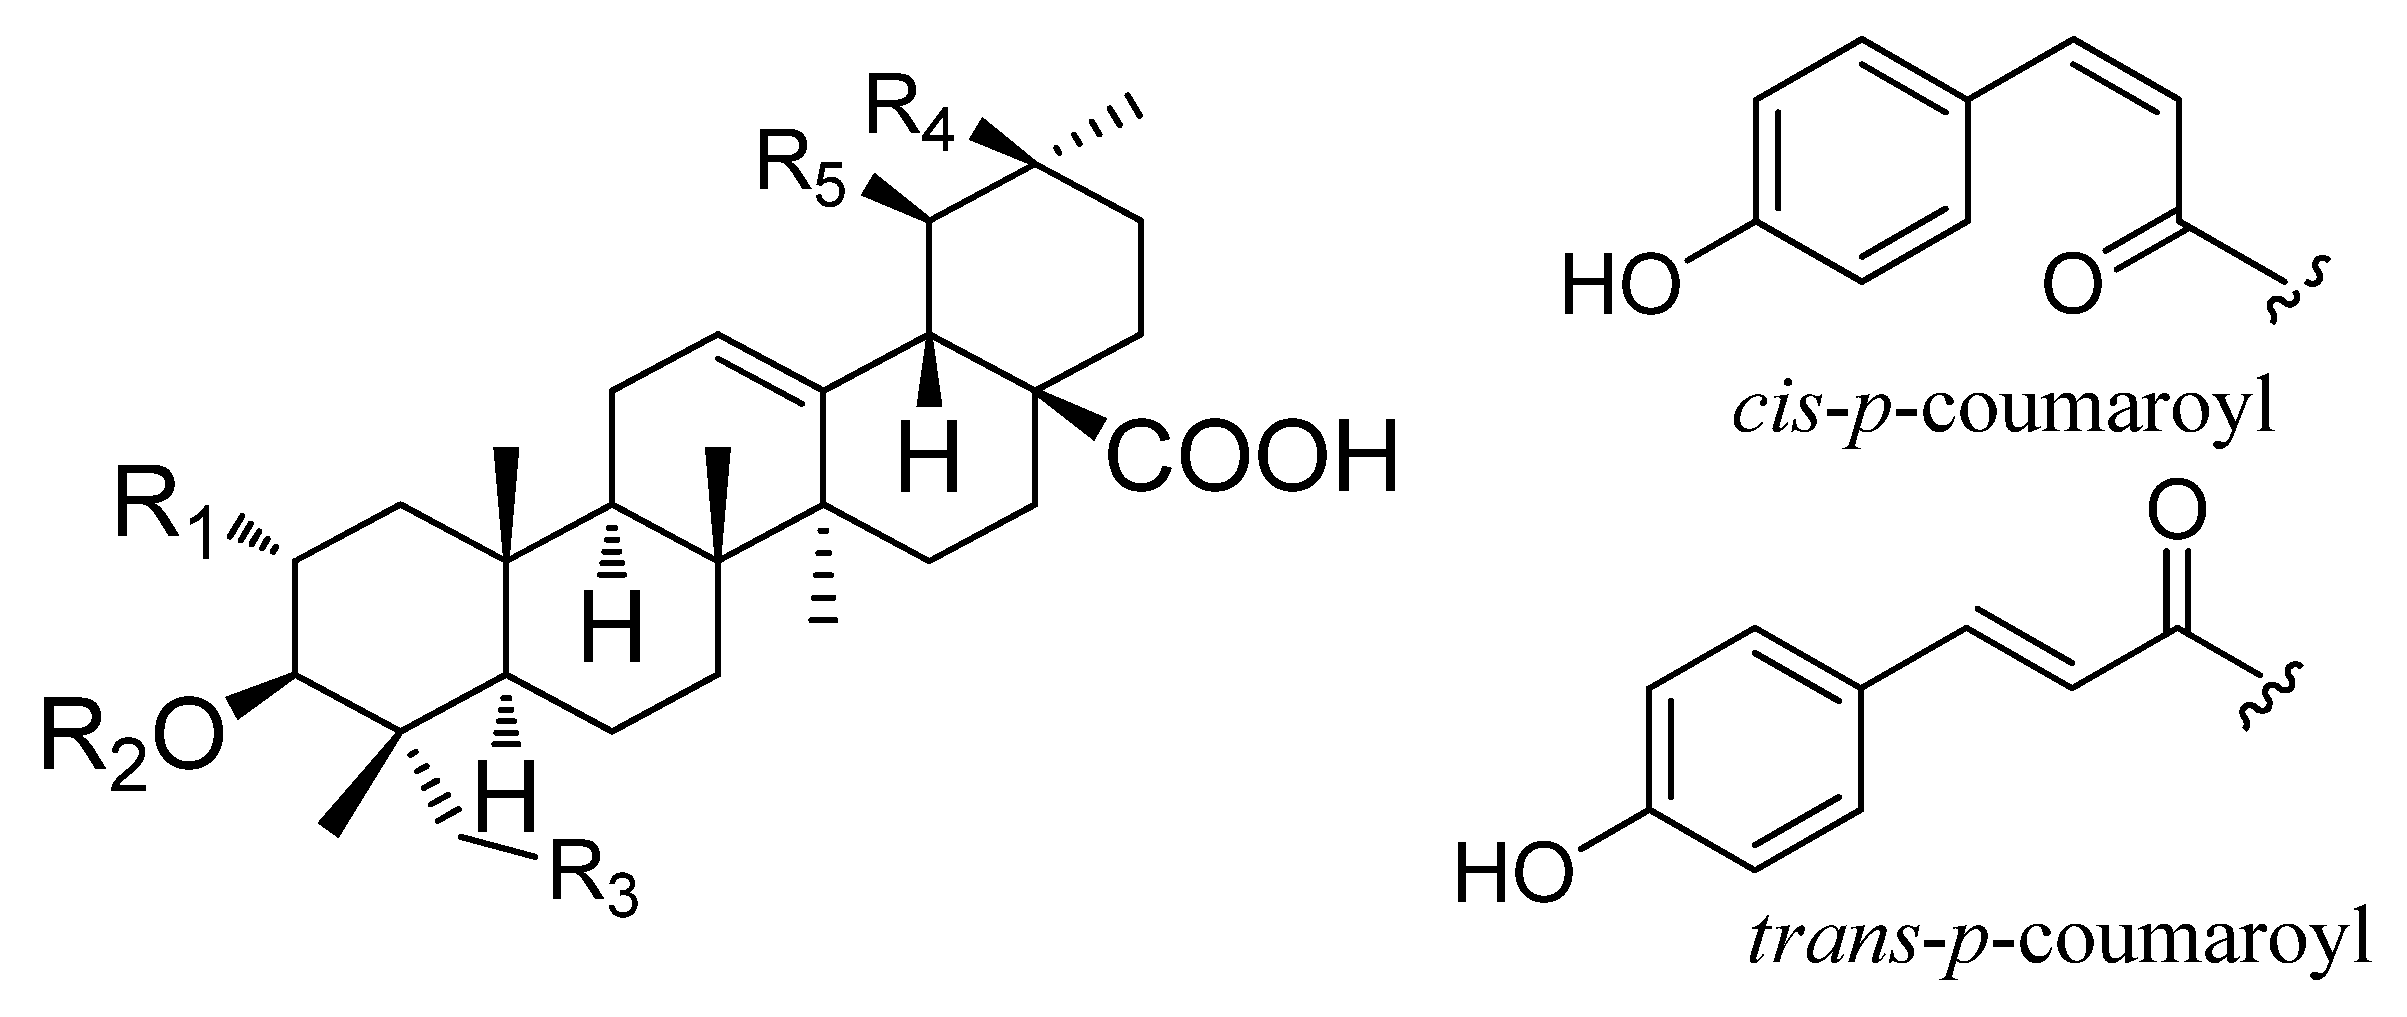
16]. Among them, asiatic acid (
1) [
17], maslinic acid (
2) [
2], corosolic acid (
3) [
17], oleanolic acid (
8) [
18] and ursolic acid (
9) [
2] have been extensively investigated and shown to contribute to various pharmacological activities of
P. guajava [
19,
20,
21,
22,
23,
24]. In addition, 3β-
O-cis-p-coumaroyl-2α-hydroxy-olean-12-en-28-oic acid (
4), 3β
-O-cis-p-coumaroyl-2α-hydroxy-urs-12-en-28-oic acid (
5), 3β
-O-trans-p-coumaroyl-2α-hydroxy-olean-12-en-28-oic acid (
6) and 3β
-O-trans-p-coumaroyl-2
α-hydroxy-urs-12-en-28-oic acid (jacoumaric acid) (
7) were also identified from
P. guajava; they are esters of maslinic acid or corosolic acid [
25]. Our previous study showed that these compounds could be transformed into maslinic acid and corosolic acid by hydrochloric acid hydrolysis, which is a very cost-effective and time-saving method to produce corosolic acid and maslinic acid [
26].
Several methods have been established to determine the active components of
P. guajava. High-performance thin layer chromatography (HPTLC) was developed to quantify quercetin in
P. guajava [
27]. Flavonoids and flavonoid glycosides of
P. guajava leaves were qualitatively analyzed by high-performance liquid chromatography coupled with diode array detector and mass spectrometry (HPLC–DAD–MS) [
28]. An HPLC–DAD method with evaluation using PCA and Neural Network Analysis has been developed for simultaneous determination of 13 phenolic bioactive compounds in
P. guajava [
29]. An HPLC–PDA method was established for quantification of ursolic acid and oleanolic acid in the
P. guajava [
30]. Our previous research developed an HPLC method for quantification of corosolic acid and found the content of corosolic acid in leaf increased after acid treatment due to the hydrolysable corosolic acid derivatives. However, there is no method for simultaneous quantification of corosolic acid and its derivatives in
P. guajava. Due to the absence of a chromophore, some compounds such as triterpenoids reveal poor UV absorption. Evaporative light scattering detector (ELSD) is a good choice for quantification of these compounds. Thus, HPLC coupled with DAD and ELSD method has been widely applied to analyze complex multiple constituents in Chinese medicine [
31,
32,
33,
34].
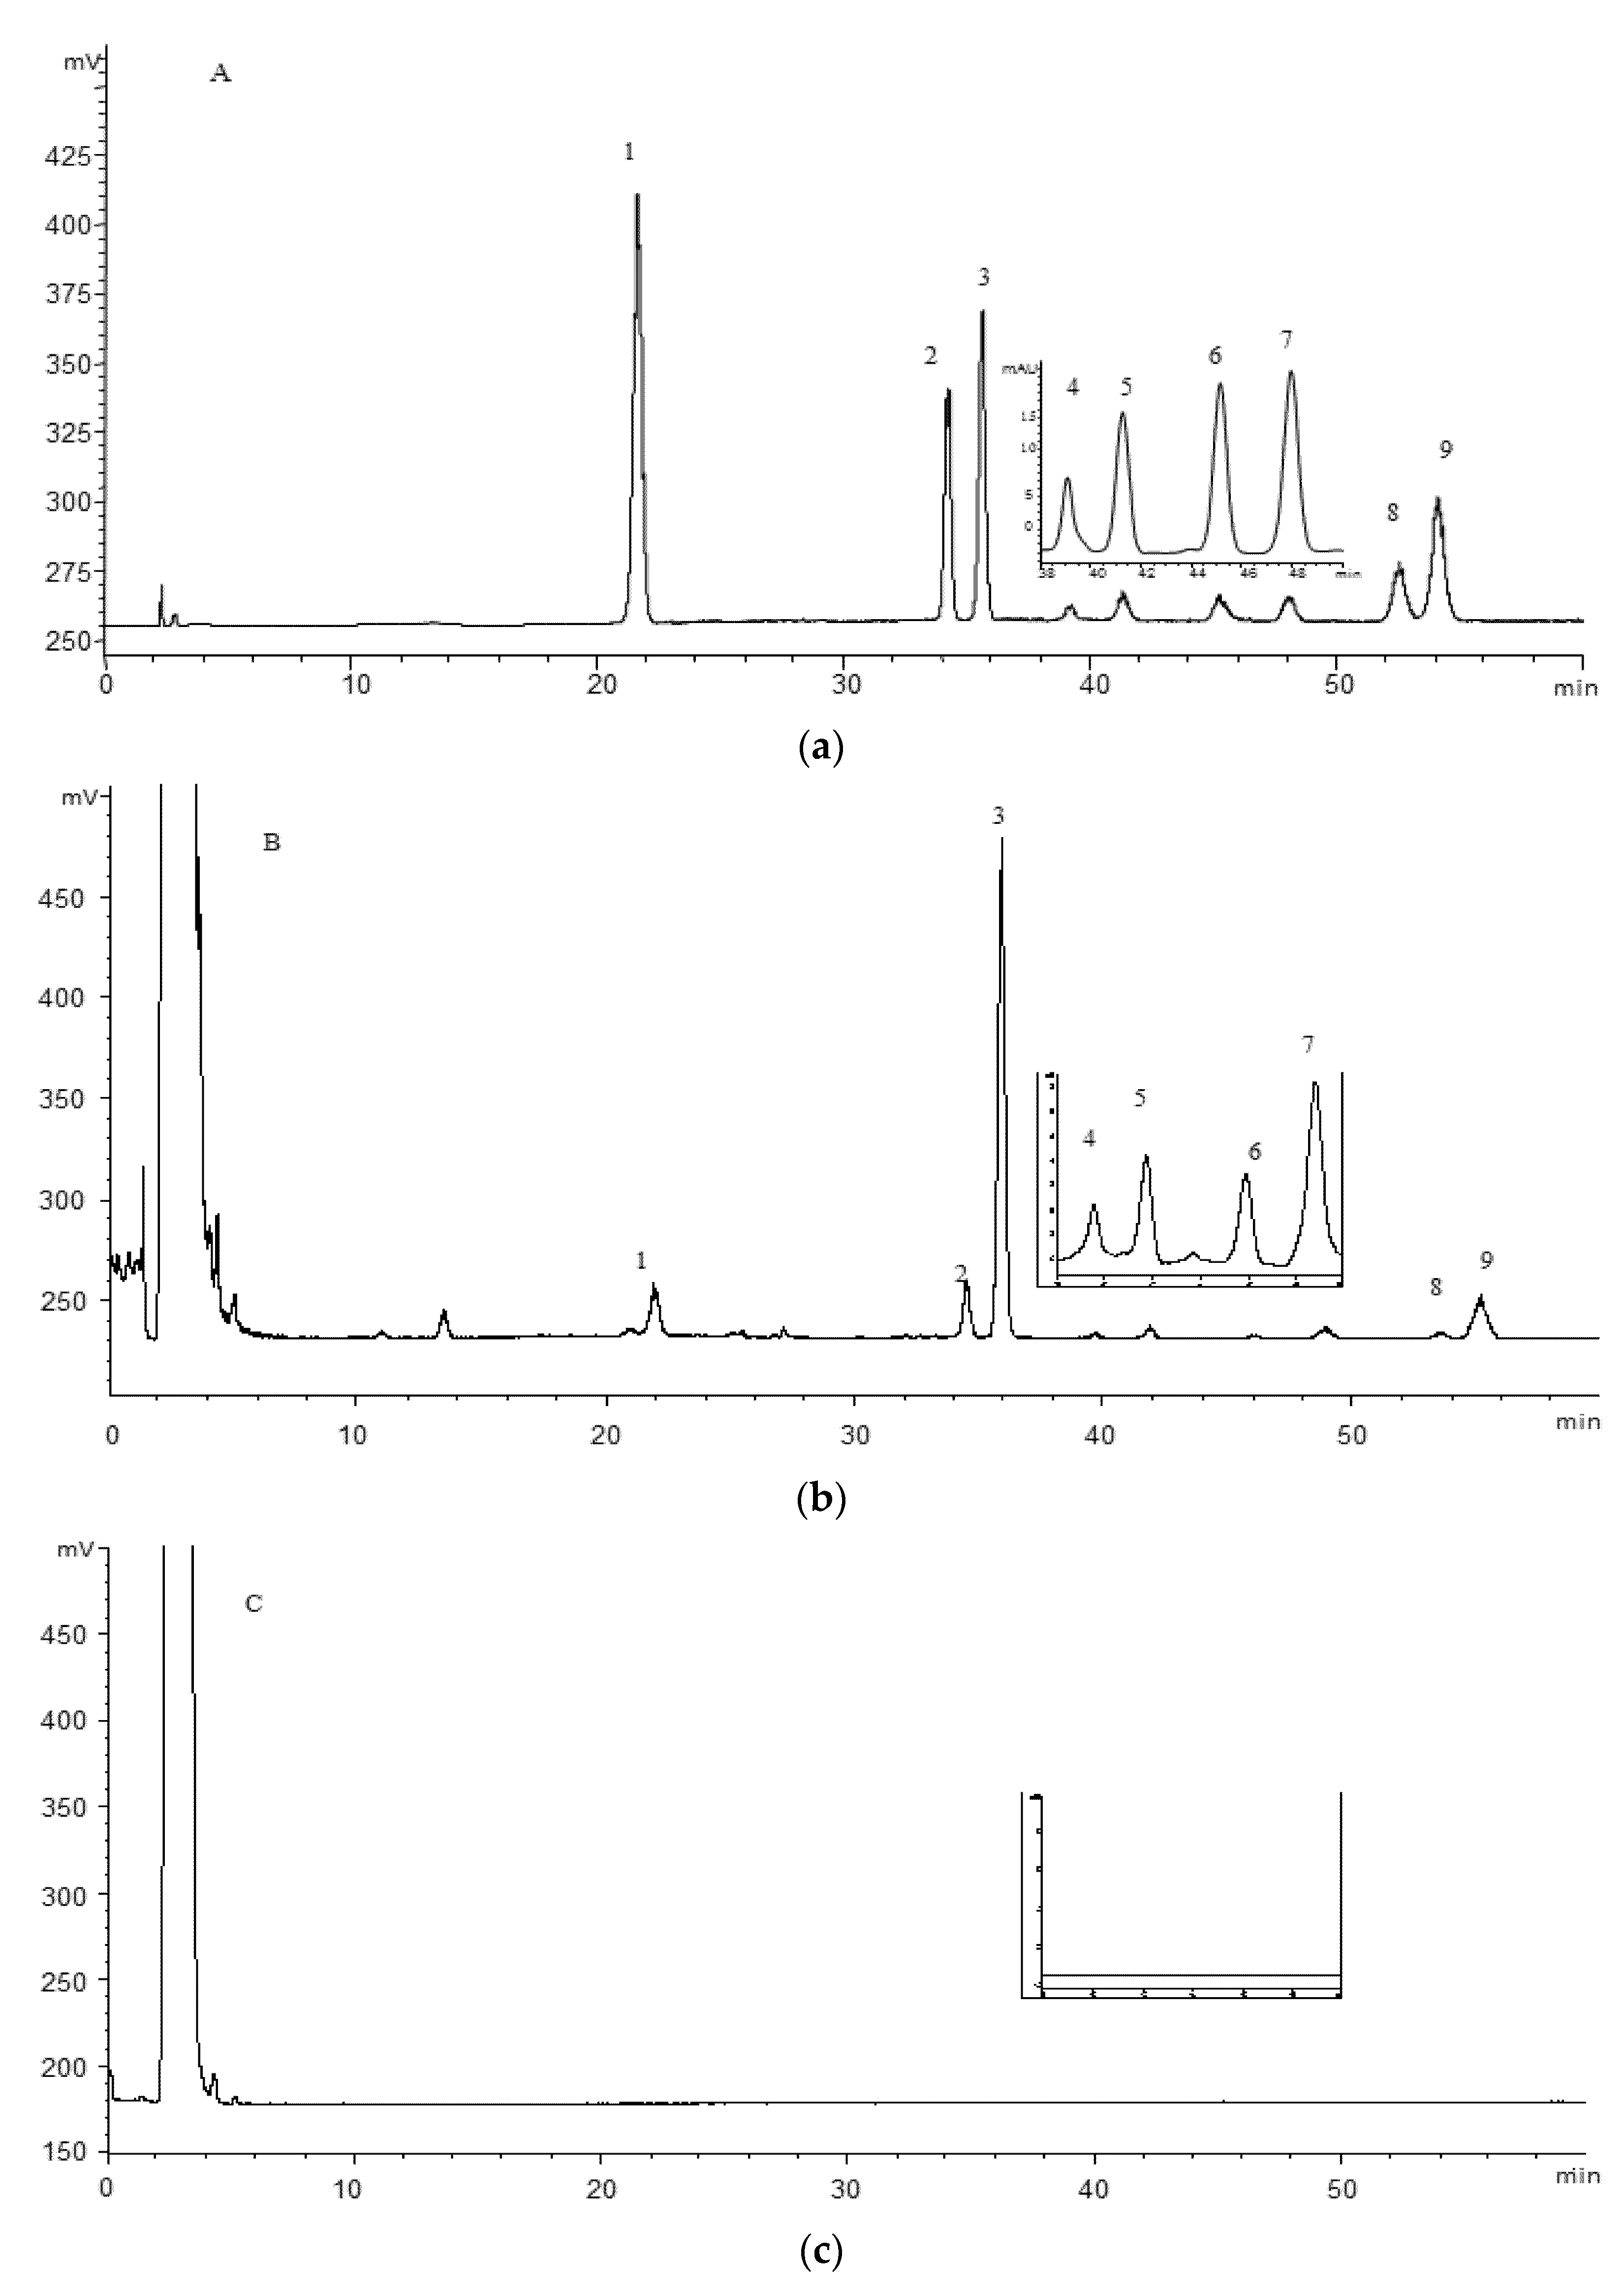
In the present study, an HPLC-DAD-ELSD and pressurized liquid extraction (PLE) method was developed to simultaneously determine nine triterpenoids (
Figure 1 and
Table 1) in the leaves and fruits of
P. guajava collected from different locations. In addition, the inhibitive effect of its leaves and fruits, as well as nine analytes on
α-glucosidase were examined and compared.
3. Materials and Methods
3.1. Chemicals and Materials
Methanol and formic acid (HPLC grade) were purchased from Merck (Darmstadt, Germany). The ultra-pure water was purified using a Millipore Milli Q-Plus system (Millipore, Bedford, MA, USA). The α-glucosidase and p-nitrophenyl α-d-glucopyranoside were purchased from Sigma (St. Louis, USA). The enzymatic reaction results were detected on a SpectraMax M5 (Molecular Devices, San Jose, CA, USA).
The reference standards of triterpenoids 1–9 were previously isolated and identified by University of Jinan, and stored in the dark at 4 °C. The purities were determined to be greater than 98% by the normalization of the peak areas detected by HPLC–DAD–ELSD and confirmed by LC–MS, NMR spectroscopy.
The samples of P. guajava were purchased in local herbal stores or collected in Guangdong province, China, by our team members. All voucher specimens were deposited at the Institute of Chinese Medical Sciences, University of Macau, Macau, China.
3.2. Preparation of Standard Solutions
A mixed standard stock solution containing the nine reference compounds was prepared by dissolving them in methanol. The stock solution was consecutively diluted to obtain five gradient stock solutions. All the solutions were stored in a refrigerator at 4 °C until use and filtered through a 0.22 μm cellulose membrane before analysis.
3.3. Sample Preparation
A Dionex ASE 200 system (Dionex Corp., Sunnyvale, CA, USA) was used for sample preparation. Dried powder of P. guajava (0.50 g) was mixed with diatomaceous earth with a proportion of 1:1 and placed into an 11 mL stainless steel extraction cell; then the extraction was performed under the optimized conditions: 100% methanol; particle size: 120–140 mesh; temperature, 100 °C; static extraction time, 10 min; static cycle, 1 cycle; pressure: 1500 p.s.i.; flush volume, 40%. Then the extract was transferred to a 25 mL volumetric which was made up to its volume with 100% methanol, and filtered through a 0.45 µm Econofilter (Agilent Technologies, Santa Clara, CA, USA) before the HPLC analysis.
3.4. HPLC Analysis
An Agilent 1200 series HPLC system (Agilent Technologies, Santa Clara, CA, USA), equipped with on-line degasser, quaternary solvent delivery pump, auto-sampler, column compartment, diode array detector and Alltech 3300 evaporative light scattering detector (Grace, Deerfield, IL, USA) was used. A Cosmosil 5C18MS-II (4.6 mm × 250 mm, I.D., 5 μm) column was used for separation of the analytes. A gradient mobile phase consisted 0.1% formic acid in water (A) and methanol (B) and separation was achieved using the following gradient program: 1–18 min, 70% B; 18–20 min, 70–83% B; 20–60 min, 83% B; afterwards, washing column was performed with 100% B for 5 min and then return to the initial 70% B with 5 min post run time. The inject volume was 10 µL. The drift tube temperature of ELSD was set at 40 °C and the nitrogen flow rate was at 1.6 L/min. The gain ratio was at 8. Compound 4, 5, 6 and 7 were all monitored by DAD with the detection wavelength of 310 nm, while the rest of triterpenoids were detected by ELSD.
3.5. Method Validation
The developed method was validated in terms of calibration curve, sensitivity, precision, accuracy and stability.
For calibration curve construction, known amounts of nine triterpenoids were dissolved with absolute methanol and the stock solution was consecutively diluted to obtain five gradient stock solutions. Each concentration was analyzed in triplicate. Then, the calibration curves of 4, 5, 6 and 7 were constructed by direct plotting the peak area in DAD signal versus the concentration of each analyte, while the calibration curves of 1, 2, 3, 8 and 9 were constructed by plotting the logarithmic of peak area in ELSD signal versus the logarithmic of the concentration of each analyte.
The sensitivity study was achieved by analyzing the limit of detection (LOD) and limit of quantification (LOQ) which were calculated as the concentration for each analyte with signal/noise ratio (S/N) at 3 and 10, respectively.
The precision of the method was determined by intra-day and inter-day repeatability. The intra-day repeatability was evaluated by extracting and analyzing sample PGL-2 (P. guajava leaves from Qingping) under the optimized extraction and chromatographic conditions, six replicates on the same day. For inter-day repeatability, the measurement was conducted one time a day for three consecutive days. The sample stability was tested by analyzing the sample of PGL-2 at 0, 4, 8, 12, 16, 20 and 24 h; the RSD of peak area of each component was recorded and compared.
A recovery test was used to evaluate the accuracy of the method. The recovery was determined by adding the investigated triterpenoids with high, middle and low levels to 0.25g sample PGL-9 (
P. guajava leaves from Foshan) analyzed previously. The spiked samples were then extracted, processed, and quantified as above. Triplicates were carried out in order to compare their RSD. The recovery was calculated as the following equation:
3.6. Inhibition Assay of α-Glucosidase Activity
The inhibition assay of α-glucosidase was measured by the method as described previously [
38,
39,
40,
41]. Briefly, a total volume of 150 µL solution consisting of 100 µL phosphate buffer (0.1 M, pH 6.8), 20 µL α-glucosidase (2.4 unit/mg), 20 µL p-nitrophenyl α-
d-glucopyranoside and 10 µL different concentration of test sample (12.5–500 µg/mL), was incubated for 30 min under the temperature of 37 °C, then the reaction was stopped by adding 80 µL 0.1 mM Na
2CO
3. The results were detected under the wavelength of 405 nm on a SpectraMax M5 (Molecular Devices, San Jose, CA, USA). The controlled sample used solvent instead of triterpenoids and the blank sample used buffer instead of α-glucosidase, respectively. The inhibition activity α-glucosidase was calculated by the following equation:
Herein, As, Asb, Ac and Acb are absorption of the test sample, sample blank, control and control blank, respectively. Their half maximal inhibitory concentration (IC50) were calculated and compared.

 ,
, 


