
The Effects of Intramuscular Naloxone Dose on Mu Receptor Displacement of Carfentanil in Rhesus Monkeys

 , ,
, ,
Abstract
:1. Introduction
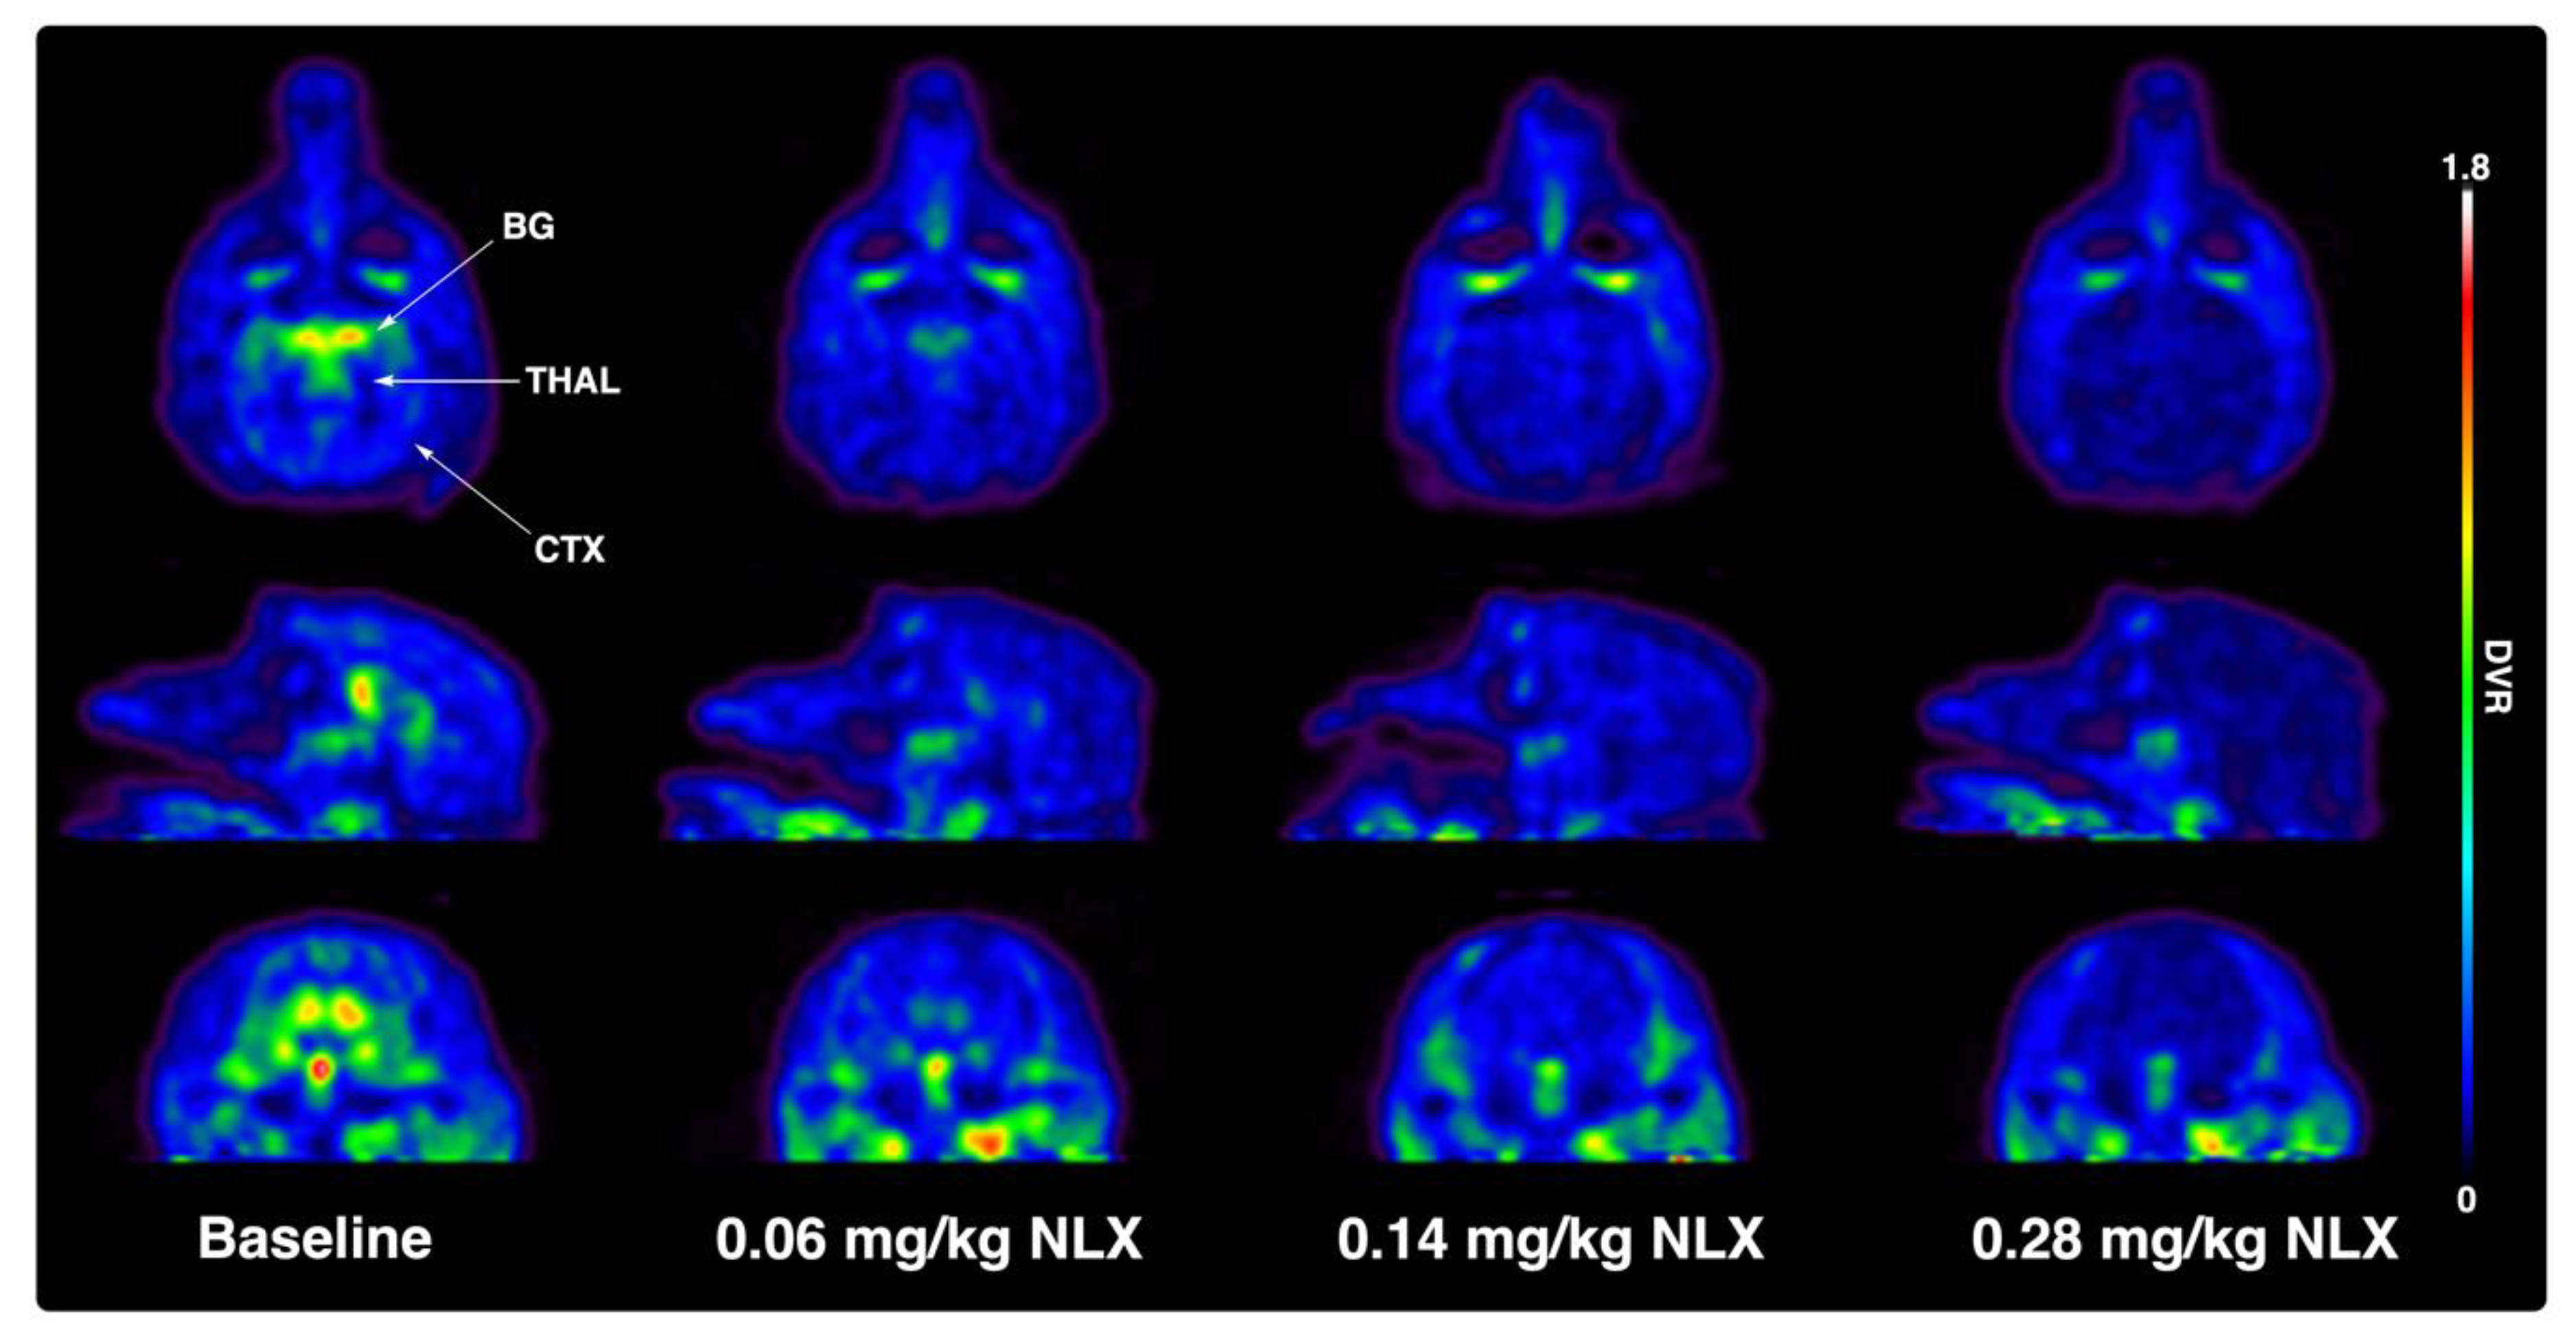
2. Results
3. Discussion
4. Materials and Methods
4.1. General Considerations
4.2. Subjects
4.3. Nonhuman Primate PET Imaging Studies
4.4. PET Data Analysis
4.5. Study Drugs
4.6. Plasma Naloxone Assay
5. Conclusions
Author Contributions
Funding
Acknowledgments
Conflicts of Interest
References
- Drug Overdose Deaths. Available online: https://www.cdc.gov/drugoverdose/data/statedeaths.html (accessed on 13 December 2019).
- Provisional Drug Overdose Death Counts. Available online: https://www.cdc.gov/nchs/nvss/vsrr/drug-overdose-data.htm (accessed on 13 December 2019).
- U.S. Surgeon General’s Advisory on Naloxone and Opioid Overdose. Available online: https://www.surgeongeneral.gov/priorities/opioid-overdose-prevention/naloxone-advisory.html (accessed on 13 December 2019).
- Rzasa, L.R.; Galinkin, J.L. Naloxone dosage for opioid reversal: Current evidence and clinical implications. Ther. Adv. Drug Saf. 2018, 9, 63–88. [Google Scholar] [CrossRef] [PubMed] [Green Version]
- Schumann, H.; Erickson, T.; Trevonne, M.; Thompson, J.; Zautcke, L.; Denton, J.S. Fentanyl epidemic in Chicago, Illinois and surrounding Cook County. Clin. Toxicol. 2008, 46, 501–506. [Google Scholar] [CrossRef] [PubMed]
- Bell, A.; Bennett, A.; Jones, T.S.; Simkins, M.; Williams, L.D. Amount of naloxone used to reverse opioid overdoses outside of medical practice in a city with increasing illicitly manufactured fentanyl in illicit drug supply. Subst. Abus. 2019, 40, 52–55. [Google Scholar] [CrossRef] [PubMed]
- Somerville, N.J.; O’Donnell, J.; Gladden, R.M.; Zibbell, J.E.; Green, T.C.; Younkin, M.; Ruiz, S.; Babakhanlou-Chase, H.; Chan, M.; Callis, B.P.; et al. Characteristics of Fentanyl Overdose - Massachusetts, 2014–2016. Morb. Mortal. Wkly. Rep. 2017, 66, 382–386. [Google Scholar] [CrossRef]
- Bardsley, R. Higher naloxone dosing may be required for opioid overdose. Am. J. Health-Syst. Pharm. 2019, 76, 1835–1837. [Google Scholar] [CrossRef]
- Moss, R.B.; Carlo, D.J. Higher doses of naloxone are needed in the synthetic opioid era Higher doses of naloxone are needed in the synthetic opioid era. Subst. Abus. Treat. Prev. Policy 2019, 14, 6. [Google Scholar] [CrossRef] [Green Version]
- Moss, R.B.; Carleton, F.; Lollo, C.P.; Carlo, D.J. Comparative Pharmacokinetic Analysis of Community Use Naloxone formulations for Acute Treatment of Opioid Overdose. J. Addict. Adolesc. Behav. 2019, 2. [Google Scholar] [CrossRef]
- Melihar, J.K.; Nutt, D.J.; Malizia, A.L. Naloxone displacement at opioid receptor sites measured in vivo in the human brain. Eur. J. Pharmacol. 2003, 459, 217–219. [Google Scholar] [CrossRef]
- Saccone, P.A.; Lindsey, A.M.; Koeppe, R.A.; Zelenock, K.A.; Shao, X.; Sherman, P.; Quesada, C.A.; Woods, J.H.; Scott, P.J.H. Intranasal opioid administration in Rhesus Monkeys: PET imaging and antincicpetion. J. Pharmacol. Exp. Ther. 2016, 359, 366–373. [Google Scholar] [CrossRef] [Green Version]
- Blecha, J.B.; Henderson, B.D.; Hockley, B.G.; VanBrocklin, H.F.; Zubieta, J.K.; DaSilva, A.F.; Kilbourn, M.R.; Koeppe, R.A.K.; Scott, P.J.H.; Shao, X. An updated synthesis of [11C] carfentanil for positron emission tomography (PET) imaging of the μ-opioid receptor. J. Label. Compd. Radiopharm. 2017, 60, 375–380. [Google Scholar] [CrossRef]
- Reagan-Shaw, S.; Nihal, M.; Ahmad, N. Dose translation from animal to human studies revisited. FASEB 2007, 22, 659–661. [Google Scholar] [CrossRef] [PubMed] [Green Version]
- Weinstein, S.H.; Pfeffer, M.; Schor, J.M. Metabolism and Pharmacokinetics of Naloxone. Adv. Biochem. Psychopharmacol. 1973, 8, 525–535. [Google Scholar] [PubMed]
- Koyyalagunta, K. Opioid Analgesics. Pain Manag. 2007, 2, 939–964. [Google Scholar]
- Kim, S.; Wagner, H.N.; Villemagne, V.L.; Kao, P.F.; Dannals, R.F.; Ravert, H.T.; Joh, T.; Dixon, R.B.; Civelek, C. Longer Occupancy of Opioid Receptors by Nalmephene compared to Naloxone as measured by In Vivo by a Dual Detector System. J. Nucl. Med. 1997, 38, 1727–1731. [Google Scholar]
- Johansson, J.; Hirvonen, J.; Lovró, Z.; Ekblad, L.; Kaasinen, V.; Rajasilta, O.; Helin, S.; Tuisku, J.; Sirén, S.; Pennanen, M.; et al. Intranasal naloxone rapidly occupies brain mu-opioid receptors in human subjects. Neuropsychopharmacol 2019, 44, 1667–1673. [Google Scholar] [CrossRef]
- EVISO® Prescribing Information. Available online: https://dailymed.nlm.nih.gov/dailymed/fda/fdaDrugXsl.cfm?setid=5fbe8d17-a72f-406d-a736-48e61620f9d8&type=display (accessed on 13 March 2020).
- Edwards, E.S.; Gunn, R.; Kelley, G.; Smith, A.; Goldwater, R. American Academy of Pain Medicine 2015 Abstract 216: Naloxone 0.4 mg bioavailability following a single injection with a novel naloxone auto-injector, EVZIO®, in healthy adults, with reference to a 1 mL standard syringe and intramuscular needle. Pain Med. 2015, 16, 608–609. [Google Scholar]
- Ryan, S.A.; Dunne, R.B. Pharmacokinetic properties of intranasal and injectable formulations of naloxone for community use: A systematic review. Pain Manag. 2018, 8, 231–245. [Google Scholar] [CrossRef] [Green Version]
- Logan, J.; Fowler, J.S.; Volkow, N.D.; Wang, G.J.; Ding, Y.S.; Alexoff, D.L. Distribution volume ratios without blood sampling from graphical analysis of PET data. J. Cereb. Blood Flow Metab. 1996, 16, 834–840. [Google Scholar] [CrossRef] [Green Version]
- McDonald, R.; Lorch, U.; Woodward, J.; Bosse, B.; Dooner, H.; Mundin, G.; Smith, K.; Strong, J. Pharmacokinetics of concentrated naloxone nasal spray for opioid overdose reversal: Phase I healthy volunteer study. Addiction 2018, 113, 484–493. [Google Scholar] [CrossRef] [Green Version]
- Tomassoni, A.J.; Hawk, K.F.; Jubanyik, K.; Nogee, D.P.; Durant, T.; Lynch, K.L.; Patel, R.; Ding, D.; Ulrich, A.; D’Onofrio, G. Multiple Fentanyl Overdoses—New Haven, Connecticut, June 23, 2016. Morb. Mortal. Wkly. Rep. 2017, 66, 107–111. [Google Scholar] [CrossRef] [Green Version]
- Lee, D.; Crhonister, C.W.; Broussard, W.A.; Utley-Bobak, S.R.; Schultz, D.; Vega, R.S.; Golderberger, B.A. Illicit fentanyl-related fatalaties in florida: Toxicological findings. J. Anal. Toxicol. 2016, 40, 588–594. [Google Scholar] [CrossRef] [PubMed]
- Dwyer, J.B.; Jannsen, J.; Luckasevic, T.M.; Williamns, K.E. Report of increasing overdose deaths that acetyl fentanyl in multiple counties in the southwestern region of the commonwealth of Pennsylvania in 2015–2016. J. Forensi. Sci. 2018, 63, 195–200. [Google Scholar] [CrossRef] [PubMed] [Green Version]
- Fogarty, M.F.; Papsun, D.M.; Logan, B.K. Analysis of Fentanyl and 18 Novel Fentanyl Analogs and Metabolites by LC–MS-MS, and report of Fatalities Associated with Methoxyacetylfentanyl and Cyclopropylfentanyl. J. Anal. Toxicol. 2018, 42, 592–604. [Google Scholar] [CrossRef] [PubMed]
- Sutter, M.E.; Gerona, R.R.; Davis, M.T.; Roche, B.M.; Colby, D.K.; Chenoweth, J.A.; Adams, A.J.; Owen, K.P.; Ford, J.B.; Black, H.B.; et al. One Pill can Kill. Acad. Emerg. Med. 2017, 24, 106–113. [Google Scholar] [CrossRef] [PubMed] [Green Version]


| Monkey Naloxone Dose (mg/kg) | Monkey 1 | Monkey 2 | ||
|---|---|---|---|---|
| [11C]CFN PET | PK | [11C]CFN PET | PK | |
| 0.00 (baseline) | n = 1 | n = 1 | n = 2 | n = 1 |
| 0.06 | n = 2 | n = 1 | n = 2 | n = 1 |
| 0.14 | n = 2 | n = 1 | n = 1 | n = 1 |
| 0.28 | n = 1 | n = 1 | n = 1 | n = 1 |
| Monkey Naloxone IM Dose (mg/kg) | Human Equivalent IM Dose (mg/kg) [14] | IM Dose to Average 60 kg Human (mg) |
|---|---|---|
| 0.06 | 0.02 | 1.2 |
| 0.14 | 0.045 | 2.7 |
| 0.28 | 0.09 | 5.4 |
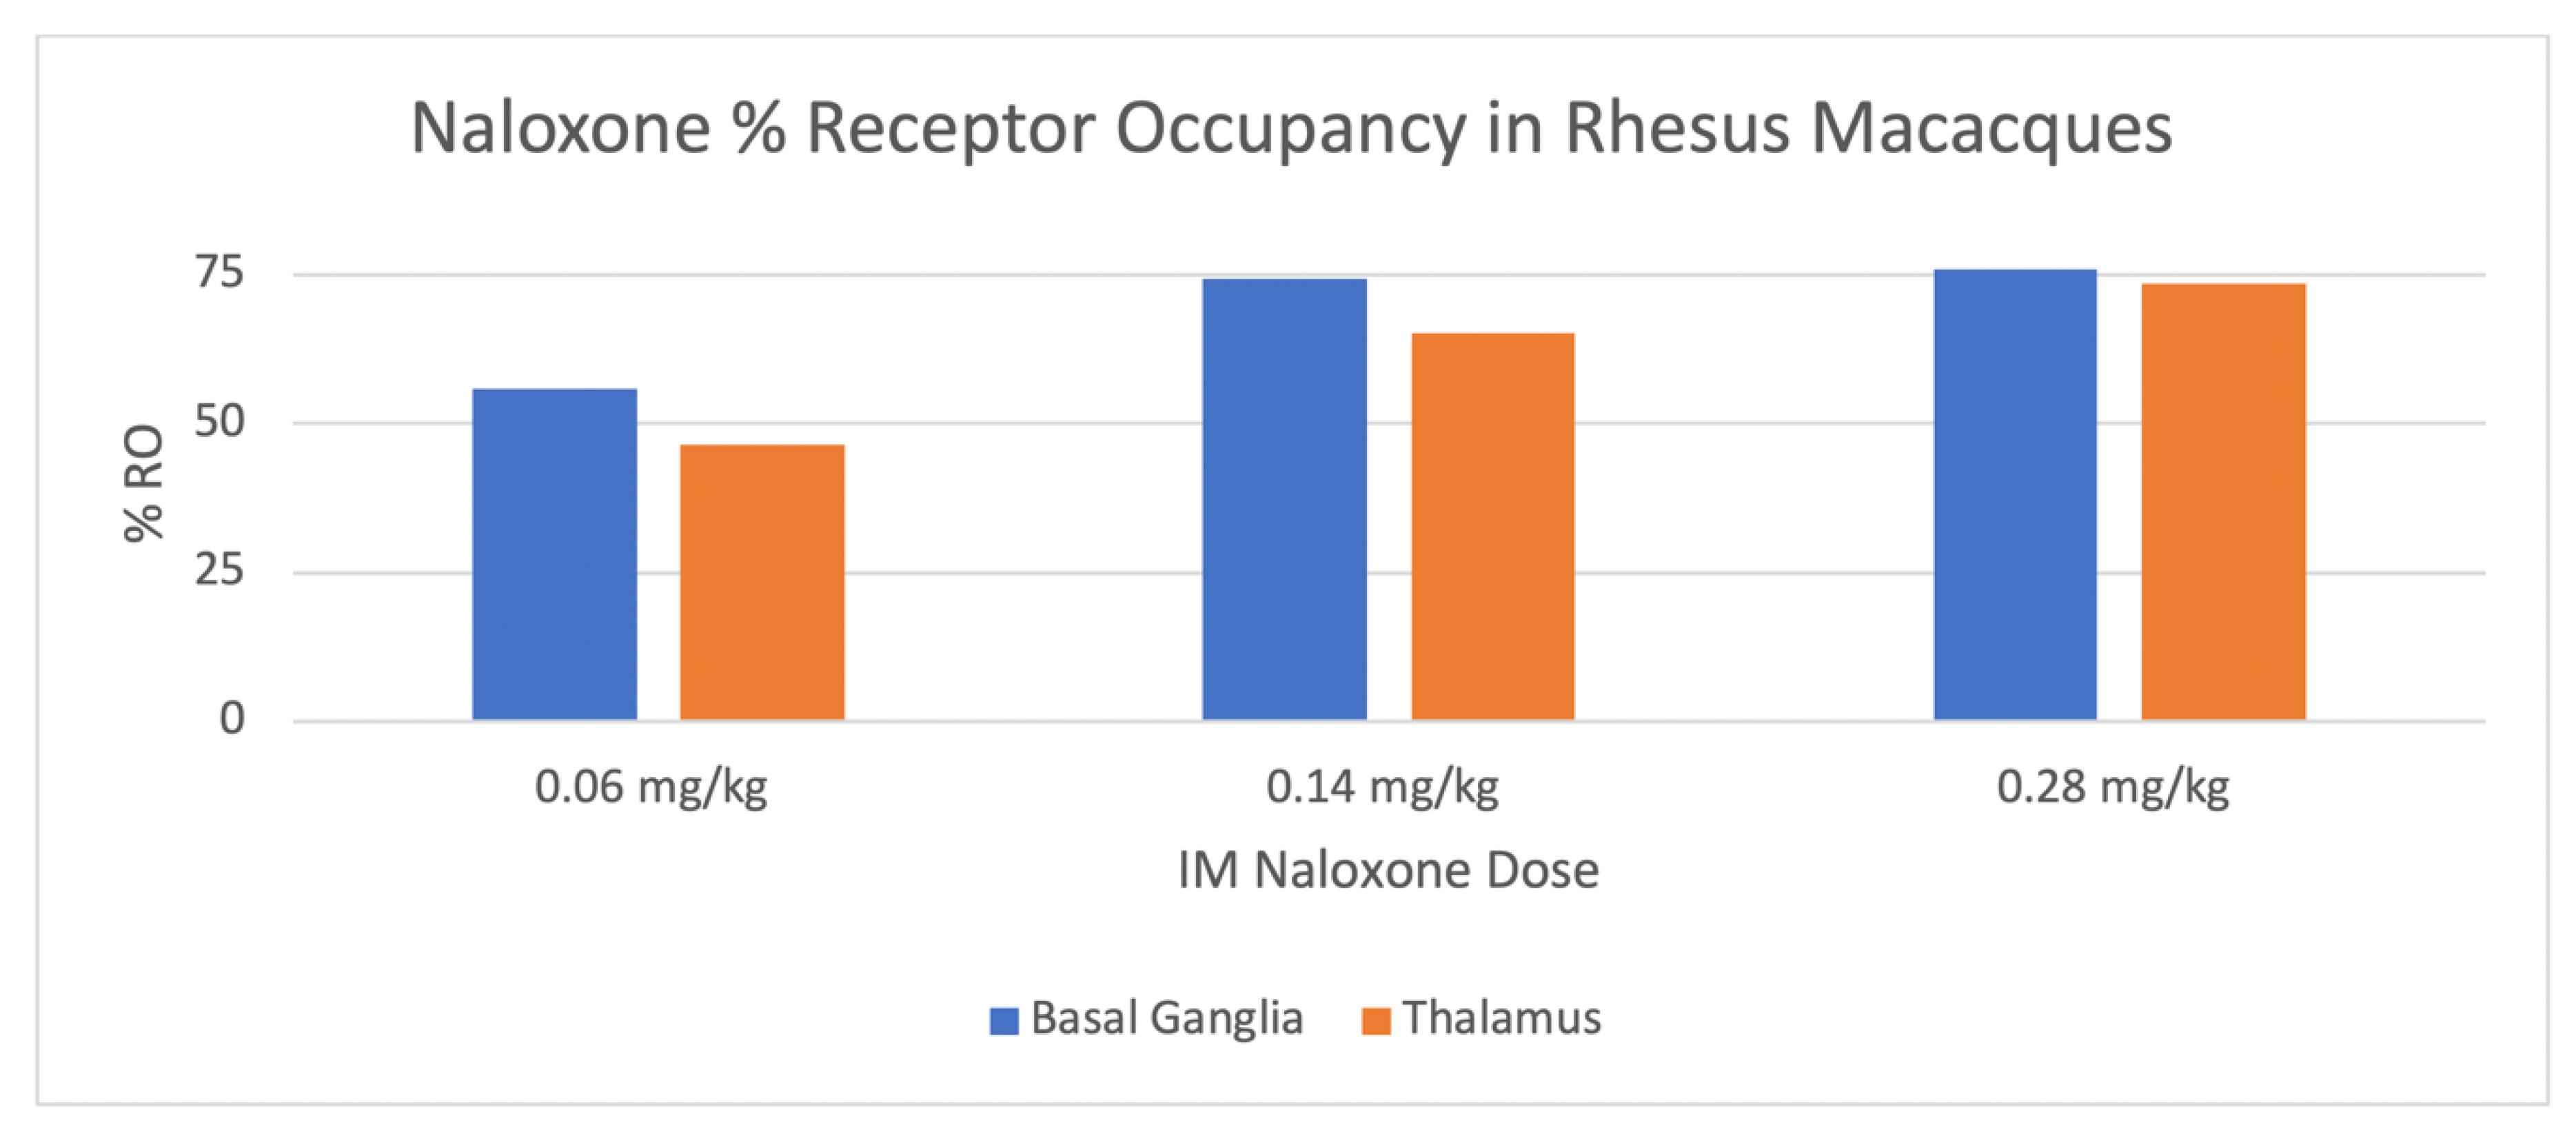
| Dose of Naloxone mg/kg | Basal Ganglia Mean %-RO (± SD) | Thalamus Mean %-RO ± SD |
|---|---|---|
| 0.06 | 56 ± 17 | 47 ± 23 |
| 0.14 | 74 ± 7 | 65 ± 9 |
| 0.28 | 76 ± 3 | 74 ± 4 |
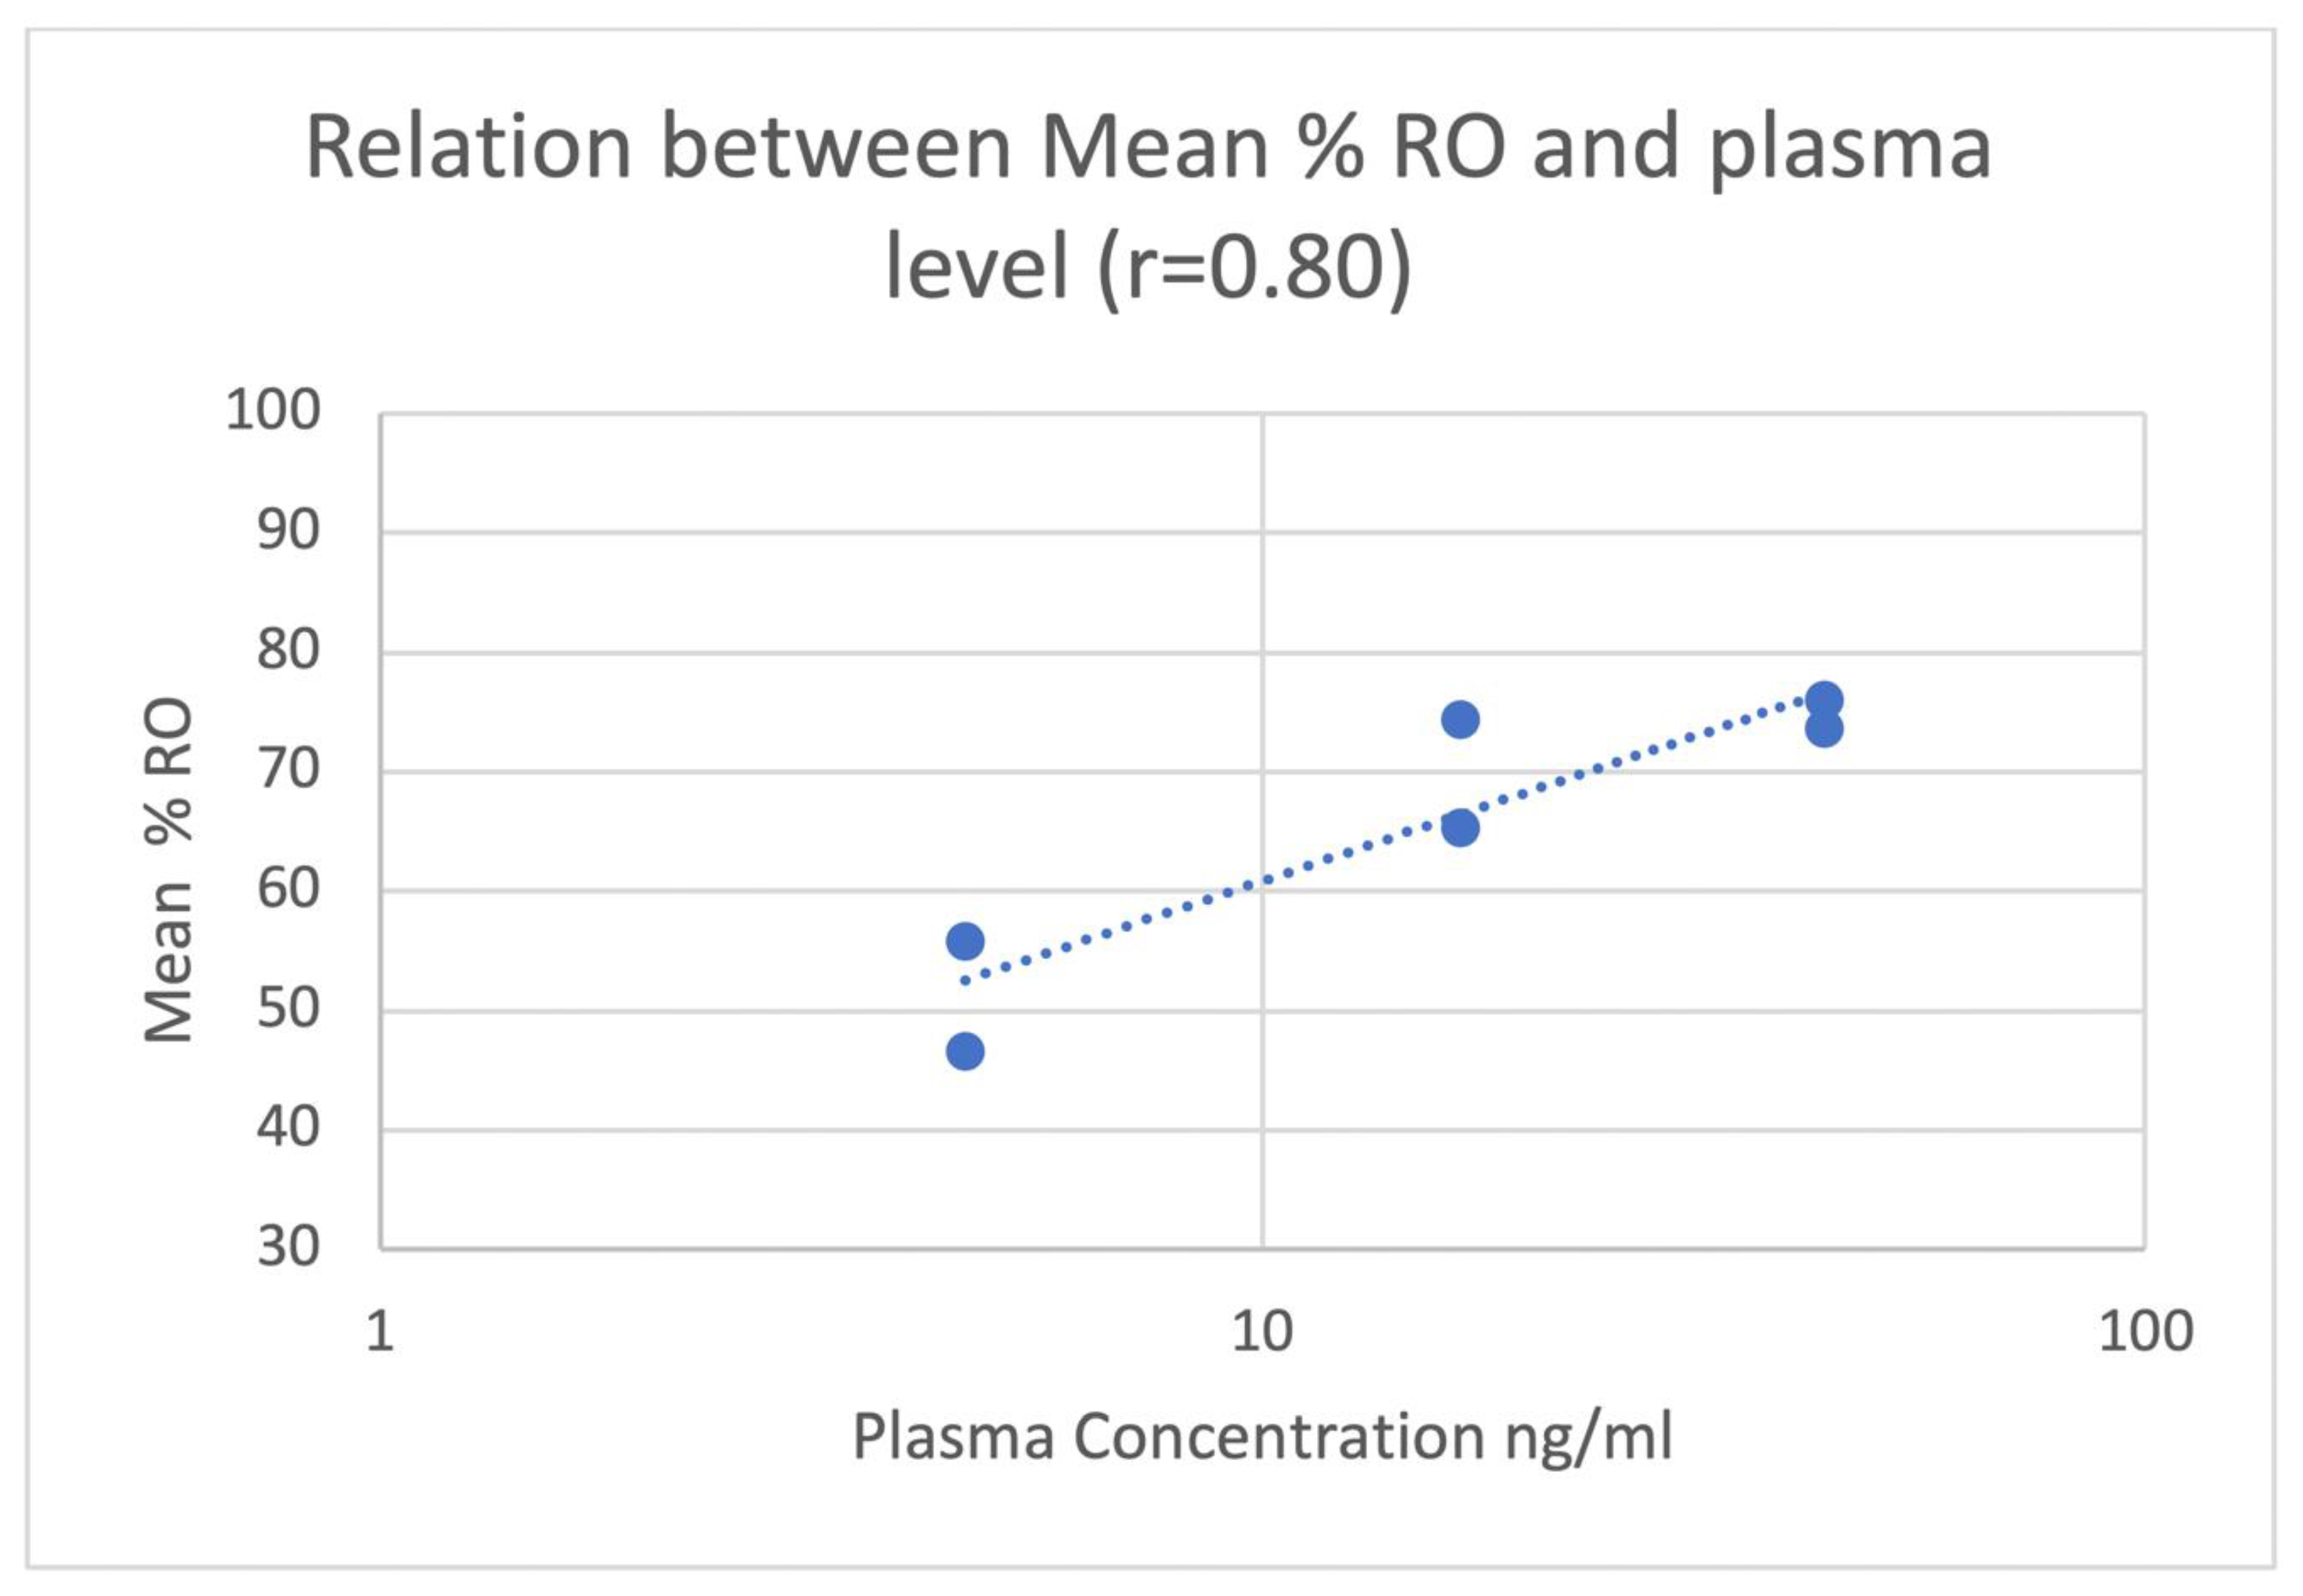
| Dose of Naloxone mg/kg | Mean Plasma Conc NLX ± SD [Range] (ng/mL) 30 min Post-IM 1 | Mean Plasma Conc NLX ± SD [Range] (ng/mL) 60 min Post-IM |
|---|---|---|
| 0.06 | 4.6 ± 1.9 [3.3–5.9] | 2.3 ± 2.4 [0.7–4.0] |
| 0.14 | 16.8 ± 2.3 [15.1–18.4] | 8.1 ± 1.0 [7.4–8.8] |
| 0.28 | 43.4 ± 19.0 [30.0–56.8] | 23.2 ± 1.6 [22.0–24.3] |
© 2020 by the authors. Licensee MDPI, Basel, Switzerland. This article is an open access article distributed under the terms and conditions of the Creative Commons Attribution (CC BY) license (http://creativecommons.org/licenses/by/4.0/).
Share and Cite
Scott, P.J.H.; Koeppe, R.A.; Shao, X.; Rodnick, M.E.; Sowa, A.R.; Henderson, B.D.; Stauff, J.; Sherman, P.S.; Arteaga, J.; Carlo, D.J.; et al. The Effects of Intramuscular Naloxone Dose on Mu Receptor Displacement of Carfentanil in Rhesus Monkeys. Molecules 2020, 25, 1360. https://doi.org/10.3390/molecules25061360
Scott PJH, Koeppe RA, Shao X, Rodnick ME, Sowa AR, Henderson BD, Stauff J, Sherman PS, Arteaga J, Carlo DJ, et al. The Effects of Intramuscular Naloxone Dose on Mu Receptor Displacement of Carfentanil in Rhesus Monkeys. Molecules. 2020; 25(6):1360. https://doi.org/10.3390/molecules25061360
Chicago/Turabian StyleScott, Peter J. H., Robert A. Koeppe, Xia Shao, Melissa E. Rodnick, Alexandra R. Sowa, Bradford D. Henderson, Jenelle Stauff, Phillip S. Sherman, Janna Arteaga, Dennis J. Carlo, and et al. 2020. "The Effects of Intramuscular Naloxone Dose on Mu Receptor Displacement of Carfentanil in Rhesus Monkeys" Molecules 25, no. 6: 1360. https://doi.org/10.3390/molecules25061360