
Are Alkynyl Spacers in Ancillary Ligands in Heteroleptic Bis(diimine)copper(I) Dyes Beneficial for Dye Performance in Dye-Sensitized Solar Cells?


Abstract
:
1. Introduction
2. Results and Discussion
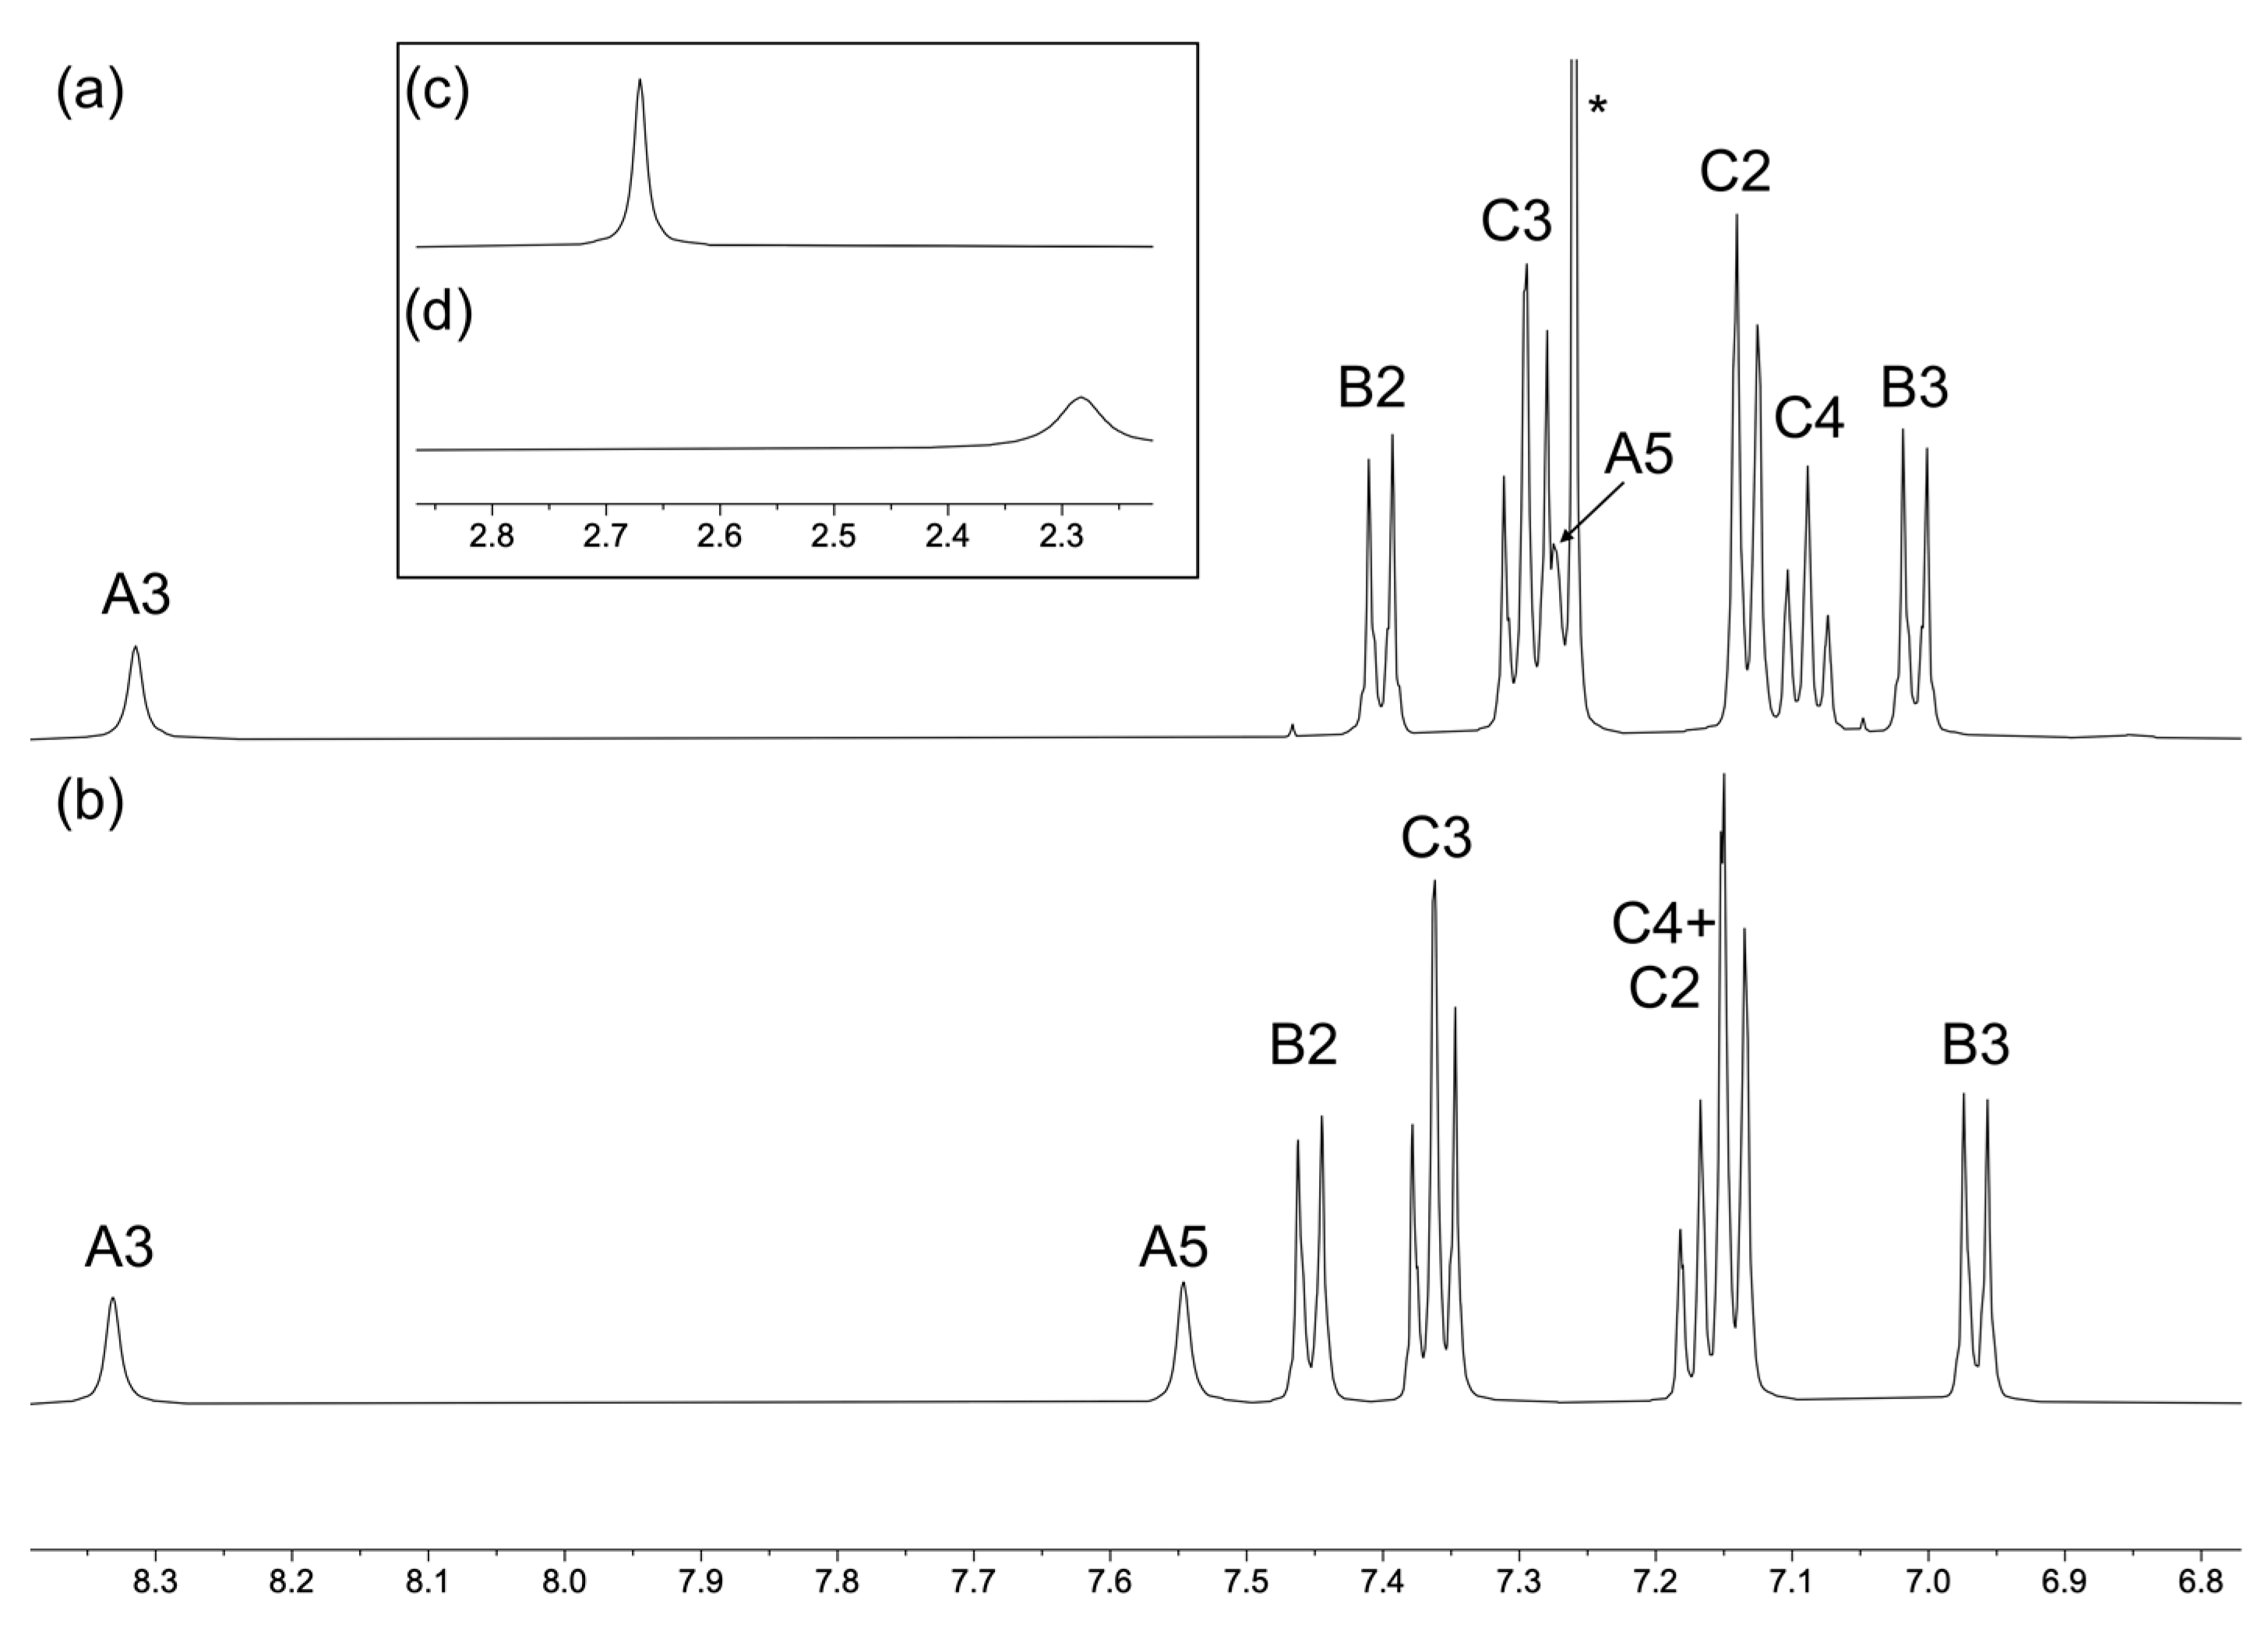
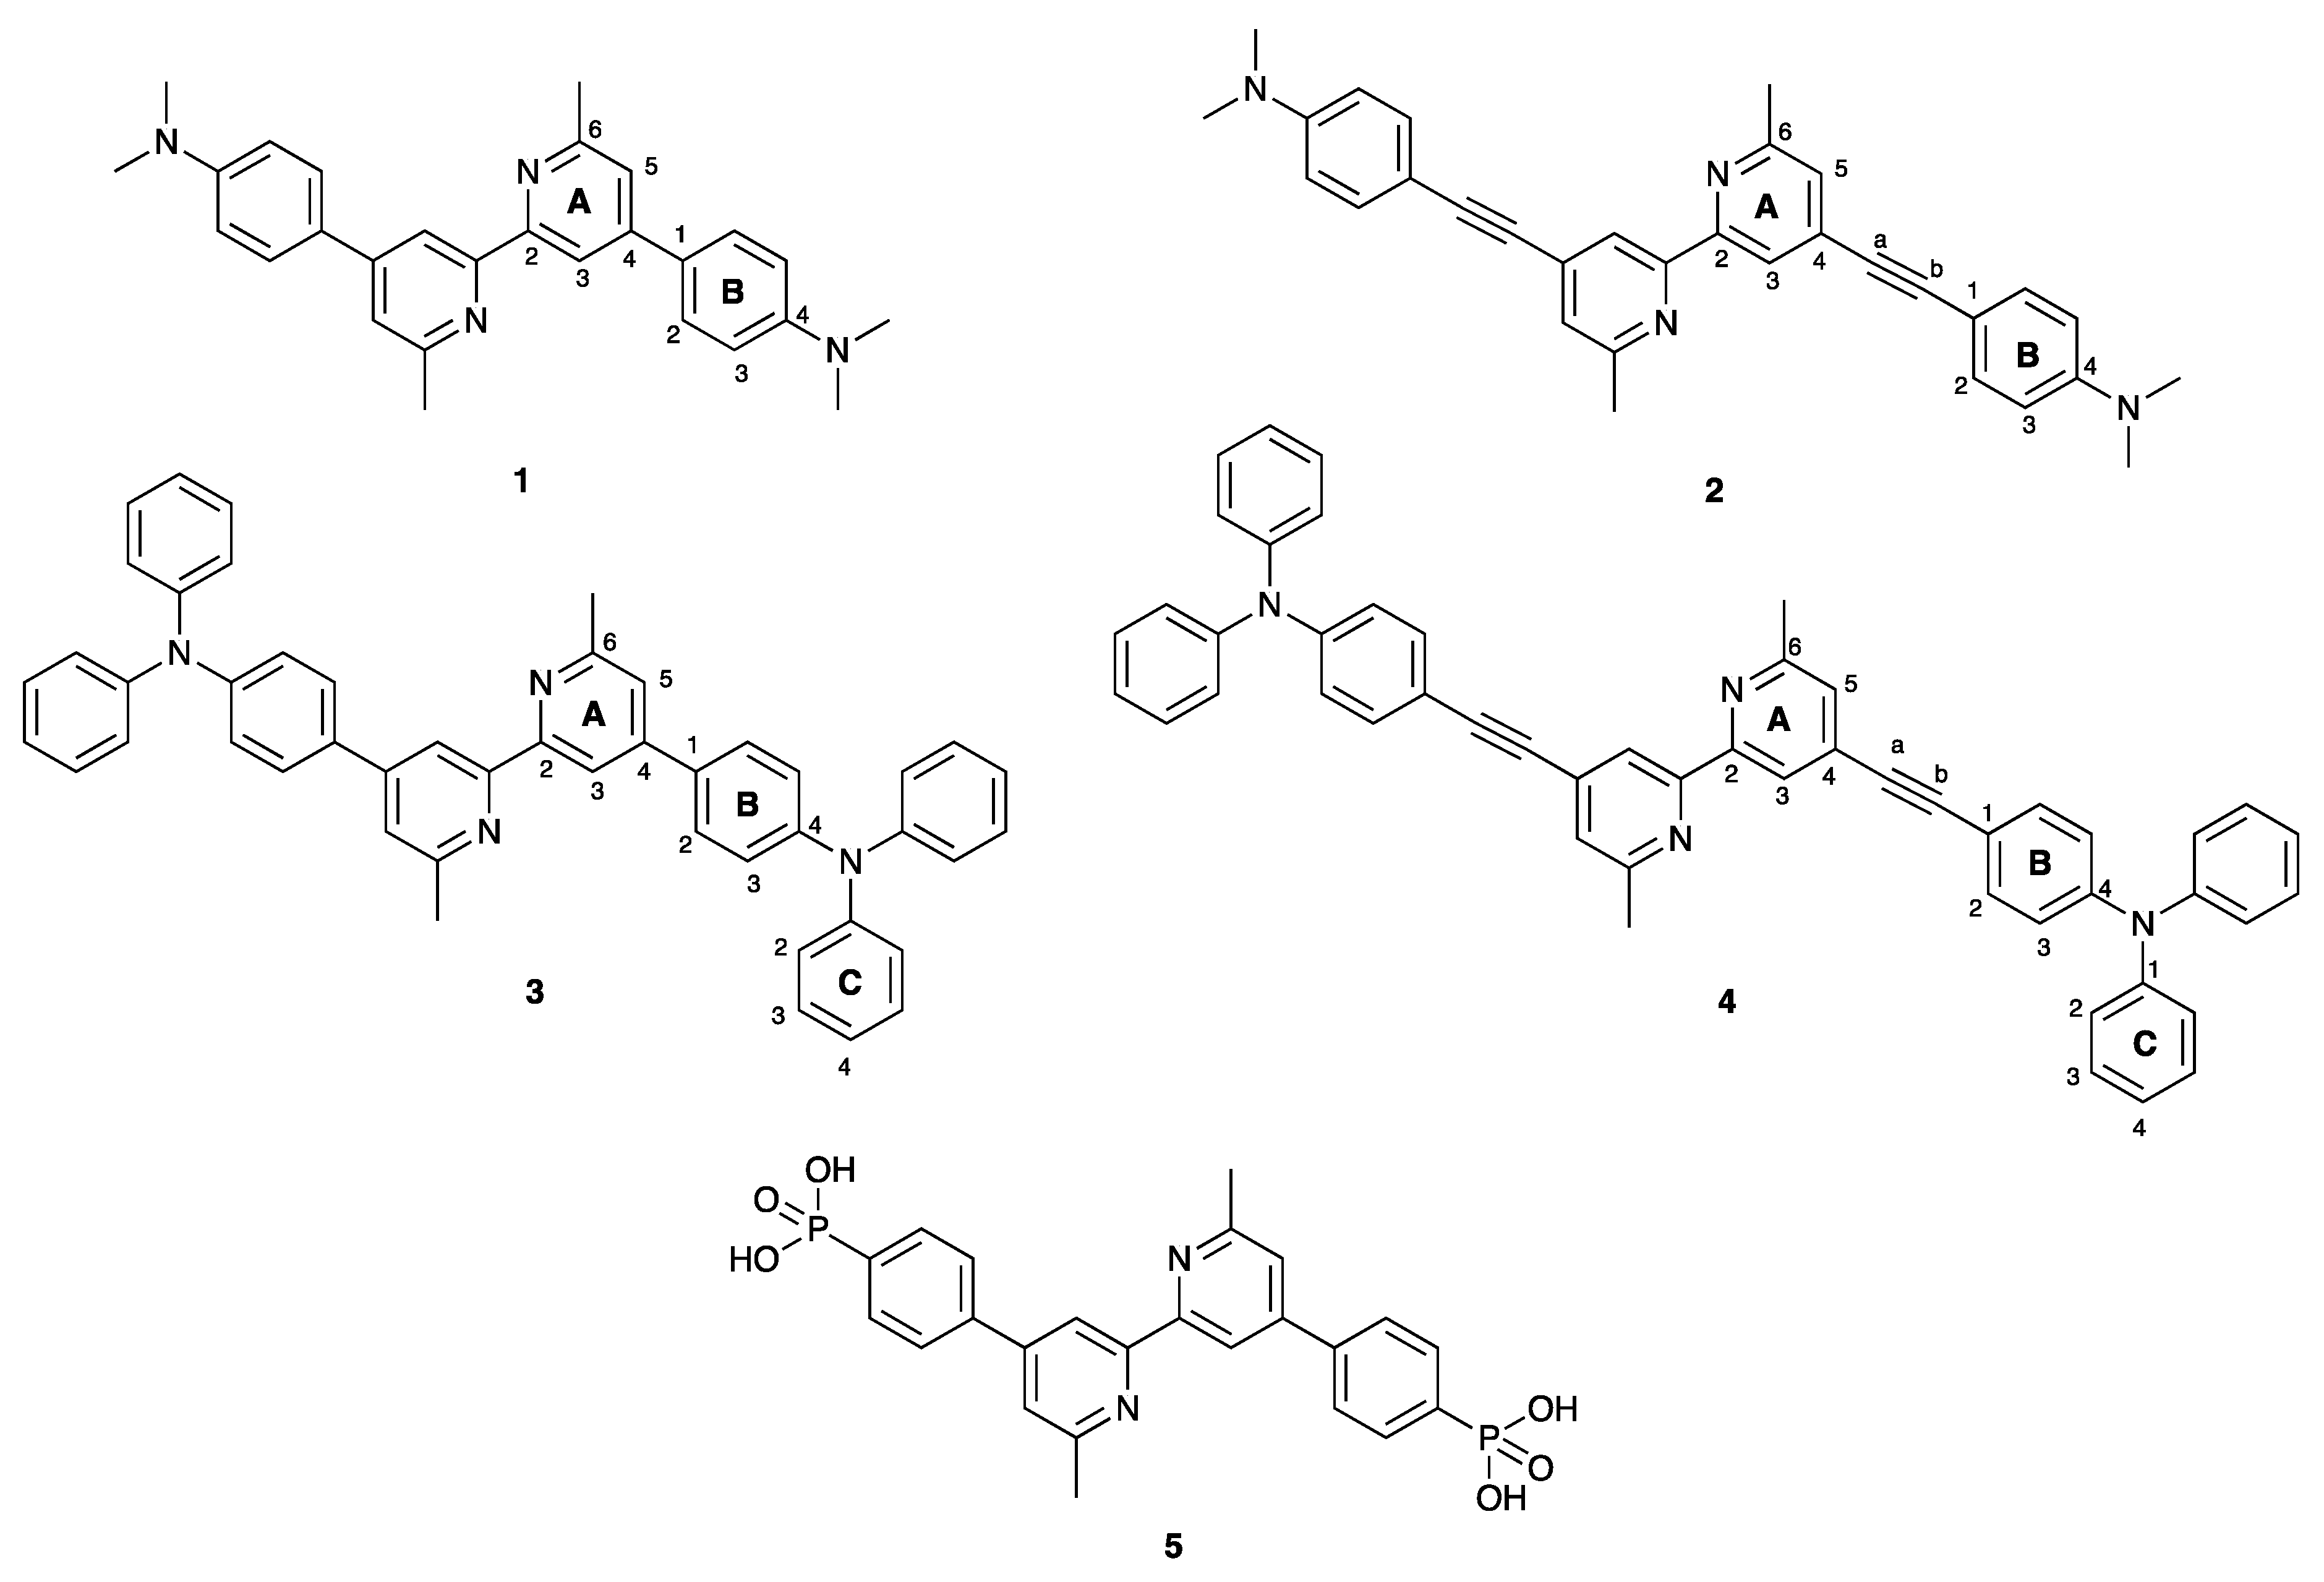
2.1. Ligand Syntheses and Characterization
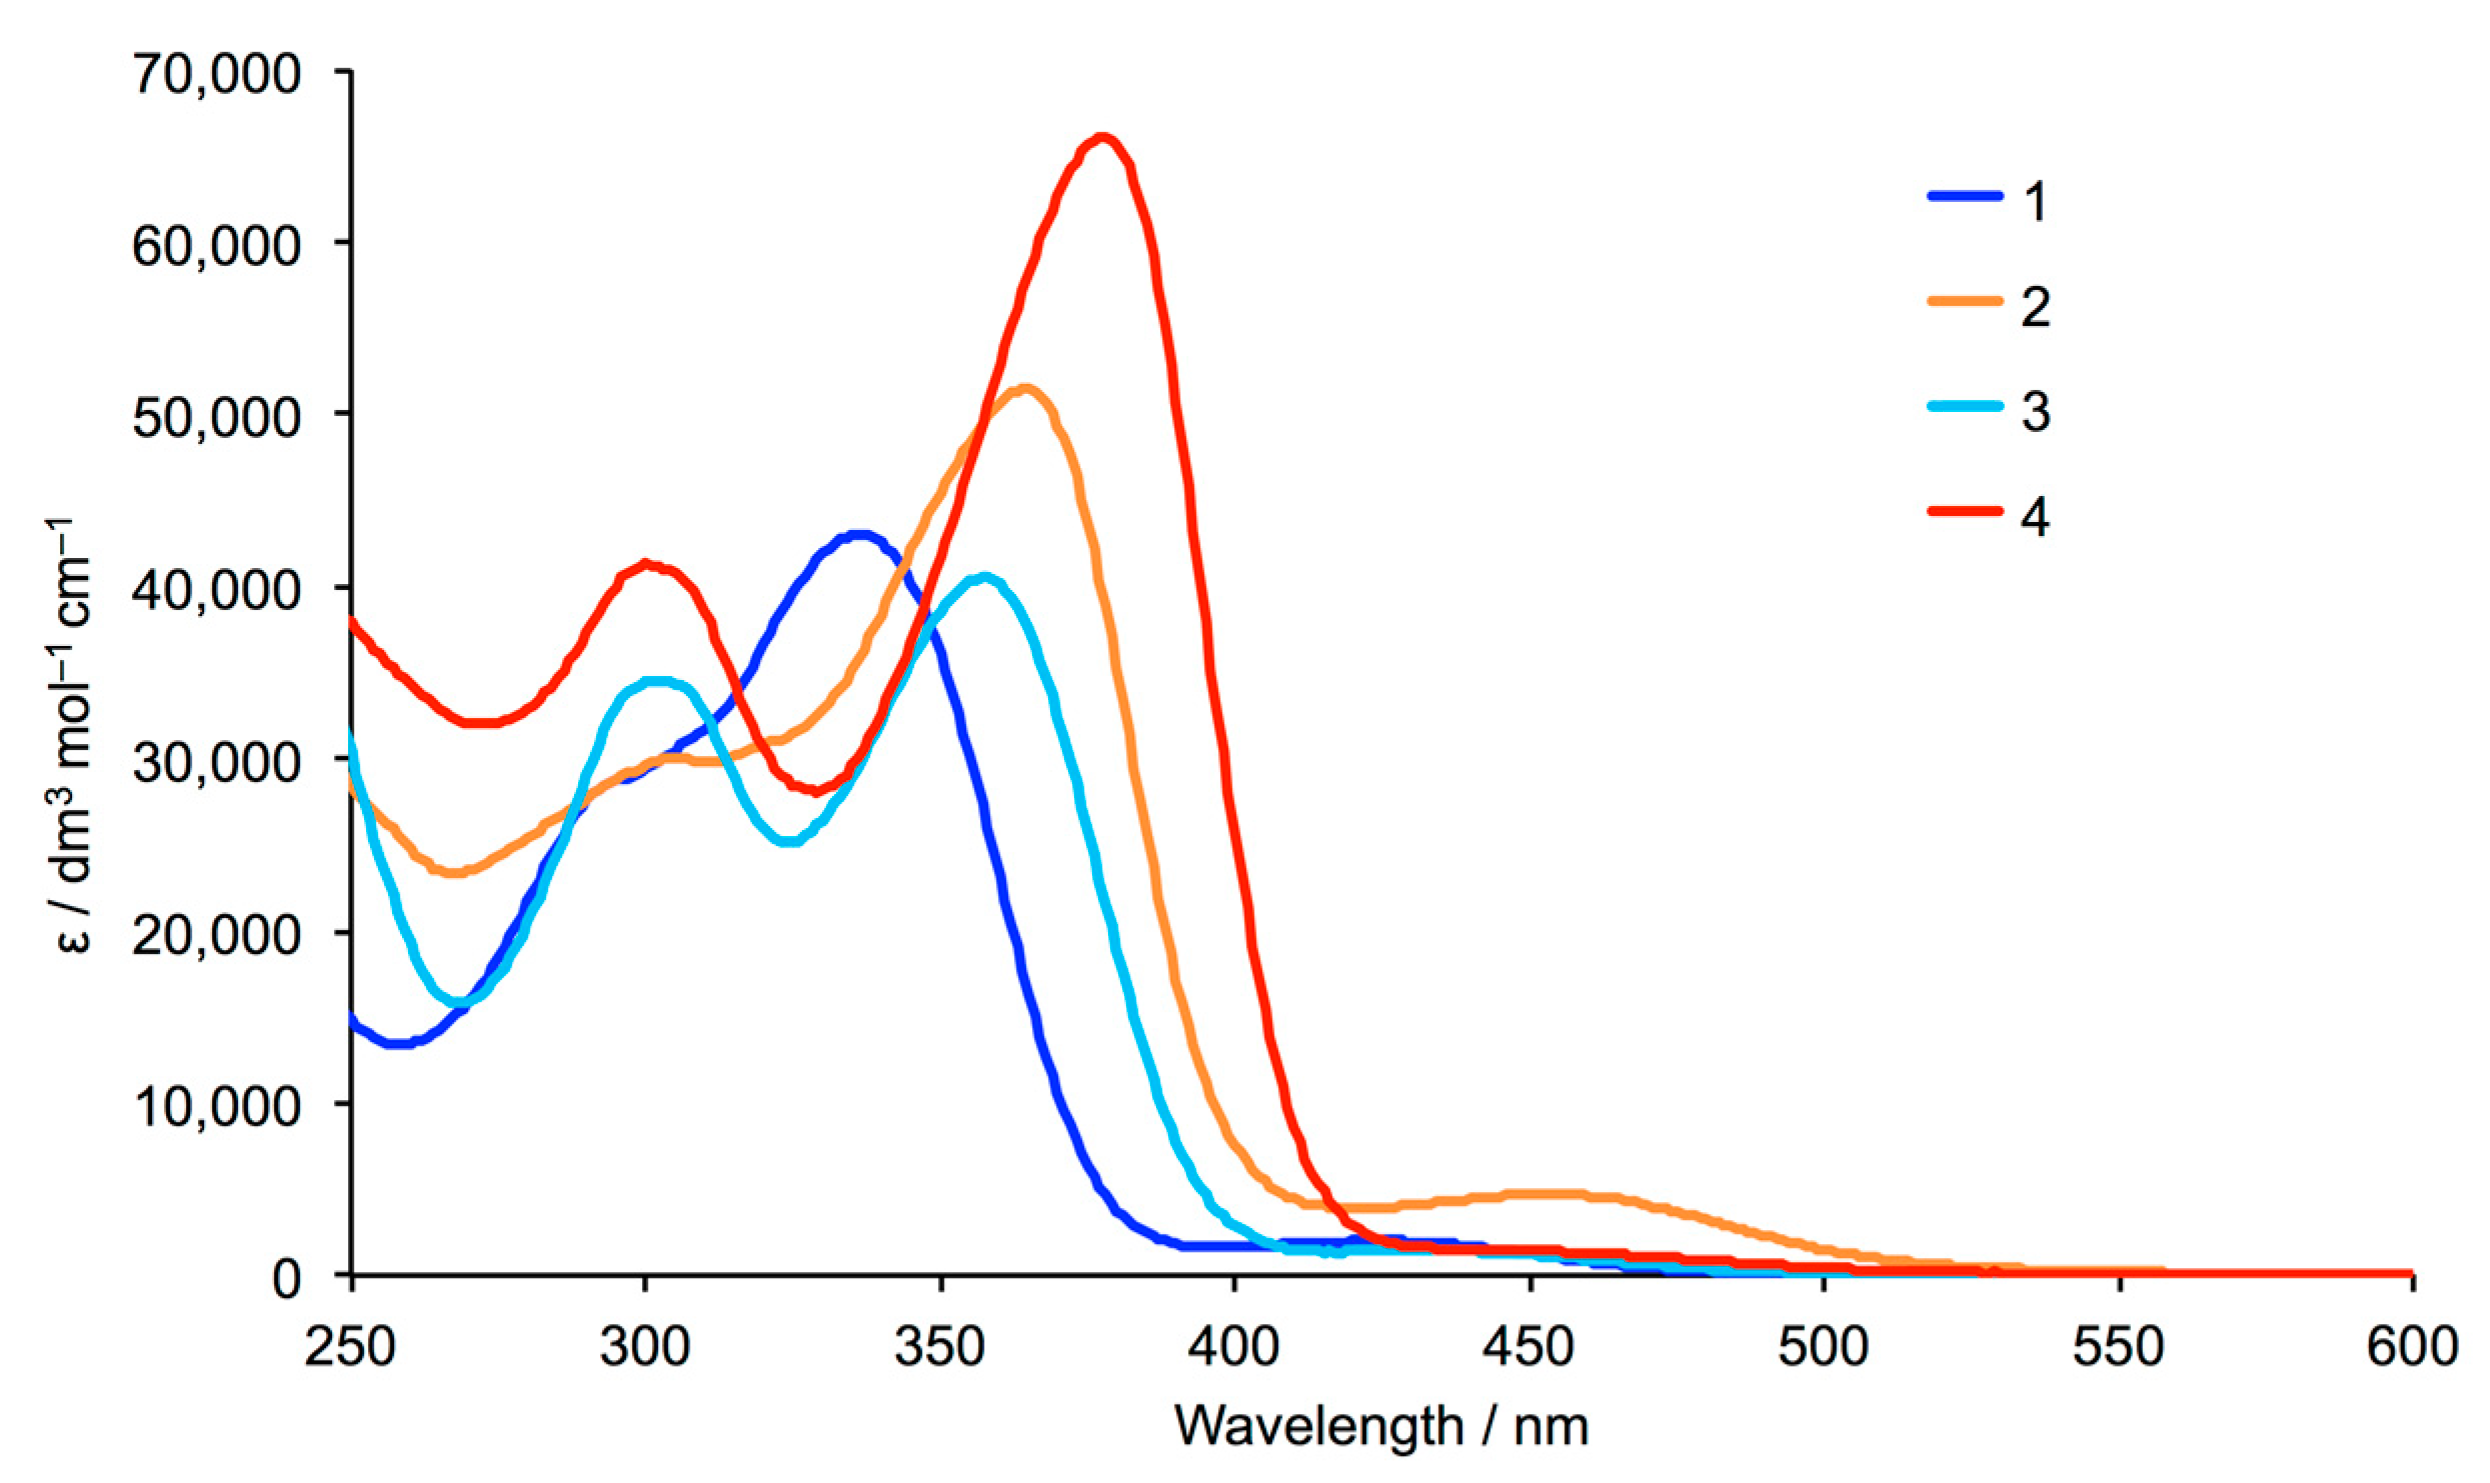
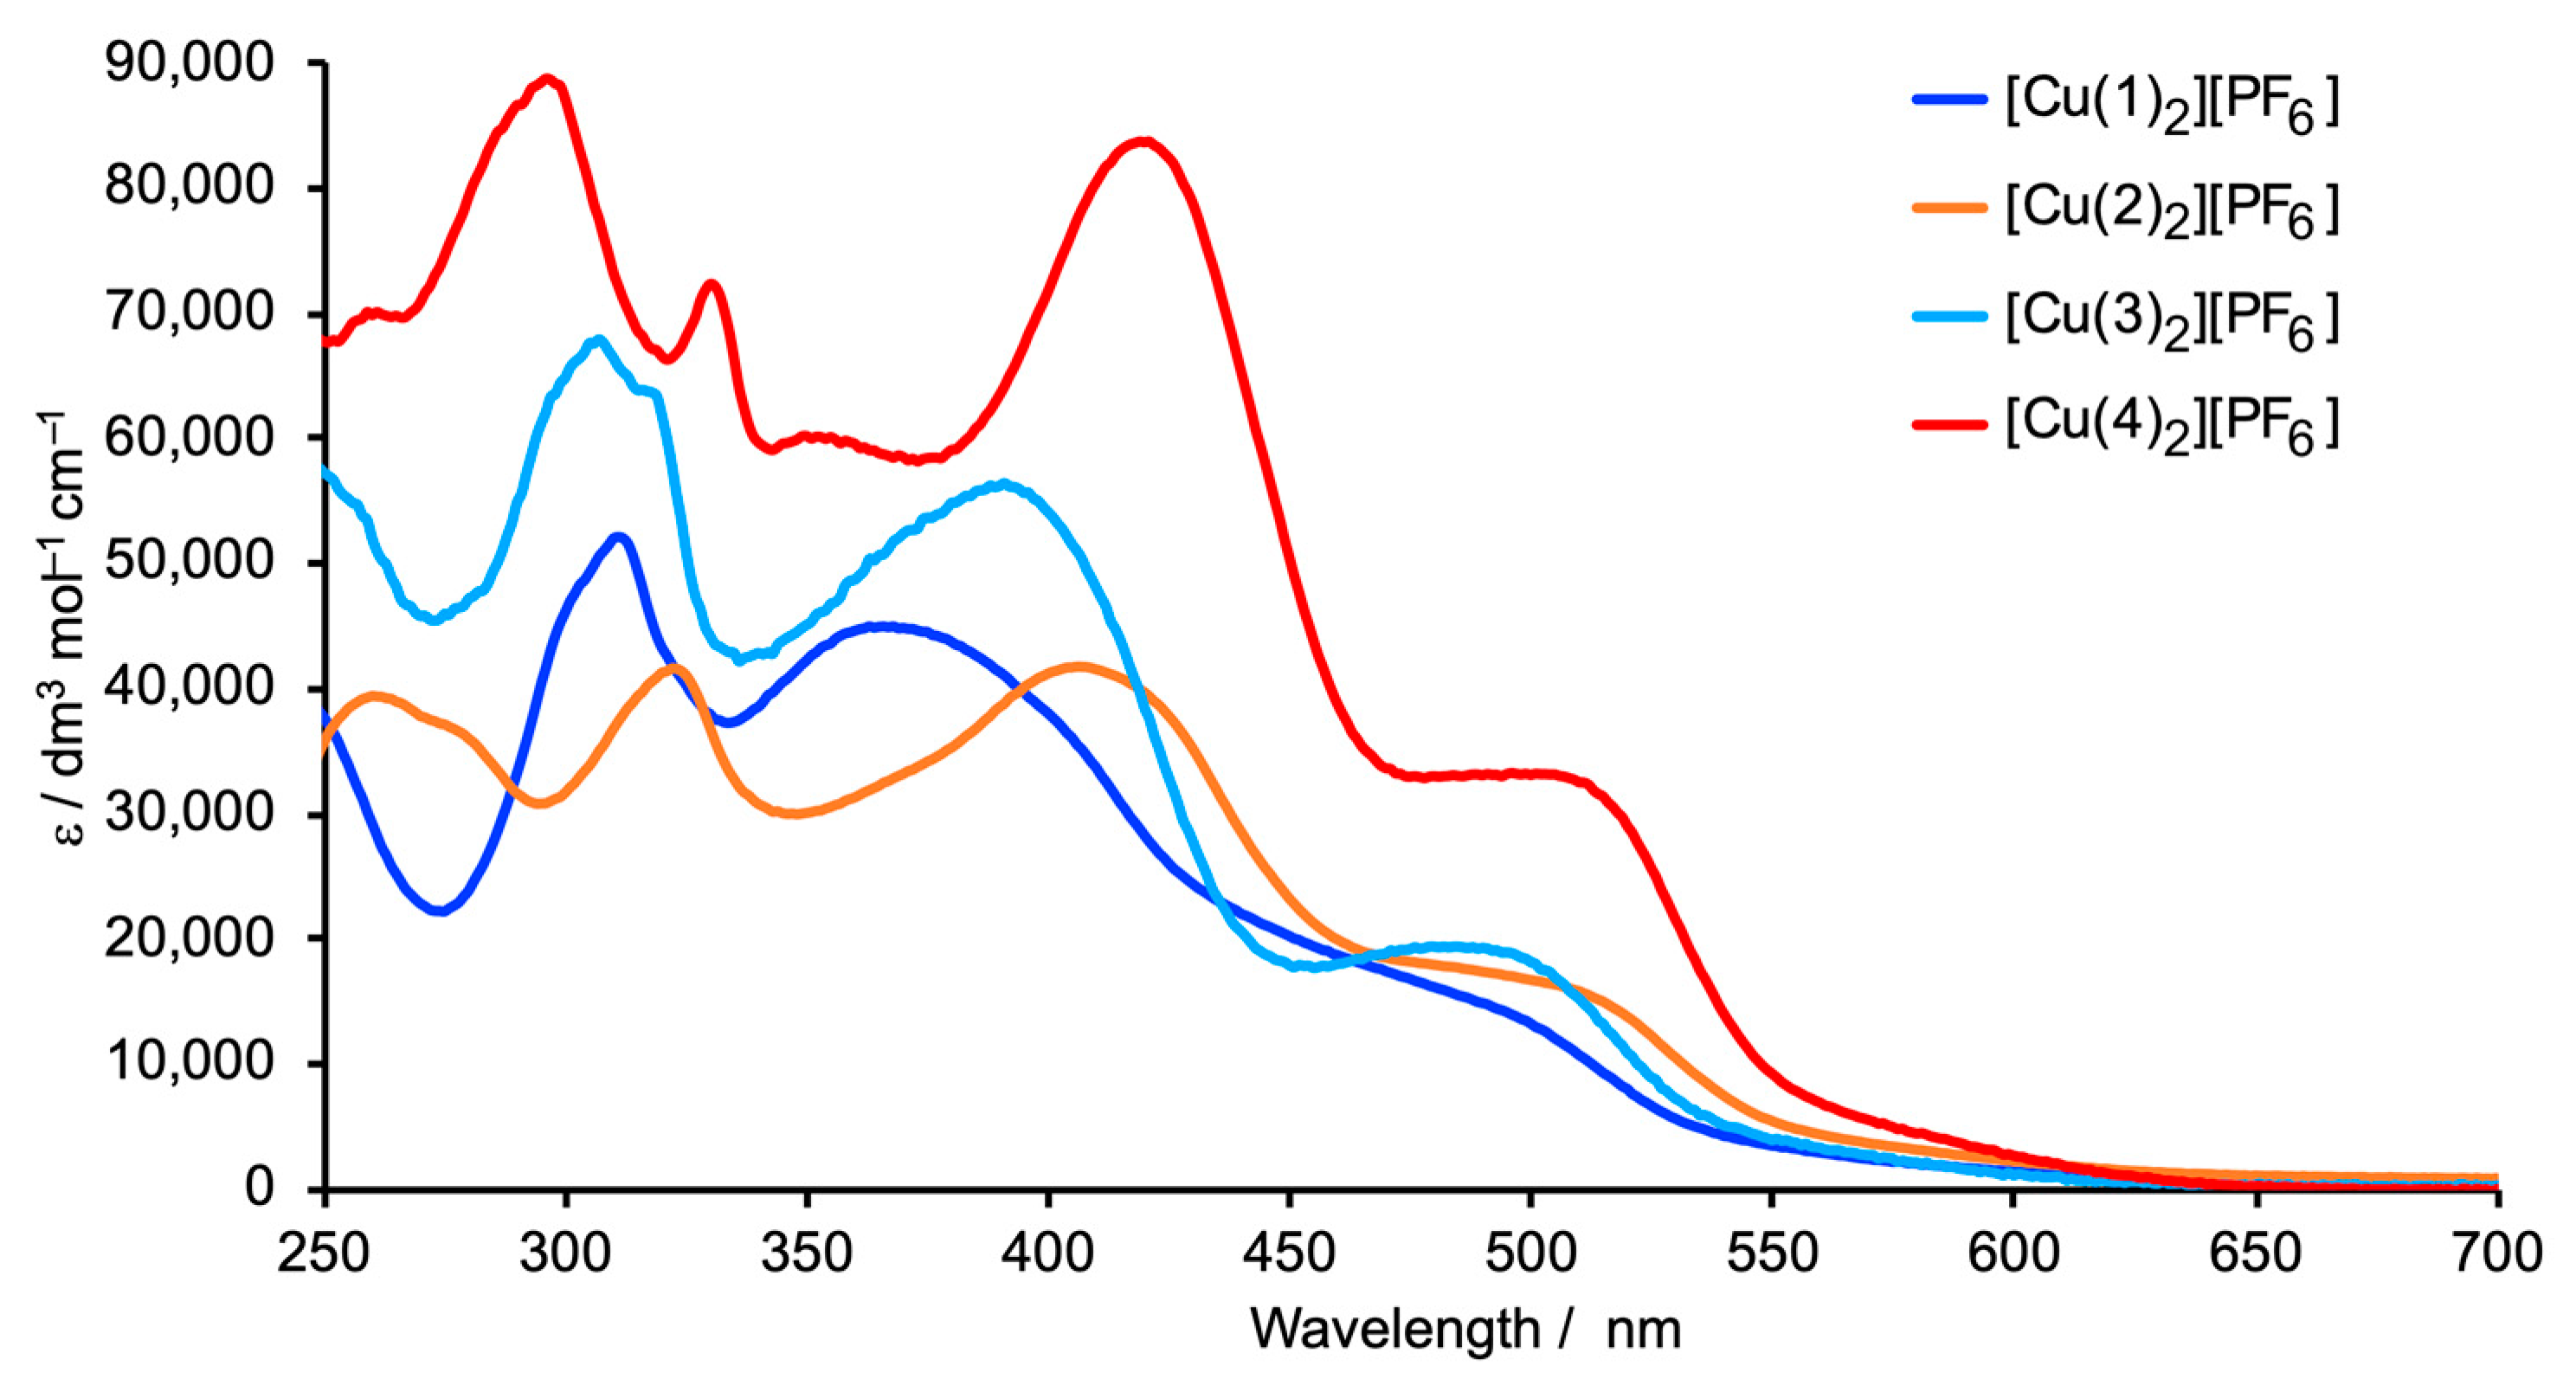
2.2. Syntheses and Characterization of Homoleptic Copper(I) Complexes
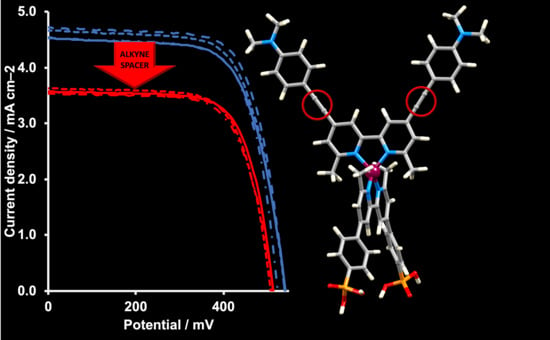
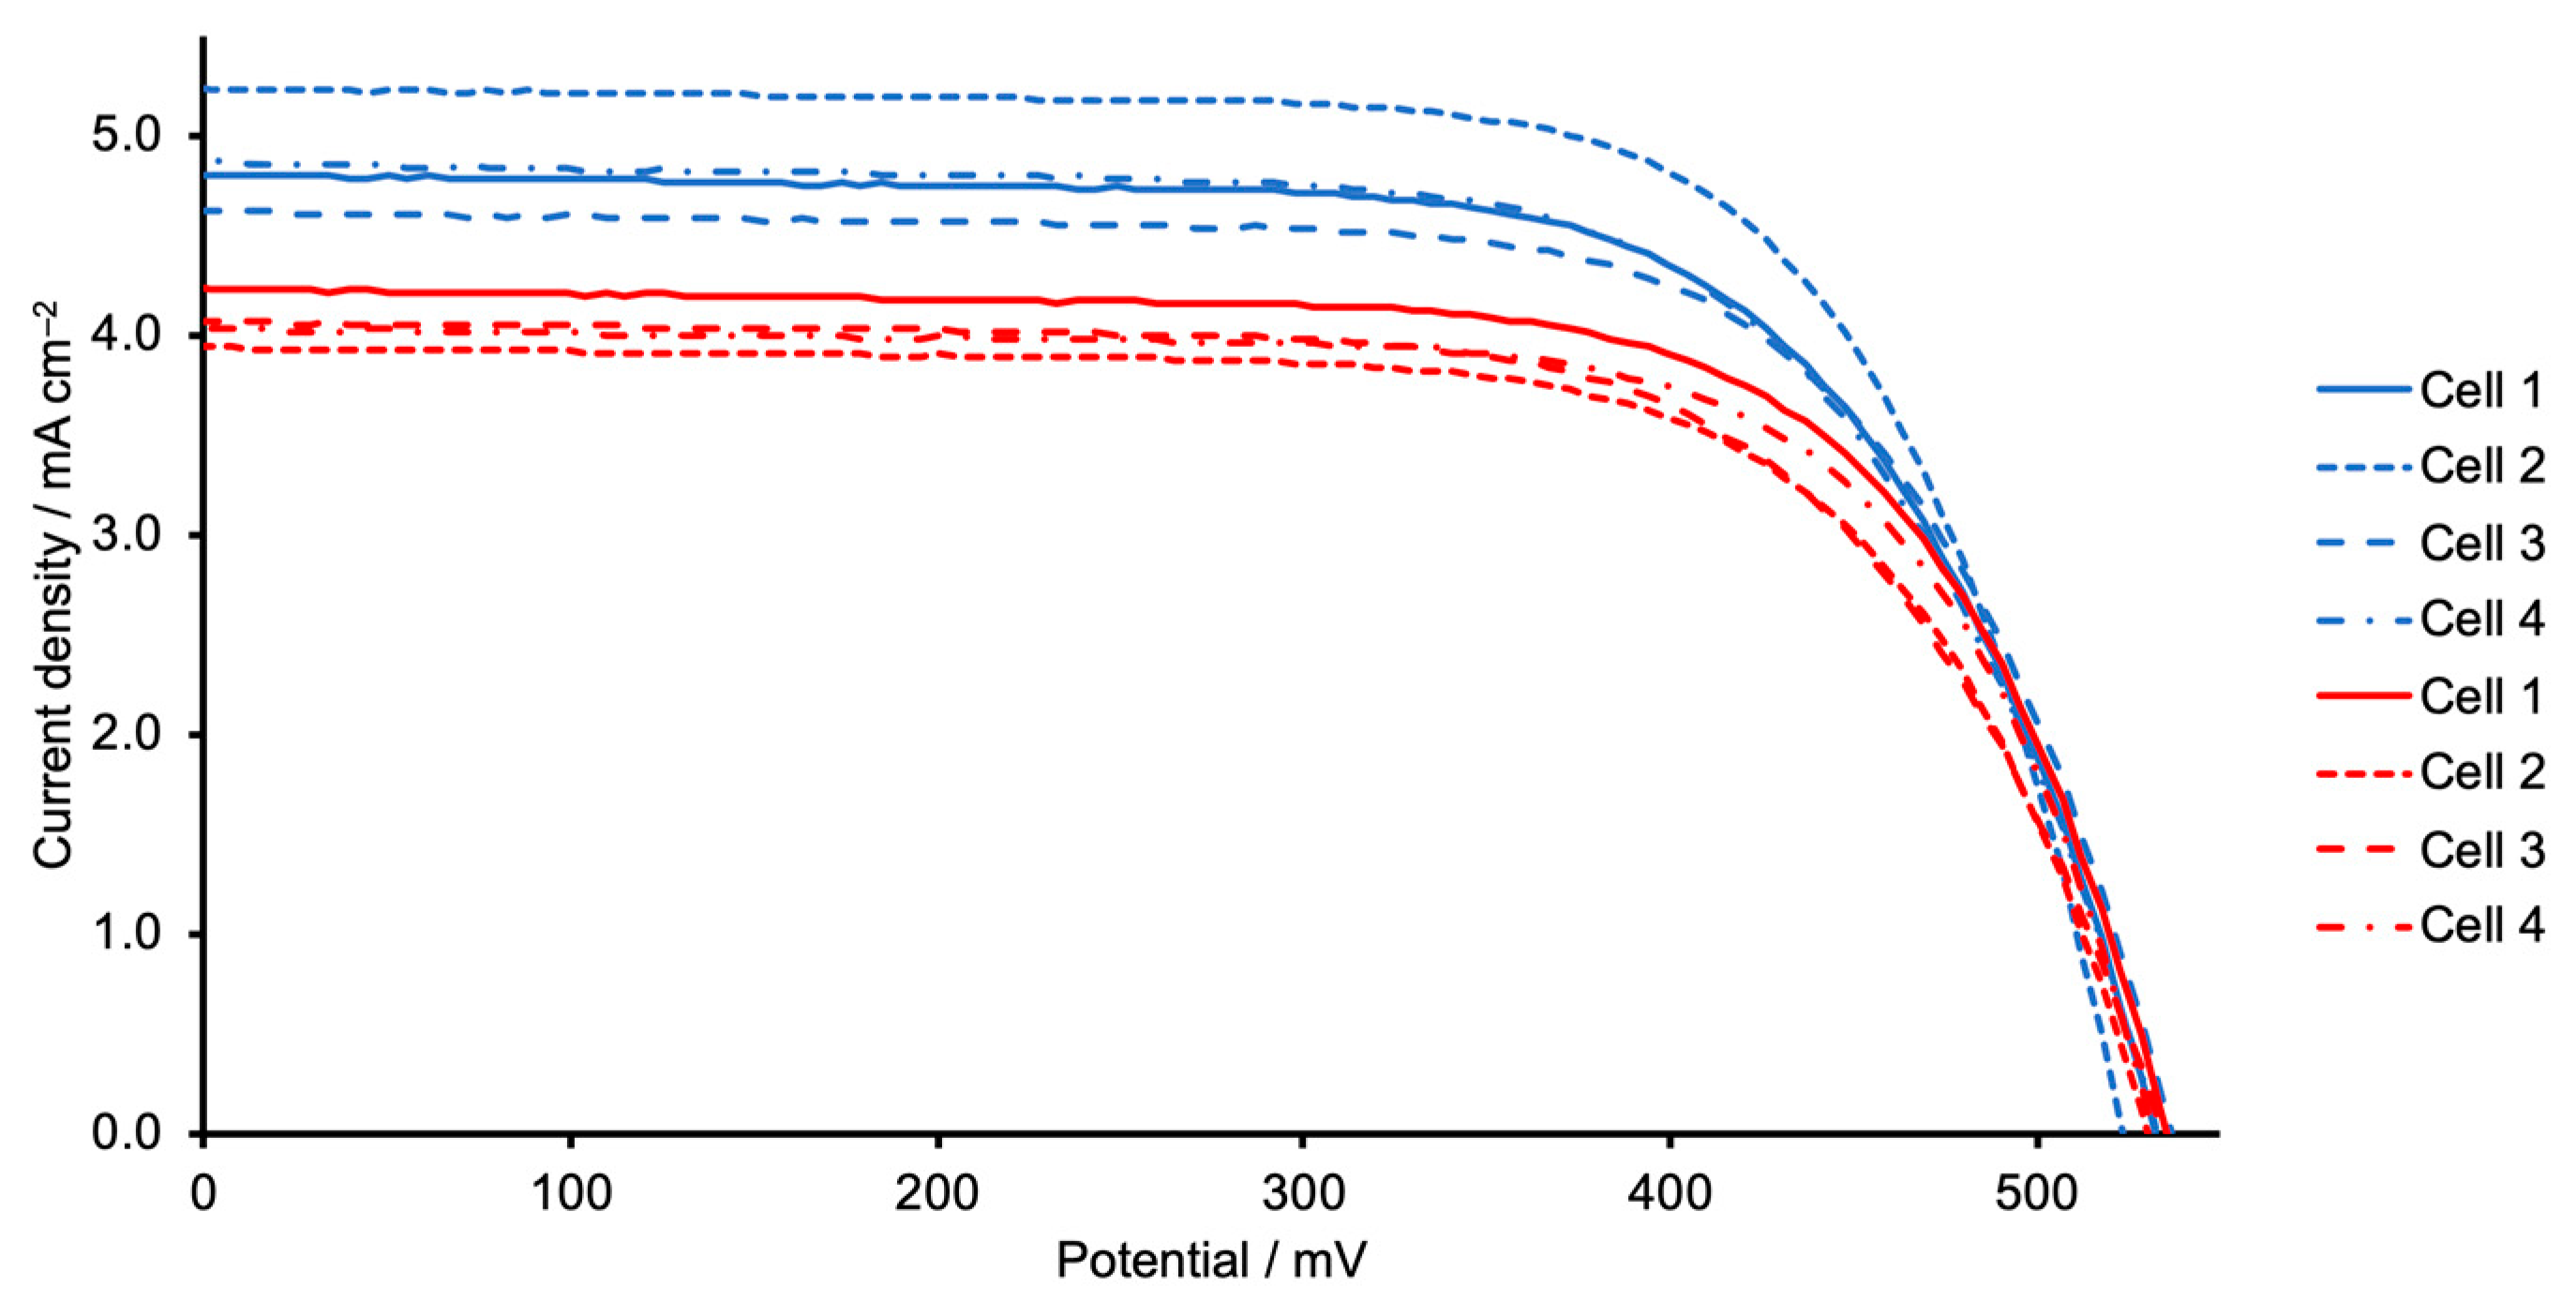
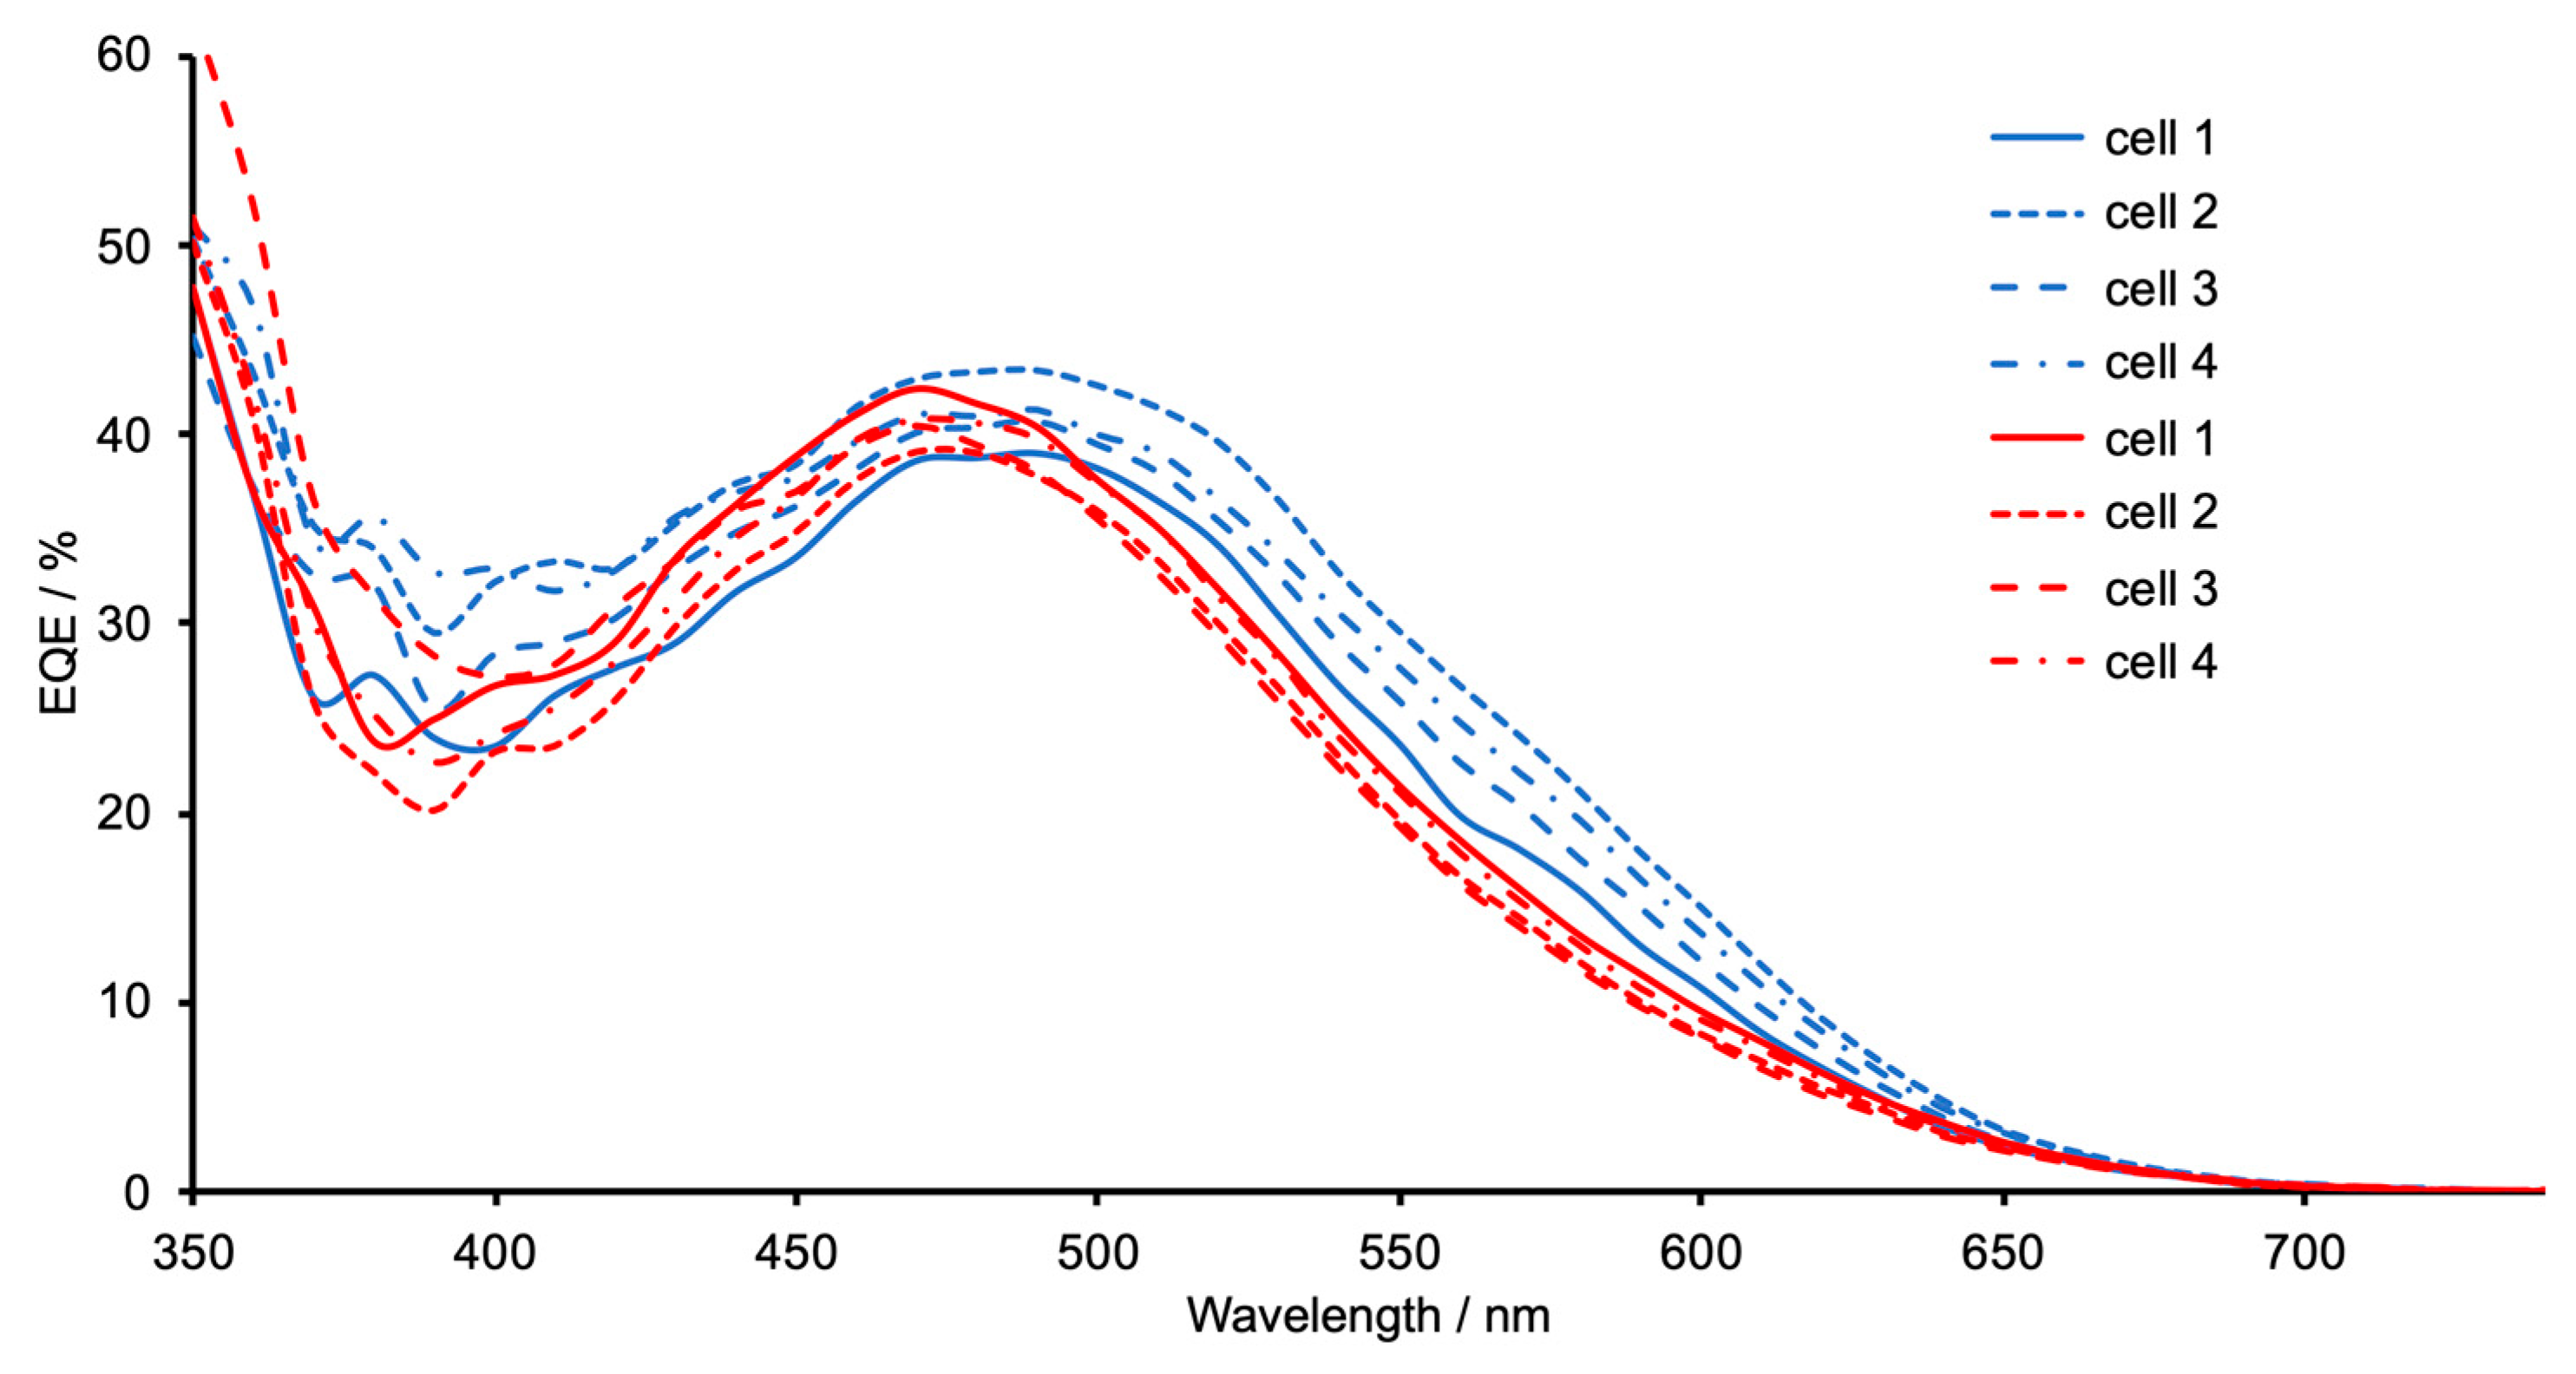
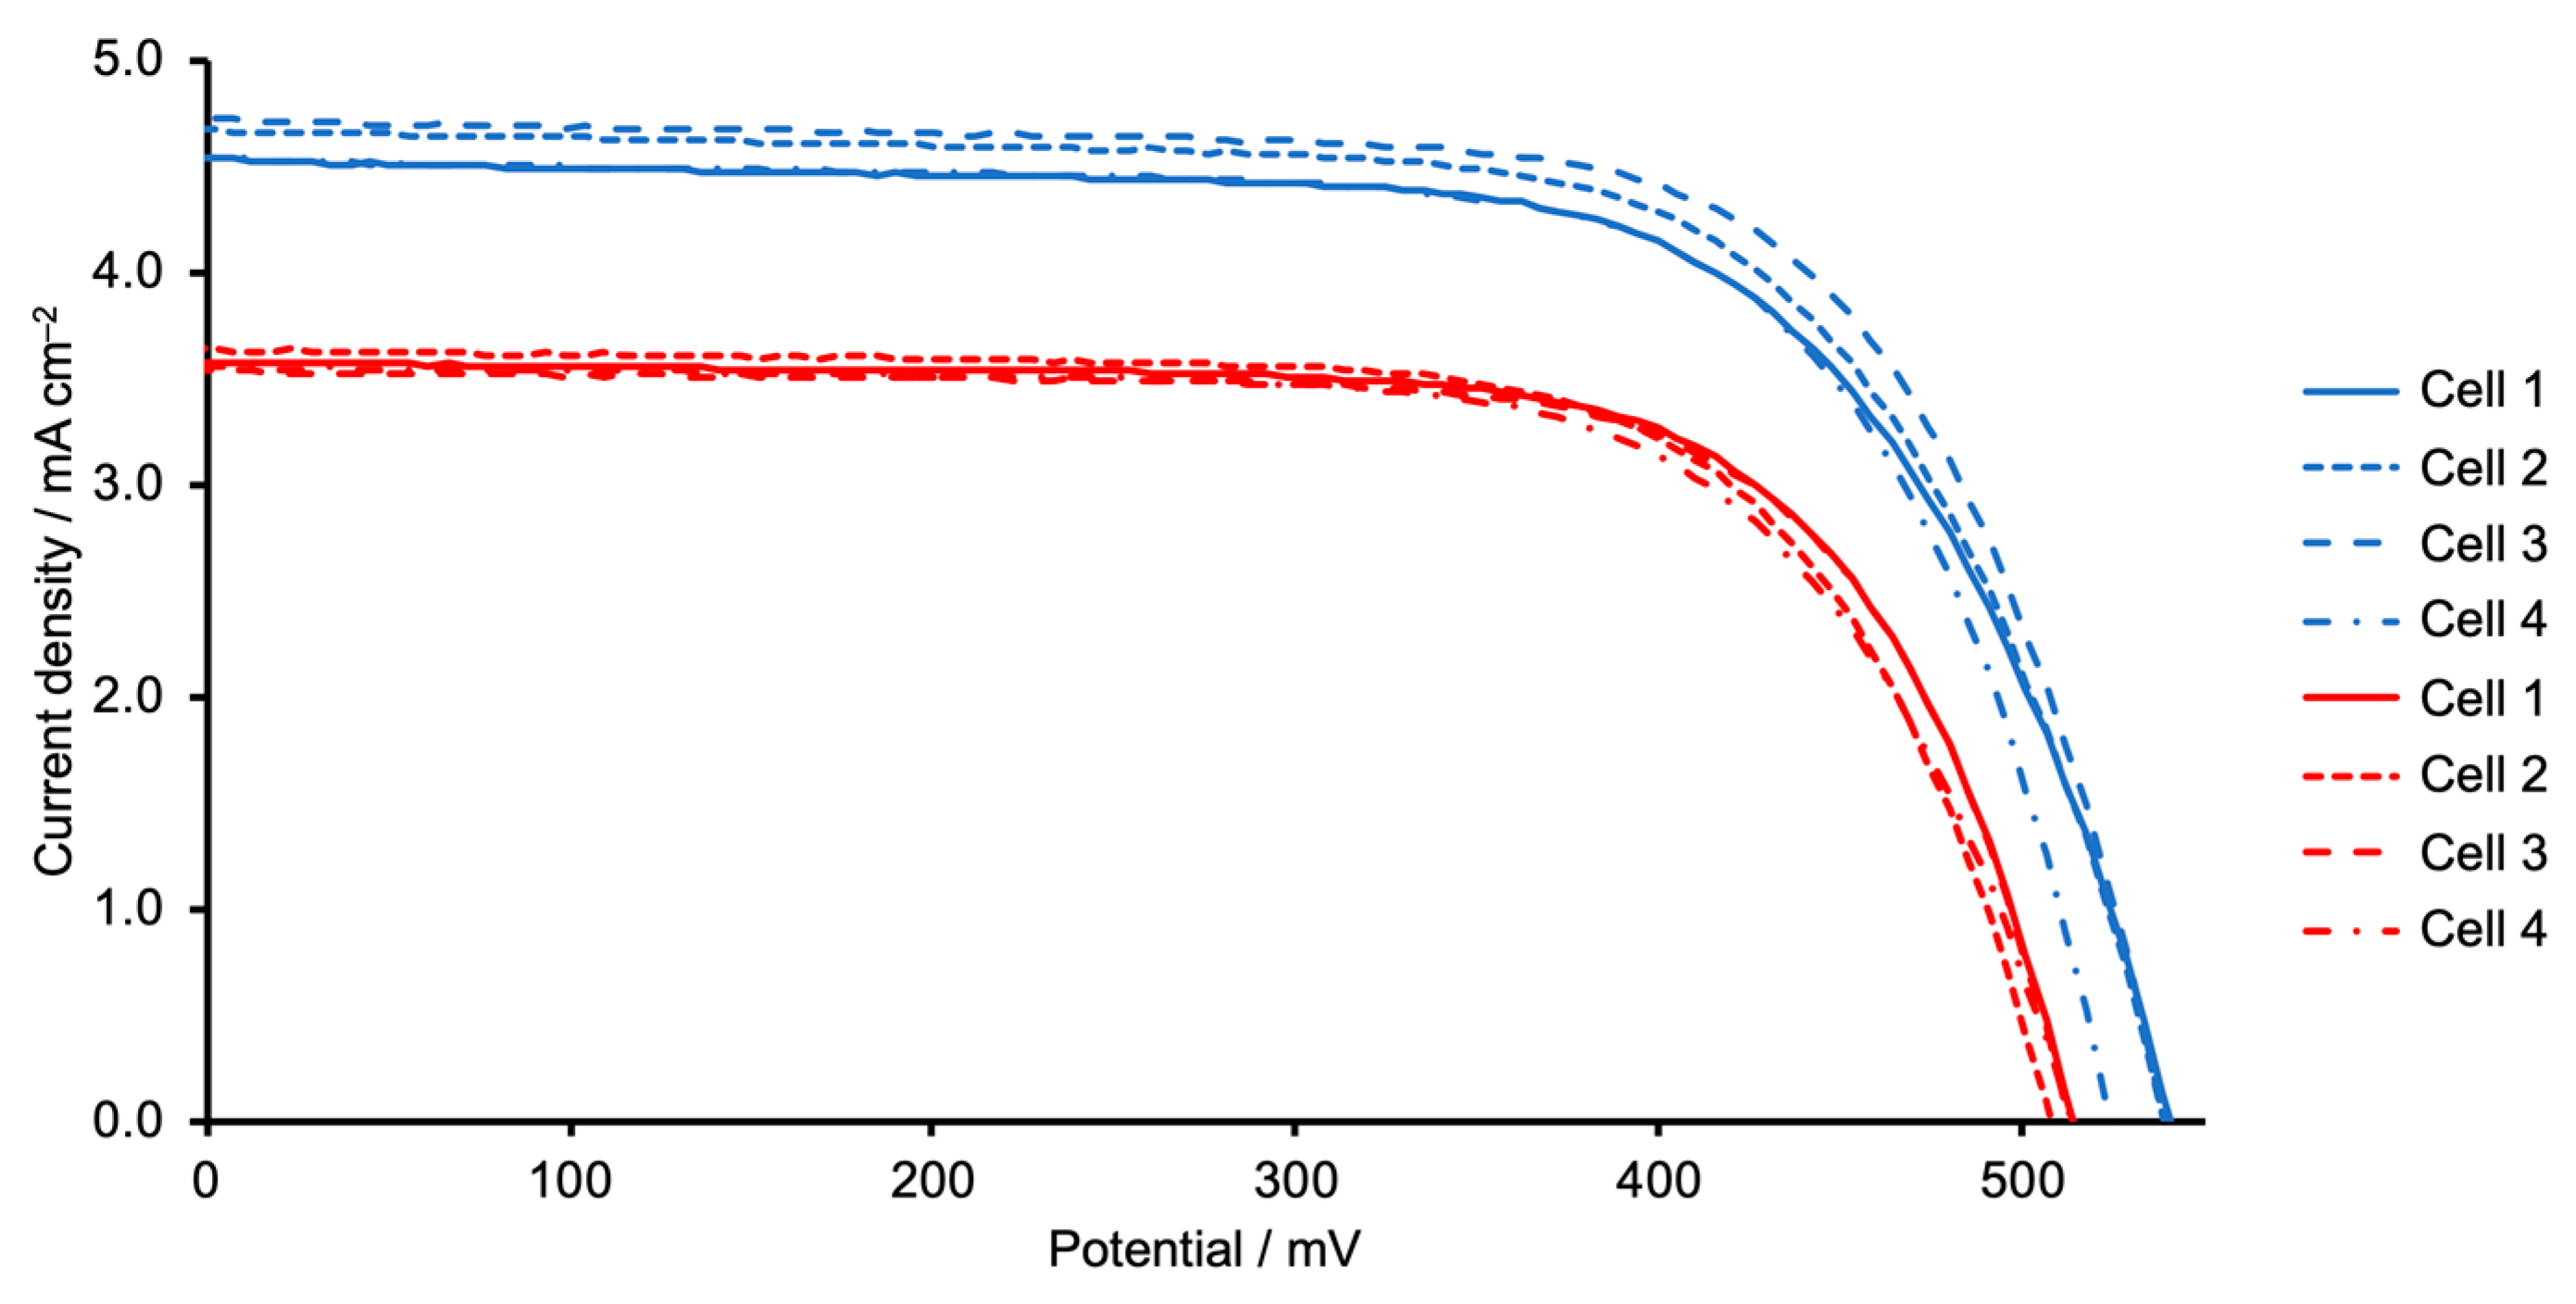
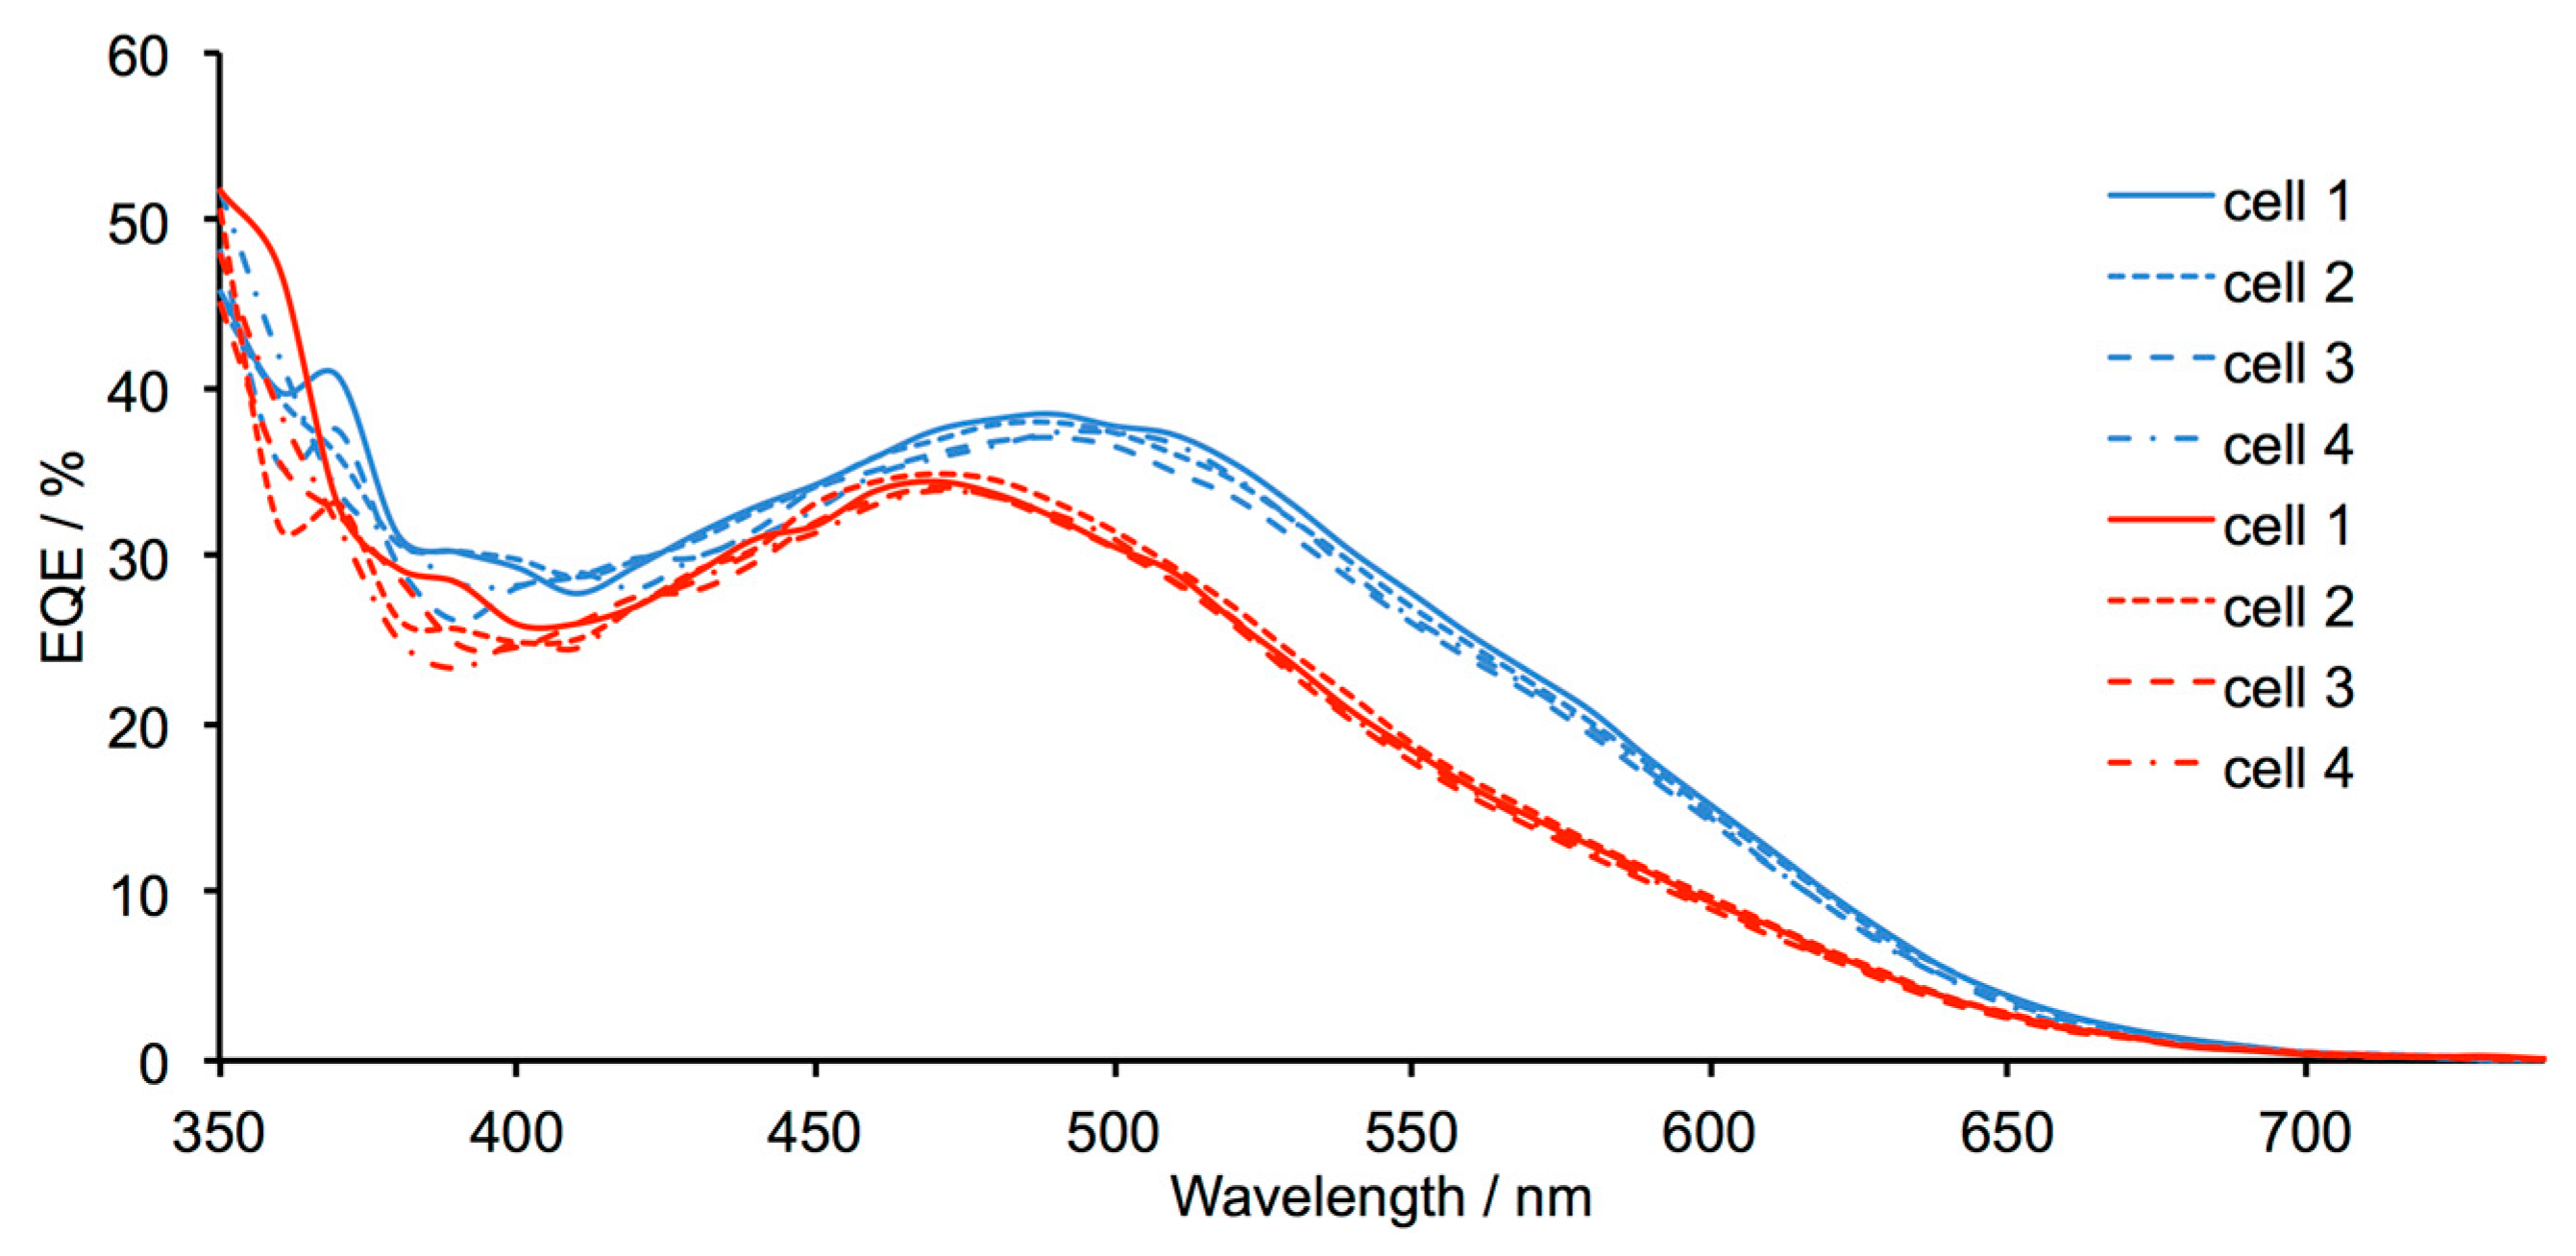
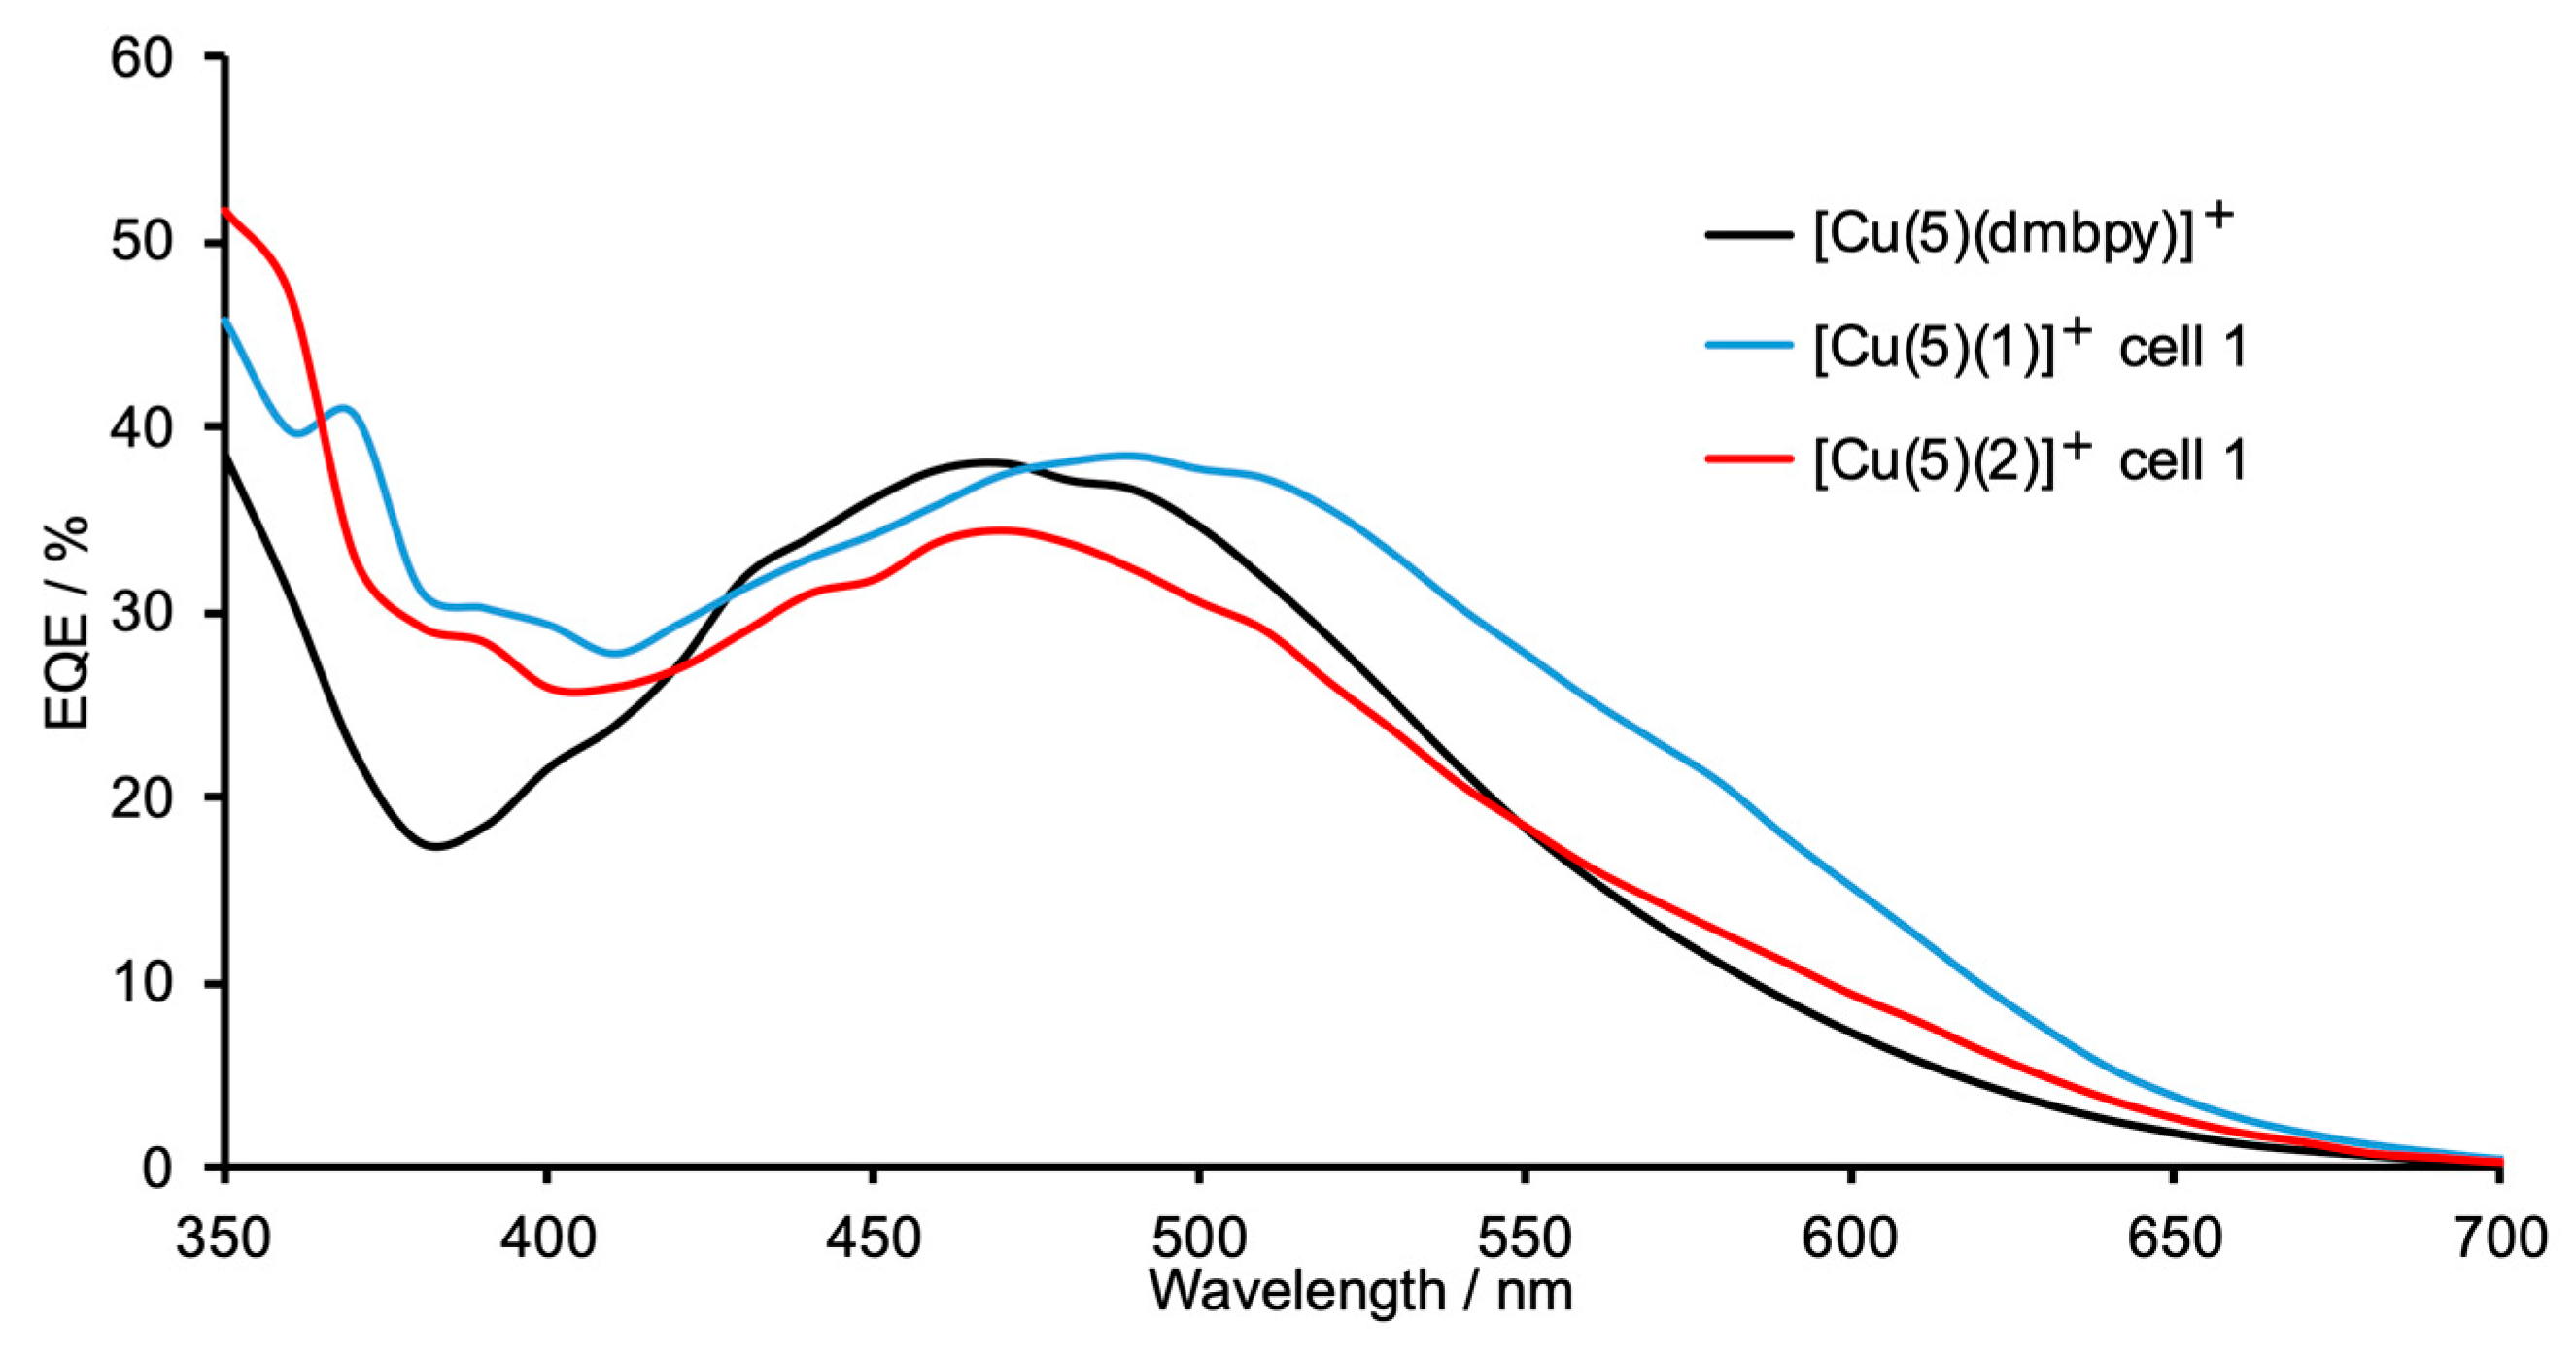
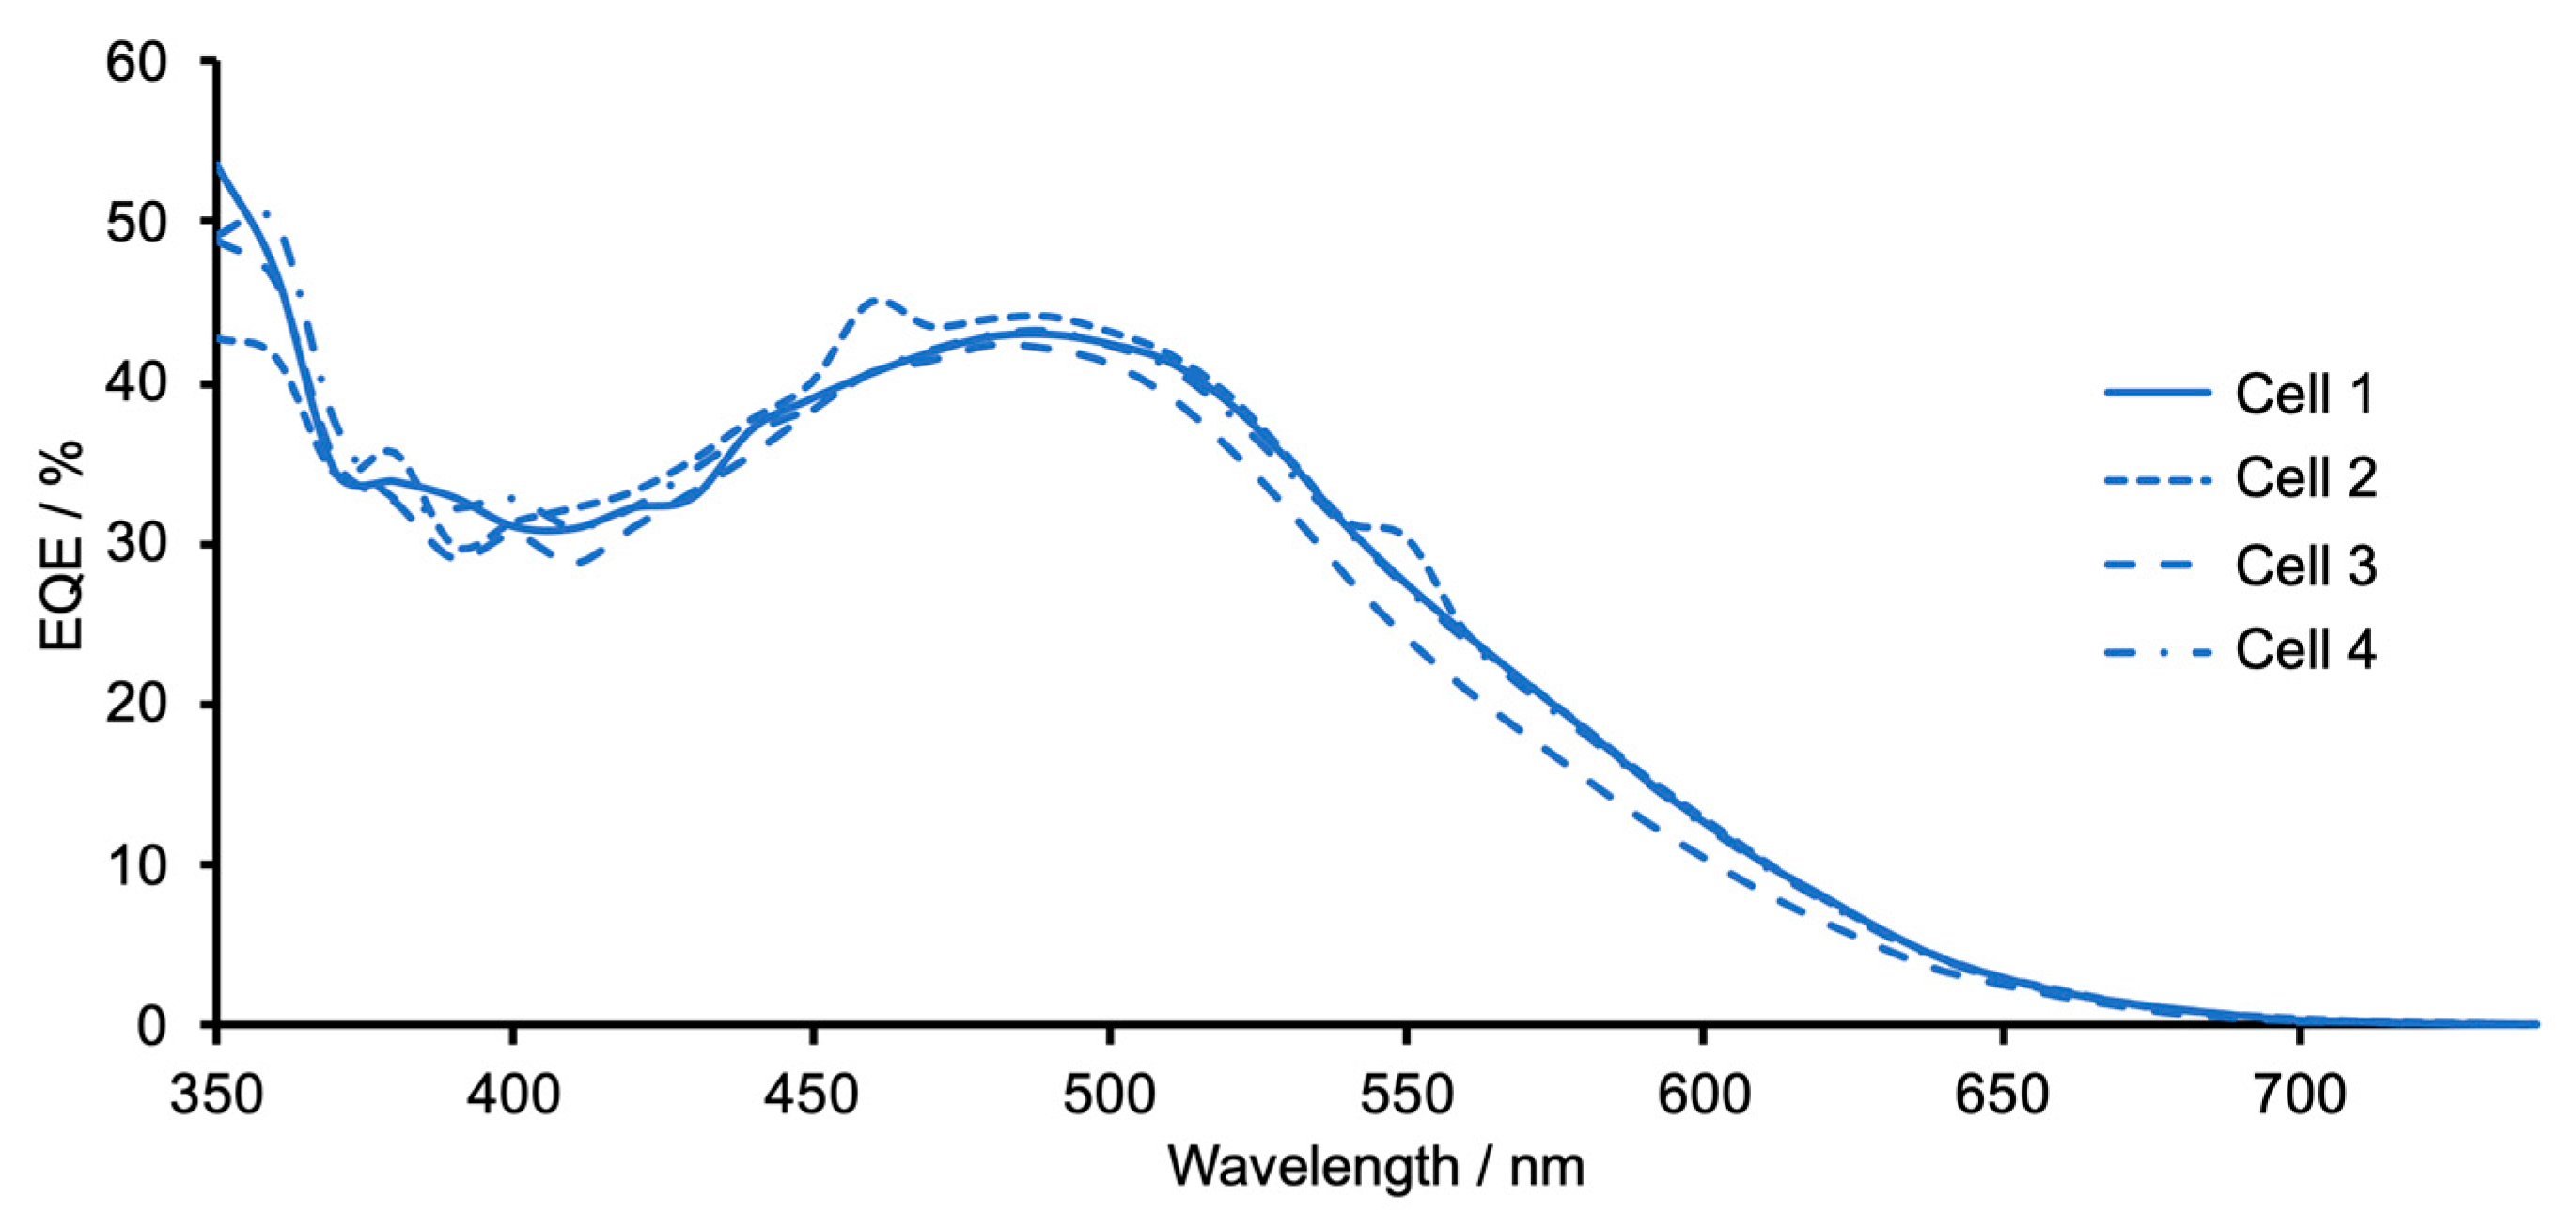
2.3. Solid-State Absorption Spectra of the Surface-Bound Dyes and DSC Performances
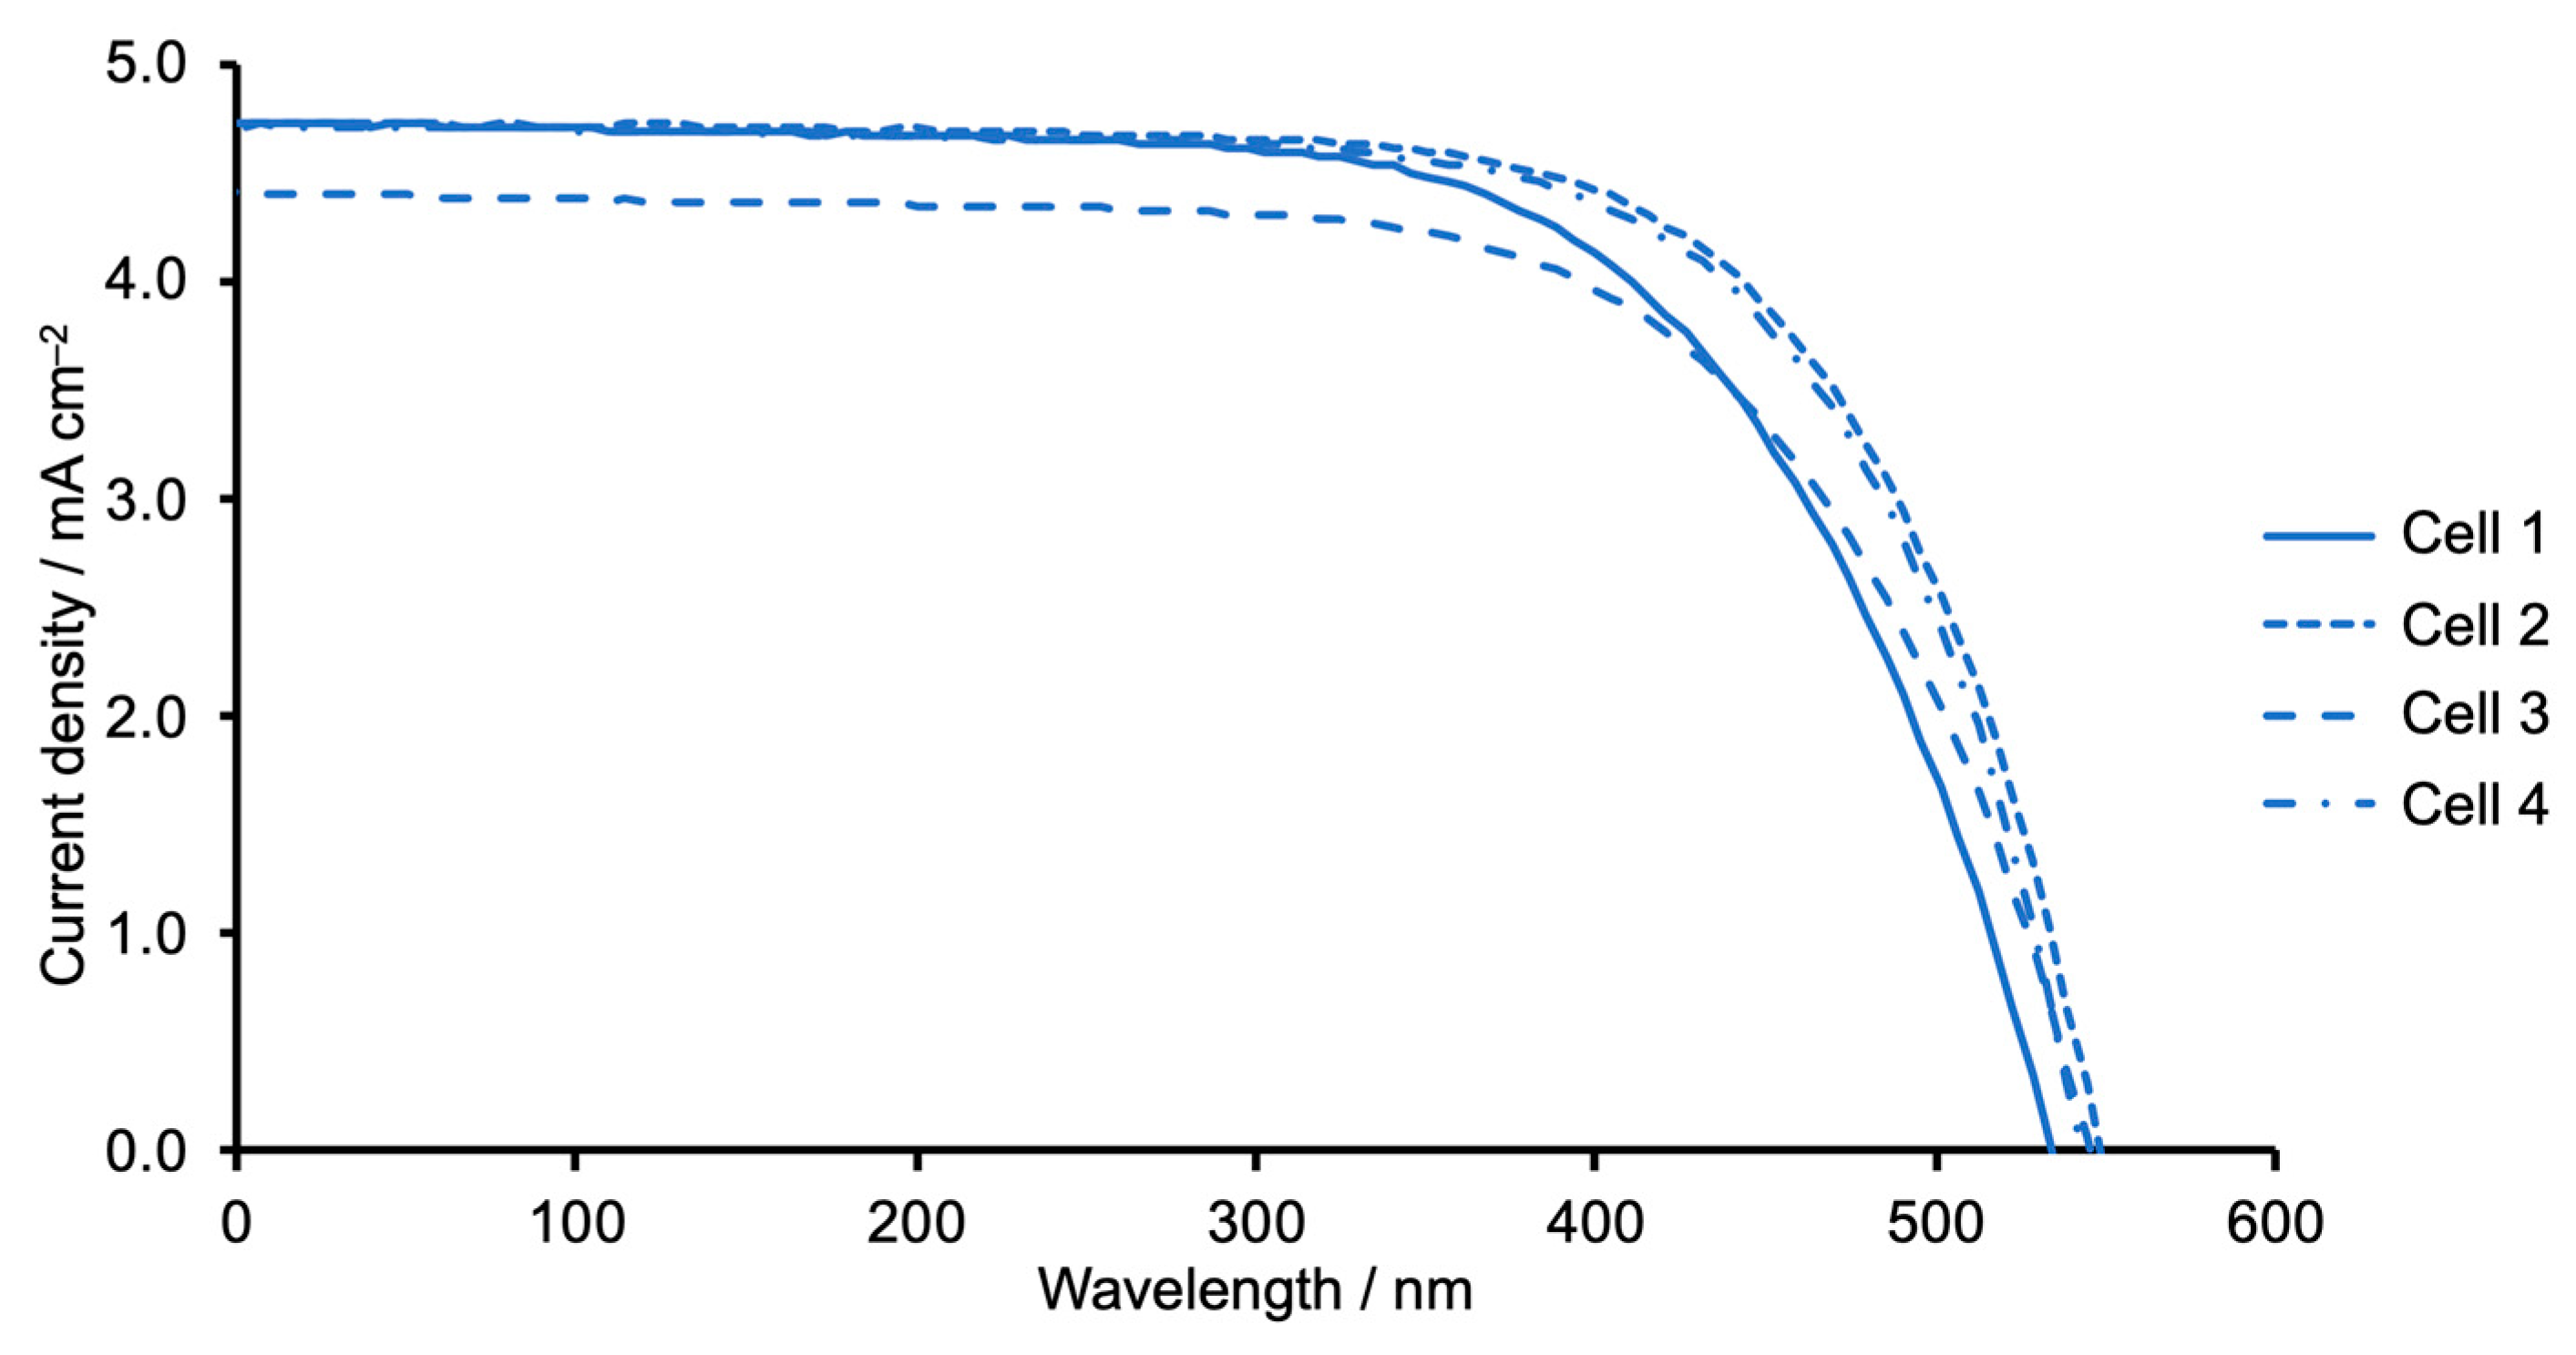
2.4. Effects of Adding a Co-Adsorbent
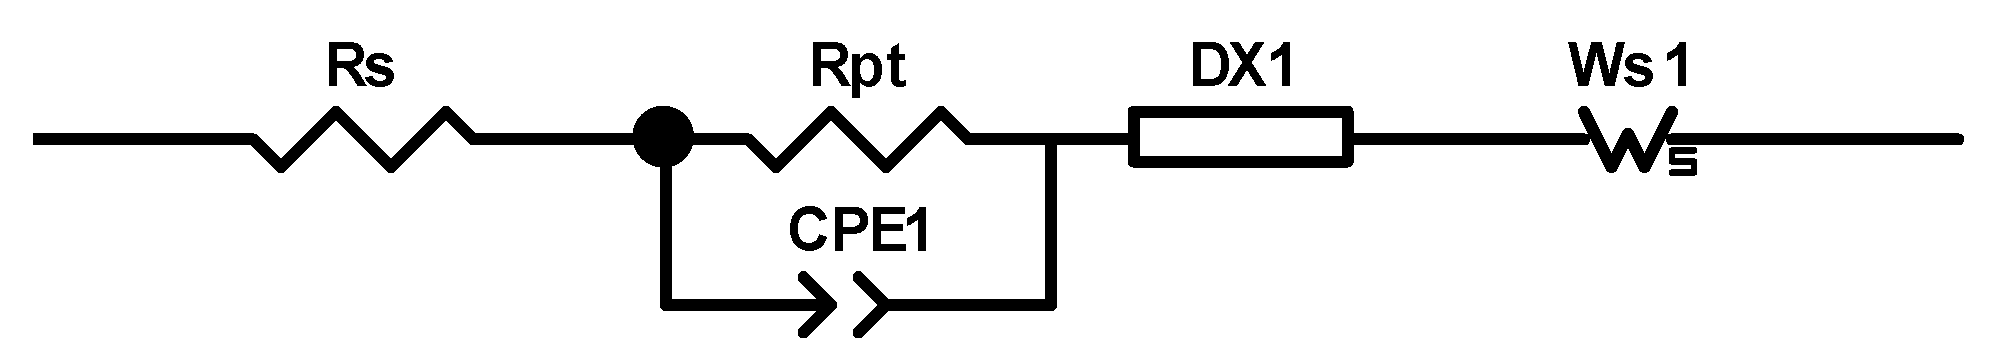
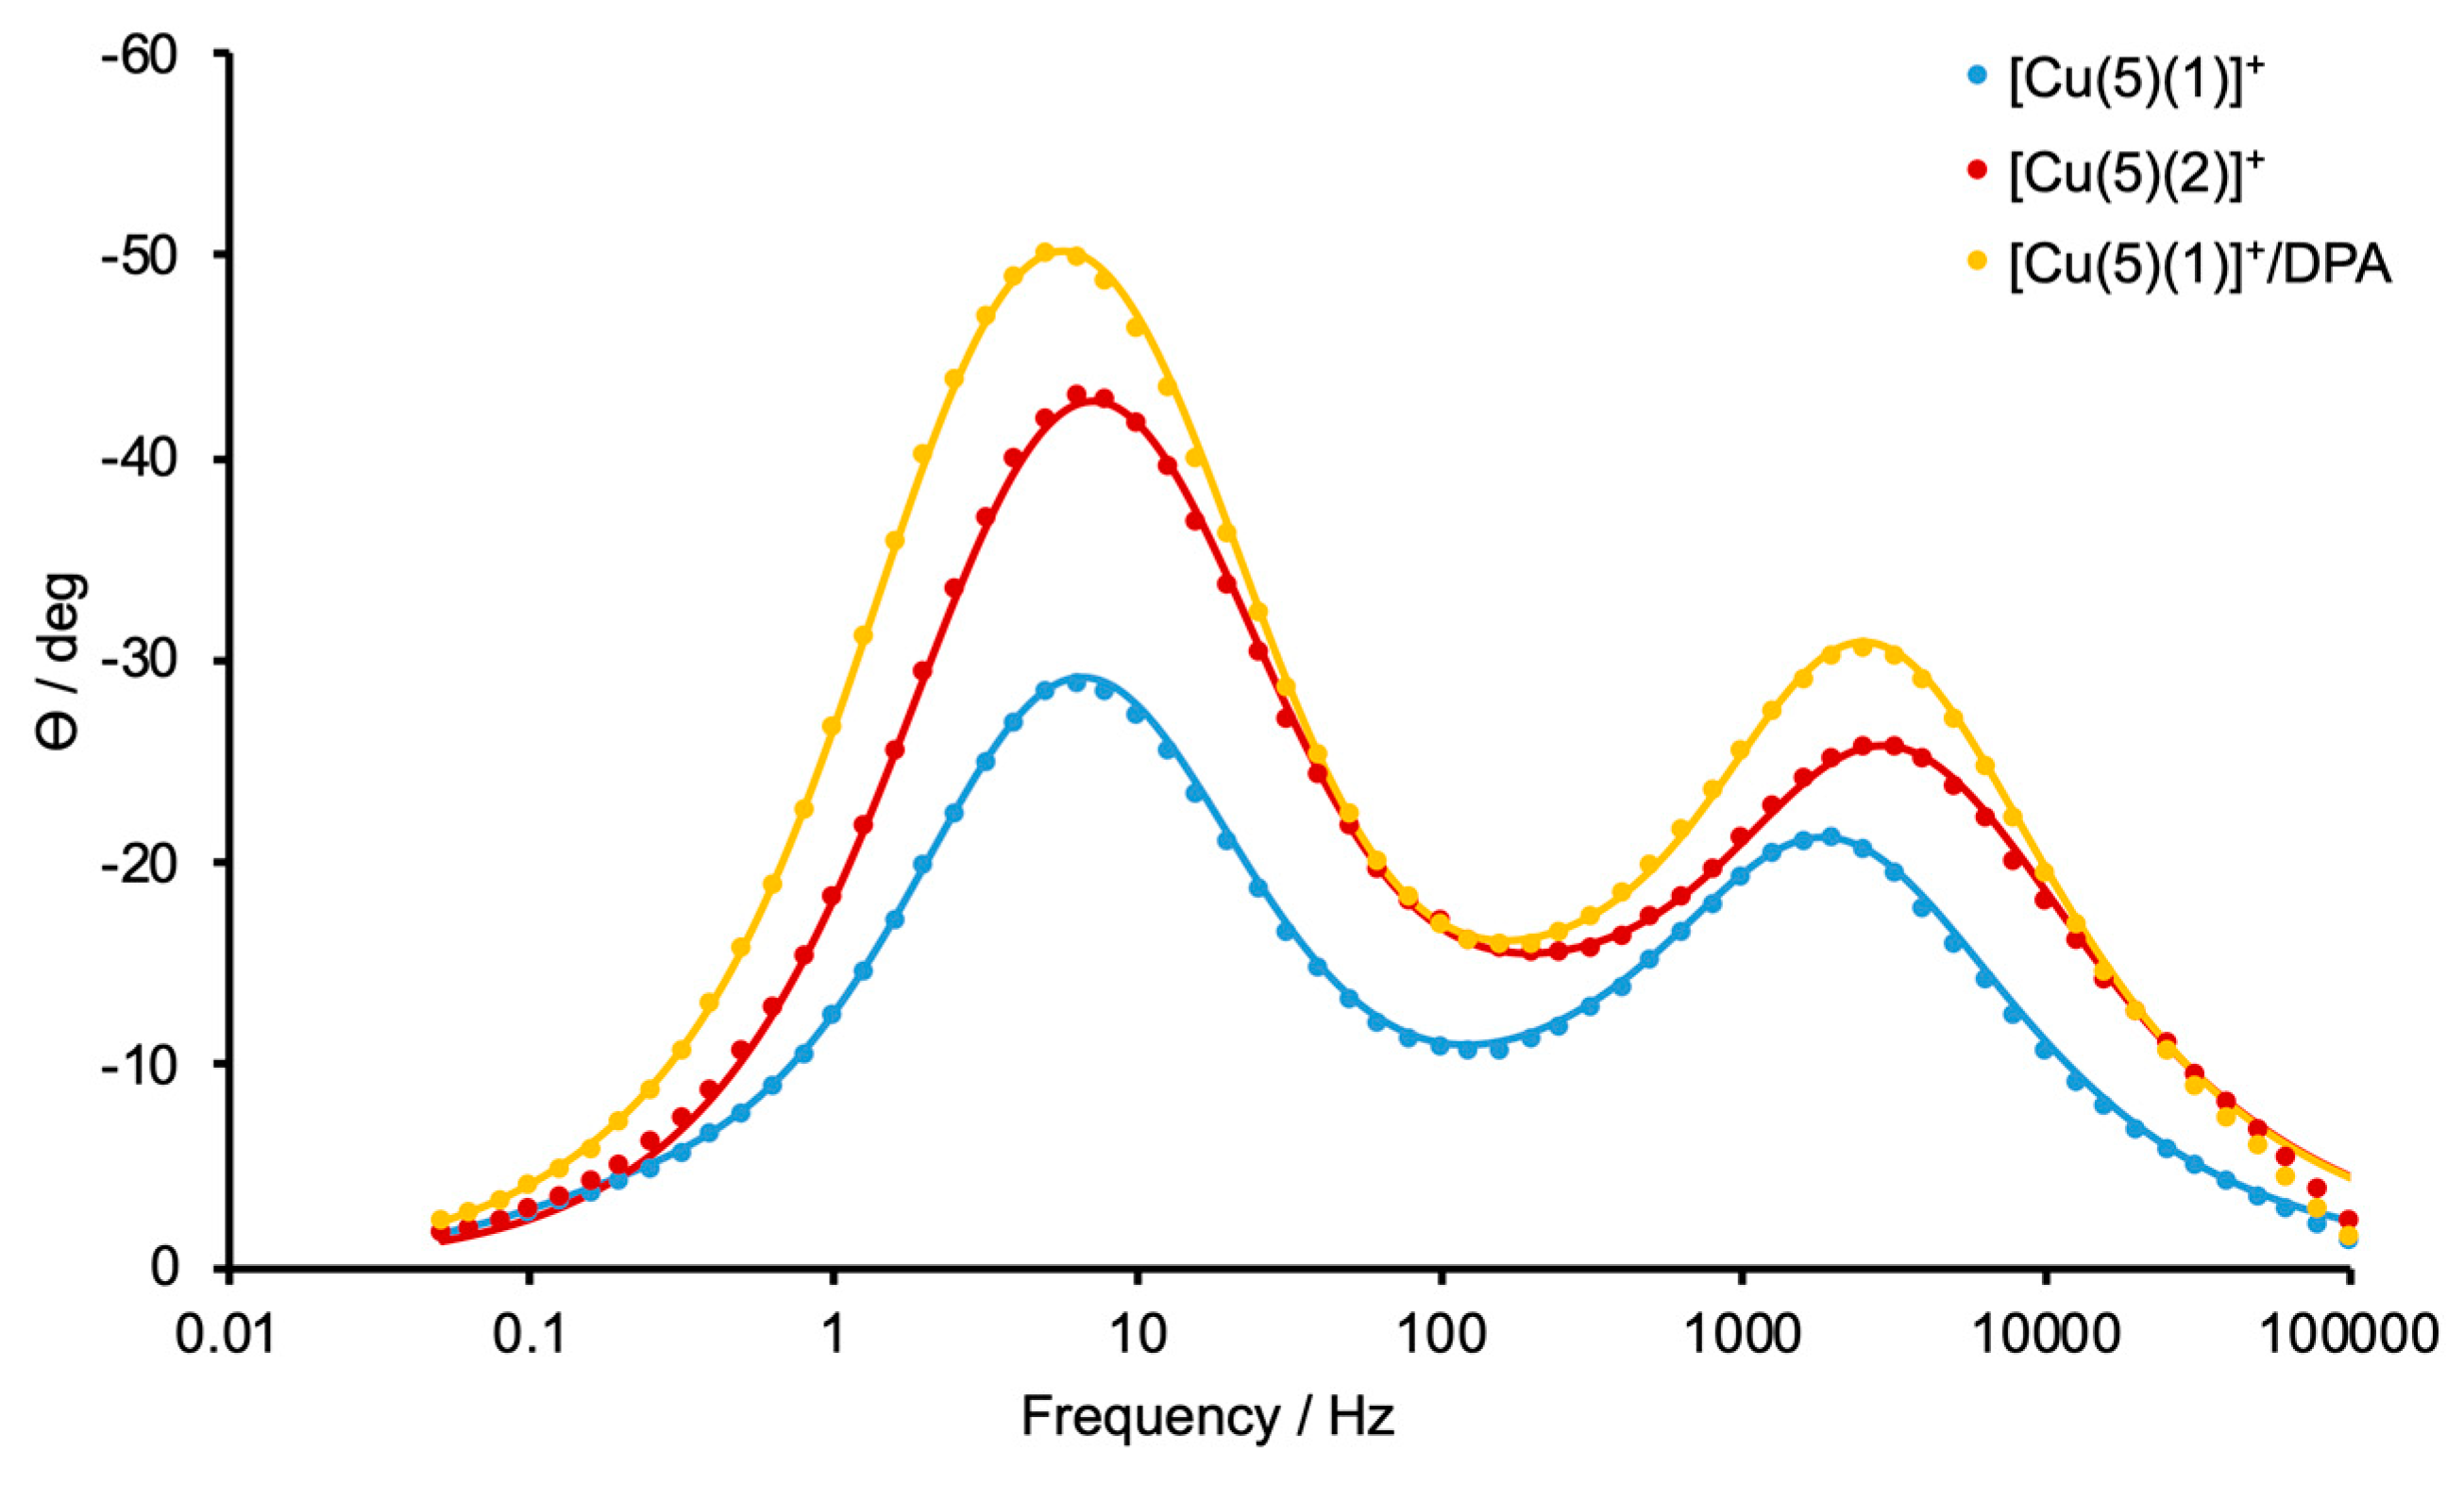
2.5. Electrochemical Impedance Spectroscopy (EIS)
3. Materials and Methods
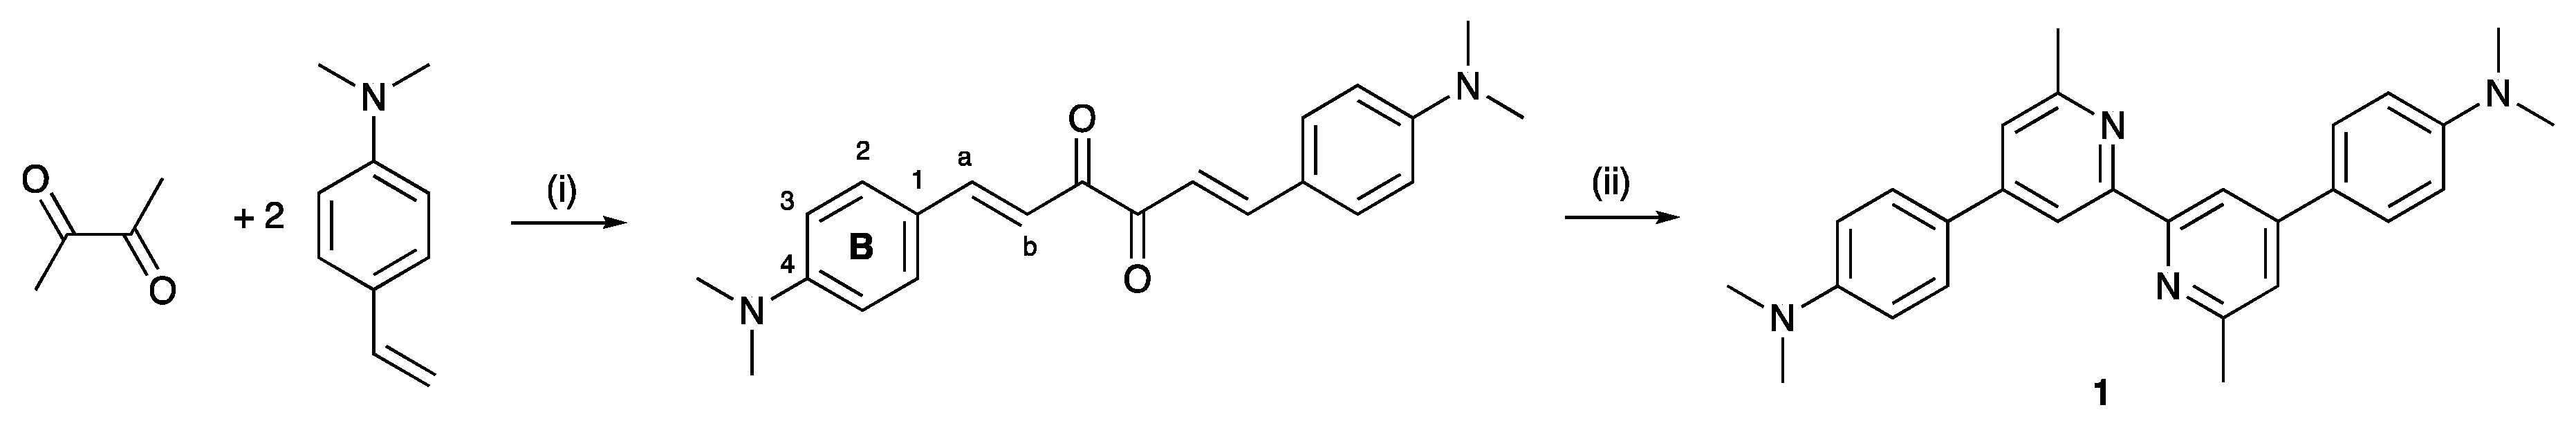
3.1. (1E,5E)-1,6-Bis(4-(dimethylamino)phenyl)hexa-1,5-diene-3,4-dione
3.2. 4,4′-Bis(4-dimethylaminophenyl)-6,6′-dimethyl-2,2′-bipyridine (1)
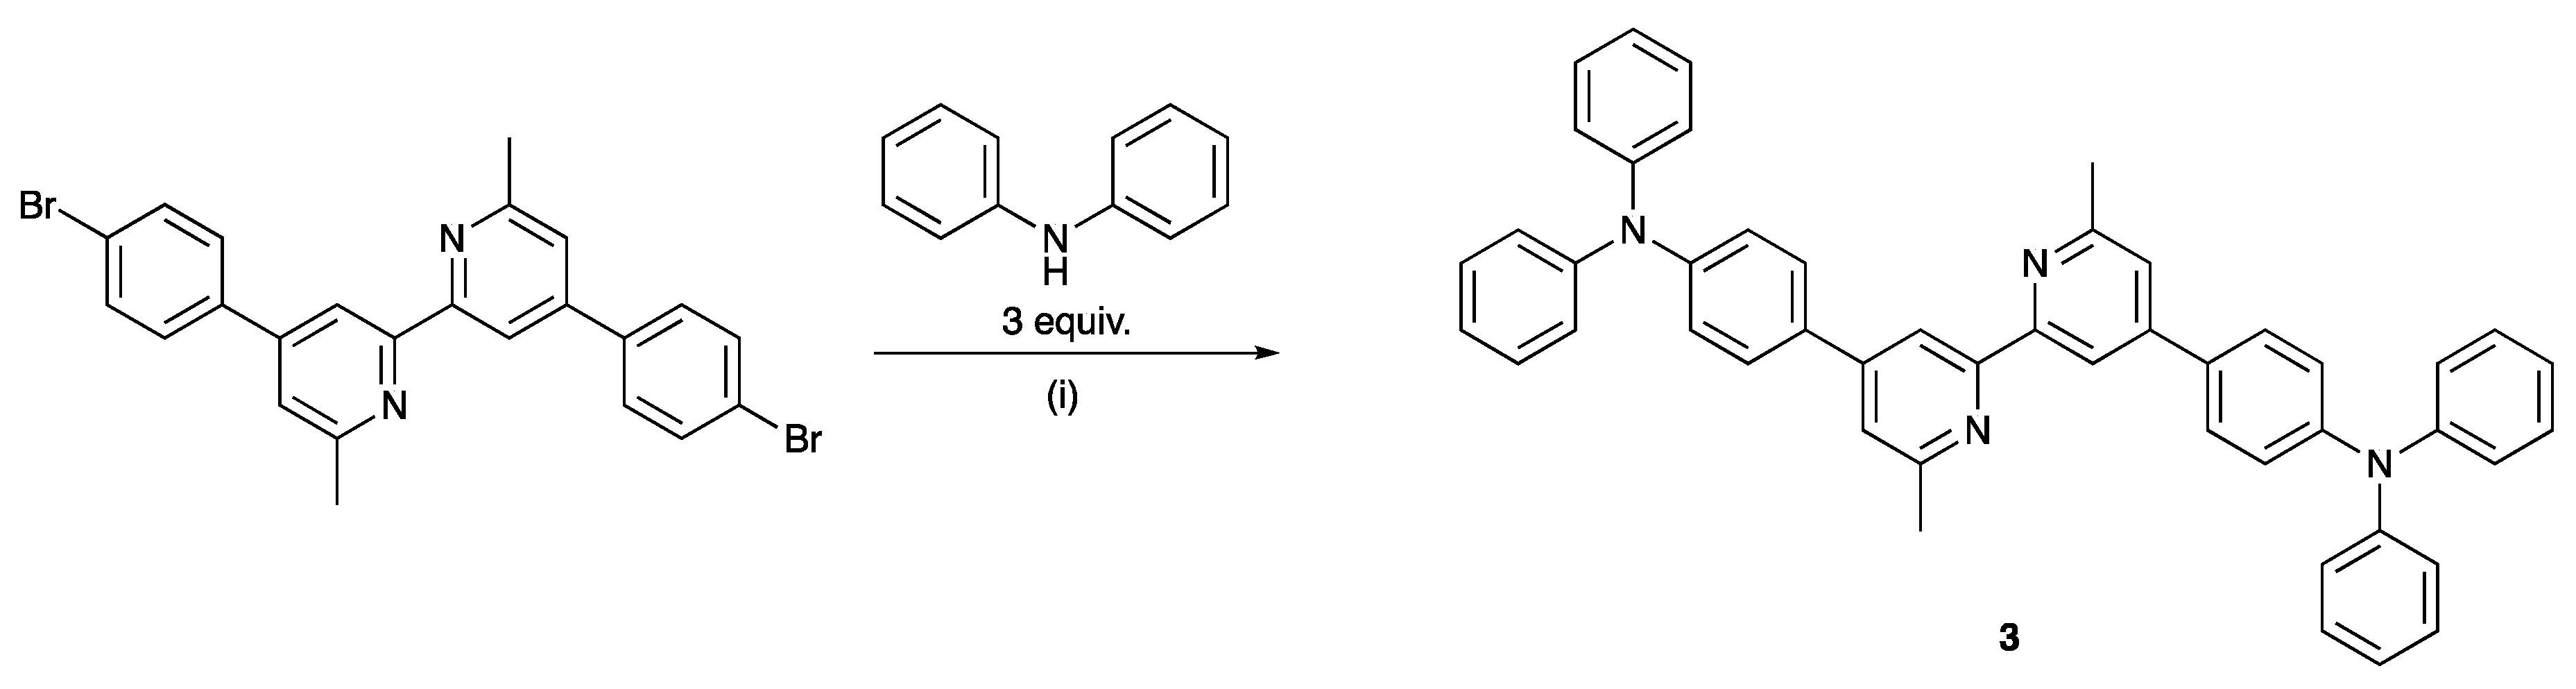
3.3. 4,4′-Bis(4-diphenylaminophenyl)-6,6′-dimethyl-2,2′-bipyridine (3)
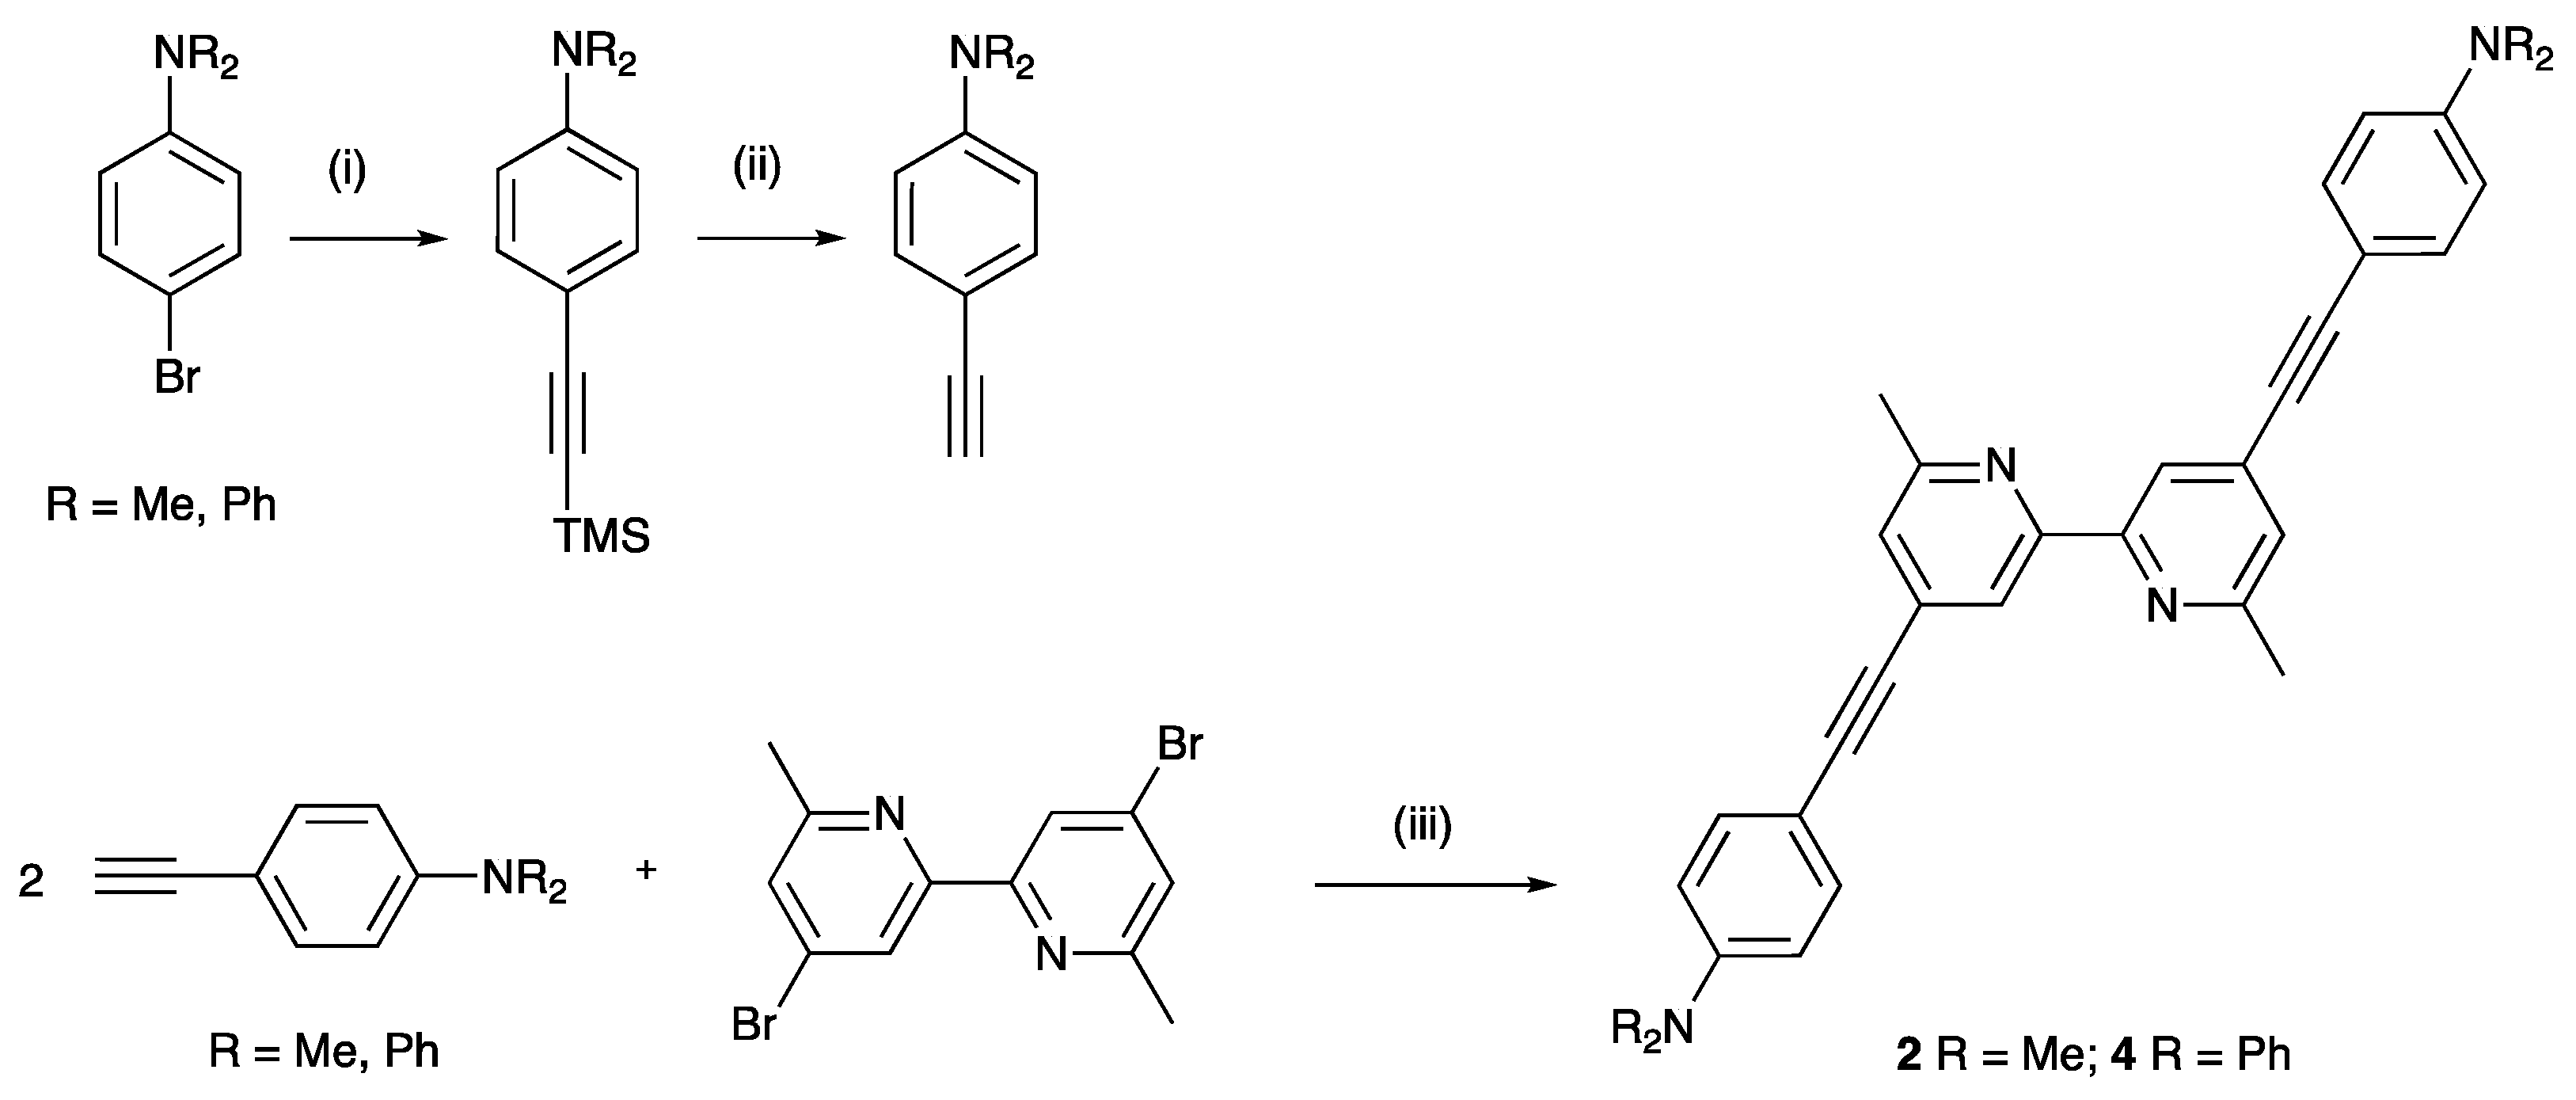
3.4. N,N-Diphenyl-4-((trimethylsilyl)ethynyl)aniline
3.5. 4-Ethynyl-N,N-diphenylaniline
3.6. 4,4′-Bis(4-dimethylaminophenylethynyl)-6,6′-dimethyl-2,2′-bipyridine (2)
3.7. 4,4′-Bis(4-diphenylaminophenylethynyl)-6,6′-dimethyl-2,2′-bipyridine (4)
3.8. [Cu(1)2][PF6]
3.9. [Cu(2)2][PF6]
3.10. [Cu(3)2][PF6]
3.11. [Cu(4)2][PF6]
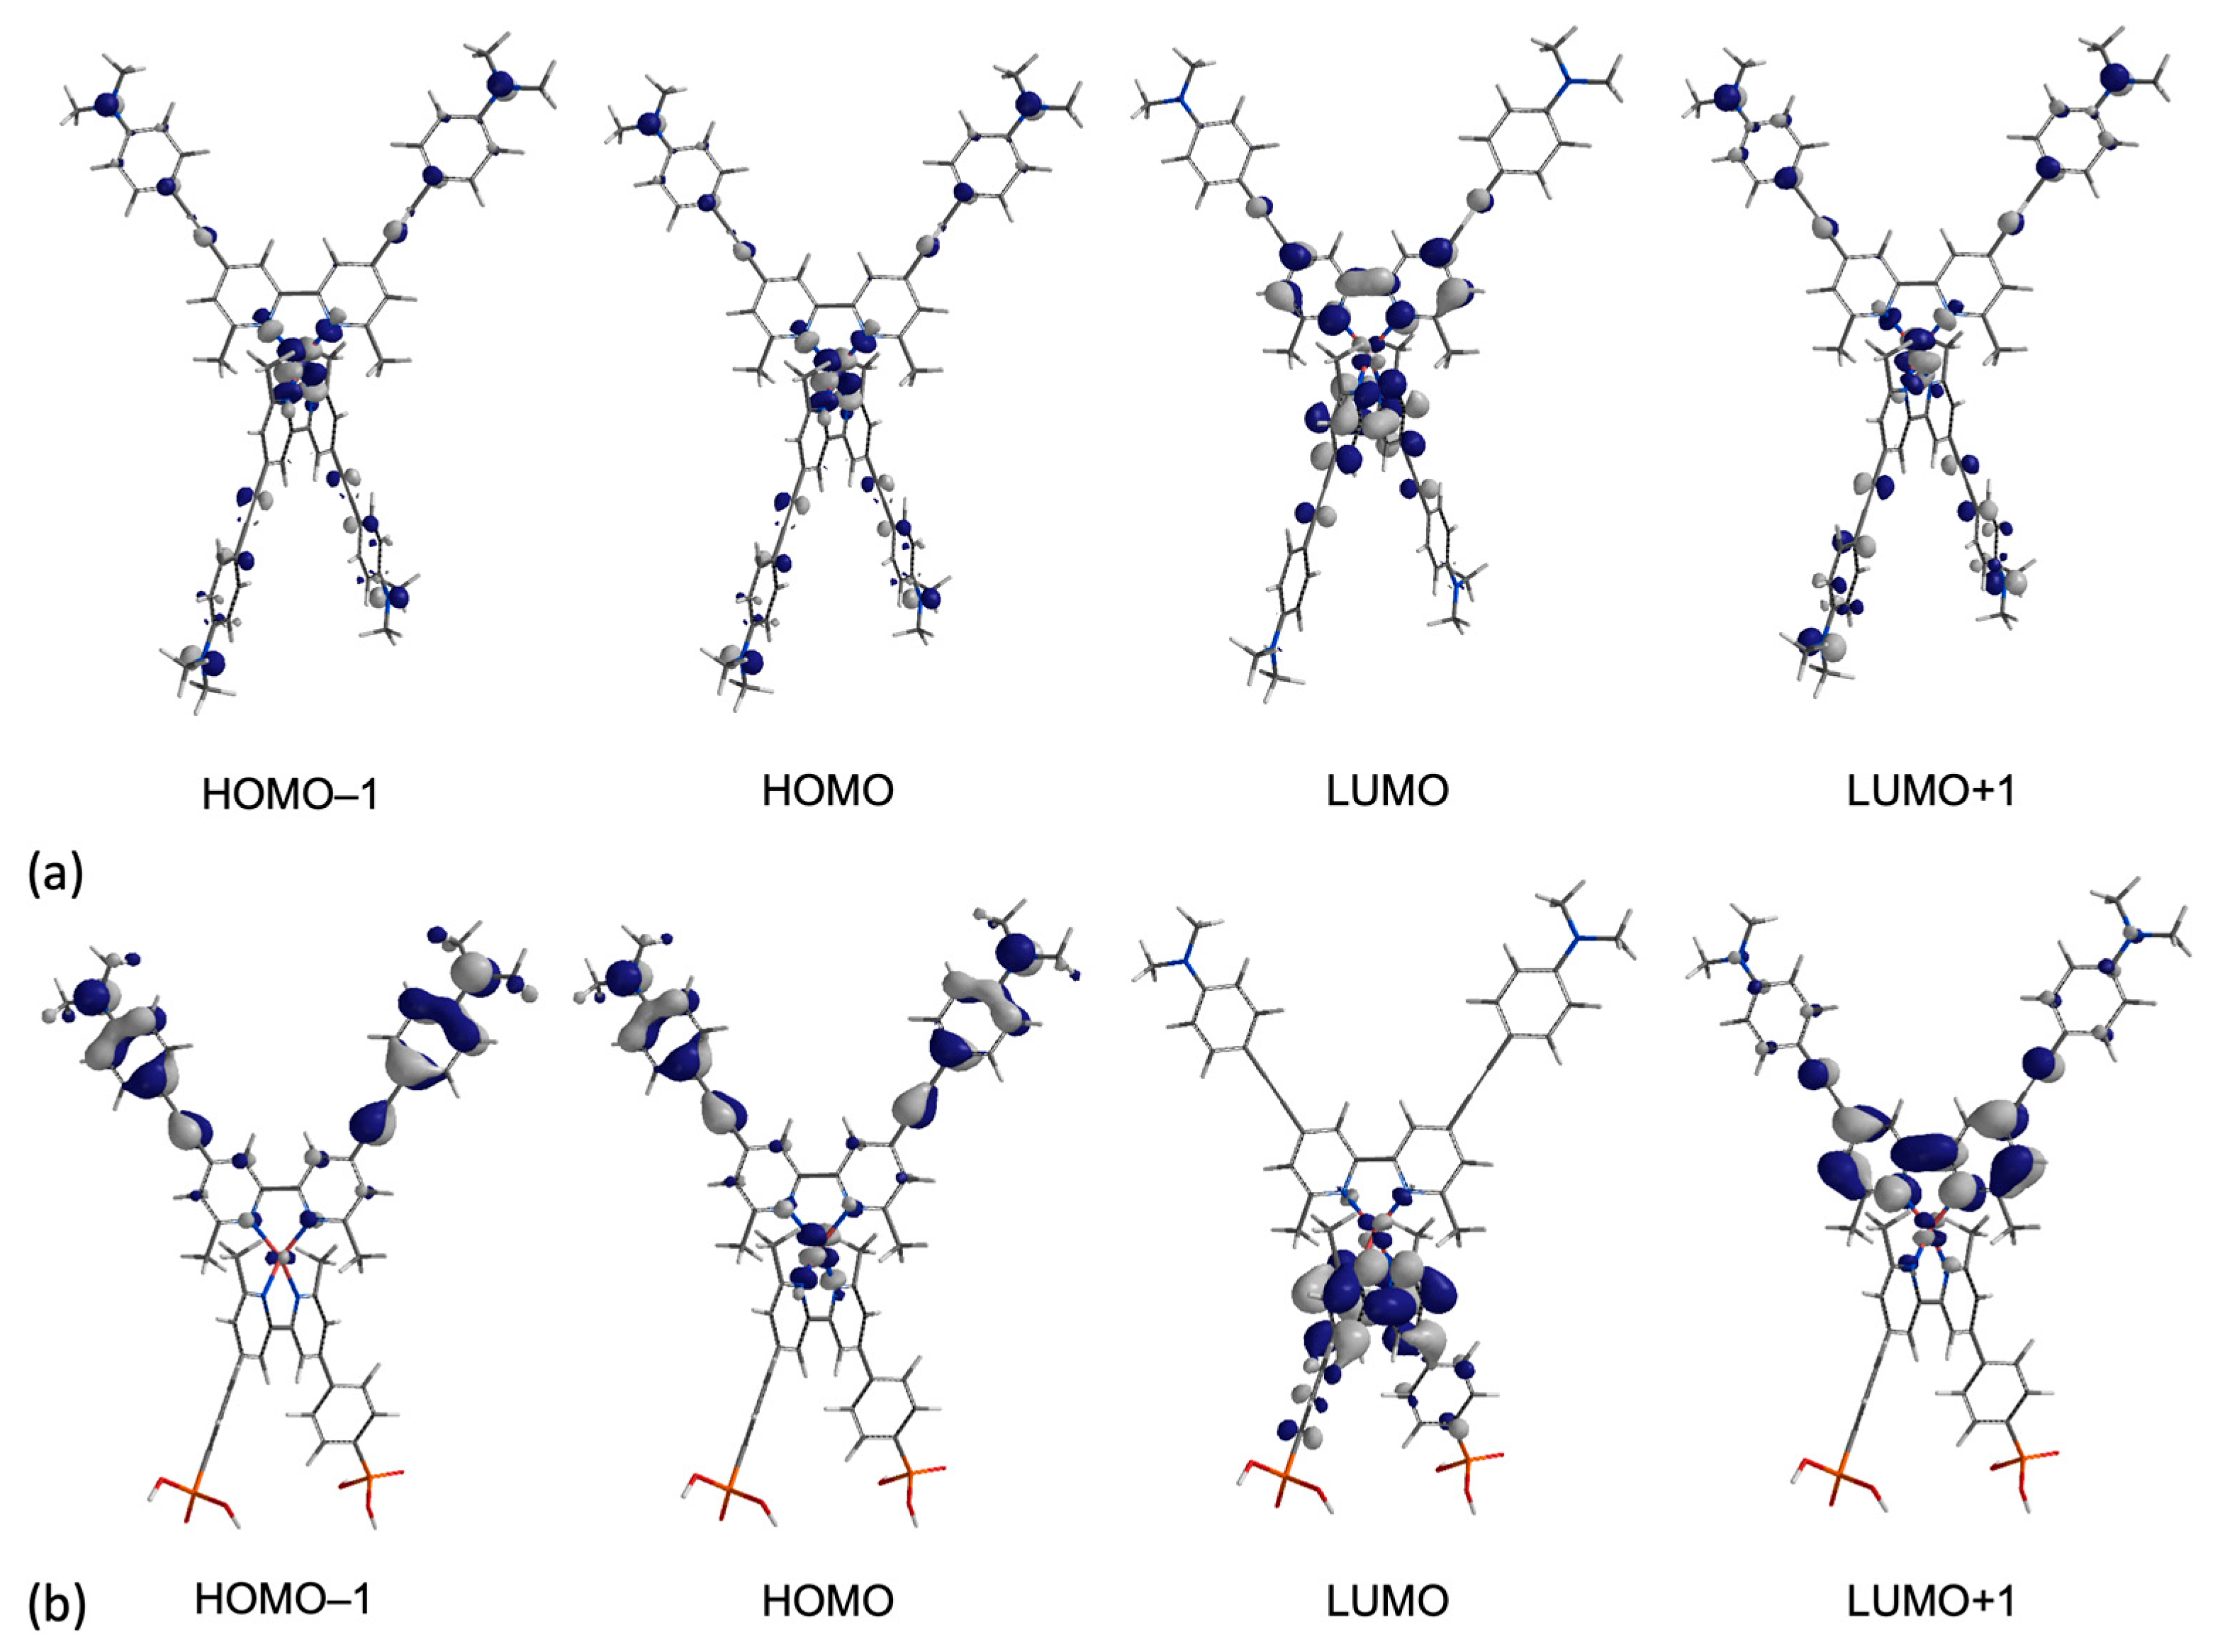
3.12. Calculations
3.13. DSC Fabrication
3.14. Electrodes for Solid-State Absorption Spectroscopy
3.15. DSCs with Co-Adsorbent n-Decylphosphonic Acid
3.16. DSC, EQE and EIS Measurements
4. Conclusions
Supplementary Materials
Author Contributions
Funding
Acknowledgments
Conflicts of Interest
References
- O’Reagan, B.; Grätzel, M. A low-cost, high-efficiency solar cell based on dye-sensitized colloidal TiO2 films. Nature 1991, 353, 737–740. [Google Scholar] [CrossRef]
- Nazeeruddin, M.K.; Baranoff, E.; Grätzel, M. Dye-sensitized solar cells. A brief overview. Solar Energy 2011, 85, 1172–1178. [Google Scholar] [CrossRef]
- Grätzel, M. Solar energy conversion by dye-sensitized photovoltaic cells. Inorg. Chem. 2005, 44, 6841–6851. [Google Scholar] [CrossRef] [PubMed]
- Grätzel, M. Recent Advances in Sensitized Mesoscopic Solar Cells. Acc. Chem. Res. 2009, 42, 1788–1798. [Google Scholar] [CrossRef]
- Boschloo, G. Improving the Performance of Dye-Sensitized Solar Cells. Front. Chem. 2019, 7, 77. [Google Scholar] [CrossRef] [Green Version]
- Bella, F.; Gerbaldi, C.; Barolo, C.; Grätzel, M. Aqueous dye-sensitized solar cells. Chem. Soc. Rev. 2015, 44, 3431–3473. [Google Scholar] [CrossRef] [Green Version]
- Wu, J.; Lan, Z.; Lin, J.; Huang, M.; HUang, Y.; Fan, L.; Luo, G. Electrolytes in Dyes-Sensiitzed Solar Cells. Chem. Rev. 2015, 115, 2136–2173. [Google Scholar] [CrossRef]
- Yella, A.; Lee, H.W.; Tsao, H.N.; Yi, C.; Chandiran, A.K.; Nazeeruddin, M.K.; Diau, E.W.; Yeh, C.Y.; Zakeeruddin, S.M.; Grätzel, M. Porphyrin-sensitized solar cells with cobalt (II/III)-based redox electrolyte exceed 12 percent efficiency. Science 2011, 334, 629–634. [Google Scholar] [CrossRef]
- Higashino, T.; Imahori, H. Porphyrins as excellent dyes for dye-sensitized solar cells: Recent developments and insights. Dalton Trans. 2015, 44, 448–463. [Google Scholar] [CrossRef]
- Mathew, S.; Yella, A.; Gao, P.; Humphry-Baker, R.; Curchod, B.F.; Ashari-Astani, N.; Tavernelli, I.; Rothlisberger, U.; Nazeeruddin, M.K.; Grätzel, M. Dye-sensitized solar cells with 13% efficiency achieved through the molecular engineering of porphyrin sensitizers. Nat. Chem. 2014, 6, 242–247. [Google Scholar] [CrossRef] [Green Version]
- Kakiage, K.; Aoyama, Y.; Yano, T.; Oya, K.; Kyomen, T.; Hanaya, M. Fabrication of a high-performance dye-sensitized solar cell with 12.8% conversion efficiency using organic silyl-anchor dyes. Chem Commun. 2015, 51, 6315–6317. [Google Scholar] [CrossRef] [PubMed]
- Xie, Y.; Tang, Y.; Wu, W.; Wang, Y.; Liu, J.; Li, X.; Tian, H.; Zhu, W.-H. Porphyrin Cosensitization for a Photovoltaic Efficiency of 11.5%: A Record for Non-Ruthenium Solar Cells Based on Iodine Electrolyte. J. Am. Chem. Soc. 2015, 137, 14055–14058. [Google Scholar] [CrossRef] [PubMed]
- Kakiage, K.; Aoyama, Y.; Yano, T.; Oya, K.; Fujisawa, J.-i.; Hanaya, M. Highly-efficient dye-sensitized solar cells with collaborative sensitization by silyl-anchor and carboxy-anchor dyes. Chem. Commun. 2015, 51, 15894–15897. [Google Scholar] [CrossRef] [PubMed]
- Zeng, K.; Lu, Y.; Tang, W.; Zhao, S.; Liu, Q.; Zhu, W.; Tian, H.; Xie, Y. Efficient solar cells sensitized by a promising new type of porphyrin: dye-aggregation suppressed by double strapping. Chem. Sci. 2019, 10, 2186–2192. [Google Scholar] [CrossRef] [PubMed] [Green Version]
- Potemkin, V.; Palko, N.; Grishina, M. Quantum theory of atoms in molecules for photovoltaics. Solar Energy 2019, 190, 475–487. [Google Scholar] [CrossRef]
- Wang, X.; Li, Y.; Song, P.; Ma, F.; Yang, Y. Effect of graphene between photoanode and sensitizer on the intramolecular and intermolecular electron transfer process. Phys. Chem. Chem. Phys. 2020, 22, 6391–6400. [Google Scholar] [CrossRef]
- Damaceanua, M.-D.; Constantin, C.-P.; Bejan, A.-E.; Mihaila, M.; Kusko, M.; Diaconu, C.; Mihalache, I.; Pascu, R. Heteroatom-mediated performance of dye-sensitized solar cells based on T-shaped molecules. Dyes Pigm. 2019, 166, 15–31. [Google Scholar] [CrossRef]
- Emsley, J. The Elements, 3rd ed.; Clarendon Press: Oxford, UK, 1998. [Google Scholar]
- Housecroft, C.E.; Constable, E.C. The emergence of copper(I)-based dye sensitized solar cells. Chem. Soc. Rev. 2015, 44, 8386–8398. [Google Scholar] [CrossRef] [Green Version]
- Lazorski, M.S.; Castellano, F.N. Advances in the light conversion properties of Cu(I)-based photosensitizers. Polyhedron 2014, 82, 57–70. [Google Scholar] [CrossRef]
- Sandroni, M.; Pellegron, Y.; Odobel, F. Heteroleptic bis-diimine copper(I) complexes for applications in solar energy conversion. Compt. Rendus Chim. 2016, 19, 79–93. [Google Scholar] [CrossRef] [Green Version]
- Liu, Y.; Yiu, S.-C.; Ho, C.-L.; Wong, W.-Y. Recent Advances in Copper Complexes for Electrical/Light Energy Conversion. Coord. Chem. Rev. 2018, 375, 514–557. [Google Scholar] [CrossRef]
- Wenger, O.S. Is Iron the New Ruthenium? Chem. Eur. J. 2019, 25, 6043–6052. [Google Scholar] [CrossRef] [PubMed] [Green Version]
- Duchanois, T.; Liu, L.; Pastore, M.; Monari, A.; Cebrián, C.; Trolez, Y.; Darari, M.; Magra, K.; Francés-Monerris, A.; Domenichini, E.; et al. NHC-Based Iron Sensitizers for DSSCs. Inorganics 2019, 6, 63. [Google Scholar] [CrossRef] [Green Version]
- Jakubikova, E.; Bowman, D.N. Fe(II)-Polypyridines as Chromophores in Dye-Sensitized Solar Cells: A Computational Perspective. Acc. Chem. Res. 2015, 48, 1441–1449. [Google Scholar] [CrossRef] [PubMed]
- Liu, Y.; Persson, P.; Sundström, V.; Wärnmark, K. Fe N-Heterocyclic Carbene Complexes as Promising Photosensitizers. Acc. Chem. Res. 2016, 49, 1477–1485. [Google Scholar] [CrossRef] [PubMed]
- Sandroni, M.; Favereau, L.; Planchat, A.; Akdas-Kilig, H.; Szuwarski, N.; Pellegrin, Y.; Blart, E.; Le Bozec, H.; Boujtita, M.; Odobel, F. Heteroleptic copper(I)–polypyridine complexes as efficient sensitizers for dye sensitized solar cells. J. Mater. Chem. A 2014, 2, 9944–9947. [Google Scholar] [CrossRef]
- Malzner, F.J.; Willgert, M.; Constable, E.C.; Housecroft, C.E. The way to panchromatic copper(I)-based dye-sensitized solar cells: co-sensitization with the organic dye SQ2. J. Mater. Chem. A 2017, 5, 13717–13729. [Google Scholar] [CrossRef] [Green Version]
- Malzner, F.J.; Brauchli, S.Y.; Constable, E.C.; Housecroft, C.E.; Neuburger, M. Halos show the path to perfection: peripheral iodo-substituents improve the efficiencies of bis(diimine)copper(I) dyes in dye-sensitized solar cells. RSC Adv. 2014, 4, 48712–48723. [Google Scholar] [CrossRef] [Green Version]
- Fürer, S.O.; Bozic-Weber, B.; Schefer, T.; Wobill, C.; Constable, E.C.; Housecroft, C.E.; Willgert, M. Understanding why replacing I3−/I− by cobalt(II)/(III) electrolytes in bis(diimine)copper(I)-based dye-sensitized solar cells improves performance. J. Mater. Chem. A 2016, 4, 12995–13004. [Google Scholar] [CrossRef] [Green Version]
- Fürer, S.O.; Luu, L.Y.N.; Bozic-Weber, B.; Constable, E.C.; Housecroft, C.E. Improving performance of copper(I)-based dye sensitized solar cells through I3−/I− electrolyte manipulation. Dyes Pigments 2016, 132, 72–78. [Google Scholar] [CrossRef] [Green Version]
- Ashbrook, L.N.; Elliott, C.M. Dye-Sensitized Solar Cell Studies of a Donor-Appended Bis(2,9-dimethyl-1,10-phenanthroline) Cu(I) Dye Paired with a Cobalt-Based Mediator. J. Phys. Chem. C 2013, 117, 3853–3864. [Google Scholar] [CrossRef]
- Cariello, M.; Ahn, S.; Park, K.-W.; Chang, S.-K.; Hong, J.; Cooke, G. An investigation of the role increasing π-conjugation has on the efficiency of dye-sensitized solar cells fabricated from ferrocene-based dyes. RSC Adv. 2016, 6, 9132–9138. [Google Scholar] [CrossRef] [Green Version]
- Khan, M.S.; Al-Suti, M.K.; Maharaja, J.; Haque, A.; Al-Balushi, R.; Raithby, P.R. Conjugated poly-ynes and poly (metalla-ynes) incorporating thiophene-based spacers for solar cell (SC) applications. J. Organomet. Chem. 2016, 812, 13–33. [Google Scholar] [CrossRef] [Green Version]
- Yam, V.W.-W.; Lau, V.C.-Y.; Cheung, K.-K. Synthesis and Photophysics of Luminescent Rhenium(I) Acetylides–precursors for Organometallic Rigid-Rod Materials. X-ray Crystal Structures of [Re(tBu2bpy)(CO)3(tBuC≡C)] and [Re(tBu2bpy)(CO)3Cl]. Organometallics 1995, 14, 2749–2753. [Google Scholar] [CrossRef]
- Garakyaraghi, S.; McCusker, C.E.; Khan, S.; Koutnik, P.; Bui, A.T.; Castellano, F.N. Enhancing the Visible-Light Absorption and Excited-State Properties of Cu(I) MLCT States. Inorg. Chem. 2018, 57, 2296–2307. [Google Scholar] [CrossRef] [PubMed]
- James, P.V.; Yoosaf, K.; Kumar, J.; Thomas, K.G.; Listort, A.; Accorsi, G.; Armaroli, N. Tunable Photophysical Properties of Phenyleneethynylene Based Bipyridine Ligands. Photochem. Photobiol. Sci. 2009, 8, 1432–1440. [Google Scholar] [CrossRef]
- Wang, J.-L.; Wang, C.; deKrafft, K.E.; Lin, W. Cross-linked Polymers with Exceptionally High Ru(bpy)32+ Loadings for Efficient Heterogeneous Photocatalysis. ACS Catal. 2012, 2, 417–424. [Google Scholar] [CrossRef]
- Oppelt, K.; Eegbe, D.A.M.; Monkowius, U.; List, M.; Zabel, M.; Sariciftci, N.S.; Knör, G. Luminescence and Spectroscopic Studies of Organometallic Rhodium and Rhenium Multichromophore Systems Carrying Polypyridyl Acceptor Sites and Phenylethynyl Antenna Subunits. J. Organomet. Chem. 2011, 696, 2252–2258. [Google Scholar] [CrossRef]
- Li, Y.; Liu, R.; Badaeva, E.; Kilina, S.; Sun, W. Long Lived π-Shape Platinum(II) Diimine Complexes Bearing 7-Benzothiazolylfluoren-2-yl Motif on the Bipyridine and Acetylide Ligands: Admixing π,π* and Charge-Transfer Configurations. J. Phys. Chem. 2013, 117, 5908–5918. [Google Scholar] [CrossRef]
- Krönhke, F. The Specific Syntheses of Pyridines and Oligopyridines. Synthesis 1976, 1–24. [Google Scholar] [CrossRef]
- Brauchli, S.Y.; Bozic-Weber, B.; Constable, E.C.; Hostettler, N.; Housecroft, C.E.; Zampese, J.A. Factors controlling the photoresponse of copper(I) diimine dyes containing hole-transporting dendrons in dye-sensitized solar cells. RSC Adv. 2014, 4, 34801–34815. [Google Scholar] [CrossRef] [Green Version]
- Bozic-Weber, B.; Brauchli, S.Y.; Constable, E.C.; Fürer, S.O.; Housecroft, C.E.; Wright, I.A. Hole-transport functionalized copper(I) dye sensitized solar cells. Phys. Chem. Chem. Phys. 2013, 15, 4500–4504. [Google Scholar] [CrossRef] [PubMed]
- Chen, N.-Y.; Xia, L.-M.; Lennox, A.J.J.; Sun, Y.-Y.; Chen, H.; Jin, H.-M.; Junge, H.; Wu, Q.-A.; Jia, J.-H.; Beller, M.; et al. Structure-Activated Copper Photosensitizers for Photocatalytic Water Reduction. Chem. Eur. J. 2017, 23, 3631–3636. [Google Scholar] [CrossRef] [PubMed] [Green Version]
- Armaroli, N.; Accorsi, G.; Cardinali, F.; Listorti, A. Photochemistry and dPhotophysics of Coordination Compounds: Copper. Top. Curr. Chem. 2007, 280, 69–115. [Google Scholar] [CrossRef]
- Armaroli, N. Photoactive mono- and polynuclear Cu(I)–phenanthrolines. A viable alternative to Ru(II)–polypyridines? Chem. Soc. Rev. 2001, 30, 113–124. [Google Scholar] [CrossRef]
- Tarsang, R.; Promarak, V.; Sudyoadsuk, T.; Namuangruk, S.; Kungwan, N.; Khongpracha, P.; Jungsuttiwong, S. triple bond-modified anthracene sensitizers for dye-sensitized solar cells: A computational study. RSC Adv. 2015, 5, 38130–38140. [Google Scholar] [CrossRef]
- Groom, C.R.; Bruno, I.J.; Lightfoot, M.P.; Ward, S.C. The Cambridge Structural Databas. Acta Cryst. 2016, B72, 171–179. [Google Scholar] [CrossRef]
- Bruno, I.J.; Cole, J.C.; Edgington, P.R.; Kessler, M.; Macrae, C.F.; McCabe, P.; Pearson, J.; Taylor, R. New software for searching the Cambridge Structural Database and visualising crystal structures. Acta Cryst. 2002, B58, 389–397. [Google Scholar] [CrossRef]
- Malzner, F.J.; Housecroft, C.E.; Constable, E.C. The versatile SALSAC approach to heteroleptic copper(I) dye assembly in dye-sensitized solar cells. Inorganics 2018, 6, 57. [Google Scholar] [CrossRef] [Green Version]
- Freimann, S.A.; Zare, D.; Housecroft, C.E.; Constable, E.C. The SALSAC Approach: Comparing the reactivity of solvent-dispersed nanoparticles with nanoparticulate surfaces. Nanoscale Adv. 2020, 2, 679–690. [Google Scholar] [CrossRef] [Green Version]
- Stephens, A.J.; Malzner, F.J.; Constable, E.C.; Housecroft, C.E. The influence of phosphonic acid protonation state on the efficiency of bis(diimine)copper(I) dye-sensitized solar cells. Sustain. Ener. Fuels 2018, 2, 786–794. [Google Scholar] [CrossRef] [Green Version]
- Bozic-Weber, B.; Brauchli, S.Y.; Constable, E.C.; Fürer, S.O.; Housecroft, C.E.; Malzner, F.J.; Wright, I.A.; Zampese, J.A. Improving the photoresponse of copper(I) dyes in dye-sensitized solar cells by tuning ancillary and anchoring ligand modules. Dalton Trans. 2013, 42, 12293–12308. [Google Scholar] [CrossRef] [Green Version]
- Klein, Y.M.; Willgert, M.; Prescimone, A.; Constable, E.C.; Housecroft, C.E. Positional isomerism makes a difference: phosphonic acid anchoring ligands with thienyl spacers in copper(I)-based dye-sensitized solar cells. Dalton Trans. 2016, 45, 4659–4672. [Google Scholar] [CrossRef] [PubMed] [Green Version]
- Baumgartner, Y.; Klein, Y.M.; Constable, E.C.; Housecroft, C.E.; Willgert, M. Cyanoacrylic- and (1-cyanovinyl)phosphonic acid anchoring ligands for application in copper-based dye-sensitized solar cells. RSC Adv. 2016, 6, 86220–86231. [Google Scholar] [CrossRef] [Green Version]
- Aberásturi, F.; Jiménez, A.I.; Jiménez, F.; Arias, J.J. UV-Visible First-Derivative Spectrophotometry Applied to an Analysis of a Vitamin Mixture. J. Chem. Educ. 2001, 78, 793–795. [Google Scholar] [CrossRef]
- Malzner, F.J.; Brauchli, S.Y.; Schönhofer, E.; Constable, E.C.; Housecroft, C.E. To deprotect or not to deprotect: phosphonate ester versus phosphonic acid anchor ligands in copper(I)-based dye-sensitized solar cells. Polyhedron 2014, 82, 116–121. [Google Scholar] [CrossRef] [Green Version]
- Colombo, A.; Dragonetti, C.; Fagnani, F.; Roberto, D.; Melchiorre, F.; Biagini, P. Improving the Efficiency of Copper-Dye-Sensititzed Solar Cells by Manipulating the Electrolyte Solution. Dalton Trans. 2019, 48, 9818–9823. [Google Scholar] [CrossRef]
- Dragonetti, C.; Magni, M.; Colombo, A.; Melchiorre, F.; Biagini, P.; Roberto, D. Coupling of a copper dye with a copper electrolyte: A Fascinating Springboard for Sustainable Dye-Sensititzed Solar Cells. ACS Appl. Energy Mater. 2018, 1, 751–756. [Google Scholar] [CrossRef]
- Büttner, A.; Brauchli, S.Y.; Constable, E.C.; Housecroft, C.E. Effects of introducing methoxy groups into the ancillary ligands in bis(diimine)copper(I) dyes for dye-sensitized solar cells. Inorganics 2018, 6, 40. [Google Scholar] [CrossRef] [Green Version]
- Neale, N.R.; Kopidakis, N.; van de Lagemaat, J.; Grätzel, M.; Frank, A.J. Effect of a Coadsorbent on the Performance of Dye-Sensitized TiO2 Solar Cells: Shielding versus Band-Edge Movement. J. Phys. Chem. B 2005, 109, 23183–23189. [Google Scholar] [CrossRef] [Green Version]
- Wang, Q.; Campbell, W.M.; Bonfantani, E.E.; Jolley, K.W.; Officer, D.L.; Walsh, P.J.; Gordon, K.; Humphry-Baker, R.; Nazeeruddin, M.K.; Grätzel, M. Efficient Light Harvesting by Using Green Zn-Porphyrin-Sensitized Nanocrystalline TiO2 Films. J. Phys. Chem. B 2005, 109, 15397–15409. [Google Scholar] [CrossRef] [PubMed]
- Lee, C.-W.; Lu, H.-P.; Lan, C.-M.; Huang, Y.-L.; Liang, Y.-R.; Yen, W.-N.; Liu, Y.-C.; Lin, Y.-S.; Diau, E.W.-G.; Yeh, C.-Y. Novel Zinc Porphyrin Sensitizers for Dye-Sensitized Solar Cells: Synthesis and Spectral, Electrochemical, and Photovoltaic Properties. Chem. Eur. J. 2009, 115, 1403–1412. [Google Scholar] [CrossRef] [PubMed]
- Wang, Q.; Ito, S.; Grätzel, M.; Fabregat-Santiago, F.; Mora-Sero, I.; Bisquert, J.; Bessho, T.; Imai, H. Characteristics of High Efficiency Dye-Sensitized Solar Cells. J. Phys. Chem. B 2006, 110, 25210–25221. [Google Scholar] [CrossRef] [PubMed]
- Bisquert, J. Theory of the Impedance of Electron Diffusion and Recombination in a Thin Layer. J. Phys. Chem. B 2002, 106, 325–333. [Google Scholar] [CrossRef]
- Dunn, H.K.; Peter, L.M. How Efficient Is Electron Collection in Dye-Sensitized Solar Cells? Comparison of Different Dynamic Methods for the Determination of the Electron Diffusion Length. J. Phys. Chem. C 2009, 113, 4726–4731. [Google Scholar] [CrossRef]
- Jennings, J.R.; Wang, Q. Influence of Lithium Ion Concentration on Electron Injection, Transport, and Recombination in Dye-Sensitized Solar Cells. J. Phys. Chem. C 2010, 114, 1715–1724. [Google Scholar] [CrossRef]
- Li, C.; Gao, C.; Lan, J.; You, J.; Gao, G. An AIE active Y-shaped diimidazolylbenzene: Aggregation and disaggregation for Cd2+ and Fe3+ sensing in aqueous solution. Org. Biomol. Chem. 2014, 12, 9524–9527. [Google Scholar] [CrossRef]
- Yamada, S.; Morita, M.; Konno, Y. Multi-color photoluminescence induced by electron-density distribution of fluorinated bistolane derivatives. J. Fluorine Chem. 2017, 202, 54–64. [Google Scholar] [CrossRef]
- Kirsanov, D.O.; Borisova, N.E.; Reshetova, M.D.; Ivanov, A.V.; Korotkov, L.A.; Eliseev, I.I.; Alyapyshev, M.Y.; Spiridonov, I.G.; Legin, A.V.; Vlasov, Y.G.; et al. Novel diamides of 2,2’_dipyridyl_6,6’_dicarboxylic acid: Synthesis, coordination properties, and possibilities of use in electrochemical sensors and liquid extraction. Russ. Chem. Bull. 2012, 61, 881–890. [Google Scholar] [CrossRef]
- Kubas, G.J.; Monzyk, B.; Crumbliss, A.L. Tetrakis(acetonitrile)copper(I) hexafluorophosphate. Inorg. Synth. 1979, 19, 90–92. [Google Scholar] [CrossRef]
- Fang, J.-K.; An, D.-L.; Wakamatsu, K.; Ishikawa, T.; Iwanaga, T.; Toyota, S.; Matsuo, D.; Orita, A.; Otera, J. Synthesis and spectroscopic study of diphenylamino-substituted phenylene-(poly)ethynylenes: Remarkable effect of acetylenic conjugation modes. Tetrahedron Lett. 2010, 51, 917–920. [Google Scholar] [CrossRef]
- Mukhopadhyay, A.; Maka, V.K.; Moorthy, J.N. Remarkable Influence of Phenyl/Arylethynylation on the Photochromism of 2,2-Diphenylbenzopyrans (Chromenes). Eur. J. Org. Chem. 2016, 2016, 274–281. [Google Scholar] [CrossRef]
- Spartan ’18, version 1; Wavefunction INC.: Irvine, CA, USA, 2018.
- Bozic-Weber, B.; Chaurin, V.; Constable, E.C.; Housecroft, C.E.; Meuwly, M.; Neuburger, M.; Rudd, J.A.; Schönhofer, E.; Siegfried, L. Exploring copper(I)-based dye-sensitized solar cells: A complementary experimental and TD-DFT investigation. Dalton Trans. 2012, 41, 14157–14169. [Google Scholar] [CrossRef] [PubMed]
Sample Availability: Samples of the compounds are not available from the authors. |


| Dye | Cell Number | JSC/mA cm−2 | VOC/mV | ff/%1 | η/% | Relative η/% |
|---|---|---|---|---|---|---|
| [Cu(5)(1)]+ | 1 | 4.54 | 541 | 67.6 | 1.66 | 31.0 |
| [Cu(5)(1)]+ | 2 | 4.69 | 539 | 68.1 | 1.72 | 32.1 |
| [Cu(5)(1)]+ | 3 | 4.74 | 539 | 70.1 | 1.79 | 33.4 |
| [Cu(5)(1)]+ | 4 | 4.55 | 524 | 69.7 | 1.66 | 31.0 |
| [Cu(5)(2)]+ | 1 | 3.59 | 514 | 70.7 | 1.30 | 24.3 |
| [Cu(5)(2)]+ | 2 | 3.64 | 508 | 69.6 | 1.29 | 24.0 |
| [Cu(5)(2)]+ | 3 | 3.54 | 513 | 71.2 | 1.29 | 24.1 |
| [Cu(5)(2)]+ | 4 | 3.57 | 514 | 68.4 | 1.25 | 23.4 |
| N719 | 14.13 | 602 | 63.0 | 5.36 | 100 |
| Dye | Cell Number | JSC/mA cm−2 | VOC/mV | ff/% | η/% | Relative η/% |
|---|---|---|---|---|---|---|
| [Cu(5)(3)]+ | 1 | 4.82 | 532 | 67.9 | 1.74 | 32.5 |
| [Cu(5)(3)]+ | 2 | 5.25 | 523 | 70.3 | 1.93 | 36.0 |
| [Cu(5)(3)]+ | 3 | 4.64 | 536 | 68.6 | 1.71 | 31.8 |
| [Cu(5)(3)]+ | 4 | 4.89 | 533 | 66.8 | 1.74 | 32.4 |
| [Cu(5)(4)]+ | 1 | 4.24 | 535 | 69.3 | 1.57 | 29.3 |
| [Cu(5)(4)]+ | 2 | 3.96 | 530 | 68.6 | 1.44 | 26.8 |
| [Cu(5)(4)]+ | 3 | 4.08 | 534 | 66.8 | 1.46 | 27.2 |
| [Cu(5)(4)]+ | 4 | 4.05 | 531 | 70.3 | 1.51 | 28.2 |
| N719 | 14.25 | 603 | 60.3 | 5.18 | 100 |
| Dye | Cell Number | JSC/mA cm−2 | VOC/mV | ff/% | η/% | Relative η/% |
|---|---|---|---|---|---|---|
| [Cu(5)(1)]+ | 1 | 4.75 | 534 | 65.1 | 1.65 | 30.8 |
| [Cu(5)(1)]+ | 2 | 4.75 | 548 | 68.9 | 1.79 | 33.4 |
| [Cu(5)(1)]+ | 3 | 4.42 | 545 | 65.9 | 1.59 | 29.6 |
| [Cu(5)(1)]+ | 4 | 4.73 | 543 | 68.8 | 1.77 | 32.9 |
| N719 | 14.13 | 602 | 63.0 | 5.36 | 100 |
| Dye | Rrec/Ω | Cμ/μF | Rtr/Ω | τ/ms | τt/ms | Ld/μm | Rs/Ω | RPt/Ω | CPt/μF | JSC/mA cm−2 | VOC/mV | ƞ/% |
|---|---|---|---|---|---|---|---|---|---|---|---|---|
| [Cu(5)(1)]+ | 125 | 386 | 28 | 48 | 11 | 25 | 20 | 24 | 5 | 4.69 | 539 | 1.72 |
| [Cu(5)(2)]+ | 200 | 328 | 30 | 66 | 10 | 31 | 10 | 16 | 6 | 3.54 | 513 | 1.29 |
| [Cu(5)(1)]+ + DPA | 384 | 252 | 39 | 97 | 10 | 38 | 10 | 21 | 6 | 4.75 | 548 | 1.79 |
© 2020 by the authors. Licensee MDPI, Basel, Switzerland. This article is an open access article distributed under the terms and conditions of the Creative Commons Attribution (CC BY) license (http://creativecommons.org/licenses/by/4.0/).
Share and Cite
Risi, G.; Becker, M.; Housecroft, C.E.; Constable, E.C. Are Alkynyl Spacers in Ancillary Ligands in Heteroleptic Bis(diimine)copper(I) Dyes Beneficial for Dye Performance in Dye-Sensitized Solar Cells? Molecules 2020, 25, 1528. https://doi.org/10.3390/molecules25071528
Risi G, Becker M, Housecroft CE, Constable EC. Are Alkynyl Spacers in Ancillary Ligands in Heteroleptic Bis(diimine)copper(I) Dyes Beneficial for Dye Performance in Dye-Sensitized Solar Cells? Molecules. 2020; 25(7):1528. https://doi.org/10.3390/molecules25071528
Chicago/Turabian StyleRisi, Guglielmo, Mariia Becker, Catherine E. Housecroft, and Edwin C. Constable. 2020. "Are Alkynyl Spacers in Ancillary Ligands in Heteroleptic Bis(diimine)copper(I) Dyes Beneficial for Dye Performance in Dye-Sensitized Solar Cells?" Molecules 25, no. 7: 1528. https://doi.org/10.3390/molecules25071528