
Preclinical Incorporation Dosimetry of [18F]FACH—A Novel 18F-Labeled MCT1/MCT4 Lactate Transporter Inhibitor for Imaging Cancer Metabolism with PET

 , , , , ,
  , ,
, ,
Abstract
:1. Introduction
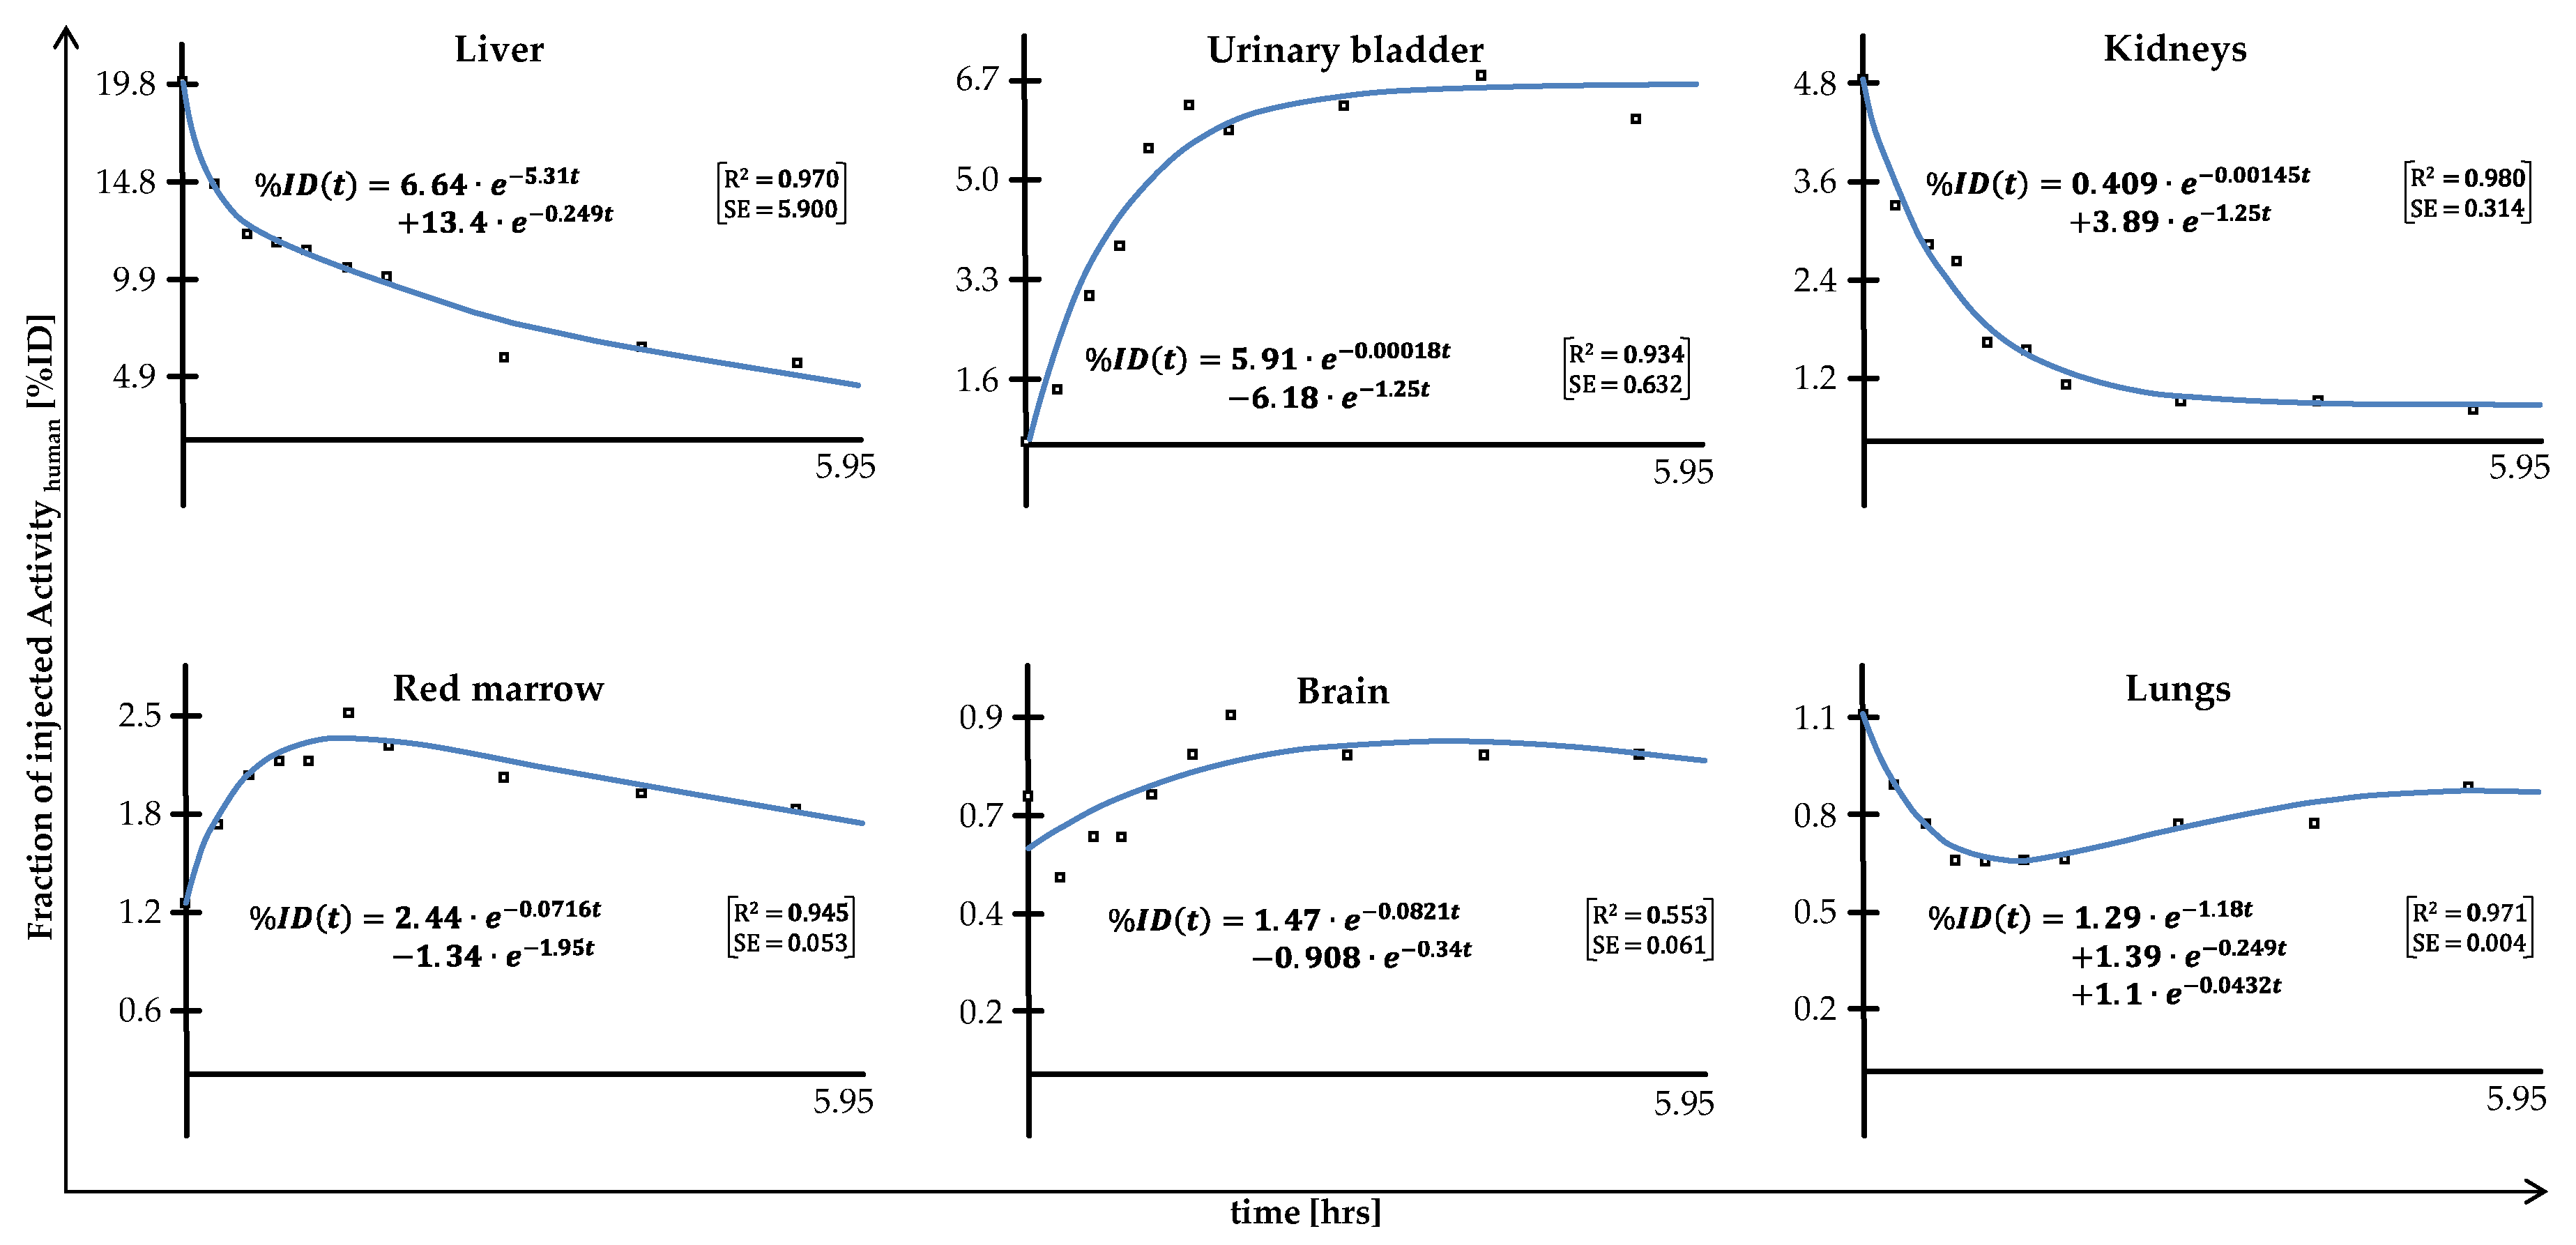
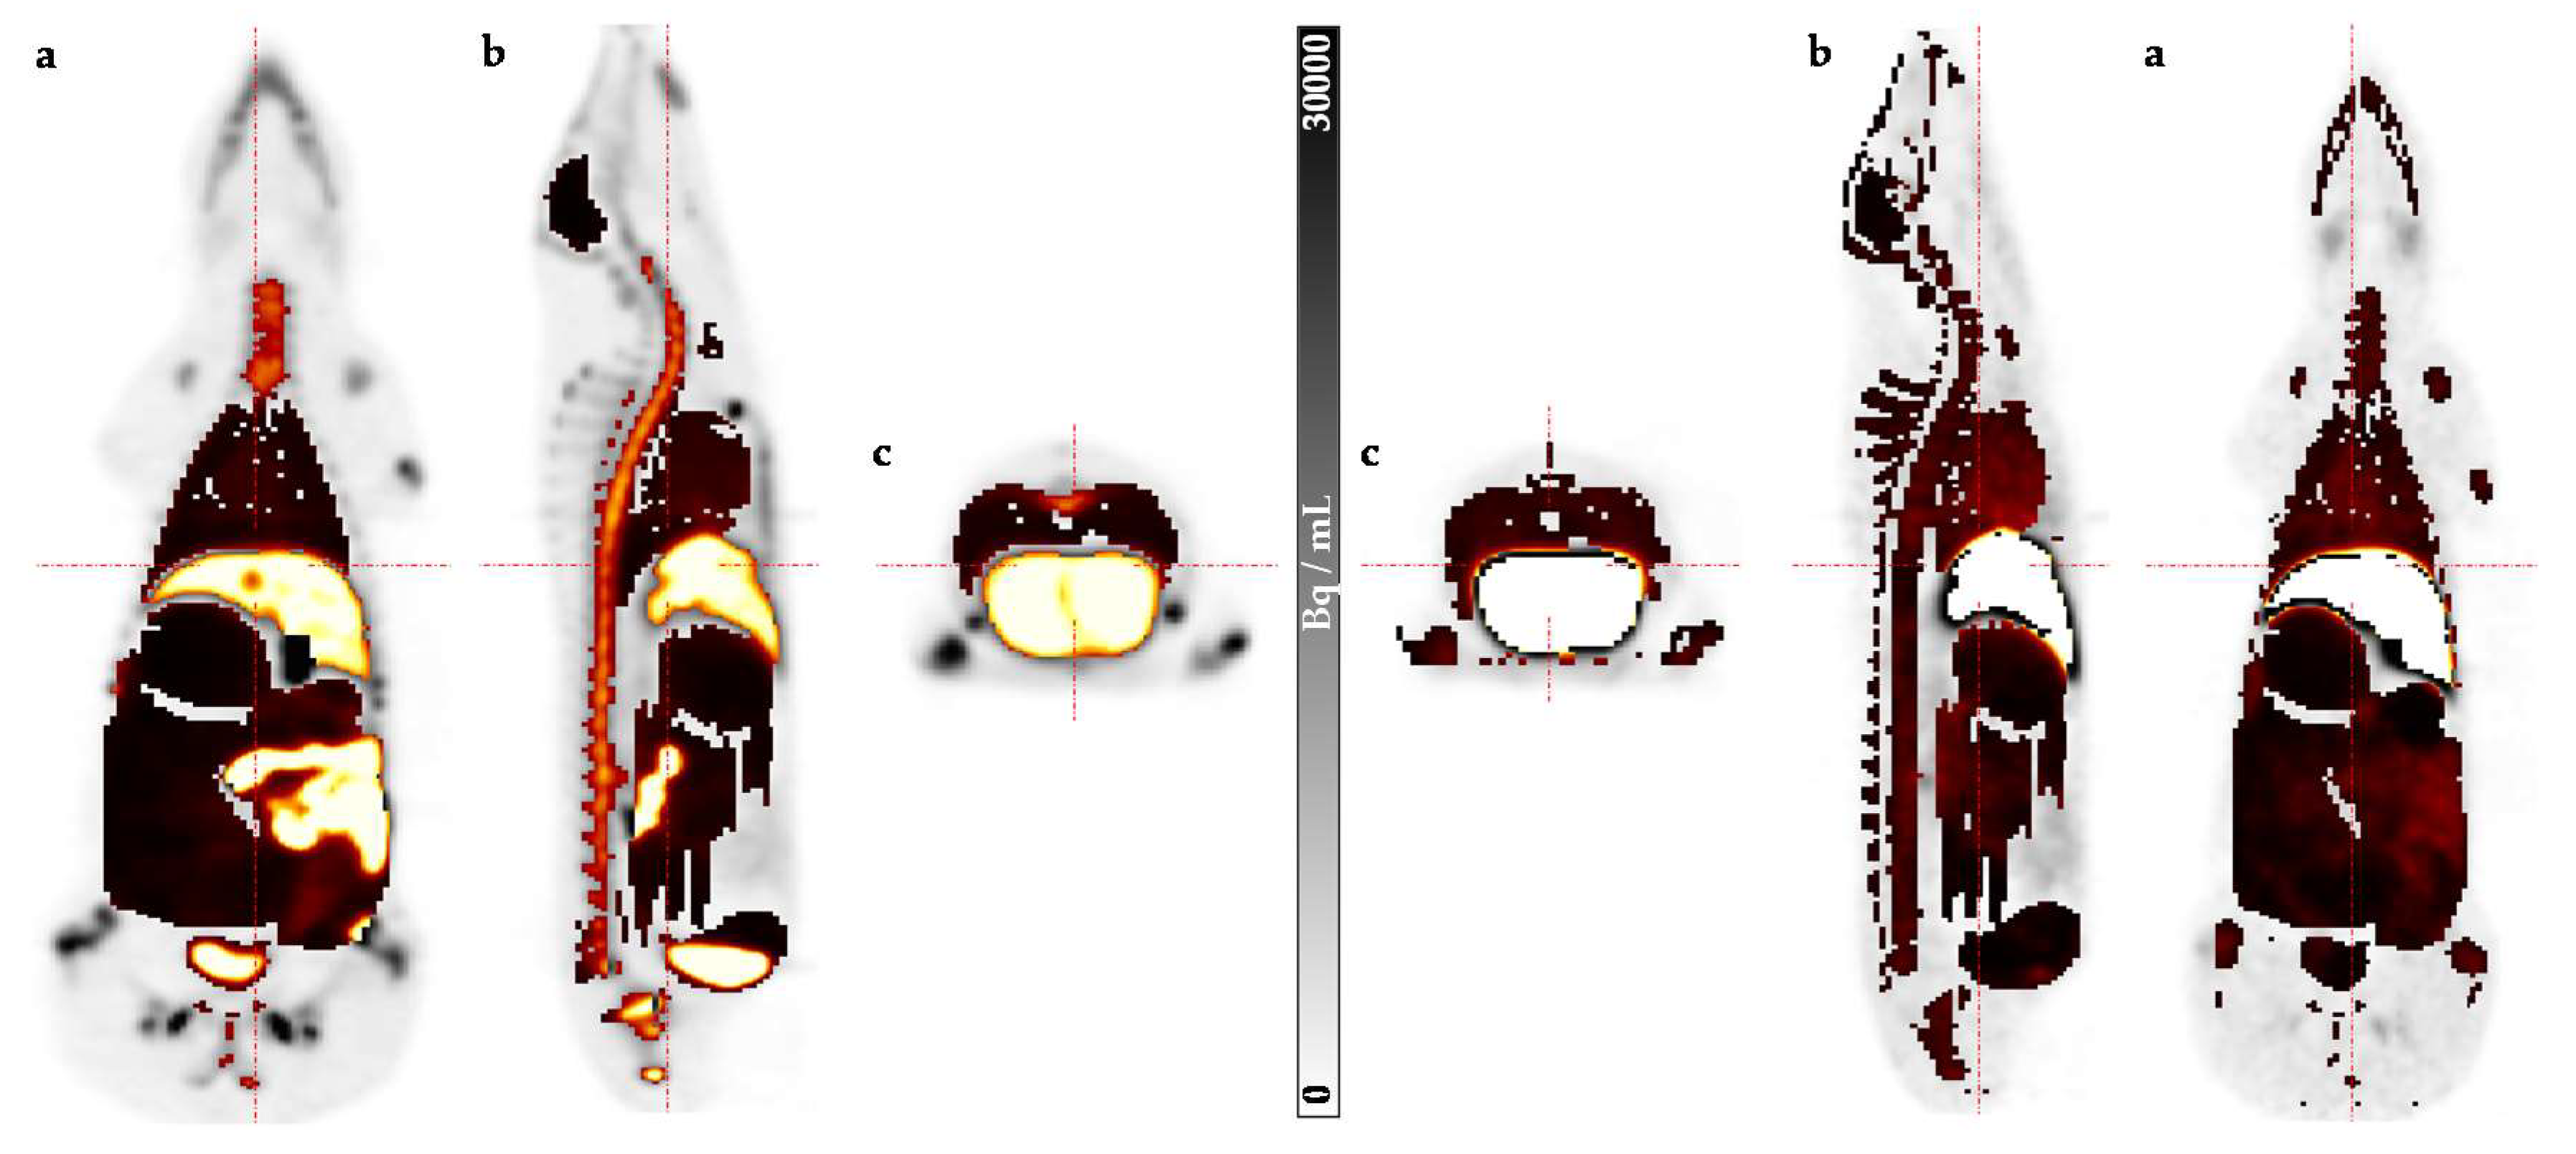
2. Results
3. Discussion
4. Materials and Methods
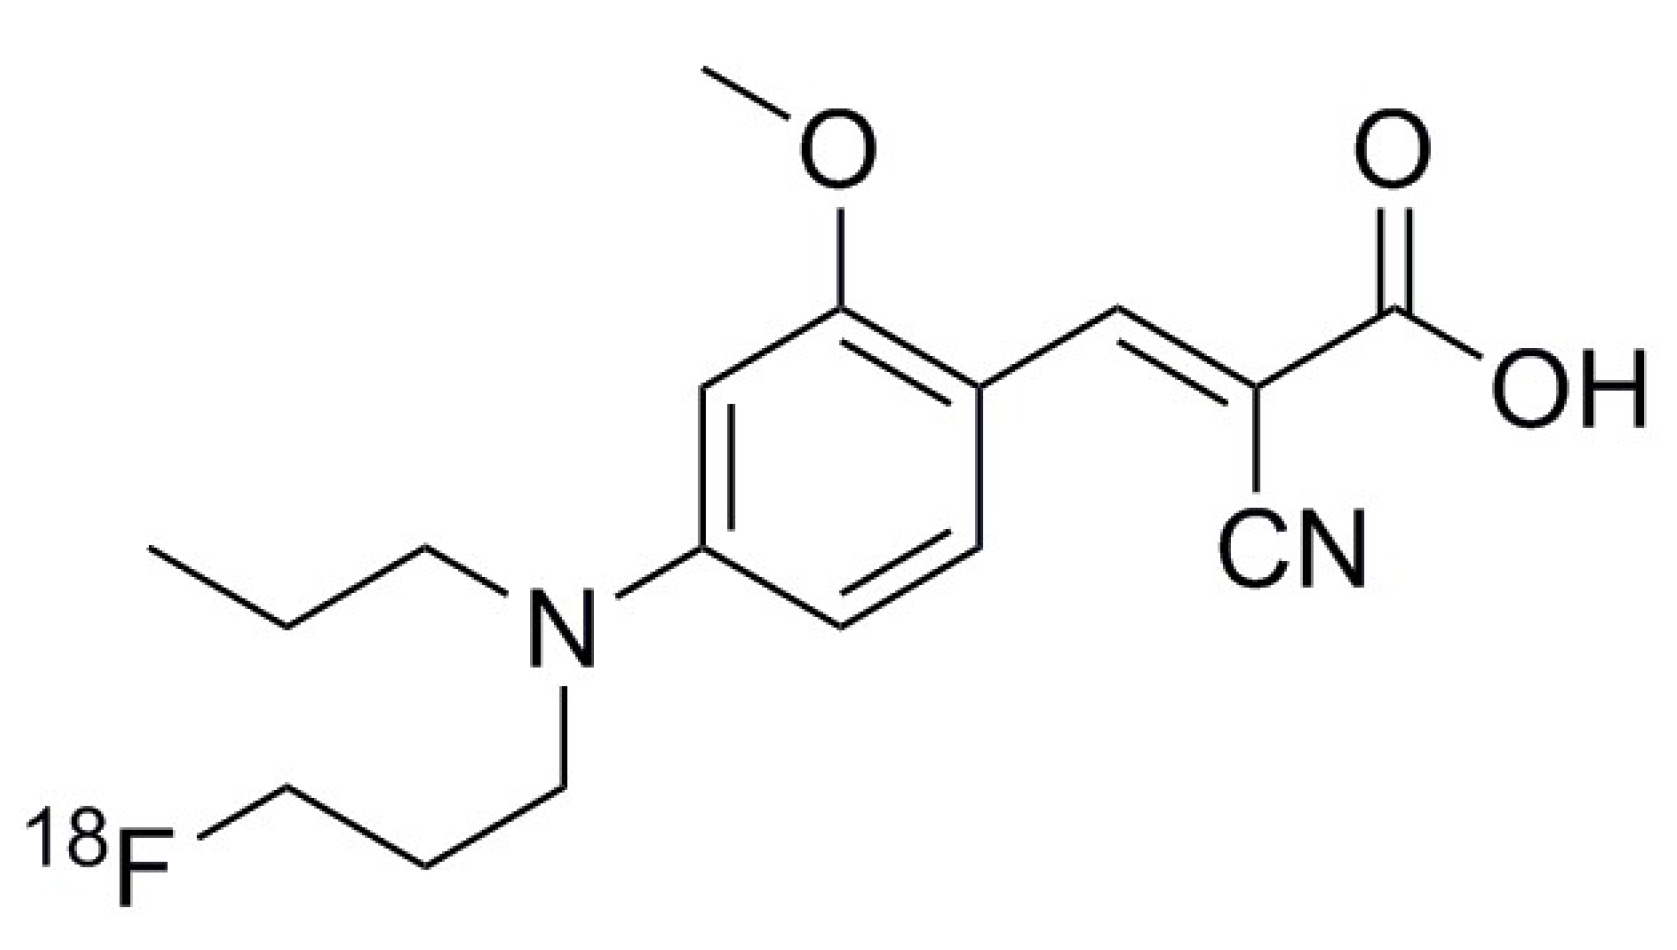
4.1. Synthesis of [18F]FACH
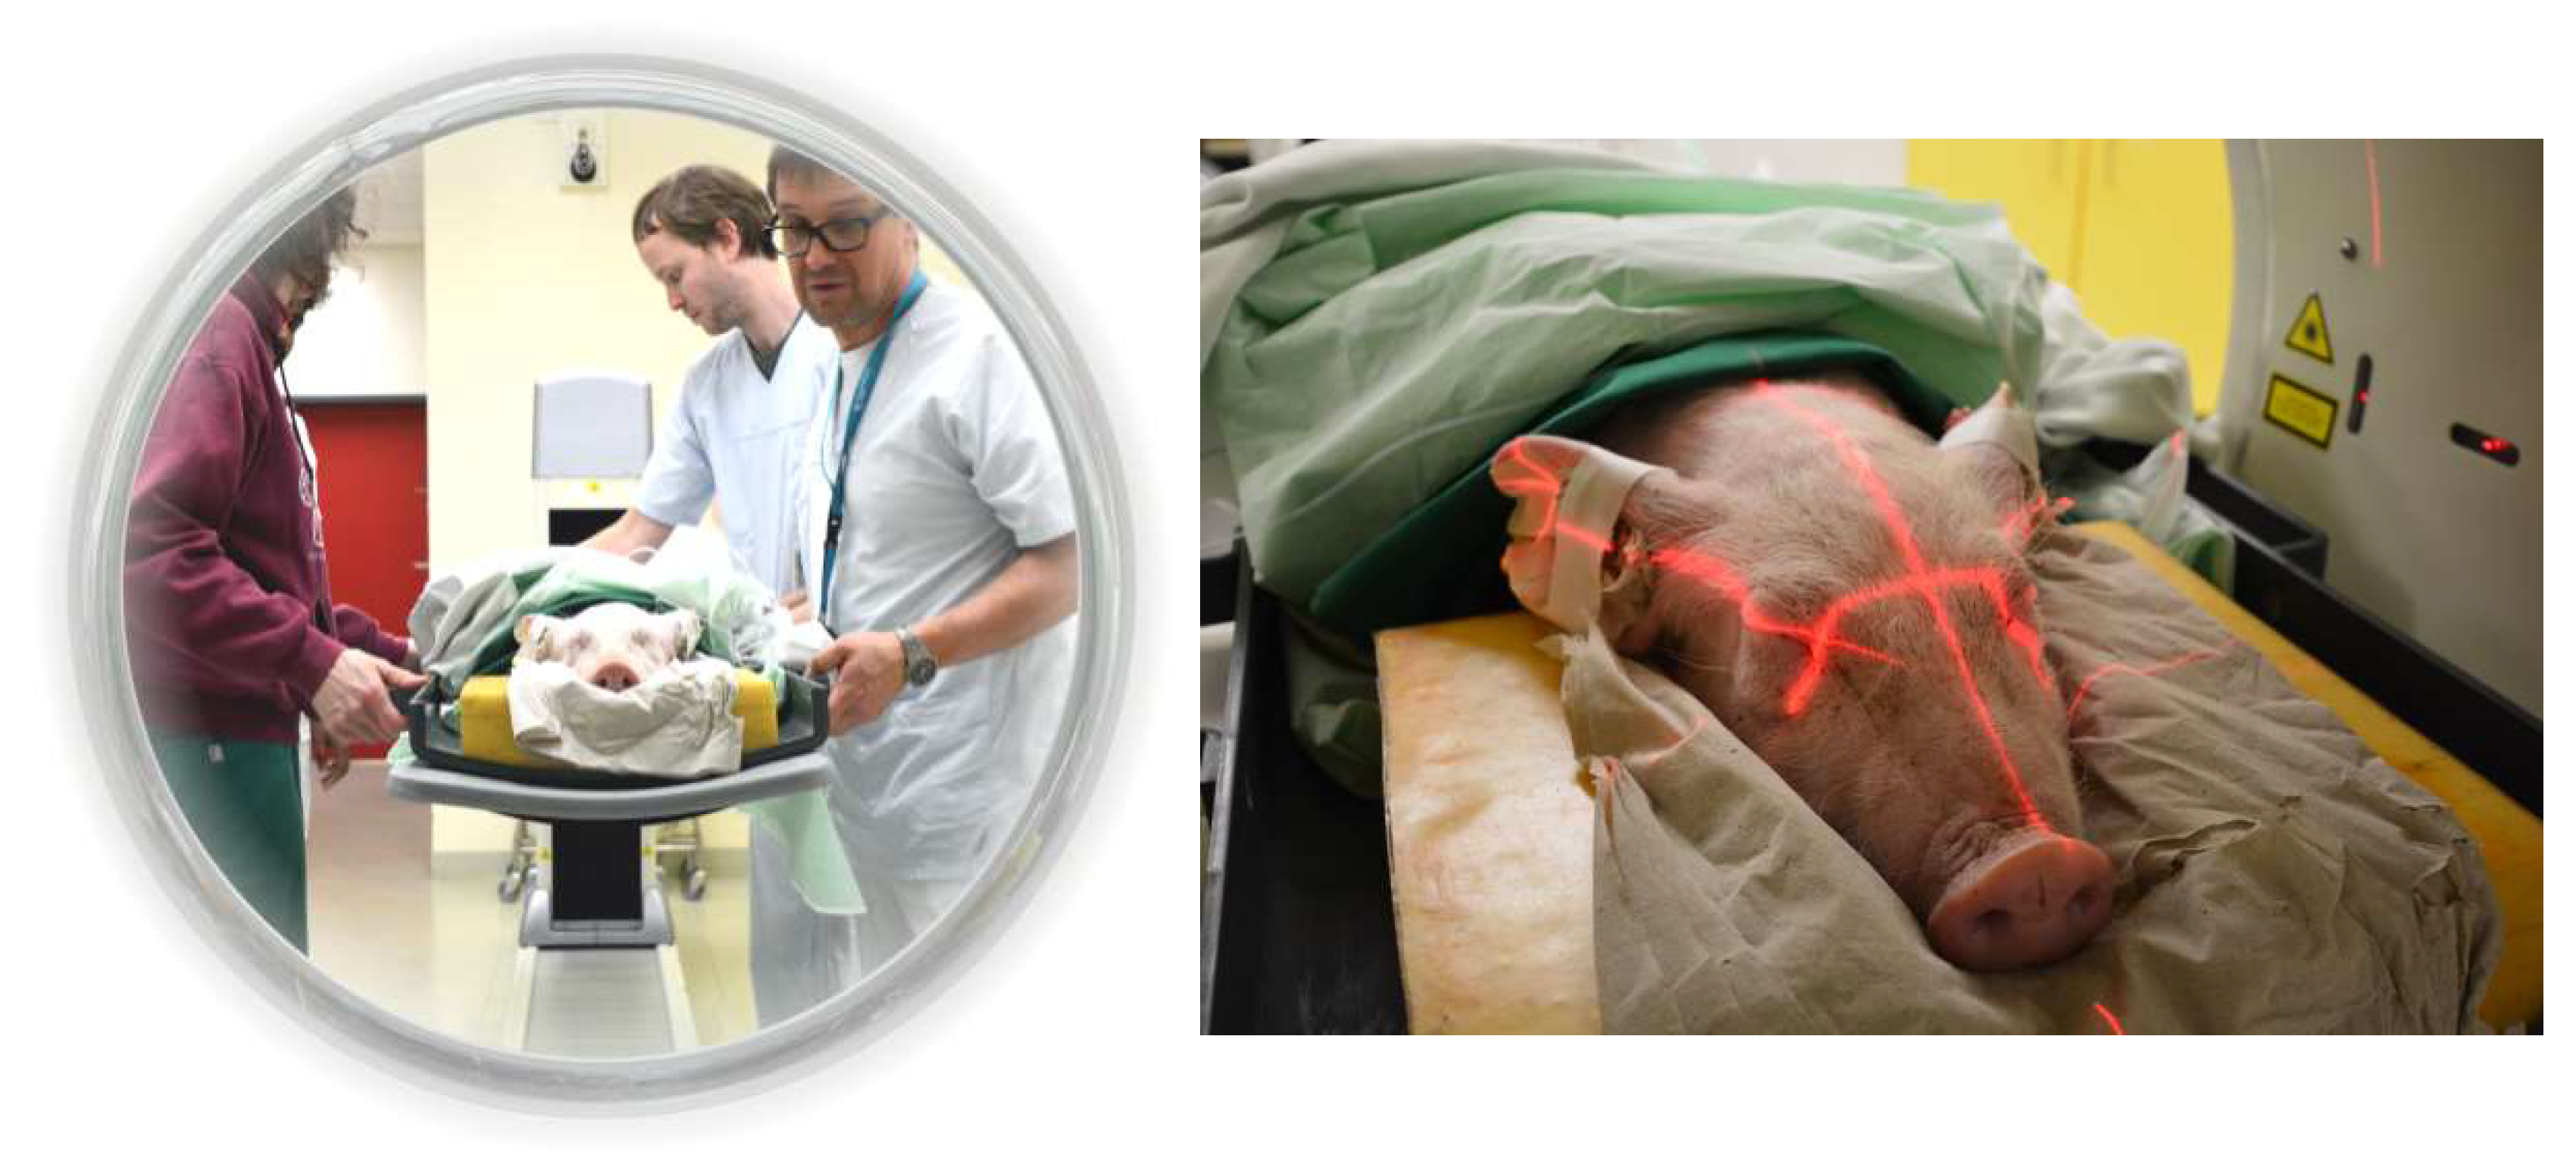
4.2. Preclinical Dosimetry Studies—In Vivo PET/CT Imaging in Pigs
4.3. Image Analysis
4.4. Incorporation Dosimetry
5. Conclusions
Supplementary Materials
Author Contributions
Funding
Acknowledgments
Conflicts of Interest
References
- Warburg, O. On the origin of cancer cells. Science 1956, 123, 309–314. [Google Scholar] [CrossRef] [PubMed]
- Ponisovskiy, M.R. Warburg effect mechanism as the target for theoretical substantiation of a new potential cancer treatment. Crit. Rev. Eukaryot. Gene Expr. 2011, 21, 13–28. [Google Scholar] [CrossRef] [PubMed]
- Koppenol, W.H.; Bounds, P.L.; Dang, C.V. Otto Warburg’s contributions to current concepts of cancer metabolism. Nat. Rev. Cancer 2011, 11, 325. [Google Scholar] [CrossRef] [PubMed]
- Halestrap, A.P. The SLC16 gene family–structure, role and regulation in health and disease. Mol. Asp. Med. 2013, 34, 337–349. [Google Scholar] [CrossRef]
- Pinheiro, C.; Longatto-Filho, A.; Azevedo-Silva, J.; Casal, M.; Schmitt, F.C.; Baltazar, F. Role of monocarboxylate transporters in human cancers: State of the art. J. Bioenerg. Biomembr. 2012, 44, 127–139. [Google Scholar] [CrossRef]
- Gurrapu, S.; Jonnalagadda, S.K.; Alam, M.A.; Nelson, G.L.; Sneve, M.G.; Drewes, L.R.; Mereddy, V.R. Monocarboxylate transporter 1 inhibitors as potential anticancer agents. ACS Med. Chem. Lett. 2015, 6, 558–561. [Google Scholar] [CrossRef] [Green Version]
- Fang, J.; Quinones, Q.J.; Holman, T.L.; Morowitz, M.J.; Wang, Q.; Zhao, H.; Sivo, F.; Maris, J.M.; Wahl, M.L. The H+-linked monocarboxylate transporter (MCT1/SLC16A1): A potential therapeutic target for high-risk neuroblastoma. Mol. Pharmacol. 2006, 70, 2108–2115. [Google Scholar] [CrossRef] [Green Version]
- Park, S.J.; Smith, C.P.; Wilbur, R.R.; Cain, C.P.; Kallu, S.R.; Valasapalli, S.; Sahoo, A.; Guda, M.R.; Tsung, A.J.; Velpula, K.K. An overview of MCT1 and MCT4 in GBM: Small molecule transporters with large implications. Am. J. Cancer Res. 2018, 8, 1967. [Google Scholar]
- Payen, V.L.; Mina, E.; van Hée, V.F.; Porporato, P.E.; Sonveaux, P. Monocarboxylate transporters in cancer. Mol. Metab. 2020, 33, 48–66. [Google Scholar] [CrossRef]
- van Hée, V.F.; Labar, D.; Dehon, G.; Grasso, D.; Grégoire, V.; Muccioli, G.G.; Frédérick, R.; Sonveaux, P. Radiosynthesis and validation of (±)-[18F]-3-fluoro-2-hydroxypropionate ([18F]-FLac) as a PET tracer of lactate to monitor MCT1-dependent lactate uptake in tumors. Oncotarget 2017, 8, 24415. [Google Scholar] [CrossRef]
- Tateishi, H.; Tsuji, A.B.; Kato, K.; Sudo, H.; Sugyo, A.; Hanakawa, T.; Zhang, M.-R.; Saga, T.; Arano, Y.; Higashi, T. Synthesis and evaluation of 11C-labeled coumarin analog as an imaging probe for detecting monocarboxylate transporters expression. Bioorganic Med. Chem. Lett. 2017, 27, 4893–4897. [Google Scholar] [CrossRef] [PubMed]
- Sadeghzadeh, M.; Moldovan, R.-P.; Fischer, S.; Wenzel, B.; Ludwig, F.-A.; Teodoro, R.; Deuther-Conrad, W.; Jonnalagadda, S.; Jonnalagadda, S.K.; Gudelis, E.; et al. Development and radiosynthesis of the first 18F-labeled inhibitor of monocarboxylate transporters (MCTs). J. Label. Comp. Radiopharm. 2019, 62, 411–424. [Google Scholar] [CrossRef] [PubMed]
- Sadeghzadeh, M.; Moldovan, R.-P.; Wenzel, B.; Kranz, M.; Deuther-Conrad, W.; Toussaint, M.; Fischer, S.; Ludwig, F.-A.; Teodoro, R.; Jonnalagadda, S.K.; et al. Development of the first 18F-labeled MCT1/MCT4 lactate transport inhibitor: Radiosynthesis and preliminary in vivo evaluation in mice. J. Label. Comp. Radiopharm. 2019, 62, S59–S60. [Google Scholar] [CrossRef] [PubMed]
- Kranz, M.; Sattler, B.; Tiepolt, S.; Wilke, S.; Deuther-Conrad, W.; Donat, C.K.; Fischer, S.; Patt, M.; Schildan, A.; Patt, J. Radiation dosimetry of the α 4 β 2 nicotinic receptor ligand (+)-[18F] flubatine, comparing preclinical PET/MRI and PET/CT to first-in-human PET/CT results. EJNMMI Phys. 2016, 3, 25. [Google Scholar] [CrossRef] [PubMed] [Green Version]
- Kranz, M.; Sattler, B.; Wüst, N.; Deuther-Conrad, W.; Patt, M.; Meyer, P.; Fischer, S.; Donat, C.; Wünsch, B.; Hesse, S. Evaluation of the enantiomer specific biokinetics and radiation doses of [18F] fluspidine—A new tracer in clinical translation for imaging of σ1 receptors. Molecules 2016, 21, 1164. [Google Scholar] [CrossRef] [PubMed] [Green Version]
- Sattler, B.; Kranz, M.; Starke, A.; Wilke, S.; Donat, C.K.; Deuther-Conrad, W.; Patt, M.; Schildan, A.; Patt, J.; Smits, R. Internal Dose assessment of (–)-18F-flubatine, comparing animal model datasets of mice and piglets with first-in-human results. J. Nucl. Med. 2014, 55, 1885–1892. [Google Scholar] [CrossRef] [Green Version]
- Stabin, M.G.; Siegel, J.A. RADAR dose estimate report: A compendium of radiopharmaceutical dose estimates based on OLINDA/EXM version 2.0. J. Nucl. Med. 2018, 59, 154–160. [Google Scholar] [CrossRef]
- McParland, B.J. Nuclear Medicine Radiation Dosimetry: Advanced Theoretical Principles; Springer: London, UK, 2010; ISBN 978-184-882-1262. [Google Scholar]
- Stabin, M.G. Fundamentals of Nuclear Medicine Dosimetry; Springer: New York, NY, USA, 2008; ISBN 978-038-774-5794. [Google Scholar]
- Valentin, J. The 2007 Recommendations of the International Commission on Radiological Protection; Elsevier: Oxford, UK, 2007; Volume 37, pp. 1–133. [Google Scholar] [CrossRef]
- Zanotti-Fregonara, P.; Lammertsma, A.A.; Innis, R.B. Suggested pathway to assess radiation safety of 18 F-labeled PET tracers for first-in-human studies. Eur. J. Nucl. Med. Mol. Imaging 2013, 40, 1781–1783. [Google Scholar] [CrossRef] [Green Version]
- Kranz, M.; Sattler, B.; Deuther-Conrad, W.; Teodoro, R.; Donat, C.; Wenzel, B.; Scheunemann, M.; Patt, M.; Sabri, O.; Brust, P. Preclinical dose assessment and biodistribution of [18F]DBT10, a new α7 nicotinic acetylcholine receptor (α7-nAChR) imaging ligand. J. Nucl. Med. 2014, 55, 1143. [Google Scholar]
- Tennant, D.A.; Durán, R.V.; Gottlieb, E. Targeting metabolic transformation for cancer therapy. Nat. Rev. Cancer 2010, 10, 267–277. [Google Scholar] [CrossRef]
- Ward, P.S.; Thompson, C.B. Metabolic reprogramming: A cancer hallmark even warburg did not anticipate. Cancer Cell 2012, 21, 297–308. [Google Scholar] [CrossRef] [PubMed] [Green Version]
- O’Neill, H.; Malik, V.; Johnston, C.; Reynolds, J.V.; O’Sullivan, J. Can the efficacy of 18FFDG-PET/CT in clinical oncology be enhanced by screening biomolecular profiles? Pharmaceuticals (Basel) 2019, 12, 16. [Google Scholar] [CrossRef] [PubMed] [Green Version]
- Endo, K.; Oriuchi, N.; Higuchi, T.; Iida, Y.; Hanaoka, H.; Miyakubo, M.; Ishikita, T.; Koyama, K. PET and PET/CT using 18F-FDG in the diagnosis and management of cancer patients. Int. J. Clin. Oncol. 2006, 11, 286–296. [Google Scholar] [CrossRef] [PubMed]
- Payen, V.L.; Hsu, M.Y.; Rädecke, K.S.; Wyart, E.; Vazeille, T.; Bouzin, C.; Porporato, P.E.; Sonveaux, P. Monocarboxylate transporter MCT1 promotes tumor metastasis independently of its activity as a lactate transporter. Cancer Res. 2017, 77, 5591–5601. [Google Scholar] [CrossRef] [Green Version]
- Jones, R.S.; Morris, M.E. Monocarboxylate transporters: Therapeutic targets and prognostic factors in disease. Clin. Pharmacol. Ther. 2016, 100, 454–463. [Google Scholar] [CrossRef]
- Herrero, P.; Dence, C.S.; Coggan, A.R.; Kisrieva-Ware, Z.; Eisenbeis, P.; Gropler, R.J. L-3-11C-lactate as a PET tracer of myocardial lactate metabolism: A feasibility study. J. Nucl. Med. 2007, 48, 2046–2055. [Google Scholar] [CrossRef] [PubMed] [Green Version]
- Yokoi, F.; Hara, T.; Iio, M.; Nonaka, I.; Satoyoshi, E. 1-11Cpyruvate turnover in brain and muscle of patients with mitochondrial encephalomyopathy. A study with positron emission tomography (PET). J. Neurol. Sci. 1990, 99, 339–348. [Google Scholar] [CrossRef]
- Koho, N.; Maijala, V.; Norberg, H.; Nieminen, M.; Pösö, A.R. Expression of MCT1, MCT2 and MCT4 in the rumen, small intestine and liver of reindeer (Rangifer tarandus tarandus L.). Comp. Biochem. Physiol. Part A Mol. Integr. Physiol. 2005, 141, 29–34. [Google Scholar] [CrossRef]
- de Araujo, G.G.; Gobatto, C.A.; de Barros Manchado-Gobatto, F.; Teixeira, L.F.; Dos Reis, I.G.; Caperuto, L.C.; Papoti, M.; Bordin, S.; Cavaglieri, C.R.; Verlengia, R. MCT1 and MCT4 kinetic of mRNA expression in different tissues after aerobic exercise at maximal lactate steady state workload. Physiol. Res. 2015, 64, 513–522. [Google Scholar] [CrossRef]
- Sepponen, K.; Ruusunen, M.; Pakkanen, J.A.; Pösö, A.R. Expression of CD147 and monocarboxylate transporters MCT1, MCT2 and MCT4 in porcine small intestine and colon. Vet. J. 2007, 174, 122–128. [Google Scholar] [CrossRef]
- Becker, H.M.; Mohebbi, N.; Perna, A.; Ganapathy, V.; Capasso, G.; Wagner, C.A. Localization of members of MCT monocarboxylate transporter family Slc16 in the kidney and regulation during metabolic acidosis. Am. J. Physiol. Renal Physiol. 2010, 299, F141–F154. [Google Scholar] [CrossRef] [PubMed]
- Wang, Q.; Lu, Y.; Yuan, M.; Darling, I.M.; Repasky, E.A.; Morris, M.E. Characterization of monocarboxylate transport in human kidney HK-2 cells. Mol. Pharm. 2006, 3, 675–685. [Google Scholar] [CrossRef] [PubMed]
- Deuticke, B. Monocarboxylate transport in erythrocytes. J. Membr. Biol. 1982, 70, 89–103. [Google Scholar] [CrossRef] [PubMed]
- Poole, R.C.; Cranmer, S.L.; Halestrap, A.P.; Levi, A.J. Substrate and inhibitor specificity of monocarboxylate transport into heart cells and erythrocytes. Further evidence for the existence of two distinct carriers. Biochem. J. 1990, 269, 827–829. [Google Scholar] [CrossRef] [PubMed] [Green Version]
- Sadeghzadeh, M.; Moldovan, R.-P.; Teodoro, R.; Brust, P.; Wenzel, B. One-step radiosynthesis of the MCTs imaging agent [18F]FACH by aliphatic 18F-labelling of a methylsulfonate precursor containing an unprotected carboxylic acid group. Sci. Rep. 2019, 9, 18890. [Google Scholar] [CrossRef] [PubMed]
Sample Availability: Samples of the compounds are available from the authors. |


| Target Organ | OD | ED Contr. | ED Contr. | SD |
|---|---|---|---|---|
| in mSv/MBq | in ± mSv/MBq | in mSv/MBq | in ± mSv/MBq | |
| Adrenals | 1.42 × 10⁻² | 5.69 × 10⁻⁴ | 1.31 × 10⁻⁴ | 4.73 × 10⁻⁶ |
| Brain | 4.69 × 10⁻³ | 8.09 × 10⁻⁴ | 4.69 × 10⁻⁵ | 8.09 × 10⁻⁶ |
| Esophagus | 9.03 × 10⁻³ | 1.21 × 10⁻³ | 3.61 × 10⁻⁴ | 4.86 × 10⁻⁵ |
| Eyes | 6.91 × 10⁻³ | 1.68 × 10⁻³ | 0.00 | 0.00 |
| Gall Bladder Wall | 5.04 × 10⁻² | 3.75 × 10⁻² | 4.65 × 10⁻⁴ | 3.47 × 10⁻⁴ |
| Left Colon | 1.37 × 10⁻² | 2.91 × 10⁻³ | 6.63 × 10⁻⁴ | 1.41 × 10⁻⁴ |
| Small Intestine | 1.84 × 10⁻² | 8.44 × 10⁻³ | 1.71 × 10⁻⁴ | 7.81 × 10⁻⁵ |
| Stomach Wall | 1.09 × 10⁻² | 3.07 × 10⁻³ | 1.31 × 10⁻³ | 3.64 × 10⁻⁴ |
| Right Colon | 2.40 × 10⁻² | 7.40 × 10⁻³ | 1.16 × 10⁻³ | 3.62 × 10⁻⁴ |
| Rectum | 1.38 × 10⁻² | 1.15 × 10⁻³ | 3.18 × 10⁻⁴ | 2.60 × 10⁻⁵ |
| Heart Wall | 9.46× 10⁻³ | 7.51 × 10⁻⁴ | 8.72 × 10⁻⁵ | 6.72 × 10⁻⁶ |
| Kidneys | 2.62 × 10⁻² | 2.19 × 10⁻³ | 2.42 × 10⁻⁴ | 2.00 × 10⁻⁵ |
| Liver | 2.33 × 10⁻² | 1.36 × 10⁻² | 9.34 × 10⁻⁴ | 5.46 × 10⁻⁴ |
| Lungs | 7.88 × 10⁻³ | 2.27 × 10⁻⁴ | 9.46 × 10⁻⁴ | 2.72 × 10⁻⁵ |
| Pancreas | 3.05 × 10⁻² | 2.73 × 10⁻² | 2.81 × 10⁻⁴ | 2.52 × 10⁻⁴ |
| Prostate | 1.30 × 10⁻² | 2.85 × 10⁻³ | 6.01 × 10⁻⁵ | 1.32 × 10⁻⁵ |
| Salivary Glands | 7.90 × 10⁻³ | 2.11 × 10⁻³ | 7.90 × 10⁻⁵ | 2.11 × 10⁻⁵ |
| Red Marrow | 1.39 × 10⁻² | 2.19 × 10⁻³ | 1.67 × 10⁻³ | 2.63 × 10⁻⁴ |
| Osteogenic Cells | 2.12 × 10⁻² | 1.88 × 10⁻³ | 2.12 × 10⁻⁴ | 1.88 × 10⁻⁵ |
| Spleen | 9.08 × 10⁻³ | 1.14 × 10⁻³ | 8.37 × 10⁻⁵ | 1.04 × 10⁻⁵ |
| Testes | 8.45 × 10⁻³ | 2.21 × 10⁻³ | 3.38 × 10⁻⁴ | 8.87 × 10⁻⁵ |
| Thymus | 8.33 × 10⁻³ | 1.73 × 10⁻³ | 7.69 × 10⁻⁵ | 1.59 × 10⁻⁵ |
| Thyroid | 7.08 × 10⁻³ | 8.70 × 10⁻⁴ | 2.83 × 10⁻⁴ | 3.49 × 10⁻⁵ |
| Urinary Bladder Wall | 6.26 × 10⁻² | 2.89 × 10⁻² | 2.50 × 10⁻³ | 1.15 × 10⁻³ |
| Total Body | 9.76 × 10⁻³ | 1.53 × 10⁻³ | 0.00 | 0.00 |
| ED | 12.4 × 10⁻² |
| Tracer | Target/Organ | Preclinical (μSv/MBq) | Reference |
|---|---|---|---|
| [18F]FACH | MCT1/4/brain tumor | 12.4 | this study |
| [18F]DBT10 | α7 receptor/brain tumor | 13.7 | [22] |
| (S)-(−)-[18F]fluspidine (R)-(+)-[18F]fluspidine | σ receptor/brain | 12.9 14.0 | [15] |
| (−)-[18F]flubatine (+)-[18F]flubatine | α4β2 receptor/brain | 14.7 14.3 | [16] [14] |
© 2020 by the authors. Licensee MDPI, Basel, Switzerland. This article is an open access article distributed under the terms and conditions of the Creative Commons Attribution (CC BY) license (http://creativecommons.org/licenses/by/4.0/).
Share and Cite
Sattler, B.; Kranz, M.; Wenzel, B.; Jain, N.T.; Moldovan, R.-P.; Toussaint, M.; Deuther-Conrad, W.; Ludwig, F.-A.; Teodoro, R.; Sattler, T.; et al. Preclinical Incorporation Dosimetry of [18F]FACH—A Novel 18F-Labeled MCT1/MCT4 Lactate Transporter Inhibitor for Imaging Cancer Metabolism with PET. Molecules 2020, 25, 2024. https://doi.org/10.3390/molecules25092024
Sattler B, Kranz M, Wenzel B, Jain NT, Moldovan R-P, Toussaint M, Deuther-Conrad W, Ludwig F-A, Teodoro R, Sattler T, et al. Preclinical Incorporation Dosimetry of [18F]FACH—A Novel 18F-Labeled MCT1/MCT4 Lactate Transporter Inhibitor for Imaging Cancer Metabolism with PET. Molecules. 2020; 25(9):2024. https://doi.org/10.3390/molecules25092024
Chicago/Turabian StyleSattler, Bernhard, Mathias Kranz, Barbara Wenzel, Nalin T. Jain, Rareş-Petru Moldovan, Magali Toussaint, Winnie Deuther-Conrad, Friedrich-Alexander Ludwig, Rodrigo Teodoro, Tatjana Sattler, and et al. 2020. "Preclinical Incorporation Dosimetry of [18F]FACH—A Novel 18F-Labeled MCT1/MCT4 Lactate Transporter Inhibitor for Imaging Cancer Metabolism with PET" Molecules 25, no. 9: 2024. https://doi.org/10.3390/molecules25092024