
Enhancement of the SPR Effect in an Optical Fiber Device Utilizing a Thin Ag Layer and a 3092A Liquid Crystal Mixture


Abstract
:1. Introduction
2. Materials and Methods
3. Results and Discussion
4. Conclusions
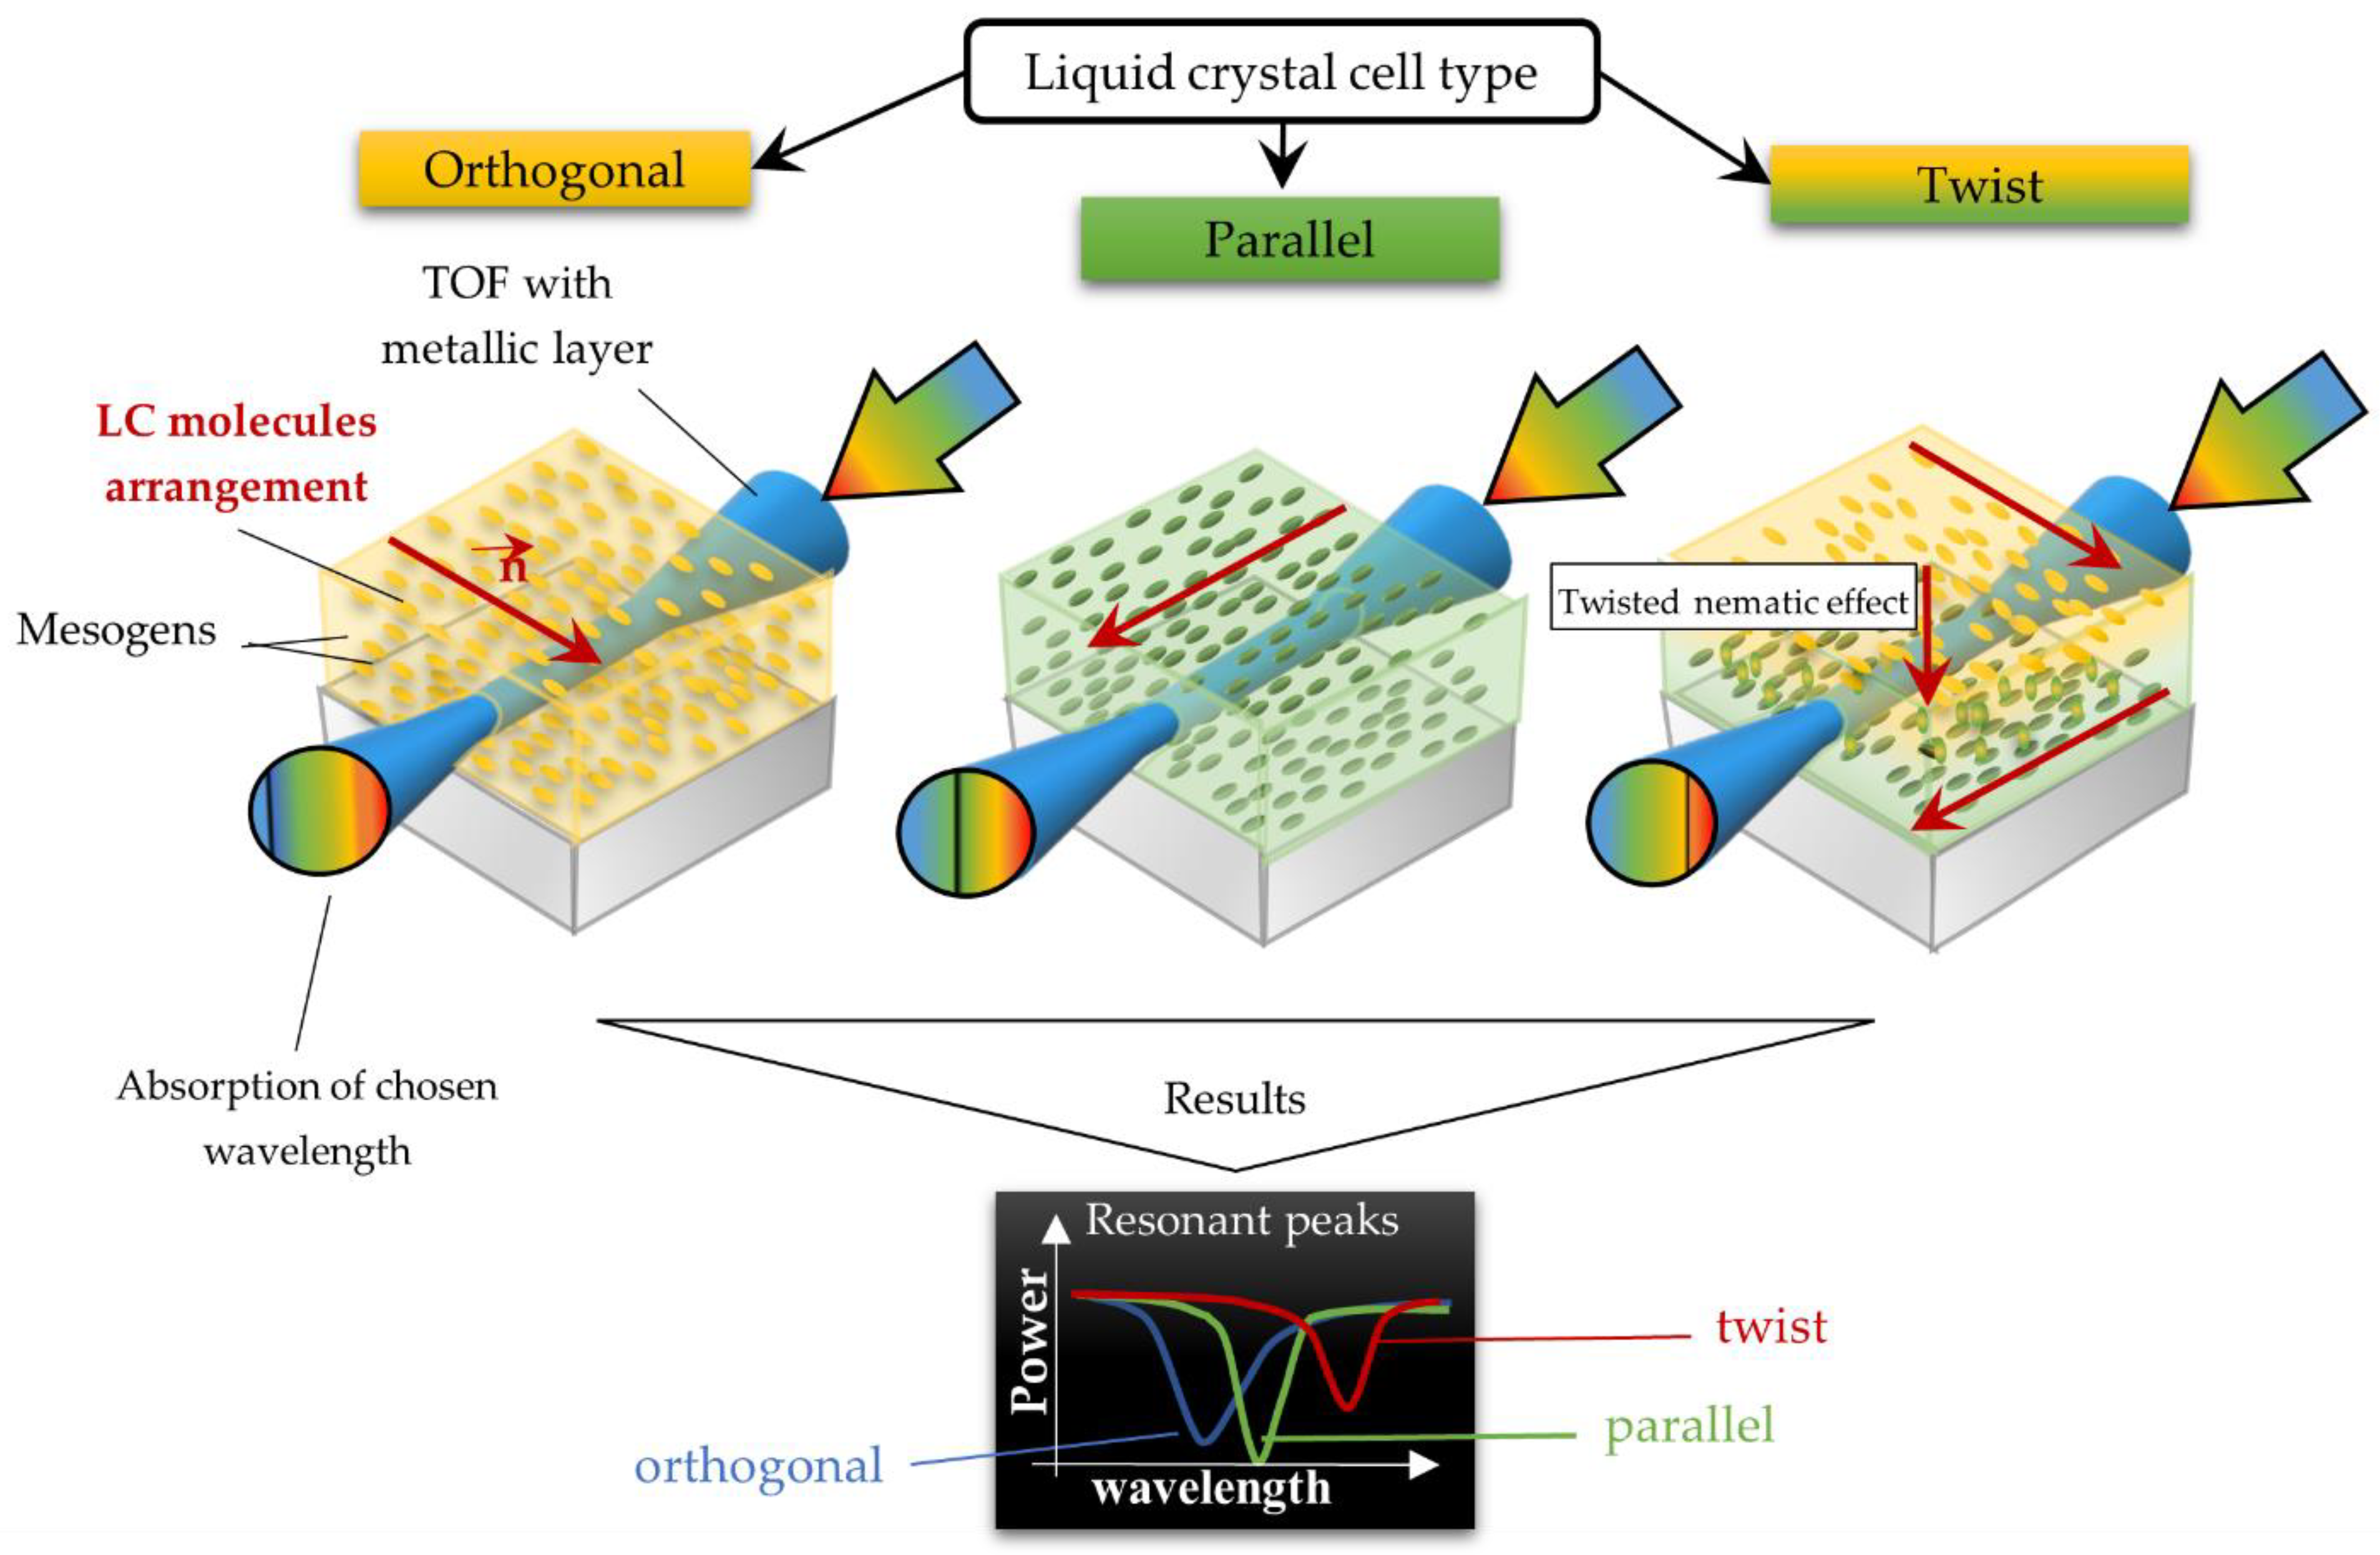
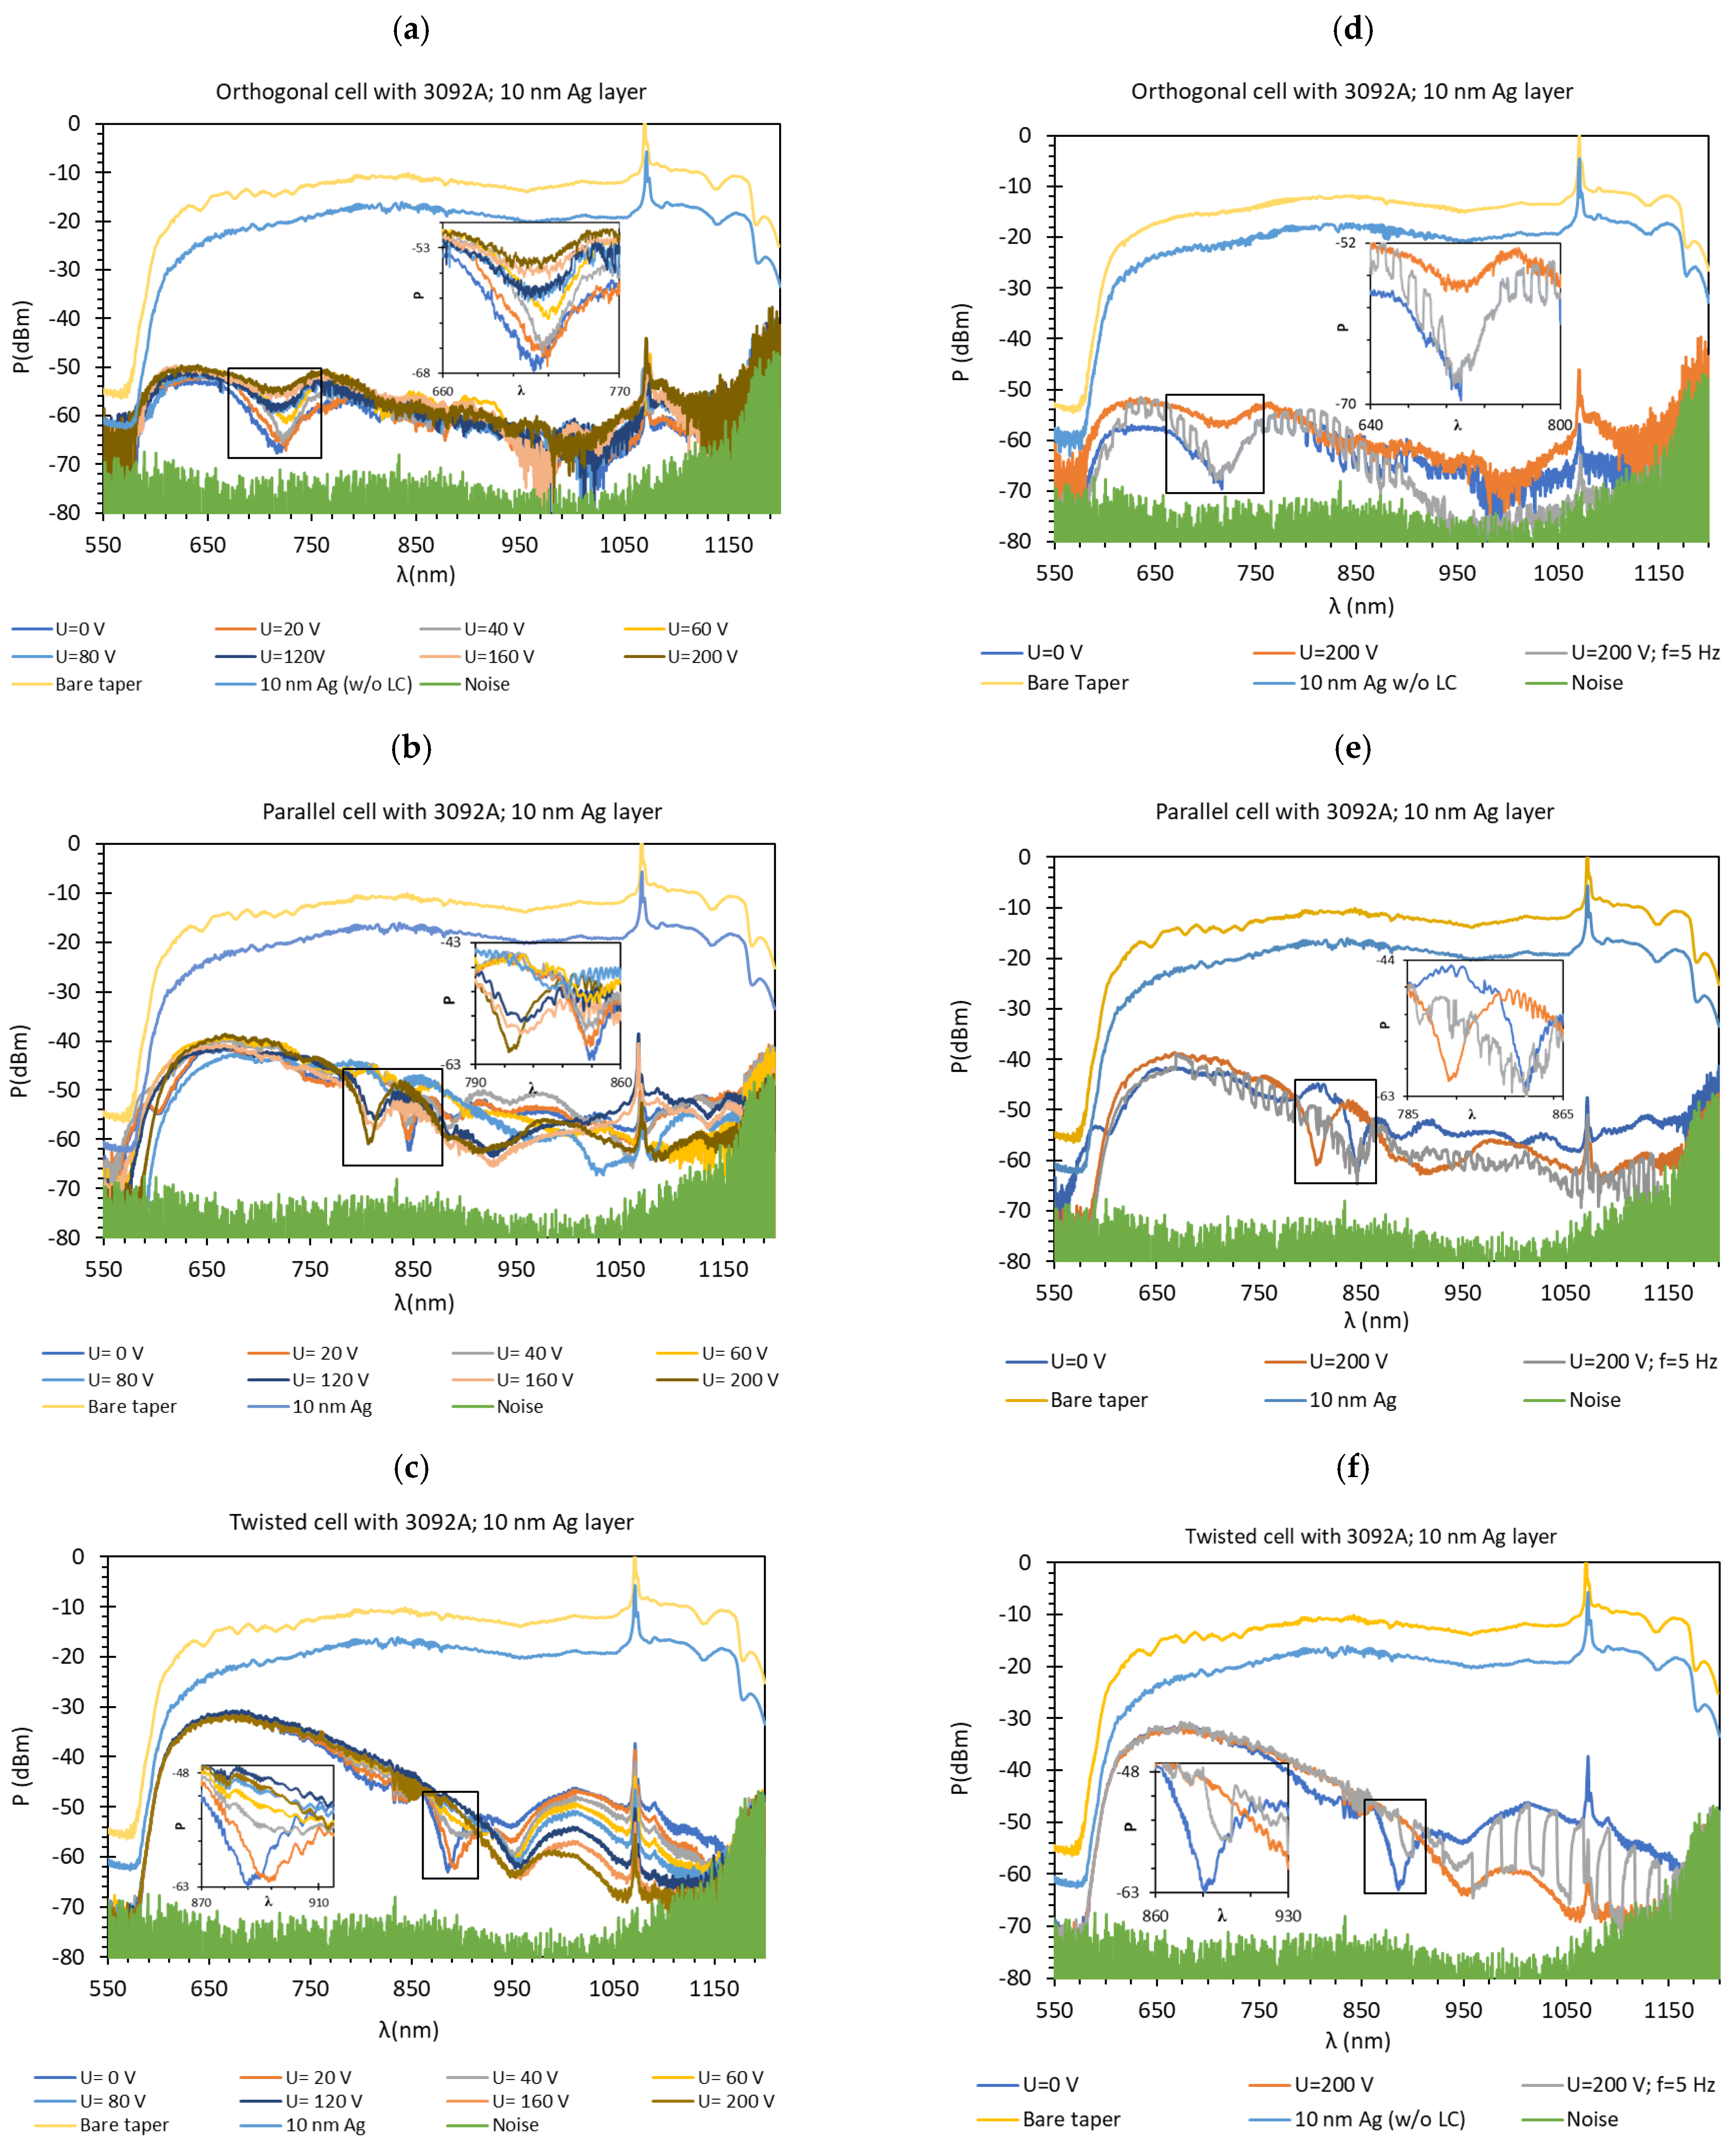
- The resonant peaks shifted approximately about 55 nm in relation to the peaks obtained for gold layers. For the orthogonal and twisted cells, a red shift of the resonant dip was observed and they occurred at 720 nm and 887 nm, respectively. For the parallel cell, a blue shift was observed and the peak occurred at 845 nm.
- The peaks width reduced to at least 50%, while SNR together with δλres increased. The widest peak was obtained for the orthogonal cell.
- The highest resonant peak absorption occurred for the orthogonal cell and equaled 99%. For the other two cases, absorption equaled a minimum of 90%.
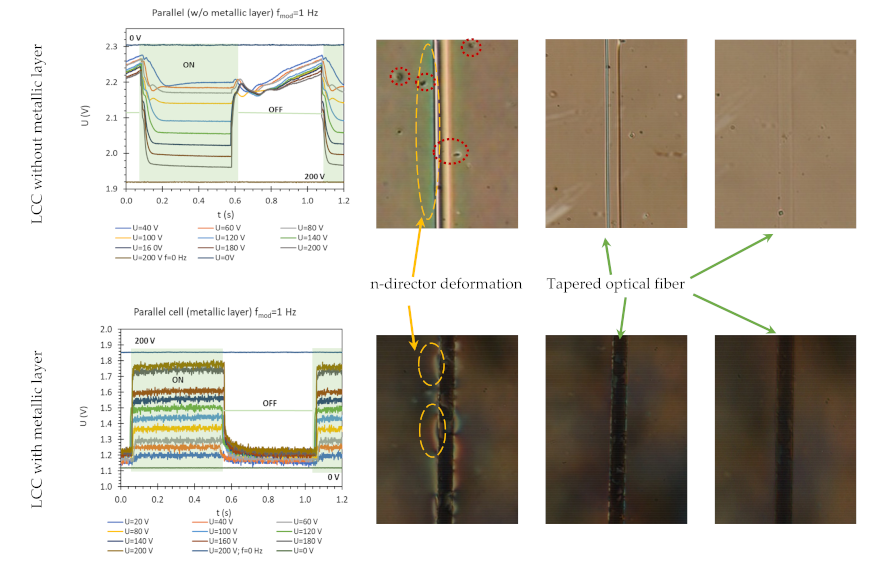
- Dynamic characteristics of LCC—with and without a metal layer—showed that the metallic layer caused a fluctuation, as well as an extension of the relaxation time.
Author Contributions
Funding
Conflicts of Interest
References
- Gandhi, M.S.A.; Chu, S.; Senthilnathan, K.; Babu, P.R.; Nakkeeran, K.; Li, Q. Recent Advances in Plasmonic Sensor-Based Fiber Optic Probes for Biological Applications. Appl. Sci. 2019, 9, 949. [Google Scholar] [CrossRef] [Green Version]
- Verma, R.; Gupta, D.B. Fiber optic SPR sensor for the detection of 3-pyridinecarboxamide (vitamin B3) using molecularly imprinted hydrogel. Sens. Actuators B Chem. 2013, 177, 279–285. [Google Scholar] [CrossRef]
- Mitu, S.A.; Ahmed, K.; Al Zahrani, F.A.; Grover, A.; Rajan, M.S.M.; Moni, M.A. Development and analysis of surface plasmon resonance based refractive index sensor for pregnancy testing. Opt. Lasers Eng. 2021, 140, 106551. [Google Scholar] [CrossRef]
- Prakashan, V.P.; Gejo, G.; Sanu, M.S.; Sajna, M.S.; Subin, T.; Biju, P.R.; Cyriac, J.; Unnikrishnan, N.V. Novel SPR based fiber optic sensor for vitamin A using Au@Ag core-shell nanoparticles doped SiO2-TiO2-ZrO2 ternary matrix. Appl. Surf. Sci. 2019, 484, 219–227. [Google Scholar] [CrossRef]
- Pathak, A.; Parveen, S.; Gupta, B.D. Ultrasensitive, highly selective, and real-time detection of protein using functionalized CNTs as MIP platform for FOSPR-based biosensor. Nanotechnology 2017, 28, 355503. [Google Scholar] [CrossRef]
- Ayyanar, N.; Sreekanth, K.V.; Raja, G.T.; Rajan, M.S.M. Photonic Crystal Fiber-Based Reconfigurable Biosensor Using Phase Change Material. IEEE Trans. NanoBioscience 2021, 20, 338–344. [Google Scholar] [CrossRef] [PubMed]
- Cheng, Y.; Sun, M. Unified treatments for localized surface plasmon resonance and propagating surface plasmon polariton based on resonance modes in metal nanowire. Opt. Commun. 2021, 499, 127277. [Google Scholar] [CrossRef]
- Wang, D.; Loo, J.F.C.; Chen, J.; Yam, Y.; Chen, S.-C.; He, H.; Kong, S.K.; Ho, H.P. Recent Advances in Surface Plasmon Resonance Imaging Sensors. Sensors 2019, 19, 1266. [Google Scholar] [CrossRef] [Green Version]
- Hossain, M.Z.; McCormick, S.P.; Maragos, C.M. An Imaging Surface Plasmon Resonance Biosensor Assay for the Detection of T-2 Toxin and Masked T-2 Toxin-3-Glucoside in Wheat. Toxins 2018, 10, 119. [Google Scholar] [CrossRef] [PubMed] [Green Version]
- Chen, J.H.; Li, D.R.; Xu, F. Optical microfiber sensors: Sensing mechanisms, and recent advances. J. Lightw. Technol. 2019, 37, 2577–2589. [Google Scholar] [CrossRef]
- Klantsataya, E.; Jia, P.; Ebendorff-Heidepriem, H.; Monro, T.M.; François, A. Plasmonic Fiber Optic Refractometric Sensors: From Conventional Architectures to Recent Design Trends. Sensors 2017, 17, 12. [Google Scholar] [CrossRef] [PubMed] [Green Version]
- Liu, Z.; Wei, Y.; Zhang, Y.; Liu, C.; Zhang, Y.; Zhao, E.; Yang, J.; Liu, C.; Yuan, L. Distributed fiber surface plasmon resonance sensor based on the incident angle adjusting method. Opt. Lett. 2015, 40, 4452–4455. [Google Scholar] [CrossRef]
- Suzuki, H.; Sugimoto, M.; Matsui, Y.; Kondoh, J. Effects of gold film thickness on spectrum profile and sensitivity of a multimode-optical-fiber SPR sensor. Sens. Actuators B Chem. 2008, 132, 26–33. [Google Scholar] [CrossRef]
- Lin, Y.; Zou, Y.; Mo, Y.; Guo, J.; Lindquist, R.G. E-beam patterned gold nanodot arrays on optical fiber tips for localized surface plasmon resonance biochemical sensing. Sensors 2010, 10, 9397–9406. [Google Scholar] [CrossRef]
- Zhao, J.; Cao, S.; Liao, C.; Wang, Y.; Wang, G.; Xu, X.; Fu, C.; Xu, G.; Lian, J.; Wang, Y. Surface plasmon resonance refractive sensor based on silver-coated side-polished fiber. Sens. Actuators B Chem. 2016, 230, 206–211. [Google Scholar] [CrossRef]
- Sciacca, B.; Francois, A.; Hoffmann, P.; Monro, T.M. Multiplexing of radiative-surface plasmon resonance for the detection of gastric cancer biomarkers in a single optical fiber. Sens. Actuators B Chem. 2013, 183, 454–458. [Google Scholar] [CrossRef]
- Kulchin, Y.N.; Vitrik, O.B.; Dyshlyuk, A.V. Analysis of surface plasmon resonance in bent single-mode waveguides with metal-coated cladding by eigenmode expansion method. Opt. Express 2014, 22, 22196–22201. [Google Scholar] [CrossRef]
- Zhao, Y.; Lei, M.; Liu, S.-X.; Zhao, Q. Smart hydrogel-based optical fiber SPR sensor for pH measurements. Sens. Actuators B Chem. 2018, 261, 226–232. [Google Scholar] [CrossRef]
- Takagi, K.; Watanabe, K. Near Infrared Characterization of Hetero-Core Optical Fiber SPR Sensors Coated with Ta2O5 Film and Their Applications. Sensors 2012, 12, 2208–2218. [Google Scholar] [CrossRef] [PubMed] [Green Version]
- Homola, J. On the sensitivity of surface plasmon resonance sensors with spectral interrogation. Sensors Actuators B Chem. 1997, 41, 207–211. [Google Scholar] [CrossRef]
- Taha, B.A.; Ali, N.; Sapiee, N.M.; Fadhel, M.M.; Mat Yeh, R.M.; Bachok, N.N.; Al Mashhadany, Y.; Arsad, N. Comprehensive Review Tapered Optical Fiber Configurations for Sensing Application: Trend and Challenges. Biosensors 2021, 11, 253. [Google Scholar] [CrossRef]
- Zakrzewski, A.; Pięta, A.; Patela, S. Simple method for manufacturing and optical characterization of tapered optical fibres. Opto-Electron. Rev. 2016, 24, 216–222. [Google Scholar] [CrossRef] [Green Version]
- Lakomski, M.; Guzowski, B.; Wozniak, A. Fabrication of ultra-long tapered optical fibers. Microelectron. Eng. 2019, 221, 111193. [Google Scholar] [CrossRef]
- Korec, J.; Stasiewicz, K.A.; Strzeżysz, O.; Kula, P.; Jaroszewicz, L.R. Electro-Steering Tapered Fiber-Optic Device with Liquid Crystal Cladding. J. Sens. 2019, 2019, 1617685. [Google Scholar] [CrossRef]
- Verma, R.K.; Sharma, A.K.; Gupta, B.D. Surface plasmon resonance based tapered fiber optic sensor with different taper profiles. Opt. Commun. 2008, 281, 1486–1491. [Google Scholar] [CrossRef]
- Leung, A.; Rijal, K.; Shankar, P.M.; Mutharasan, R. Effects of geometry on transmission and sensing potential of tapered fiber sensors. Biosens. Bioelectron. 2006, 21, 2202–2209. [Google Scholar] [CrossRef]
- Ward, J.M.; O’Shea, D.G.; Shortt, B.J.; Morrissey, M.J.; Deasy, K.; Nic Chormaic, S.G. Heat-and-pull rig for fiber taper fabrication. Rev. Sci. Instrum. 2006, 77, 083105. [Google Scholar] [CrossRef] [Green Version]
- Harun, S.; Lim, K.; Tio, C.; Dimyati, K.; Ahmad, H. Theoretical analysis and fabrication of tapered fiber. Optik 2013, 124, 538–543. [Google Scholar] [CrossRef]
- Birks, T.A.; Li, Y.W. The Shape of Fiber Tapers. J. Lightwave Technol. 1992, 10, 432–438. [Google Scholar] [CrossRef]
- Gao, S.; Zhang, W.; Geng, P.; Xue, X.; Zhang, H.; Bai, Z. Highly Sensitive In-Fiber Refractive Index Sensor Based on Down-Bitaper Seeded Up-Bitaper Pair. IEEE Photonics Technol. Lett. 2012, 24, 1878–1881. [Google Scholar] [CrossRef]
- Korec, J.; Stasiewicz, K.A.; Jaroszewicz, L.R.; Garbat, K. SPR Effect Controlled by an Electric Field in a Tapered Optical Fiber Surrounded by a Low Refractive Index Nematic Liquid Crystal. Materials 2020, 13, 4942. [Google Scholar] [CrossRef]
- Lin, Z.; Chen, S.; Lin, C. Sensitivity Improvement of a Surface Plasmon Resonance Sensor Based on Two-Dimensional Materials Hybrid Structure in Visible Region: A Theoretical Study. Sensors 2020, 20, 2445. [Google Scholar] [CrossRef]
- Kuryoz, P.; Poperenko, L.; Kravets, V. Correlation between dielectric constants and enhancement of surface plasmon resonances for thin gold films. Phys. Status Solidi 2013, 210, 2445–2455. [Google Scholar] [CrossRef]
- Amiri, I.S.; Alwi, S.A.K.; Raya, S.A.; Zainuddin, N.A.M.; Rohizat, N.S.; Rajan, M.S.M.; Zakaria, R. Graphene Oxide Effect on Improvement of Silver Surface Plasmon Resonance D-Shaped Optical Fiber Sensor. J. Opt. Commun. 2019. [Google Scholar] [CrossRef]
- Rosenblatt, G.; Simkhovich, B.; Bartal, G.; Orenstein, M. Nonmodal Plasmonics: Controlling the Forced Optical Response of Nanostructures. Phys. Rev. X 2020, 10, 011071. [Google Scholar] [CrossRef] [Green Version]
- De Lima Queiroz, I.J.C.; de Melo, A.A.; Fernandes, F.P.M.; de Carvalho Fim, F.; Blair, S.; Wang, Y.; da Silva Moreira, C.; Cruz, R.M.S. Sensitivity enhancement of silver-based SPR sensors using ultrathin gold film and graphene overlay. In Proceedings of the 2020 IEEE International Instrumentation and Measurement Technology Conference (I2MTC), Dubrovnik, Croatia, 25–28 May 2020; pp. 1–6. [Google Scholar] [CrossRef]
- Johnson, P.B.; Christy, R.W. Optical Constants of the Noble Metals. Phys. Rev. B 1972, 6, 4370–4379. [Google Scholar] [CrossRef]
- Mishra, S.K.; Gupta, B.D. Surface plasmon resonance based fiber optic pH sensor utilizing Ag/ITO/Al/hydrogel layers. Analyst 2013, 138, 2640. [Google Scholar] [CrossRef] [PubMed]
- Babar, S.; Weaver, J.H. Optical constants of Cu, Ag, and Au revisited. Appl. Opt. 2015, 54, 477–481. [Google Scholar] [CrossRef]
- Xiong, K.; Tordera, D.; Emilsson, G.; Olsson, O.; Linderhed, U.; Jonsson, M.P.; Dahlin, A.B. Switchable Plasmonic Metasurfaces with High Chromaticity Containing Only Abundant Metals. Nano Lett. 2017, 17, 7033–7039. [Google Scholar] [CrossRef] [Green Version]
- McPeak, K.M.; Jayanti, S.V.; Kress, S.J.; Meyer, S.; Iotti, S.; Rossinelli, A.; Norris, D.J. Plasmonic films can easily be better: Rules and recipes. ACS Photonics 2015, 2, 326–333. [Google Scholar] [CrossRef] [PubMed]
- Moreira, C.; Wang, Y.; Blair, S.; Carvalho, I.; Cruz, R.S. Aluminum-Based Deep-Ultraviolet Surface Plasmon Resonance Sensor. Plasmonics 2020, 15, 1891–1901. [Google Scholar] [CrossRef]
- Werner, W.S.M.; Glantschnig, K.; Ambrosch-Draxl, C. Optical constants and inelastic electron-scattering data for 17 elemental metals. J. Phys. Chem. Ref. Data 2009, 38, 1013–1092. [Google Scholar] [CrossRef]
- Garcia-Pardo, M.; Nieto-Pinero, E.; Petford-Long, A.K.; Serna, R.; Toudert, J. Active analog tuning of the phase of light in the visible regime by bismuth-based metamaterials. Nanophotonics 2020, 9, 885–896. [Google Scholar] [CrossRef]
- Johnson, P.B.; Christy, R.W. Optical constants of transition metals: Ti, V, Cr, Mn, Fe, Co, Ni, and Pd. Phys. Rev. B 1974, 9, 5056–5070. [Google Scholar] [CrossRef]
- Tittl, A.; Mai, P.; Taubert, R.; Dregely, D.; Liu, N.; Giessen, H. Palladium-Based Plasmonic Perfect Absorber in the Visible Wavelength Range and Its Application to Hydrogen Sensing. Nano Lett. 2011, 11, 4366–4369. [Google Scholar] [CrossRef] [PubMed]
- Chen, Y.; Cheng, Y.; Sun, M. Physical Mechanisms on Plasmon-Enhanced Organic Solar Cells. J. Phys. Chem. C 2021, 125, 21301. [Google Scholar] [CrossRef]
- Singh, S.; Mishra, S.K.; Gupta, B.D. Sensitivity enhancement of a surface plasmon resonance based fibre optic refractive index sensor utilizing an additional layer of oxides. Sens. Actuators A Phys. 2013, 193, 136–140. [Google Scholar] [CrossRef]
- Zainuddin, N.A.M.; Ariannejad, M.M.; Arasu, P.T.; Harun, S.W.; Zakaria, R. Investigation of cladding thicknesses on silver SPR based side-polished optical fiber refractive index sensor. Results Phys. 2019, 13, 102255. [Google Scholar] [CrossRef]
- Korec, J.; Stasiewicz, K.A.; Jaroszewicz, L.R.; Piecek, W.; Kula, P. Temperature and voltage sensing based on a tapered optical fiber device with the liquid crystal cladding. Opt. Fiber Technol. 2020, 56, 102190. [Google Scholar] [CrossRef]
- Kim, N.-H.; Choi, M.; Kim, T.W.; Choi, W.; Park, S.Y.; Byun, K.M. Sensitivity and Stability Enhancement of Surface Plasmon Resonance Biosensors based on a Large-Area Ag/MoS2 Substrate. Sensors 2019, 19, 1894. [Google Scholar] [CrossRef] [Green Version]
- Al-Sarraj, A.; Saoud, K.M.; Elmel, A.; Mansour, S.; Haik, Y. Optoelectronic properties of highly porous silver oxide thin film. SN Appl. Sci. 2021, 3, 15. [Google Scholar] [CrossRef]
- Madhusudana, N. Role of Molecular Dipoles in Liquid Crystals. Mol. Cryst. Liq. Cryst. 2004, 409, 371–387. [Google Scholar] [CrossRef]
- Abbott, N.L. Surface effects on orientation of liquid crystals. Curr. Opin. Colloid Interface Sci. 1997, 2, 76–82. [Google Scholar] [CrossRef]


| Metal | εr + iεi * | εr/εi * | Probes Operating Wavelength Range | |
|---|---|---|---|---|
| Au | −11.36 + 1.23i | 9.23 | VIS | [35,36] |
| Ag | −18.22 + 0.48i | 37.9 | VIS | [37,38] |
| Cu | −12.46 + 0.65i | 19.2 | VIS-IR | [39,40] |
| Al | −43.42 + 15.40i | 2.82 | UV-NIR | [41,42] |
| Bi | −23.441 + 2.18i | 10.7 | UV-NIR | [43,44] |
| Pd | −15.27 + 15.17 | 1.01 | NIR-IR | [45,46] |
| Orthogonal Cell | Twisted Cell | |||
|---|---|---|---|---|
| Au | Ag | Au | Ag | |
| λres | λres (0 V) = 665.8 nm | λres (0 V) = 719.0 nm | λres (0 V) = 831.4 nm | λres (0 V) = 886.8 nm |
| δλres Ag-Au | δλres Ag-Au (0 V) = 53.2 nm | δλres Ag-Au (0 V) = 55.4 nm | ||
| Δλ0.5 | Δλ0.5 (0 V) = 64.3 nm | Δλ0.5 (0 V) = 33.2 nm | Δλ0.5 (0 V) = 47.6 nm | Δλ0.5 (0 V) = 15.4 nm |
| δλ0.5 | δλ0.5 Ag-Au (0 V) = 33.1 nm → −51.5% * | δλ0.5 Ag-Au (0 V) = 32.2 nm → −67.6% * | ||
| Resonant dip |  |  | 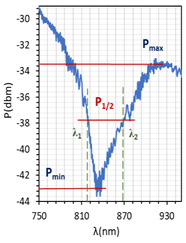 | 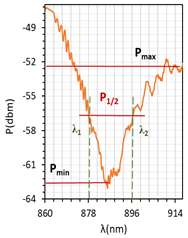 |
| SNR | 0.036 | 0.078 | 0.076 | 0.338 |
| Parallel Cell | ||||
|---|---|---|---|---|
| Au | Ag | |||
| λres | λres (200 V) = 749.7 nm | λres (200 V) = 807.2 nm | ||
| λres (0 V) = 786.0 nm | λres (0 V) = 845.6 nm | |||
| Δλres (0–200 V) = 36.3 nm | Δλres (0–200 V) = 38.4 nm | |||
| δλres Ag-Au | δλres Ag-Au (200 V) = 57.5 nm | |||
| δλres Ag-Au (0 V) = 59.6 nm | ||||
| Δλ0.5 | Δλ0.5 (200 V) = 31.9 nm | Δλ0.5 (200 V) = 16.2 nm | ||
| Δλ0.5 (0 V) = 28.9 nm | Δλ0.5 (0 V) = 12.2 nm | |||
| Δλ0.5 (0–200 V) = 3 nm | Δλ0.5 (0–200 V) = 4 nm | |||
| δλ0.5 | δλ0.5 Ag-Au (200 V) = 15.7 nm → −49.2% * | |||
| δλ0.5 Ag-Au (0 V) = 16.7 nm → −57.8% * | ||||
| Resonant dips | 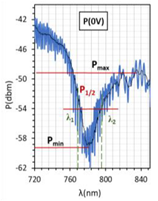 | 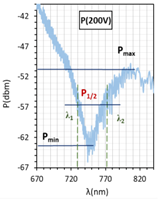 |  | 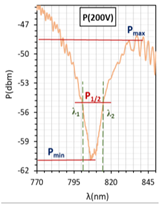 |
| SNR | 0.00 ** | 0.033 | ||
| Dynamic Response of LC Cell | U = 0 V | U = 100 V | U = 200 V | |
|---|---|---|---|---|
 | ||||
Publisher’s Note: MDPI stays neutral with regard to jurisdictional claims in published maps and institutional affiliations. |
© 2021 by the authors. Licensee MDPI, Basel, Switzerland. This article is an open access article distributed under the terms and conditions of the Creative Commons Attribution (CC BY) license (https://creativecommons.org/licenses/by/4.0/).
Share and Cite
Korec, J.; Stasiewicz, K.A.; Garbat, K.; Jaroszewicz, L.R. Enhancement of the SPR Effect in an Optical Fiber Device Utilizing a Thin Ag Layer and a 3092A Liquid Crystal Mixture. Molecules 2021, 26, 7553. https://doi.org/10.3390/molecules26247553
Korec J, Stasiewicz KA, Garbat K, Jaroszewicz LR. Enhancement of the SPR Effect in an Optical Fiber Device Utilizing a Thin Ag Layer and a 3092A Liquid Crystal Mixture. Molecules. 2021; 26(24):7553. https://doi.org/10.3390/molecules26247553
Chicago/Turabian StyleKorec, Joanna, Karol A. Stasiewicz, Katarzyna Garbat, and Leszek R. Jaroszewicz. 2021. "Enhancement of the SPR Effect in an Optical Fiber Device Utilizing a Thin Ag Layer and a 3092A Liquid Crystal Mixture" Molecules 26, no. 24: 7553. https://doi.org/10.3390/molecules26247553