
LC-ESI/LTQ-Orbitrap-MS Based Metabolomics in Evaluation of Bitter Taste of Arbutus unedo Honey


1
Department of Pharmacy, University of Salerno, via Giovanni Paolo II, 132, 84084 Fisciano, Italy
2
Department of Pharmacognosy and Herbal Medicines, Wrocław Medical University, ul. Borowska, 211, 50-556 Wrocław, Poland
3
Department of Life and Environmental Sciences, University of Cagliari, University Campus, S.P. Monserrato-Sestu km 0.700, 09042 Monserrato, Italy
*
Author to whom correspondence should be addressed.
Molecules 2021, 26(9), 2765; https://doi.org/10.3390/molecules26092765
Submission received: 22 March 2021
/
Revised: 3 May 2021
/
Accepted: 5 May 2021
/
Published: 8 May 2021
(This article belongs to the Special Issue Progress in Analytical Methods for the Characterization, Quality and Safety of the Beehive Products)
Abstract
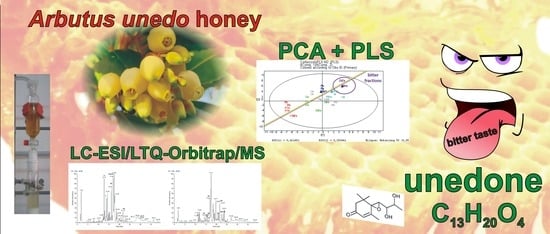
:Strawberry tree honey is a high-value honey from the Mediterranean area and it is characterised by a typical bitter taste. To possibly identify the secondary metabolites responsible for the bitter taste, the honey was fractionated on a C18 column and the individual fractions were subjected to sensory analysis and then analysed by liquid chromatography coupled with high-resolution tandem mass spectrometry in negative ion mode, using a mass spectrometer with an electrospray source coupled to a hybrid high resolution mass analyser (LC-ESI/LTQ-Orbitrap-MS). A chemometric model obtained by preliminary principal component analysis (PCA) of LC-ESI/LTQ-Orbitrap-MS data allowed the identification of the fractions that caused the perception of bitterness. Subsequently, a partial least squares (PLS) regression model was built. The studies carried out with multivariate analysis showed that unedone (2-(1,2-dihydroxypropyl)-4,4,8-trimethyl-1-oxaspiro [2.5] oct-7-en-6-one) can be considered responsible for the bitter taste of strawberry tree honey. Confirmation of the bitter taste of unedone was obtained by sensory evaluation of a pure standard, allowing it to be added to the list of natural compounds responsible for giving the sensation of bitterness to humans.
1. Introduction
Strawberry tree (Arbutus unedo L.) (ST) honey is a peculiar bitter tasting honey produced in the area of the Mediterranean basin. This highly valuable honey is well recognised for its antioxidant [1,2,3], anti-inflammatory, and antimicrobial activities [4], and shows anti-xanthine oxidase and antityrosinase activities [5]. Several studies have been performed to characterise the chemical composition of ST honey, which is characterised by phenolic compounds (hydroxy derivatives of benzoic and cinnamic acids, and flavonoids), isoprenoids, and free amino acids [6,7]. Homogentisic acid (2,5-dihydroxyphenylacetic, HGA), unedone (2-(1,2-dihydroxypropyl)-4,8,8-trimethyl-1-oxaspiro [2.5]oct-4-en-6-one), (±)-2-cis, 4-trans-abscisic acid (c,t-ABA), and (±)-2-trans, 4-trans-abscisic acid (t,t-ABA) have been considered as chemical markers of the botanical origin of ST honey [8,9].
Although ST honey has been investigated for its chemical composition, no studies have been reported as regards the possible compounds responsible for its bitter taste so far. Arbutin, the glucosylated form of hydroquinone, has been suggested as possibly responsible for the bitter taste of ST honey [4]. However, although the bitter taste perception of arbutin is very strong [10] and this compound can be found abundantly in A. unedo plant, its presence in ST honey is variable, often insignificant, and sometimes it is totally absent [4]. Thus, the involvement of arbutin in the bitter taste of ST honey is very unlikely. Literature data indicate many plant-derived bitter-tasting compounds [11,12]. They can be represented by alkaloids, terpenoids, phenols, amino acids, and peptides, and they activate the bitter taste receptors (T2R). Comparison of the known natural compounds responsible for the bitter taste with the molecules reported in the literature for ST honey did not make it possible to speculate which compound was responsible for the typical bitter taste of this honey.
Given the above, investigation of ST honey using the metabolomic approach could help in detecting the compounds responsible for the bitter taste in ST honey. Metabolomics, as an emerging discipline of omics science, is a valid tool for the characterization of complex biological samples as it allows the production of a molecular fingerprint for samples by using innovative analytical techniques, such as mass spectrometry (MS) and nuclear magnetic resonance (NMR) [13,14]. Particularly, liquid chromatography-high resolution mass spectrometry metabolic profiling has begun to be used to discover possible markers in foods, especially those most likely responsible for the biological activities [15,16,17,18].
The aim of this study was to develop an LC-ESI/LTQ-Orbitrap-MS based metabolomic approach in the evaluation of the compounds responsible for the bitter taste of Arbutus unedo honey. To this purpose, polar compounds from strawberry tree honey were separated on a column containing C18 resin and the different fractions obtained were submitted to sensory analysis and investigated by high resolution mass spectrometry ((HR) LC-ESI/ LTQ-Orbitrap-MS, (HR) LC-ESI/LTQ-Orbitrap-MS/MS) and by HPLC-DAD. In addition, principal component analysis (PCA) of LC-ESI/LTQ-Orbitrap-MS data and a partial least squares (PLS) regression model were used to identify compounds responsible for the bitter taste. Finally, sensorial analysis on targeted pure compounds was performed to confirm the molecule responsible for the bitter taste in strawberry tree honey.
2. Results and Discussion
2.1. LC-ESI/LTQ-Orbitrap-MS
The 21 fractions obtained from the fractioning on C18 column were tasted to evaluate the impact of bitterness and were classified by comparison with quinine solutions (see Section 3.3) in five groups of bitter perception (from 0 to 4) as follows: no bitter taste (0, fractions A, B and C), barely detectable (1, fractions D, E, M, N, O, Q, R, S, T and U), weak perception (2, fractions F and V), moderate perception of bitterness (3, fractions G, H, I, L and P), and strong perception (4, fraction Z) (Table S1). Fraction E showed an LC-MS profile similar to fraction D, fractions M, N, O, Q, R, S, T, and U showed profiles similar to fraction P, while fractions G and I showed profiles similar to fraction F; therefore, only representative fractions with different profiling characteristics are shown in Figure 1.
The accurate mass measurement (ppm ≤ 5) and the MS/MS experiments in negative ionization mode, together with the comparison with the data present in the literature and databases, such as KNApSAcK [19], allowed to identify 29 chemical constituents reported in Table 1. Analysis of the samples was performed also in positive ion mode, but the better answer from the instrument was in negative ion mode. For this reason, the study was carried out using the negative polarity. An identification level was assigned to each sample, referring to the usual four levels of identification in metabolomic analyses [20].
Compound 2 showed an ion [M − H]− at m/z 167.0346 corresponding to the molecular formula C8H8O4,. The compound was identified as a homogentisic acid, already reported in ST honey [8] and considered one of the marker compounds to evaluate the botanical origin of this honey along with c,t-ABA (10) and t,t-ABA (14) [9]. Compounds 2, 10 and 14 were found to be present in fractions A, B, and C, the sweetest fractions. Compound 3 and compound 22 have already been reported in the literature [22]. In particular, compound 3 showed an ion [M − H]− at m/z 481.1310 corresponding to the molecular formula C22H26O12 and was identified as arbutin peracetate, a compound present in the leaves of A. unedo [22]. Compound 22 showed an ion [M − H]− at m/z 177.0917 corresponding to the molecular formula C11H14O2 and has been identified as tert-butylbenzoic acid [36]. Compounds 5, 13, and 24 have been reported in Algerian origin honey and have been identified as camphoric acid, di-tert-butyl-benzoquinone and di-tert-butyl-benzoquinone isomer, respectively [24]. Compounds 6, 8, 12–13, 15–21, 23–29 have already been reported to be present in different types of honey. Compound 6 showed an ion [M − H]− at m/z 301.1798 corresponding to the formula C19H26O3, and was identified as allethrin, an insecticide already found in other honeys [25]. Compounds 8, 28, and 29 are phenolic compounds and were identified, respectively, as sakuranin [27], chrysin [40], and kurarinone [41], and were found to be present in the more bitter fraction Z. Compound 12 was identified as 2-hydroxyisophorone already reported in the ST honey of Sardinia and mostly present in sweet fractions. Finally, Compound 15 showed an ion [M − H]− at m/z 239.0910 corresponding to the molecular formula C13H20O4. It was identified as unedone, a compound previously reported in strawberry tree honey [9] and more abundantly present in the bitter fraction Z. Thus, Compound 15 could be one of the metabolites particularly responsible for the bitter taste, along with Compounds 8 and 29. Interestingly, no arbutin was detected in any of the ST fractions.
2.2. Untargeted Metabolomic Analysis of Strawberry Tree Honey Fractions
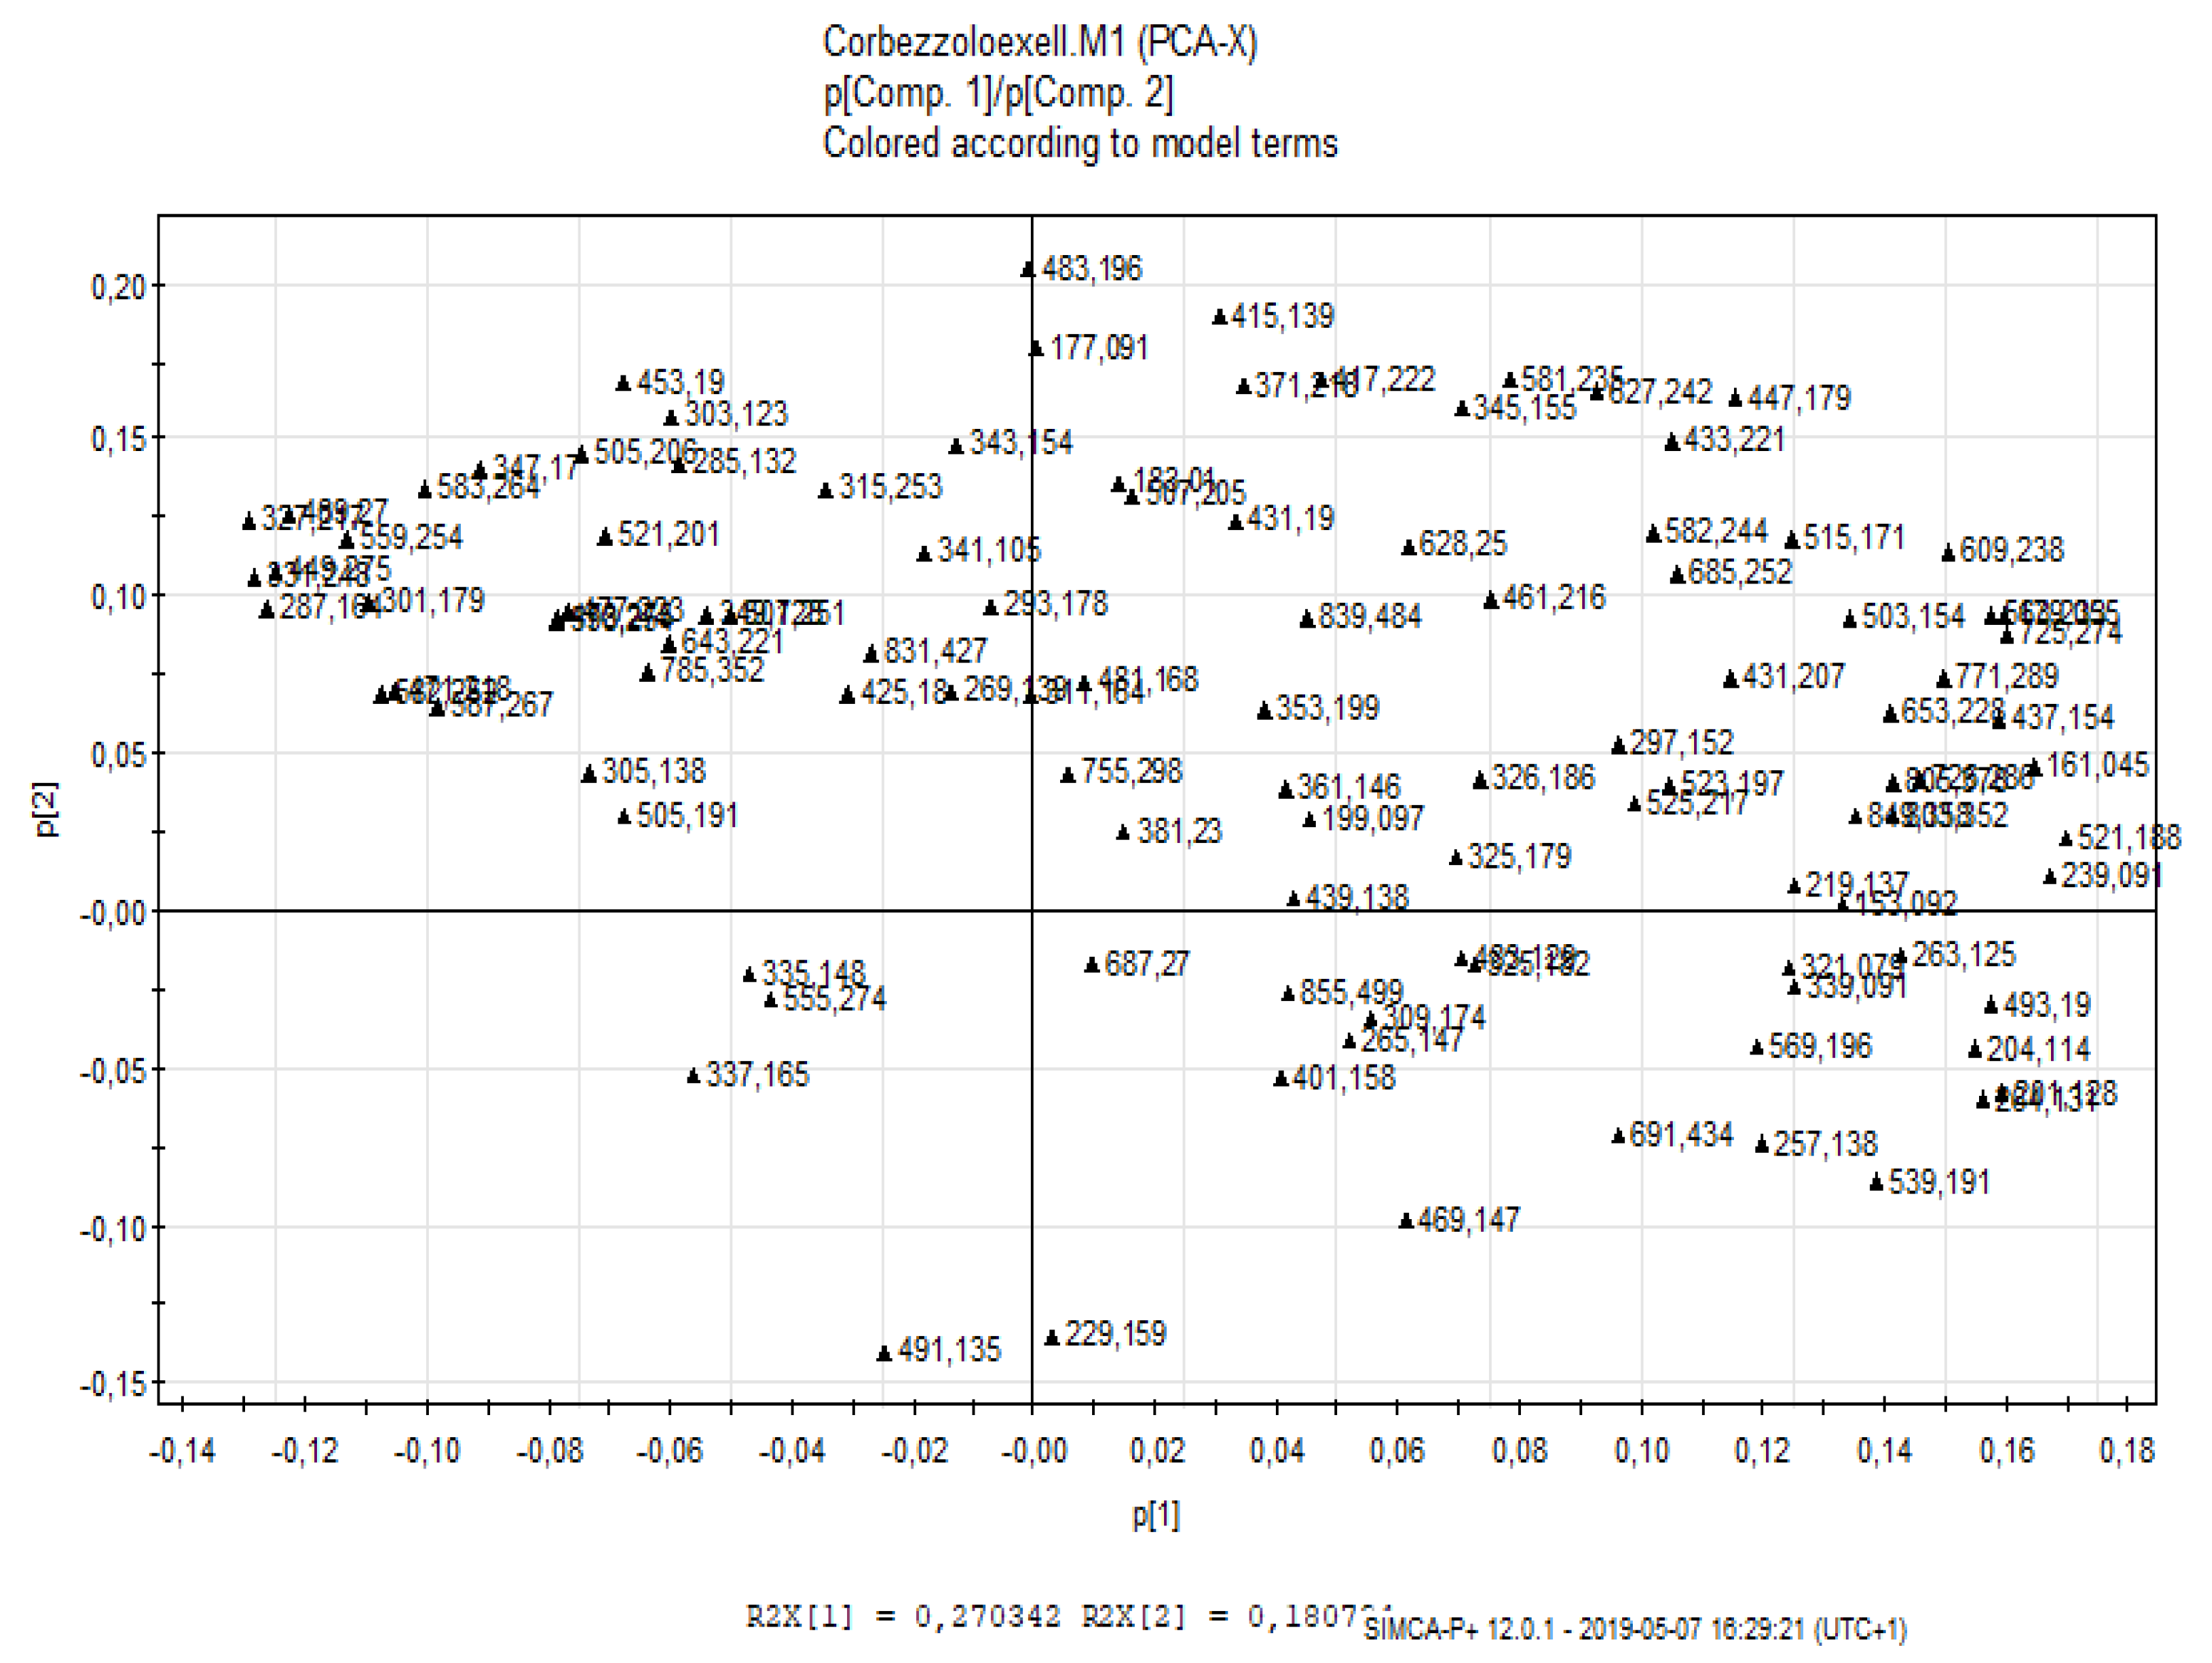
For the untargeted approach, the LC-ESI/LTQ-Orbitrap-MS chromatograms were pre-treated using the free software Mzmine [42], to compensate for changes in retention time and m/z ratio values between the chromatograms. The pre-treated chromatograms were exported as a data matrix, with the rows relative to the individual samples and the columns relative to the integrated and normalised peak areas obtained through LC-ESI/LTQ-Orbitrap-MS. The numerical values attributed to the variables were pre-treated through logarithmic transformation. Data transformation is intended to remove unwanted systematic behaviour. The exploratory analysis of the samples in terms of similarity or differences was performed using the PCA projection method. The score scatter plot obtained from PCA is shown in Figure 2. The graph shows good discrimination between the sweet fractions coloured in red at the bottom of the plot and the more bitter fractions located in the upper part of the plot. Therefore, it is the second principal component that has a more pronounced influence on the spatial distribution of the samples in the score scatter plot. PCA remains an unsupervised technique, which, therefore, cannot have predictive value and can only provide us preliminary information on the biochemical markers underlying the classification, by reading the corresponding loading scatter plot (Figure 3), in which the variables corresponding to the m/z values are shown. In particular, variables that contribute most to the differentiation of the samples in the score scatter plot and to their location in a specific area of the space can be highlighted.
To classify the samples and to understand which metabolites were most responsible for the bitter taste, the data were statistically processed through another projection technique, the partial least square (PLS) analysis. When the system under consideration is described by a data table and one or more single variable (Y) and the question is what relationship exists between the data block and the single variable (Y), the multivariate technique that is applied is the projection to latent structures by PLS. Therefore, the PLS projection aims to find linear relationships and then to build a plot of the variables that can explain this linear relationship. The model built from the data matrix obtained from the variables, and subsequently transformed and scaled (X), correlated with the Y relative to the perception of bitter taste, was then validated as suggested by Schievano et al. [43] and Stocchero [44], through the analysis of Q2, whose value was higher than 0.5, and through the permutation test, a test through which it is possible to evaluate the randomness and the presence of overfitting in the model.
As regards the fractions of ST honey, in the space built between t1 and t2 the samples (observations) seem to line up according to a linear relationship that sees in the positions at the top right of the plot the fractions capable of giving the most decisive sensation of bitter taste, and in the lower left the fractions capable of giving the most decisive sensation of sweet taste. The linear relationship can be seen in the score scatter plot (Figure 4). From the analysis of the loading scatter plots (Figure 5), in addition to the construction of a w*c plot, it is possible to evaluate the effect of the variables of the X block on the Y response and, in the specific case, determine the values of m/z observed in the chemical profiling that cause the fractions to have more or less pronounced Y responses (perception of the bitter taste).
From this analysis, the variables found in the loading plot area closest to the Y variable are those that have the highest positive coefficient in the model. From the observation of the LSP, it seems that the influence of t,t-ABA, c,t-ABA, and homogentisic acid, described as floral markers of ST honey [9], is decidedly significant, being positioned in the central part of the plot and at a fair distance from the variable Y. Other compounds appear to be relevant in the upper right quadrant of the loading scatter plot, namely unedone (m/z 239.0910), sakuranin (m/z 447.1277), and kurarinone (m/z 437.1952).
2.3. Quantitative Analysis of Isoprenoid Compounds by HPLC-DAD
(HR) LC-ESI/LTQ-Orbitrap-MS analyses allowed the identification of the four typical ST honey floral markers (homogentisic acid, c,t-ABA, t,t-ABA, and unedone), and thus quantitative HPLC-DAD analysis was used to evaluate whether their variability in the different fractions was connected with the perception of the bitter taste. Homogentisic acid was excluded from this evaluation because it was known that the compound does not have a bitter taste [8]. Table 2 shows the average content of the single isoprenoid compounds (± standard deviation) in the different fractions and expressed as mg of the active ingredient in 1 g of dry fraction. As shown in Table 2, the floral markers c,t-ABA and t,t-ABA are mainly found in the fractions characterised by a less bitter taste, while unedone has been separated mainly in the Z fraction, which was that represented by a more intense sensation of bitterness (Figure S1).
Unedone, an epoxidised derivative of abscisic acid, seems to play a significant role in the bitter taste of ST honey, being positioned in the upper right quadrant of the loading scatter plot. For this reason, a commercial standard of unedone was submitted to sensory analysis. Interestingly, unedone was found to be bitter, and a 300 mg/L solution of unedone gave a level of bitter sensation similar to 10 mg/L quinine. Similarly, c,t-ABA and t,t-ABA were submitted to sensory analysis, but no bitter taste was detected for up to 1000 mg/L solutions. Pydi et al. [45] investigated several abscisic acid (ABA) precursors and metabolites on the T2R4 receptor. It was observed that the structure deeply affects the bitter taste perception. For instance, ABA acts as an antagonist for T2R4, while xanthoxin is an agonist. Interestingly, both unedone and xanthoxin present an epoxide structure. Thus, it can be speculated that unedone acts as an agonist on T2R4 receptor.
In addition to unedone, two other compounds of a flavonoid nature present in very low quantities in ST honey fraction Z were also worthy of interest, namely sakuranin and kurarinone. Indeed, several compounds of flavonoid nature show the property of inducing the perception of bitterness [11]; thus, sakuranin and kurarinone are presumed to be potential sensory biomarkers. Sakuranin is a flavanone, a glucosylated derivative of sakuranetin. Unfortunately, no pure standard of sakuranin was found from suppliers of chemicals, so it was not possible to evaluate its involvement in the bitter perception. However, sakuranetin, the aglycone of sakuranin, was submitted to sensory analysis and no bitter taste was detected for this compound up to 1000 mg/L solutions. Sakuranin, like other flavanones, shows inhibitory activity against acetylcholinesterases [46], enzymes involved in the typical neurodegeneration of Alzheimer’s disease. Finally, a pure standard of kurarinone was submitted to sensory analysis and no bitter taste was detected for up to 1000 mg/L solutions also for this flavonoid. Kurarinone has shown good anti-tumour activity against non-small cell lung cancer (NSCLC). The activity has been demonstrated both in vitro and in vivo and appears to be related to the induction of apoptosis in A549 cells [47]. Another property attributed to kurarinone is its antifibrotic activity in the treatment of hepatitis B [48].
To conclude, unedone can be considered responsible for the bitter taste of A. unedo honey due to its constant and abundant presence already reported in ST honey (30–50 mg/kg) [9,49], although other natural compounds can modulate its bitter perception in this unifloral honey.
This developed approach can be useful for future studies on other honey samples to detect specific markers and for food quality control.
3. Materials and Methods
3.1. Chemicals
All the used chemicals were of analytical grade. Standard of homogentistic, acid (±)-2-cis, 4-trans-abscisic acid, kurarinone, sakuranetin, and quinine sulphate were purchased from Sigma–Aldrich (Milan, Italy). (±)-2-trans, 4-trans-abscisic acid was purchased from A.G. Scientific, Inc (San Diego, CA, USA). Unedone was purchased from Chem Faces Biochemical Co., Ltd. (Wuhan, China). Methanol, acetonitrile, phosphoric acid 85% w/w, and absolute ethanol were obtained from Sigma–Aldrich (Milan, Italy). Acetonitrile, water, and formic acid of LC-MS grade were purchased from Merck (Darmstadt, Germany). Ultrapure water (18 MΩ cm) was obtained with Milli-Q Advantage A10 System apparatus (Millipore, Milan, Italy).
3.2. Strawberry Tree Honey and Preparation of the Hydrophilic Fractions
Strawberry tree (ST) honey was produced in Sardinia (Italy) in 2018. Unifloral origin was verified by melissopalinological analysis, sensorial evaluation, and LC-DAD evaluation of the typical markers (homogentisic acid, unedone and the two isomers of abscisic acid) [9].
Hydrophilic fractions (HF) of the honey were prepared by dissolving 500 g of the honey in 500 mL of water acidified at pH 4.5 with HCl. The solution was poured on a chromatographic column filled with C18 resin (Sigma–Aldrich) previously activated with ethanol and equilibrated with water. The column charged with honey was washed with water and all the eluted solutions were discharged because no bitter taste was perceived. Elution of the fractions was obtained with increasing quantities of ethanol (H2O: EtOH in the ratios 95:5, 90:10, 80:20, 70:30, 50:50, 0:100 v/v). In total, 21 fraction were obtained and bitterness was evaluated by testing the solution after ethanol removal by Rotavapor®.
3.3. Sensory Analysis
A pre-trained sensory panel (5 judges) was used to determine the taste of both the fractions from the ST honey and pure compounds. Panellists provided written consent prior to participating indicating that they were not allergic to ST honey (included its main known compounds) or quinine. For establishing the level of perceptions of bitterness or sweetness, solutions of quinine and sucrose were prepared in water at six concentrations in the range 5 to 500 mg/L for quinine and 2 to 200 g/L for sucrose. Recognition threshold was performed according to testing samples in rank order (ISO 8587:2006) and was fixed at 5 mg quinine /L for bitterness and at 5 g sucrose /L for sweetness. For the sensory evaluation of the fractions from the ST honey, a scoring scale graded on a 5-point scale of bitterness perception was used: (0) no bitter taste; (1) barely detectable; (2) weak; (3) moderate; and (4) strong. Both (5)-point scale of bitterness perception and unedone level of bitterness (prepared at 300 mg/L in water) were established by comparison with the six concentrations of quinine. The samples were equilibrated to room temperature (20 °C ± 1) and the analysis was done during daylight. 1 mL of standard solution at proper concentration was applied to the upper surface of the tongue for 15 s then the test solution was expectorated.
3.4. LC-MS/MS Analysis
The electrospray ionisation (ESI) source of a Thermo Scientific LTQ-Orbitrap XL (Thermo Fisher Scientific, Dreieich, Germany) mass spectrometer was tuned in negative ion mode with a standard solution of kaempferol-3-O-glucoside (l µg/mL) introduced at a flow rate of 10 µL/min by a syringe pump. Calibration of the Orbitrap analyser was performed using the standard LTQ calibration mixture composed of caffeine and the peptide MRFA (calibration solution purchased from the manufacturer), dissolved in 50: 50% v/v water/acetonitrile solution.
Resolution for the Orbitrap mass analyser was set at 30,000. The mass spectrometric spectra were acquired by full range acquisition covering m/z 120–1400 in LC-MS. The study of the fragmentations was carried out using the data dependent scan experiment mode, by which the most intense [M-H] ions were selected during the LC-MS analysis. The data recorded were processed with Xcalibur 2.0 software (Thermo Fisher Scientific, Dreieich, Germany).
LC/ESI/LIT Orbitrap MS was performed using a Thermo Scientific liquid chromatography system consisting of a quaternary Accela 600 pump and an Accela autosampler, connected to a hybrid linear ion trap (IT) Orbitrap mass spectrometer (Thermo Scientific). LC-ESI-Orbitrap-MS analyses were performed using a Phenomenex Luna (150 mm × 2.1 mm particle size 5 µm) column, eluted with water containing 0.1% formic acid (solvent A) and acetonitrile containing 0.1% formic acid (solvent B). A linear gradient program at a flow rate of 0.200 mL/min was used: 0–35 min, from 5 to 95% (B); then back to 5% (B) for another 5 min. Honey fractions were dissolved in water with a concentration of 1 mg/mL and 5 µL of each samples was injected. The ESI source and MS parameters were the same as those used by D’Urso et al. [50]: capillary voltage: −48 V; tube lens voltage: −176.47 V; capillary temperature: 280 °C; sheath and auxiliary gas flow (N2), 15 and 5; sweep gas: 0; spray voltage: 5.
3.5. Quantitative Analysis by HPLC-DAD
Quantitative analysis of the strawberry tree honey markers was carried out by a modified HPLC-UV method from Tuberoso et al. [2,9] using an Agilent 1260 Infinity system (Agilent Technologies, Palo Alto, CA, USA), equipped with a binary pump (G-1312C), and a DAD detector (G-4212B). The mobile phase consisted of solvent A (H2O + 0.1% formic acid) and solvent B (CH3CN + 0.1% formic acid), while the stationary phase was constituted by a Luna C 18 (150 × 2 mm, 5 µm) column (Phenomenex). The wavelength was set at 262 nm (Figure S1). The gradient started from 5% of B ending at 100% of B in 20 min, at a flow rate of 0.2 mL/min. The injection volume was 10 µL. An interval of 15 min was used to allow the column to equilibrate before injection of the next samples. Calibration curves were built with the external standard method, correlating the area of the peaks vs. the concentration. The commercial standard of (±)-2-cis, 4-trans-abscisic acid was used in different concentrations (0.1, 0.25, 0.50, 0.75, 1 mg/mL) to construct the calibration curve (y = 12,984x + 9664 R² = 0.991). The established method was validated in agreement with the International Conference on Harmonisation of Technical Requirements for Registration of Pharmaceuticals for Human Use (ICH) guidance note which describes validation of analytical methods [51]. Both the precision under conditions of repeatability and intermediate precisions were determined by performing either six injections of standard on the same day or six injections of the same standard on different days, respectively. The limit of detection (LOD) and limit of quantification (LOQ) were calculated on the basis of the data of the regression of the analytical curve and corresponding value are reported in Table 2. The c,t-ABA calibration curve was used to dose t,t-ABA and unedone as well.
3.6. Multivariate Data Analysis
For the untargeted approach, the chromatograms resulting from the LC-ESI/Orbitrap-MS analysis (negative ion mode) were normalised and aligned using MZmine software [42]. Thanks to the use of this toolbox with normalization of the total raw signal, 253 peaks were detected. After exporting the processed data in tabular format (.cvs file), a further statistical analysis of the data matrix was performed with SIMCA P + software 12.0 (Umetrix AB, Umeå, Sweden) using the PCA method. PCA was performed by applying the area of the peak obtained from LC-MS analysis [52,53] and the data were scaled through the application of Pareto scaling. After PCA, PLS was also applied with the SIMCA P + software. PLS is a regression technique used to relate two sets of data. The Y used for the statistical model was the perception of bitterness returned by the different fractions subjected to sensory analysis. Models were validated by cross-validation techniques and permutation tests such as Hotelling’s permutation test and the T2 test according to standardised good practice to minimise false discoveries and to obtain robust statistical models. The significance was evaluated by measuring the value of Q2, which was higher than 0.5.
4. Conclusions
The chemometric model obtained by preliminary PCA of LC-ESI/LTQ-Orbitrap-MS data, followed by a PLS regression model was found to be a selective tool to detect the compounds responsible for the perception of bitterness in ST honey. The study allowed unedone to be identified as the main chemical compound responsible for the bitter taste of strawberry tree honey. Taking into account that unedone was characterised for the first time as a new natural product in strawberry tree honey, it is a novelty for further studies on the action on the bitter taste receptor. Further studies on the 25 human T2Rs bitter taste receptors should be developed to better define the action of unedone. Moreover, investigation of the complex matrix of the ST honey could be interesting due to the presence of the bitter compound unedone, an antagonist for the T2R4 receptor (ABA) and sweets compounds (sugars). Finally, 29 chemical compounds were identified and putatively identified in ST honey, using LC-ESI/LTQ-Orbitrap-MS and LC-ESI/LTQ-Orbitrap-MS/MS, and some of them for the first time in this honey.
Supplementary Materials
The following are available online, Table S1. Sensory analysis results (5 judges, mean ± sd) of the bitter perception in the 21 fractions obtained from the fractioning of strawberry tree honey on C18 column. Figure S1. LC-DAD representative chromatograms at λ = 262 nm of fraction B, fraction Z, and pure strawberry tree honey (dilution 1:100 in water w/v). t,t-ABA: (±)-2-trans, 4-trans-abscisic acid; c,t-ABA: (±)-2-cis, 4-trans-abscisic acid; U: unedone; HGA: homogentisic acid. Chromatographic conditions are described in the text.
Author Contributions
Conceptualization, P.M. and C.I.G.T.; methodology, P.M. and C.I.G.T.; software, P.M. and G.D.; formal analysis, P.M., G.D., and C.I.G.T.; investigation, P.M., G.D., and C.I.G.T.; resources, P.M. and C.I.G.T.; data curation, P.M., G.D., A.K., and C.I.G.T.; writing—original draft preparation, P.M. and C.I.G.T.; writing—review and editing, C.I.G.T., A.K., and P.M.; visualization, P.M. and C.I.G.T.; supervision, P.M., A.K., and C.I.G.T.; project administration, P.M. and C.I.G.T. All authors have read and agreed to the published version of the manuscript.
Funding
This research received no external funding.
Institutional Review Board Statement
Ethical review and approval were waived for this study, due to the use of food-grade products used in small amount.
Informed Consent Statement
Informed consent was obtained from all subjects involved in the study.
Data Availability Statement
The data presented in this study are available in article and supplementary material.
Conflicts of Interest
The authors declare no conflict of interest.
Sample Availability
Honey sample used for this study is available for limited time from the authors.
References
- Rosa, A.; Tuberoso, C.I.G.; Atzeri, A.; Melis, M.P.; Bifulco, E.; Dessì, M.A. Antioxidant profile of strawberry tree honey and its marker homogentisic acid in several models of oxidative stress. Food Chem. 2011, 129, 1045–1053. [Google Scholar] [CrossRef]
- Tuberoso, C.I.G.; Boban, M.; Bifulco, E.; Budimir, D.; Pirisi, F.M. Antioxidant capacity and vasodilatory properties of Mediterranean food: The case of Cannonau wine, myrtle berries liqueur and strawberry-tree honey. Food Chem. 2013, 140, 686–691. [Google Scholar] [CrossRef] [PubMed]
- Afrin, S.; Forbes-Hernandez, T.Y.; Gasparrini, M.; Bompadre, S.; Quiles, J.L.; Sanna, G.; Spano, N.; Giampieri, F.; Battino, M. Strawberry-tree honey induces growth inhibition of human colon cancer cells and increases ROS generation: A comparison with Manuka honey. Int. J. Mol. Sci. 2017, 18, 613. [Google Scholar] [CrossRef] [Green Version]
- Ośes, S.M.; Nieto, S.; Rodrigo, S.; Pérez, S.; Rojo, S.; Sancho, M.T.; Fernández-Muiño, M.Á. Authentication of strawberry tree (Arbutus unedo L.) honeys from southern Europe based on compositional parameters and biological activities. Food Biosci. 2020, 38, 100768. [Google Scholar] [CrossRef]
- Di Petrillo, A.; Santos-Buelga, C.; Era, B.; González-Paramás, A.M.; Tuberoso, C.; Medda, R.; Pintus, F.; Fais, A. Sardinian honeys as sources of xanthine oxidase and tyrosinase inhibitors. Food Sci. Biotechnol. 2018, 27, 139–146. [Google Scholar] [CrossRef] [PubMed]
- Jurič, A.; Gašić, U.; Brčić Karačonji, I.; Jurica, K.; Milojković-Opsenica, D. The phenolic profile of strawberry tree (Arbutus unedo L.) honey. J. Serb. Chem. Soc. 2020, 85, 1011–1019. [Google Scholar] [CrossRef] [Green Version]
- Miguel, M.G.; Faleiro, M.L.; Guerreiro, A.C.; Antunes, M.D. Arbutus unedo L.: Chemical and biological properties. Molecules 2014, 19, 15799–15823. [Google Scholar] [CrossRef] [Green Version]
- Cabras, P.; Angioni, A.; Tuberoso, C.; Floris, I.; Reniero, F.; Ghelli, S. Homogentisic acid: A phenolic acid as a marker of strawberry-tree (Arbutus unedo) honey. Food Chem. 1999, 47, 4064–4067. [Google Scholar] [CrossRef]
- Tuberoso, C.I.G.; Bifulco, E.; Caboni, P.; Cottiglia, F.; Cabras, P.; Floris, I. Floral markers of strawberry tree (Arbutus unedo L.) honey. J. Agric. Food Chem. 2010, 58, 384–389. [Google Scholar] [CrossRef] [PubMed]
- Fierro, F.; Giorgetti, A.; Carloni, P.; Meyerhof, W.; Alfonso-Prieto, M. Dual binding mode of “bitter sugars” to their human bitter taste receptor target. Sci. Rep. 2019, 9, 8437. [Google Scholar] [CrossRef] [Green Version]
- Izawa, K.; Amino, Y.; Kohmura, M.; Ueda, Y.; Kuroda, M. 4.16—Human–Environment Interactions—Taste. In Comprehensive Natural Products II, 1st ed.; Liu, H.-W., Mander, L., Eds.; Elsevier: Amsterdam, The Netherlands, 2010; Volume 4, pp. 631–671. ISBN 9780080453828. [Google Scholar] [CrossRef]
- Meyerhof, W.; Batram, C.; Kuhn, C.; Brockhoff, A.; Chudoba, E.; Bufe, B.; Appendino, G.; Behrens, M. The molecular receptive ranges of human TAS2R bitter taste receptors. Chem. Senses 2010, 35, 157–170. [Google Scholar] [CrossRef]
- Valdés, A.; Cifuentes, A.; León, C. Foodomics evaluation of bioactive compounds in foods. Trends Anal. Chem. 2017, 96, 2–13. [Google Scholar] [CrossRef]
- Cerulli, A.; Masullo, M.; Montoro, P.; Hosek, J.; Pizza, C.; Piacente, S. Metabolite profiling of “green” extracts of Corylus avellana leaves by 1H NMR spectroscopy and multivariate statistical analysis. J. Pharm. Biomed. Anal. 2018, 160, 168–178. [Google Scholar] [CrossRef]
- La Barbera, G.; Capriotti, A.L.; Cavaliere, C.; Montone, C.M.; Piovesana, S.; Samperi, R.; Zenezini Chiozzi, R.; Laganà, A. Liquid chromatography-high resolution mass spectrometry for the analysis of phytochemicals in vegetal-derived food and beverages. Food Res. Int. 2017, 100, 28–52. [Google Scholar] [CrossRef]
- D’Urso, G.; d’Aquino, L.; Pizza, C.; Montoro, P. Integrated mass spectrometric and multivariate data analysis approaches for the discrimination of organic and conventional strawberry (Fragaria ananassa Duch.) crops. Food Res. Int. 2015, 77, 264–272. [Google Scholar] [CrossRef]
- Pascale, R.; Bianco, G.; Cataldi, T.R.I.; Schmitt Kopplin, P.; Bosco, F.; Vignola, L.; Uhl, J.; Lucio, M.; Milella, L. Mass spectrometry-based phytochemical screening for hypoglycemic activity of Fagioli di Sarconi beans (Phaseolus vulgaris L.). Food Chem. 2018, 242, 497–504. [Google Scholar] [CrossRef] [Green Version]
- D′Urso, G.; Montoro, P.; Piacente, S. Detection and comparison of phenolic compounds in different extracts of black currant leaves by liquid chromatography coupled with High-Resolution ESI-LTQ-Orbitrap MS and High-Sensitivity ESI-QTrap MS. J. Pharm. Biomed. Anal. 2020, 179, 112926. [Google Scholar] [CrossRef]
- KNApSAcK Core System. Available online: http://www.knapsackfamily.com/knapsack_core/top.php (accessed on 11 December 2020).
- Sumner, L.W.; Amberg, A.; Barrett, D.; Beale, M.H.; Beger, R.; Daykin, C.A.; Fan, T.W.; Fiehn, O.; Goodacre, R.; Griffin, J.L.; et al. Proposed minimum reporting standards for chemical analysis—Chemical Analysis Working Group (CAWG) Metabolomics Standards Initiative (MSI). Metabolomics 2007, 3, 211–221. [Google Scholar] [CrossRef] [PubMed] [Green Version]
- Pimpao, R.C.; Dew, T.; Figueira, M.E.; McDougall, G.J.; Stewart, D.; Ferreira, R.B.; Santos, C.N.; Williamson, G. Urinary metabolite profiling identifies novel colonic metabolites and conjugates of phenolics in healthy volunteers. Mol. Nutr. Food Res. 2014, 58, 1414–1425. [Google Scholar] [CrossRef] [PubMed]
- Karikas, G.A.; Giannitsaros, A. Phenolic glucosides from leaves of Arbutus unedo. Plantes Med. Phytothe. 1990, 24, 27–30. [Google Scholar]
- Marmarinos, V.; Paschalakis, P. Photopolymerization Material for Gums Isolation. U.S. Patent 8,334,328, 18 December 2012. Available online: https://patentimages.storage.googleapis.com/77/fb/c3/c3cf3433898be2/CA2677468C.pdf (accessed on 11 December 2020).
- Ouchemoukh, S.; Amessis-Ouchemoukh, N.; Gomez-Romero, M.; Aboud, F.; Giuseppe, A.; Fernandez-Gutierrez, A.; Segura-Carretero, A. Characterisation of phenolic compounds in Algerian honeys by RP-HPLC coupled to electrospray time-of-flight mass spectrometry. LWT—Food Sci. Technol. 2017, 85 Pt B, 460–469. [Google Scholar] [CrossRef]
- Long, E.Y.; Krupke, C.H. Non-cultivated plants present a season-long route of pesticide exposure for honey bees. Nat. Commun. 2016, 7, 11629. [Google Scholar] [CrossRef]
- Wilkins, A.L.; Lu, Y.; Tan, S.T. Extractives from New Zealand honeys. 4. Linalool derivatives and other components from nodding thistle (Carduus nutans) honey. J. Agric. Food Chem. 1993, 41, 873–878. [Google Scholar] [CrossRef]
- Kaskoniene, V.; Maruska, A.; Kornysova, O.; Charczun, N.; Ligor, M.; Buszewski, B. Quantitative and qualitative determination of phenolic compounds in honey. Chem. Technol. 2009, 74–80. [Google Scholar]
- Rouphael, Y.; Bernardi, J.; Cardarelli, M.; Bernardo, L.; Kane, D.; Colla, G.; Lucini, L. Phenolic compounds and sesquiterpene lactones profile in leaves of nineteen artichoke cultivars. J. Agric. Food Chem. 2016, 64, 8540–8548. [Google Scholar] [CrossRef]
- Blunt, J.; Munro, M.G.; Swallow, W. Carbon-13 NMR analysis of tutin and related substances: Application to the identification of minor components of toxic honey. Aust. J. Chem. 1979, 32, 1339–1343. [Google Scholar] [CrossRef]
- Dalla Serra, A.; Franco, M.A.; Mattivi, F.; Ramponi, M.; Vacca, V.; Versini, G. Aroma characterization of Sardinian strawberry tree (Arbutus unedo L.) honey. Ital. J. Food Sci. 1999, 11, 47–56. [Google Scholar]
- Sun, M.; Zhao, L.; Wang, K.; Han, L.; Shan, J.; Wu, L.; Xue, X. Rapid identification of “mad honey” from Tripterygium wilfordii Hook. f. and Macleaya cordata (Willd) R. Br using UHPLC/Q-TOF-MS. Food Chem. 2019, 294, 67–72. [Google Scholar] [CrossRef]
- Ma, L.; Ashworth, D.; Yates, S.R. Simultaneous determination of estrogens and progestogens in honey using high performance liquid chromatography-tandem mass spectrometry. J. Pharm. Biomed. 2016, 131, 303–308. [Google Scholar] [CrossRef] [PubMed] [Green Version]
- Staub Spörri, A.; Jan, P.; Cognard, E.; Ortelli, D.; Edder, P. Comprehensive screening of veterinary drugs in honey by ultra-high-performance liquid chromatography coupled to mass spectrometry. Food Addit. Contam. A 2014, 31, 806–816. [Google Scholar] [CrossRef] [PubMed]
- Bentivenga, G.; D’Auria, M.; Fedeli, P.; Mauriello, G.; Racioppi, R. SPME-GC-MS analysis of volatile organic compounds in honey from Basilicata. Evidence for the presence of pollutants from anthropogenic activities. Int. J. Food Sci. 2004, 39, 1079–1086. [Google Scholar] [CrossRef]
- Cešen, M.; Lambropoulou, D.; Laimou-Geraniou, M.; Kosjek, T.; Blaznik, U.; Heath, D.; Heath, E. Determination of bisphenols and related compounds in honey and their migration from selected food contact materials. J. Agric. Food Chem. 2016, 64, 8866–8875. [Google Scholar] [CrossRef] [PubMed]
- Rodríguez-Gonzalo, E.; Domínguez-Alvarez, J.; García-Gómez, D.; García-Jiménez, M.G.; Carabias-Martínez, R. Determination of endocrine disruptors in honey by CZE-MS using restricted access materials for matrix cleanup. Electrophoresis 2010, 31, 2279–2288. [Google Scholar] [CrossRef]
- Sosath, S.; Ott, H.H.; Hecker, E. Irritant principles of the spurge family (Euphorbiaceae). XIII. Oligocyclic and macrocyclic diterpene esters from latexes of some Euphorbia species utilized as source plants of honey. J. Nat. Prod. 1988, 51, 1062–1074. [Google Scholar] [CrossRef] [PubMed]
- Duke, C.C.; Tran, V.H.; Duke, R.K.; Abu-Mellal, A.; Plunkett, G.T.; King, D.I.; Hamid, K.; Wilson, K.L.; Barrett, R.L.; Bruhl, J.J. A sedge plant as the source of Kangaroo Island propolis rich in prenylated p-coumarate ester and stilbenes. Phytochemistry 2017, 134, 87–97. [Google Scholar] [CrossRef] [Green Version]
- Leyva-Jimenez, F.J.; Lozano-Sanchez, J.; Borras-Linares, I.; Cadiz-Gurrea, M.d.l.L.; Mahmoodi-Khaledi, E. Potential antimicrobial activity of honey phenolic compounds against Gram positive and Gram negative bacteria. LWT—Food Sci. Technol. 2019, 101, 236–245. [Google Scholar] [CrossRef]
- Seraglio, S.K.T.; Valese, A.C.; Daguer, H.; Bergamo, G.; Azevedo, M.S.; Gonzaga, L.V.; Fett, R.; Costa, A.C.O. Development and validation of a LC-ESI-MS/MS method for the determination of phenolic compounds in honeydew honeys with the diluted-and-shoot approach. Food Res. Int. 2016, 87, 60–67. [Google Scholar] [CrossRef]
- Liu, P.; Deng, T.; Ye, C.; Qin, Z.; Hou, X.; Wang, J. Identification of kurarinone by LC/MS and investigation of its thermal stability. J. Chil. Chem. Soc. 2009, 54, 80–82. [Google Scholar] [CrossRef]
- MZmine 2. Available online: http://mzmine.github.io/ (accessed on 11 December 2020).
- Schievano, E.; Stocchero, M.; Morelato, E.; Facchin, C.; Mammi, S. An NMR-based metabolomic approach to identify the botanical origin of honey. Metabolomics 2012, 8, 679–690. [Google Scholar] [CrossRef]
- Stocchero, M. Relevant and irrelevant predictors in PLS2. J. Chemom. 2020, 34, e3237. [Google Scholar] [CrossRef]
- Pydi, S.P.; Jaggupilli, A.; Nelson, K.M.; Abrams, S.R.; Bhullar, R.P.; Loewen, M.C.; Chelikani, P. Abscisic acid acts as a blocker of the bitter taste G protein-coupled receptor T2R4. Biochemistry 2015, 28, 2622–2631. [Google Scholar] [CrossRef]
- Remya, C.; Dileep, K.V.; Tintu, I.; Variyar, E.J.; Sadasivan, C. Flavanone glycosides as acetylcholinesterase inhibitors: Computational and experimental evidence. Indian J. Pharm. Sci. 2014, 76, 567–570. [Google Scholar]
- Yang, J.; Chen, H.; Wang, Q.; Deng, S.; Huang, M.; Ma, X.; Song, P.; Du, J.; Huang, Y.; Wen, Y.; et al. Inhibitory effect of kurarinone on growth of human non-small cell lung cancer: An experimental study both in vitro and in vivo studies. Front. Pharm. 2018, 9, 252. [Google Scholar] [CrossRef] [PubMed]
- Huai, D. Anti-fibrotic effect of kurarinone in treatment of chronic hepatitis B. Xiandai Zhenduan Yu Zhiliao 2014, 25, 4641–4642. [Google Scholar]
- Deiana, V.; Tuberoso, C.; Satta, A.; Pinna, C.; Camarda, I.; Spano, N.; Ciulu, M.; Floris, I. Relationship between markers of botanical origin in nectar and honey of the strawberry tree (Arbutus unedo) throughout flowering periods in different years and in different geographical areas. J. Apic. Res. 2016, 54, 342–349. [Google Scholar] [CrossRef]
- D′Urso, G.; Maldini, M.; Pintore, G.; d′Aquino, L.; Montoro, P.; Pizza, C. Characterisation of Fragaria vesca fruit from Italy following a metabolomics approach through integrated mass spectrometry techniques. LWT—Food Sci. Technol. 2016, 74, 387–395. [Google Scholar] [CrossRef]
- EMEA. Quality Guidelines: Validation of Analytical Procedures: Text and Methodology (ICH Q2). Available online: http://www.emea.europa.eu/pdfs/human/ich/038195en.pdf (accessed on 11 December 2020).
- Mari, A.; Montoro, P.; Pizza, C.; Piacente, S. Liquid chromatography tandem mass spectrometry determination of chemical markers and principal component analysis of Vitex agnus-castus L. fruits (Verbenaceae) and derived food supplements. J. Pharm. Biomed. Anal 2012, 70, 224–230. [Google Scholar] [CrossRef]
- Soufi, S.; D′Urso, G.; Pizza, C.; Rezgui, S.; Bettaieb, T.; Montoro, P. Steviol glycosides targeted analysis in leaves of Stevia rebaudiana (Bertoni) from plants cultivated under chilling stress conditions. Food Chem. 2016, 190, 572–580. [Google Scholar] [CrossRef]
Figure 1.
LC-ESI-LTQ-Orbitrap-MS base peak profiles of ten representative strawberry tree honey fractions (A, B, C, D, F, H, L, P, V, Z). Base peak intensity was fixed at NL 7.02E6 for all the chromatograms.
Figure 1.
LC-ESI-LTQ-Orbitrap-MS base peak profiles of ten representative strawberry tree honey fractions (A, B, C, D, F, H, L, P, V, Z). Base peak intensity was fixed at NL 7.02E6 for all the chromatograms.


Figure 2.
Principal component analysis: score scatter plot obtained from the untargeted analysis of the A-Z fractions.
Figure 2.
Principal component analysis: score scatter plot obtained from the untargeted analysis of the A-Z fractions.

Figure 3.
Principal component analysis: loading scatter plot obtained from the untargeted analysis of the A–Z fractions.
Figure 3.
Principal component analysis: loading scatter plot obtained from the untargeted analysis of the A–Z fractions.

Figure 4.
Partial least square: score scatter plot. Untargeted analysis of A–Z fractions.

Figure 5.
Partial least squares: loading scatter plot. Untargeted analysis of A–Z fractions.


Table 1.
Chemical compounds identified in fractions of strawberry-tree honey by LC-ESI/LTQ-Orbitrap-MS and LC-ESI/LTQ-Orbitrap-MS/MS.
Table 1.
Chemical compounds identified in fractions of strawberry-tree honey by LC-ESI/LTQ-Orbitrap-MS and LC-ESI/LTQ-Orbitrap-MS/MS.
| N° | Rt | [M − H] | Molecular Formula | ppm | Identification | MS/MS | Fraction | L.I. | Reference |
|---|---|---|---|---|---|---|---|---|---|
| 1 | 3.97 | 329.0868 | C14H18O9 | 0.4 | glucopiranosyl vanillic acid | 167 | A | 2 | [21] |
| 2 | 6.38 | 167.0346 | C8H8O4 | 4.3 | homogenistic acid | 123 | A | 1 | [8] |
| 3 | 6.86 | 481.1310 | C22H26O12 | 4.9 | arbutin peracetate | 271 | A | 2 | [22] |
| 4 | 10.27 | 285.1333 | C14H22O6 | 0.1 | methacrylic acid, diester with triethylene glycol | - | L | 3 | [23] |
| 5 | 11.34 | 199.0972 | C10H16O4 | 3.7 | camphoric acid | 155 | B, Z | 2 | [24] |
| 6 | 13.76 | 301.1798 | C19H26O3 | −0.03 | allethrin | 133 | V | 2 | [25] |
| 7 | 13.85 | 275.1280 | C16H20O4 | 0.9 | propenoic acid, dimethoxyphenyl-methyl-butenyl ester | 71 | D | 3 | [26] |
| 8 | 14.32 | 447.1277 | C22H24O10 | −1.4 | sakuranin | 285 | Z | 2 | [27] |
| 9 | 14.62 | 303.1228 | C17H20O5 | 0.8 | (±)-oleocanthal isomer | 137/119 | F | 3 | [28] |
| 10 | 14.71 | 263.1278 | C15H20O4 | 0.9 | (±)-2-cis, 4-trans-abscisicacid (c,t-ABA) | 219/204/153 | A/B/C | 1 | [9] |
| 11 | 15.05 | 335.1126 | C17H20O7 | 0.3 | tutin, 6-acetate | 293 | Z | 3 | [29] |
| 12 | 15.40 | 153.0922 | C9H14O2 | 4.8 | 2-hydroxyisophorone | 135 | A/B/C/D | 2 | [30] |
| 13 | 15.44 | 219.1385 | C14H20O2 | 2.7 | di-tert-butyl-benzoquinone | 107 | L | 2 | [24] |
| 14 | 15.78 | 263.1281 | C15H20O4 | 1 | (±)-2-trans, 4-trans-abscisic acid (t,t-ABA) | 219/204/153 | A/B/C/D/E/F/H | 1 | [9] |
| 15 | 15.83 | 239.091 | C13H20O4 | 1.2 | unedone | 151/107 | Z | 2 | [9] |
| 16 | 15.83 | 359.1489 | C20H24O6 | 0.29 | triptolide | 340/329/311 | Z | 2 | [31] |
| 17 | 16.18 | 287.1642 | C18H24O3 | −0.2 | estriol | 171 | V | 2 | [32] |
| 18 | 16.39 | 415.2107 | C24H32O6 | −1.6 | desonide | 397 | L | 2 | [33] |
| 19 | 16.39 | 201.1280 | C14H18O | 3.5 | amylcinnamaldehyde | 183 | A | 2 | [34] |
| 20 | 16.39 | 219.1386 | C14H20O2 | 2.9 | di-tert-butyl-benzoquinone | 107 | A | 2 | [24] |
| 21 | 16.99 | 241.1225 | C16H18O2 | 0.9 | Bisphenol B | 211 | P | 2 | [35] |
| 22 | 17.04 | 177.0917 | C11H14O2 | 3.6 | 4-tert-butylbenzoic acid | 121 | V | 2 | [36] |
| 23 | 17.04 | 417.2269 | C24H34O6 | −0.9 | deoxyphorbol -isobutyrate | 347 | V | 2 | [37] |
| 24 | 19.11 | 219.1385 | C14H20O2 | 2.4 | di-tert-butyl-benzoquinone isomer | 107 | P | 2 | [24] |
| 25 | 19.11 | 415.2110 | C24H32O6 | −0.8 | desonide | 397/197 | P | 2 | [33] |
| 26 | 20.71 | 325.1438 | C20H22O4 | 0.8 | hydroxy-methyl-butenyl-oxyphenyl-ethenyl-methoxyphenol | 153 | Z | 2 | [38] |
| 27 | 21.61 | 287.2220 | C16H32O4 | 1.1 | dihydroxypalmitic acid | 147/121/109 | Z/V | 2 | [39] |
| 28 | 22.60 | 253.0497 | C15H10O4 | 0.8 | chrysin | 255/153 | Z | 2 | [40] |
| 29 | 22.60 | 437.1952 | C26H30O6 | −0.7 | kurarinone | 301 | Z | 2 | [41] |
L.I.: Level of identification.
Table 2.
Compounds quantified by HPLC-DAD at λ = 262 nm (mg/g, n = 3).
| Sample | Bitter Taste a | c,t-ABA | t,t-ABA b | Unedone b |
|---|---|---|---|---|
| A | 0 | 28.39 ± 1.59 | 12.36 ± 1.62 | nd |
| B | 0 | 46.14 ± 2.03 | 91.98 ± 2.05 | nd |
| C | 0 | 11.29 ± 1.05 | 25.02 ± 1.87 | nd |
| D | 1 | tr | 54.32 ± 2.60 | nd |
| E | 1 | nd | 29.61 ± 1.43 | nd |
| F | 2 | nd | 94.59 ± 1.55 | nd |
| H | 3 | nd | 21.40 ± 1.75 | tr |
| L | 3 | nd | tr | tr |
| Z | 4 | nd | nd | 7.10 ± 0.50 |
| LOD (mg/L) | 0.4 | 0.6 | 0.3 | |
| LOQ (mg/L) | 1.2 | 1.9 | 0.9 |
a Level of bitter perception: (0) no bitter taste; (1) barely detectable; (2) weak, (3) moderate (4) strong; b dosed with c,t-ABA calibration curve; nd: not detected (<LOD); traces (<LOQ).
Publisher’s Note: MDPI stays neutral with regard to jurisdictional claims in published maps and institutional affiliations. |
© 2021 by the authors. Licensee MDPI, Basel, Switzerland. This article is an open access article distributed under the terms and conditions of the Creative Commons Attribution (CC BY) license (https://creativecommons.org/licenses/by/4.0/).
Share and Cite
MDPI and ACS Style
Montoro, P.; D’Urso, G.; Kowalczyk, A.; Tuberoso, C.I.G. LC-ESI/LTQ-Orbitrap-MS Based Metabolomics in Evaluation of Bitter Taste of Arbutus unedo Honey. Molecules 2021, 26, 2765. https://doi.org/10.3390/molecules26092765
AMA Style
Montoro P, D’Urso G, Kowalczyk A, Tuberoso CIG. LC-ESI/LTQ-Orbitrap-MS Based Metabolomics in Evaluation of Bitter Taste of Arbutus unedo Honey. Molecules. 2021; 26(9):2765. https://doi.org/10.3390/molecules26092765
Chicago/Turabian StyleMontoro, Paola, Gilda D’Urso, Adam Kowalczyk, and Carlo Ignazio Giovanni Tuberoso. 2021. "LC-ESI/LTQ-Orbitrap-MS Based Metabolomics in Evaluation of Bitter Taste of Arbutus unedo Honey" Molecules 26, no. 9: 2765. https://doi.org/10.3390/molecules26092765