
Synthesis of Novel Diketopyrrolopyrrole-Rhodamine Conjugates and Their Ability for Sensing Cu2+ and Li+

 , , , and
Abstract
:
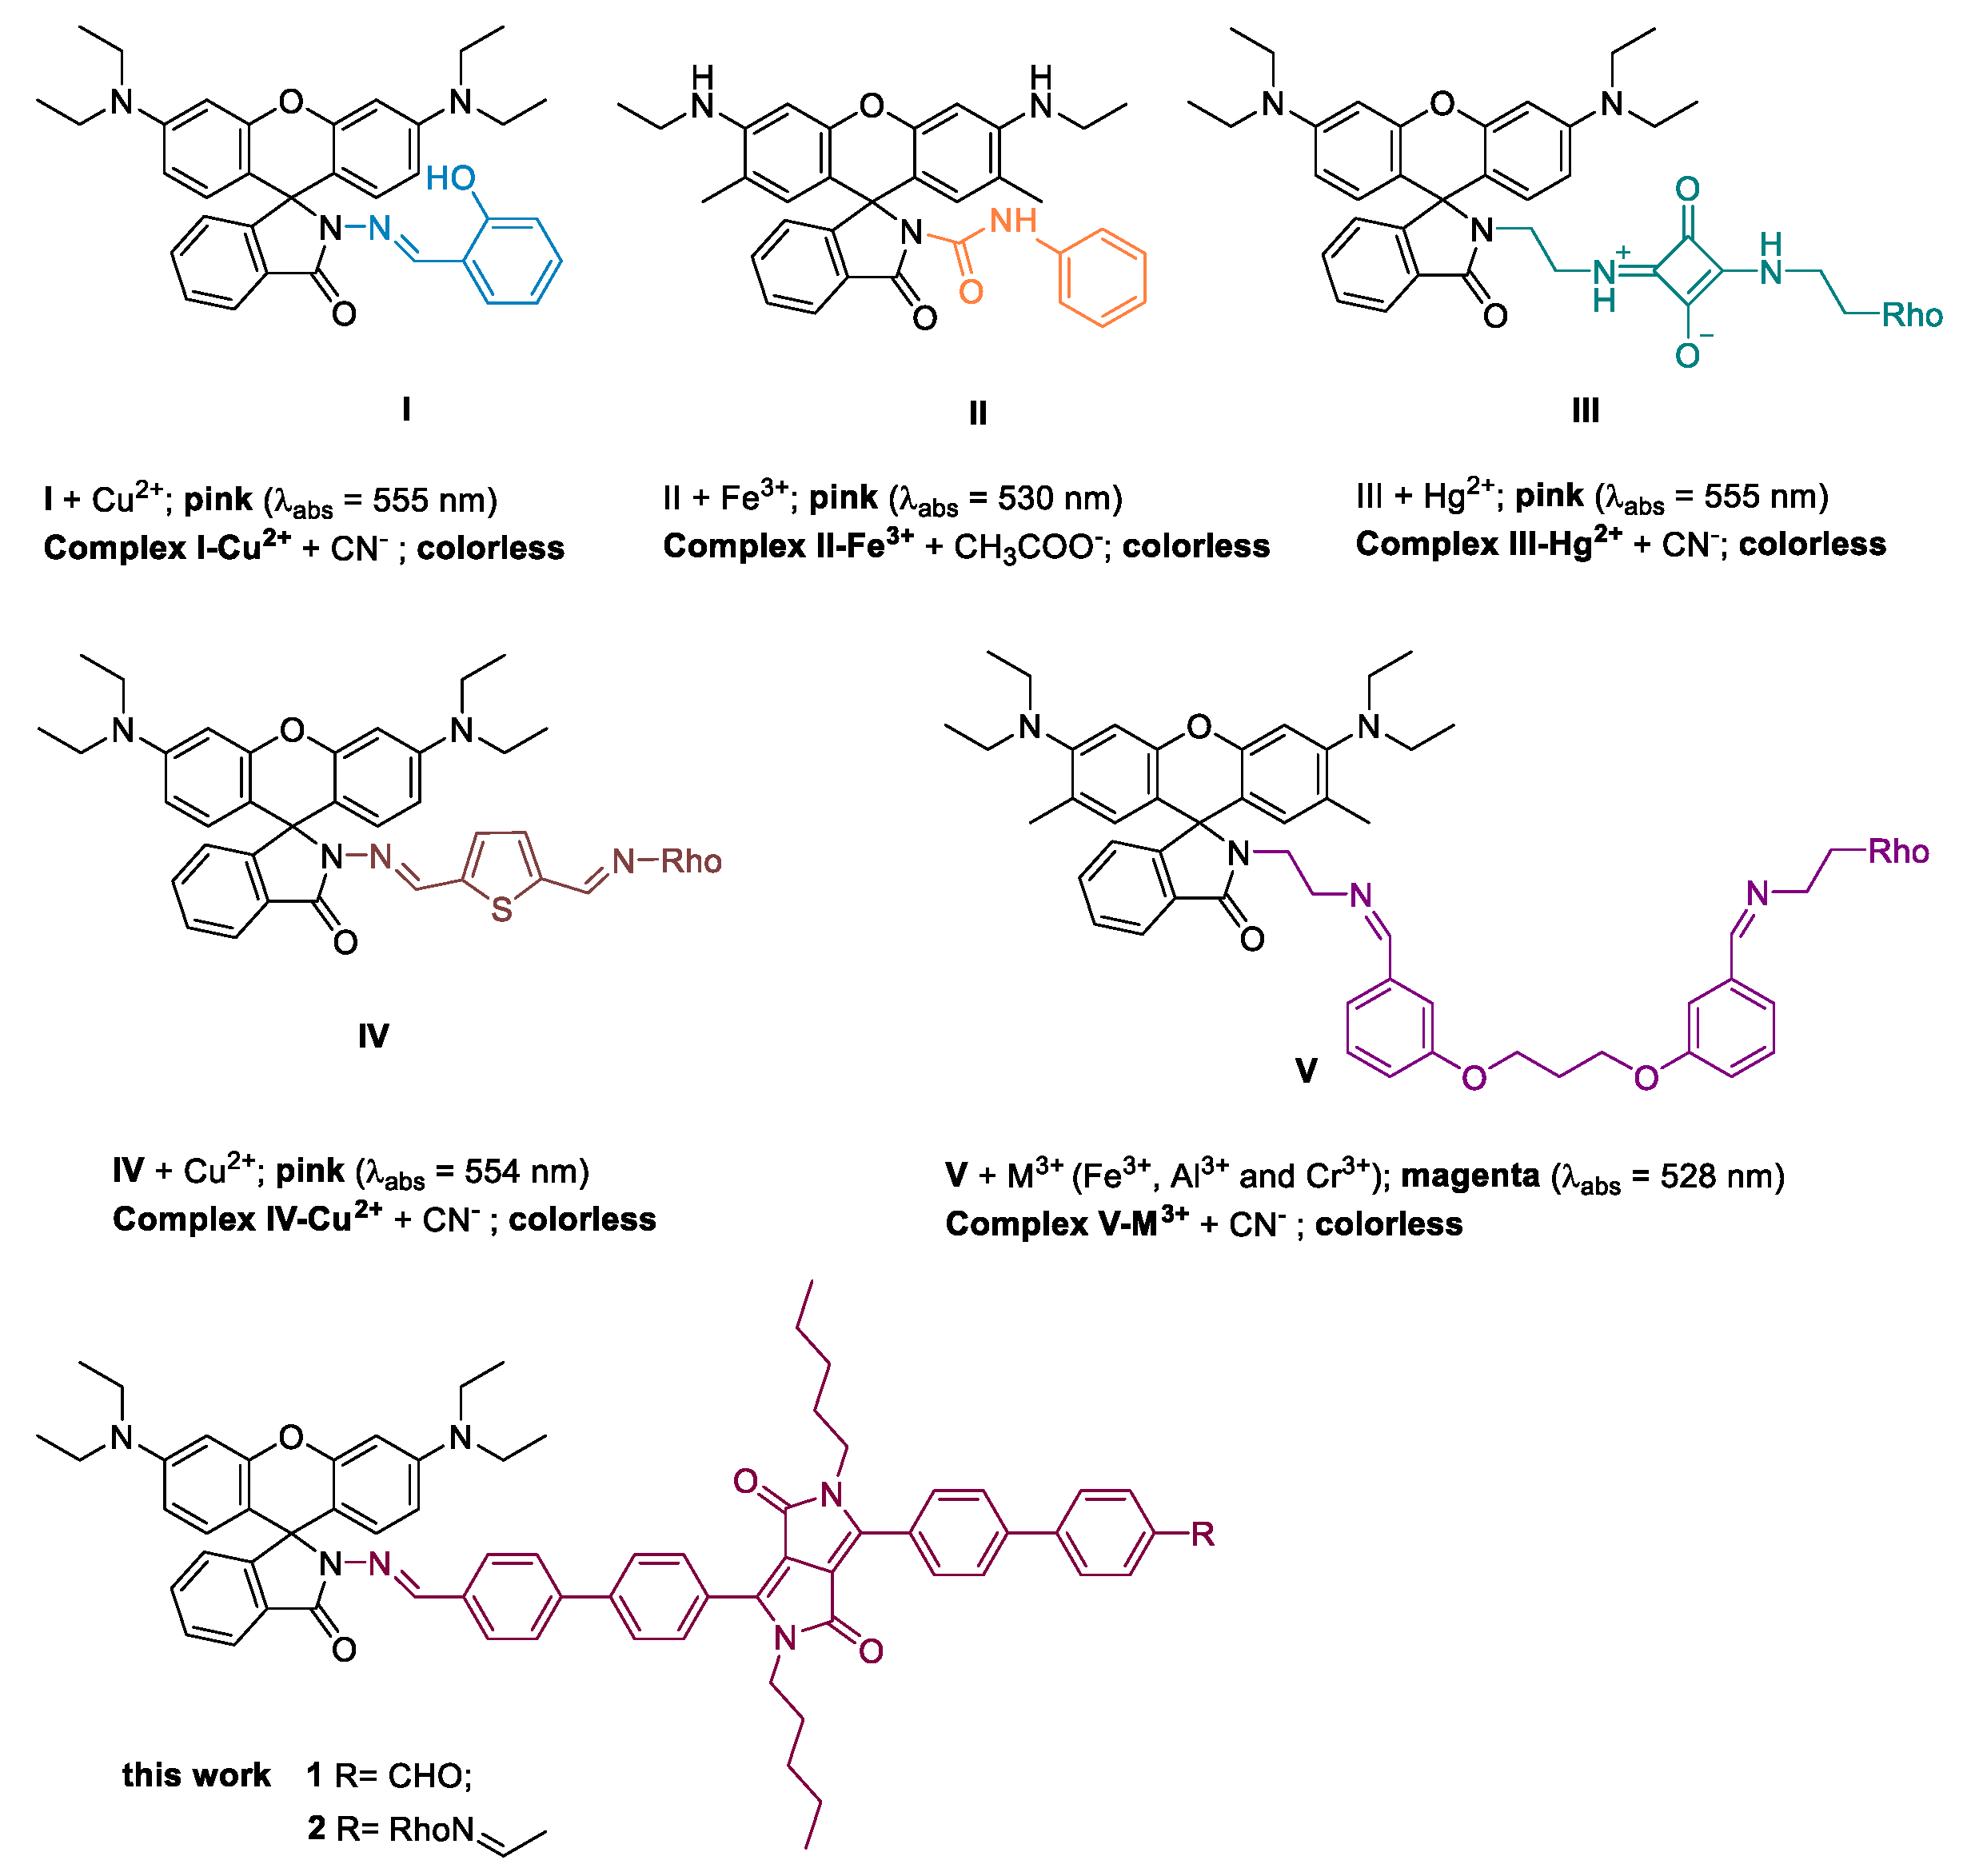
1. Introduction
2. Results and Discussion
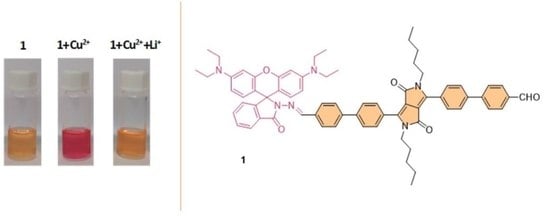
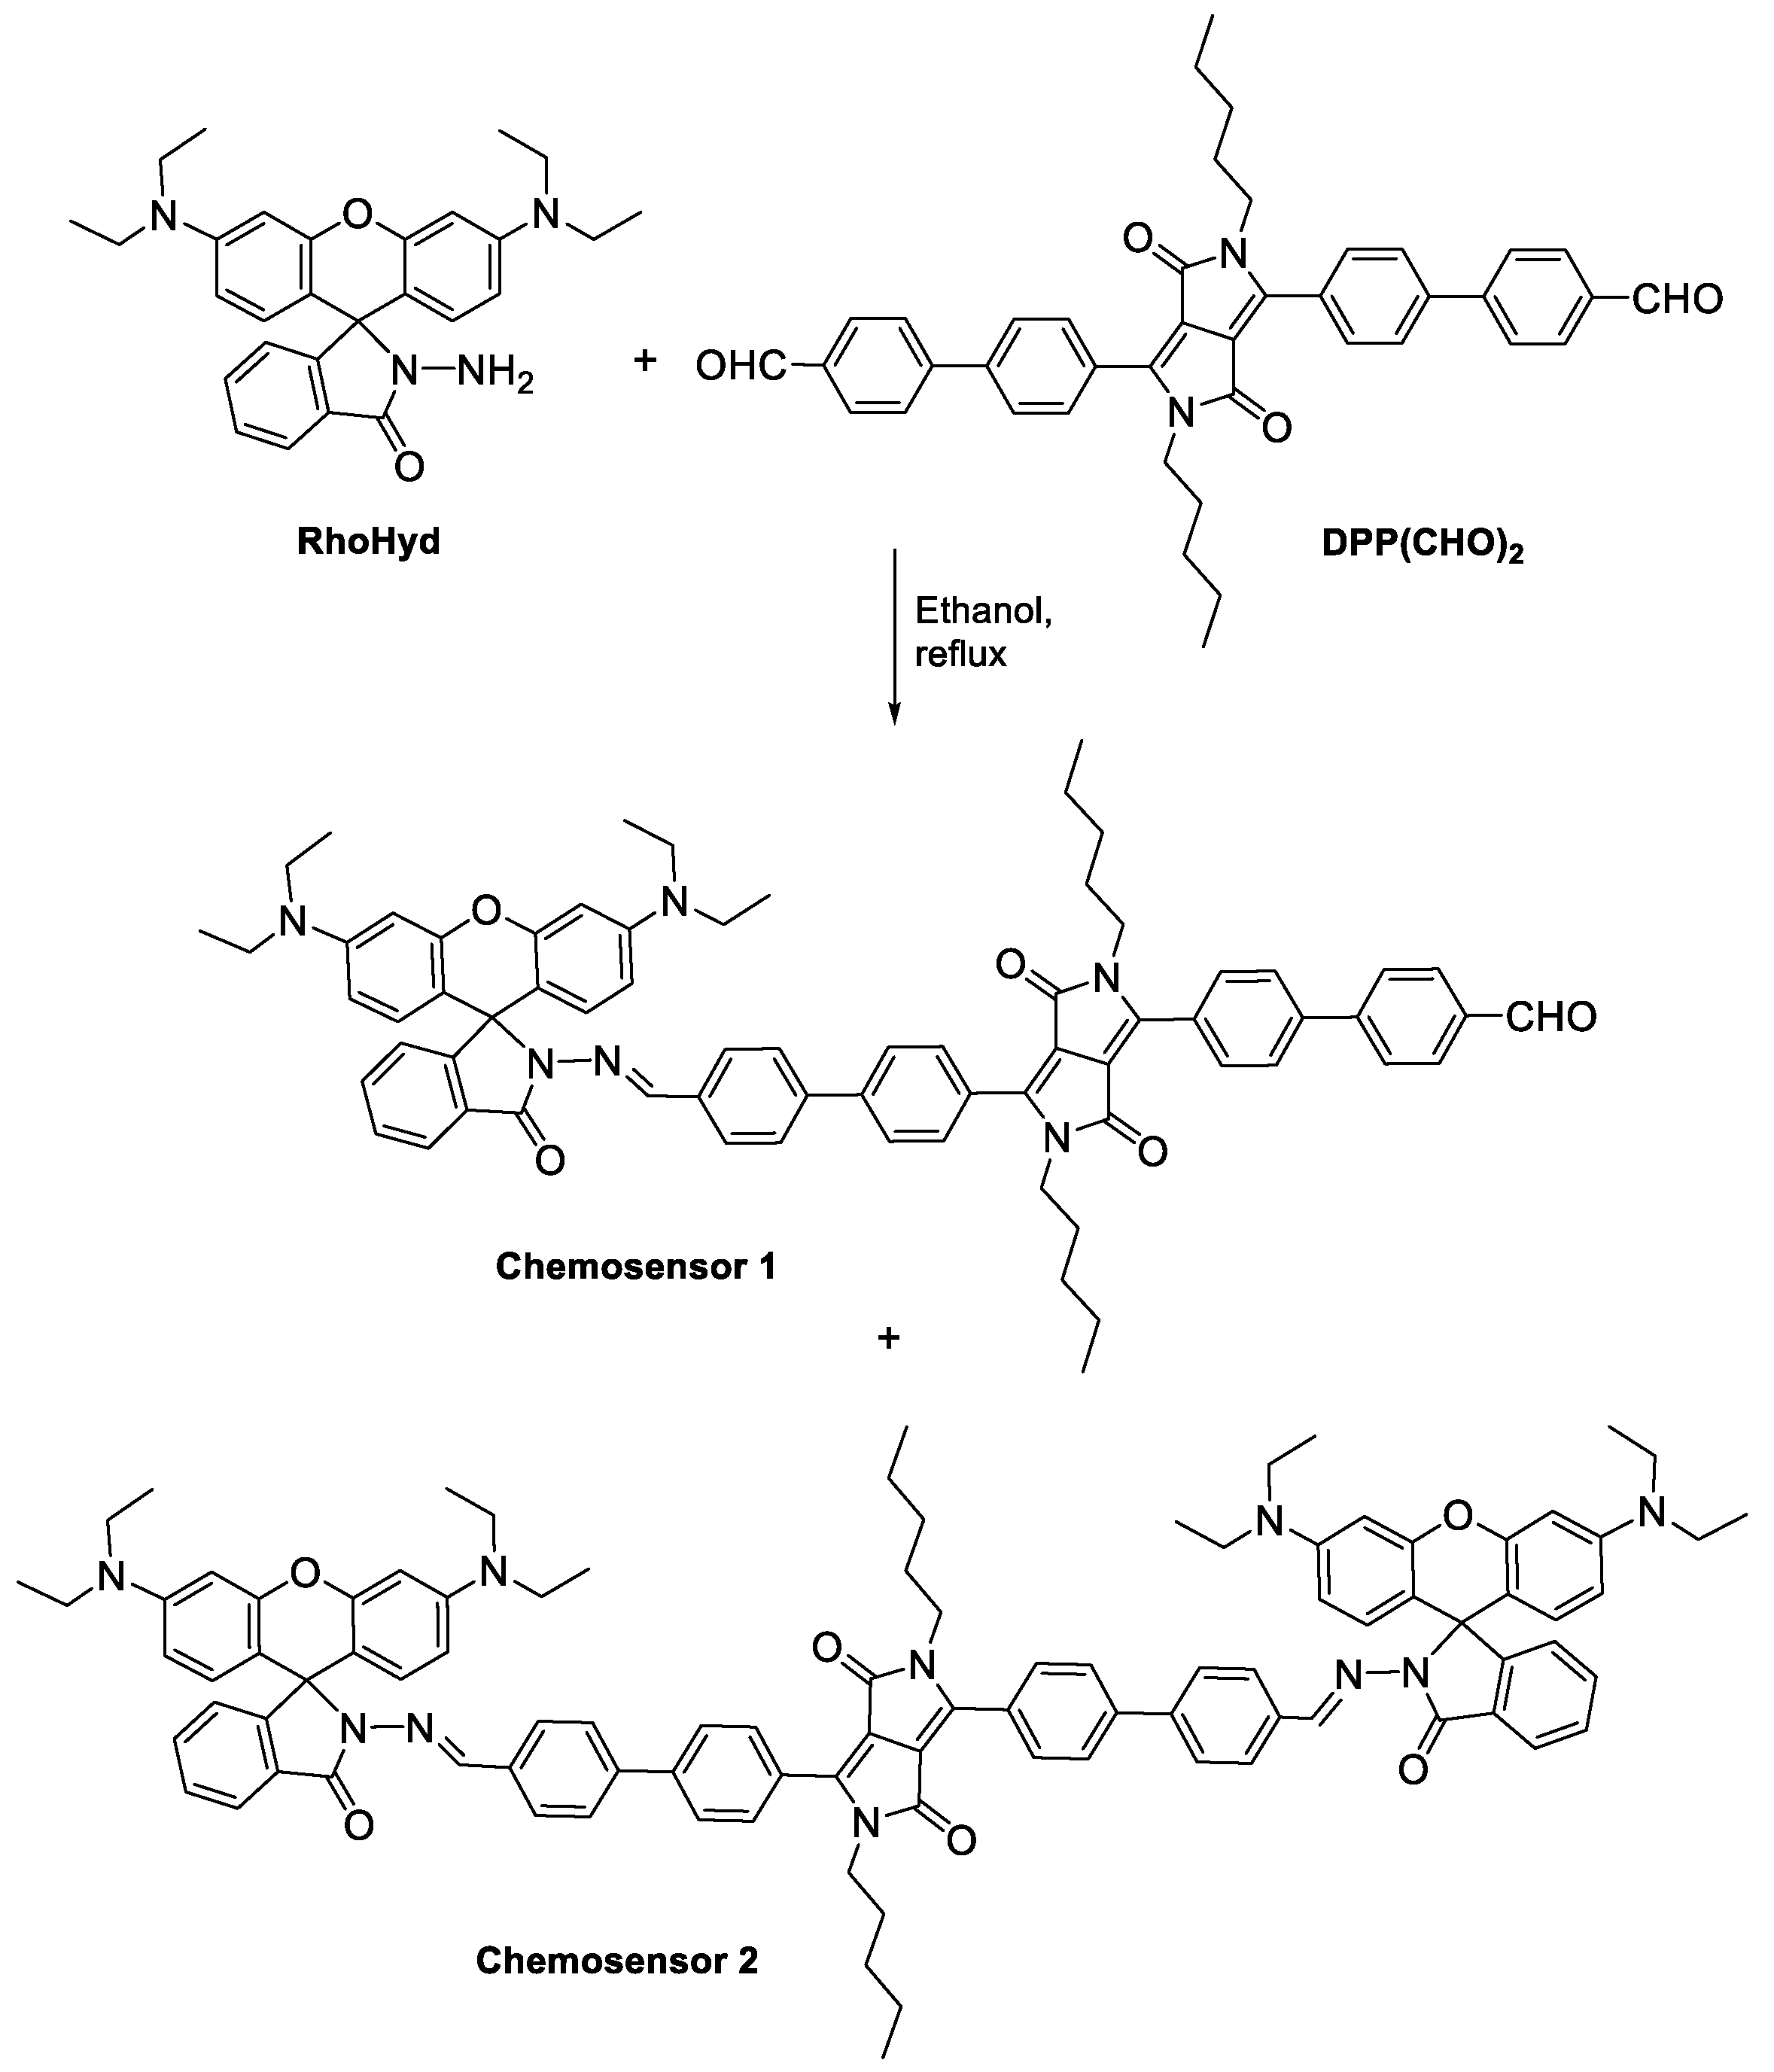
2.1. Synthesis
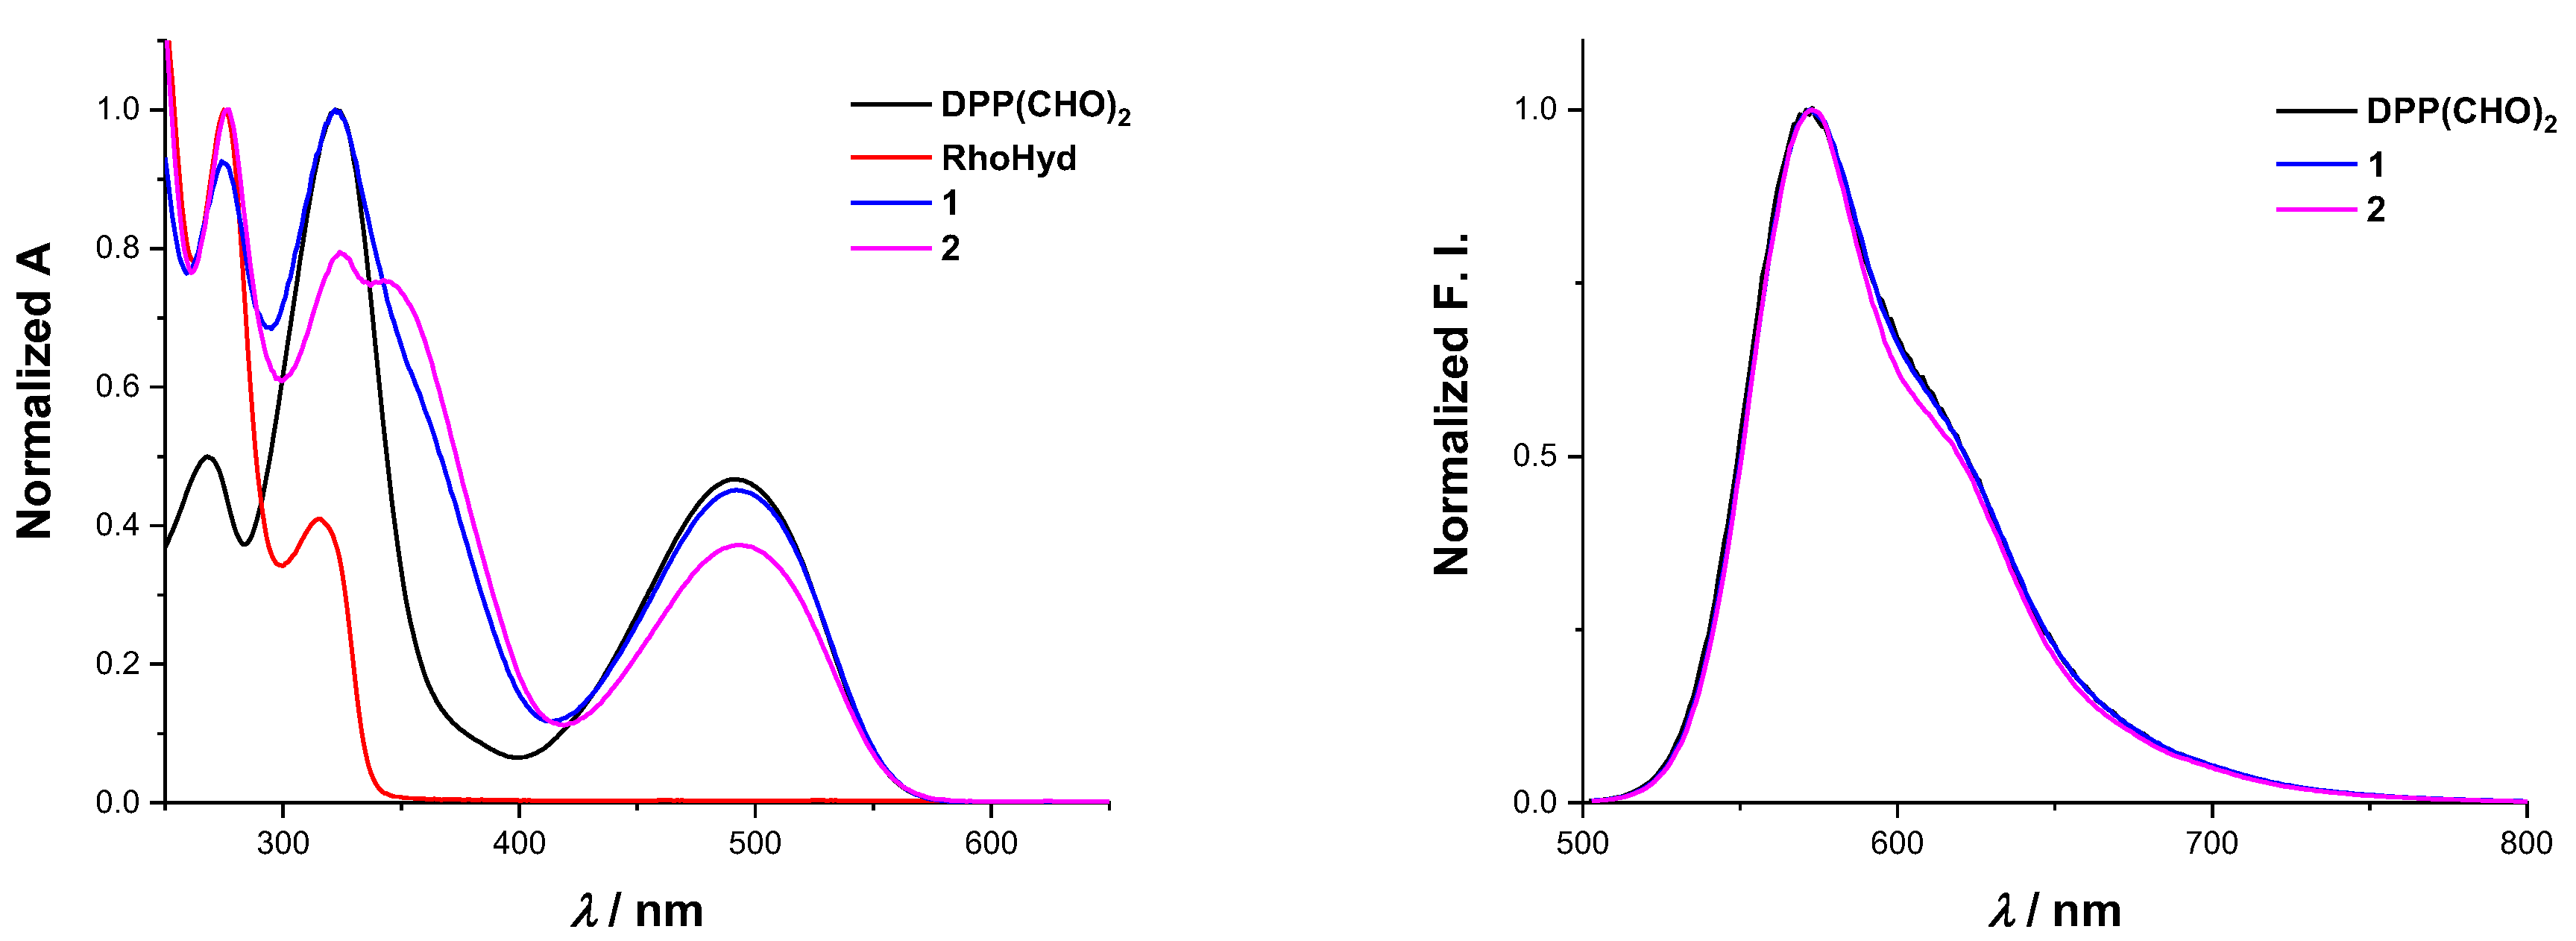
2.2. Absorption and Fluorescence Spectroscopy Measurements
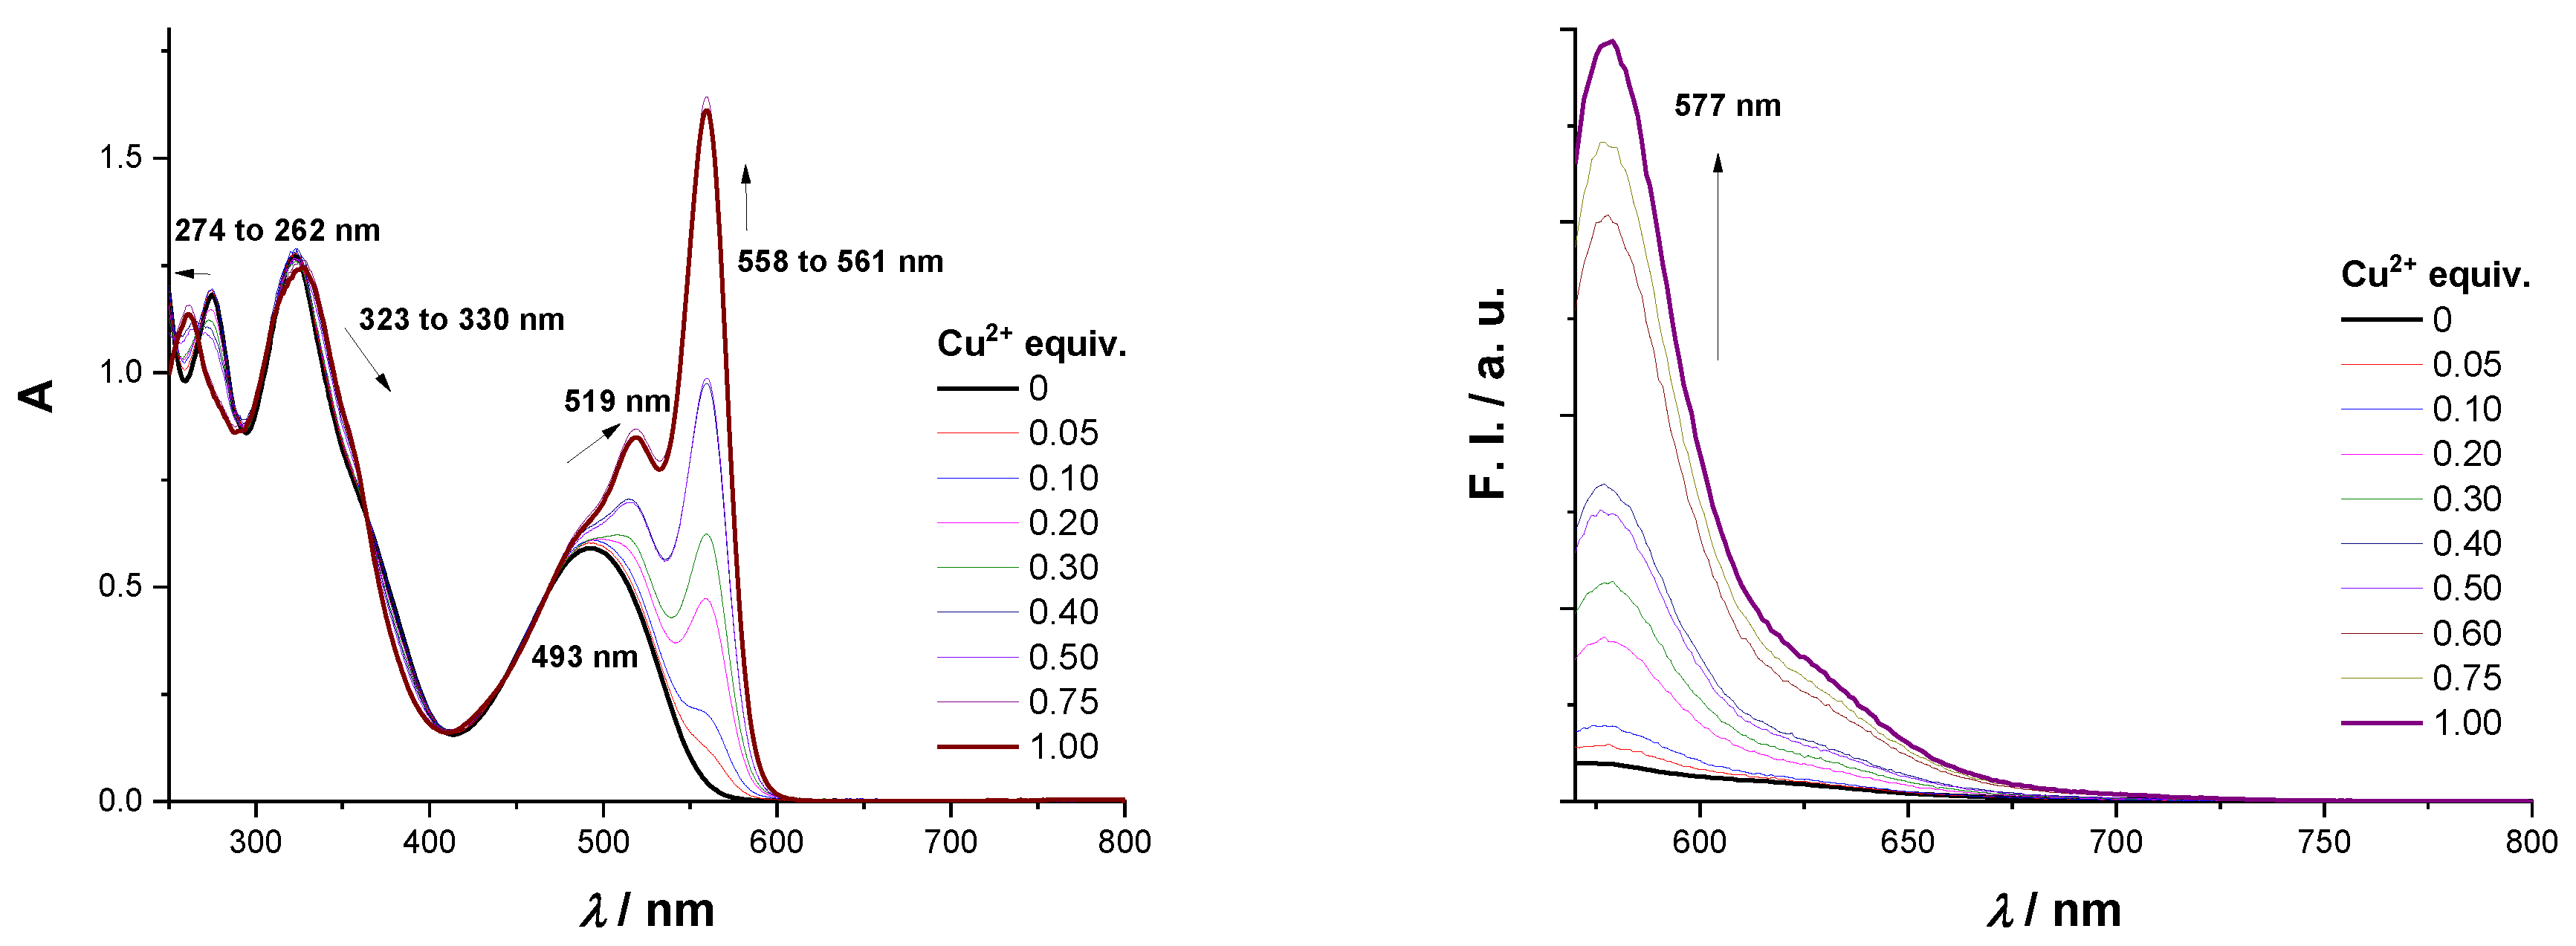
2.3. UV-Vis and Fluorescence: Solution Studies
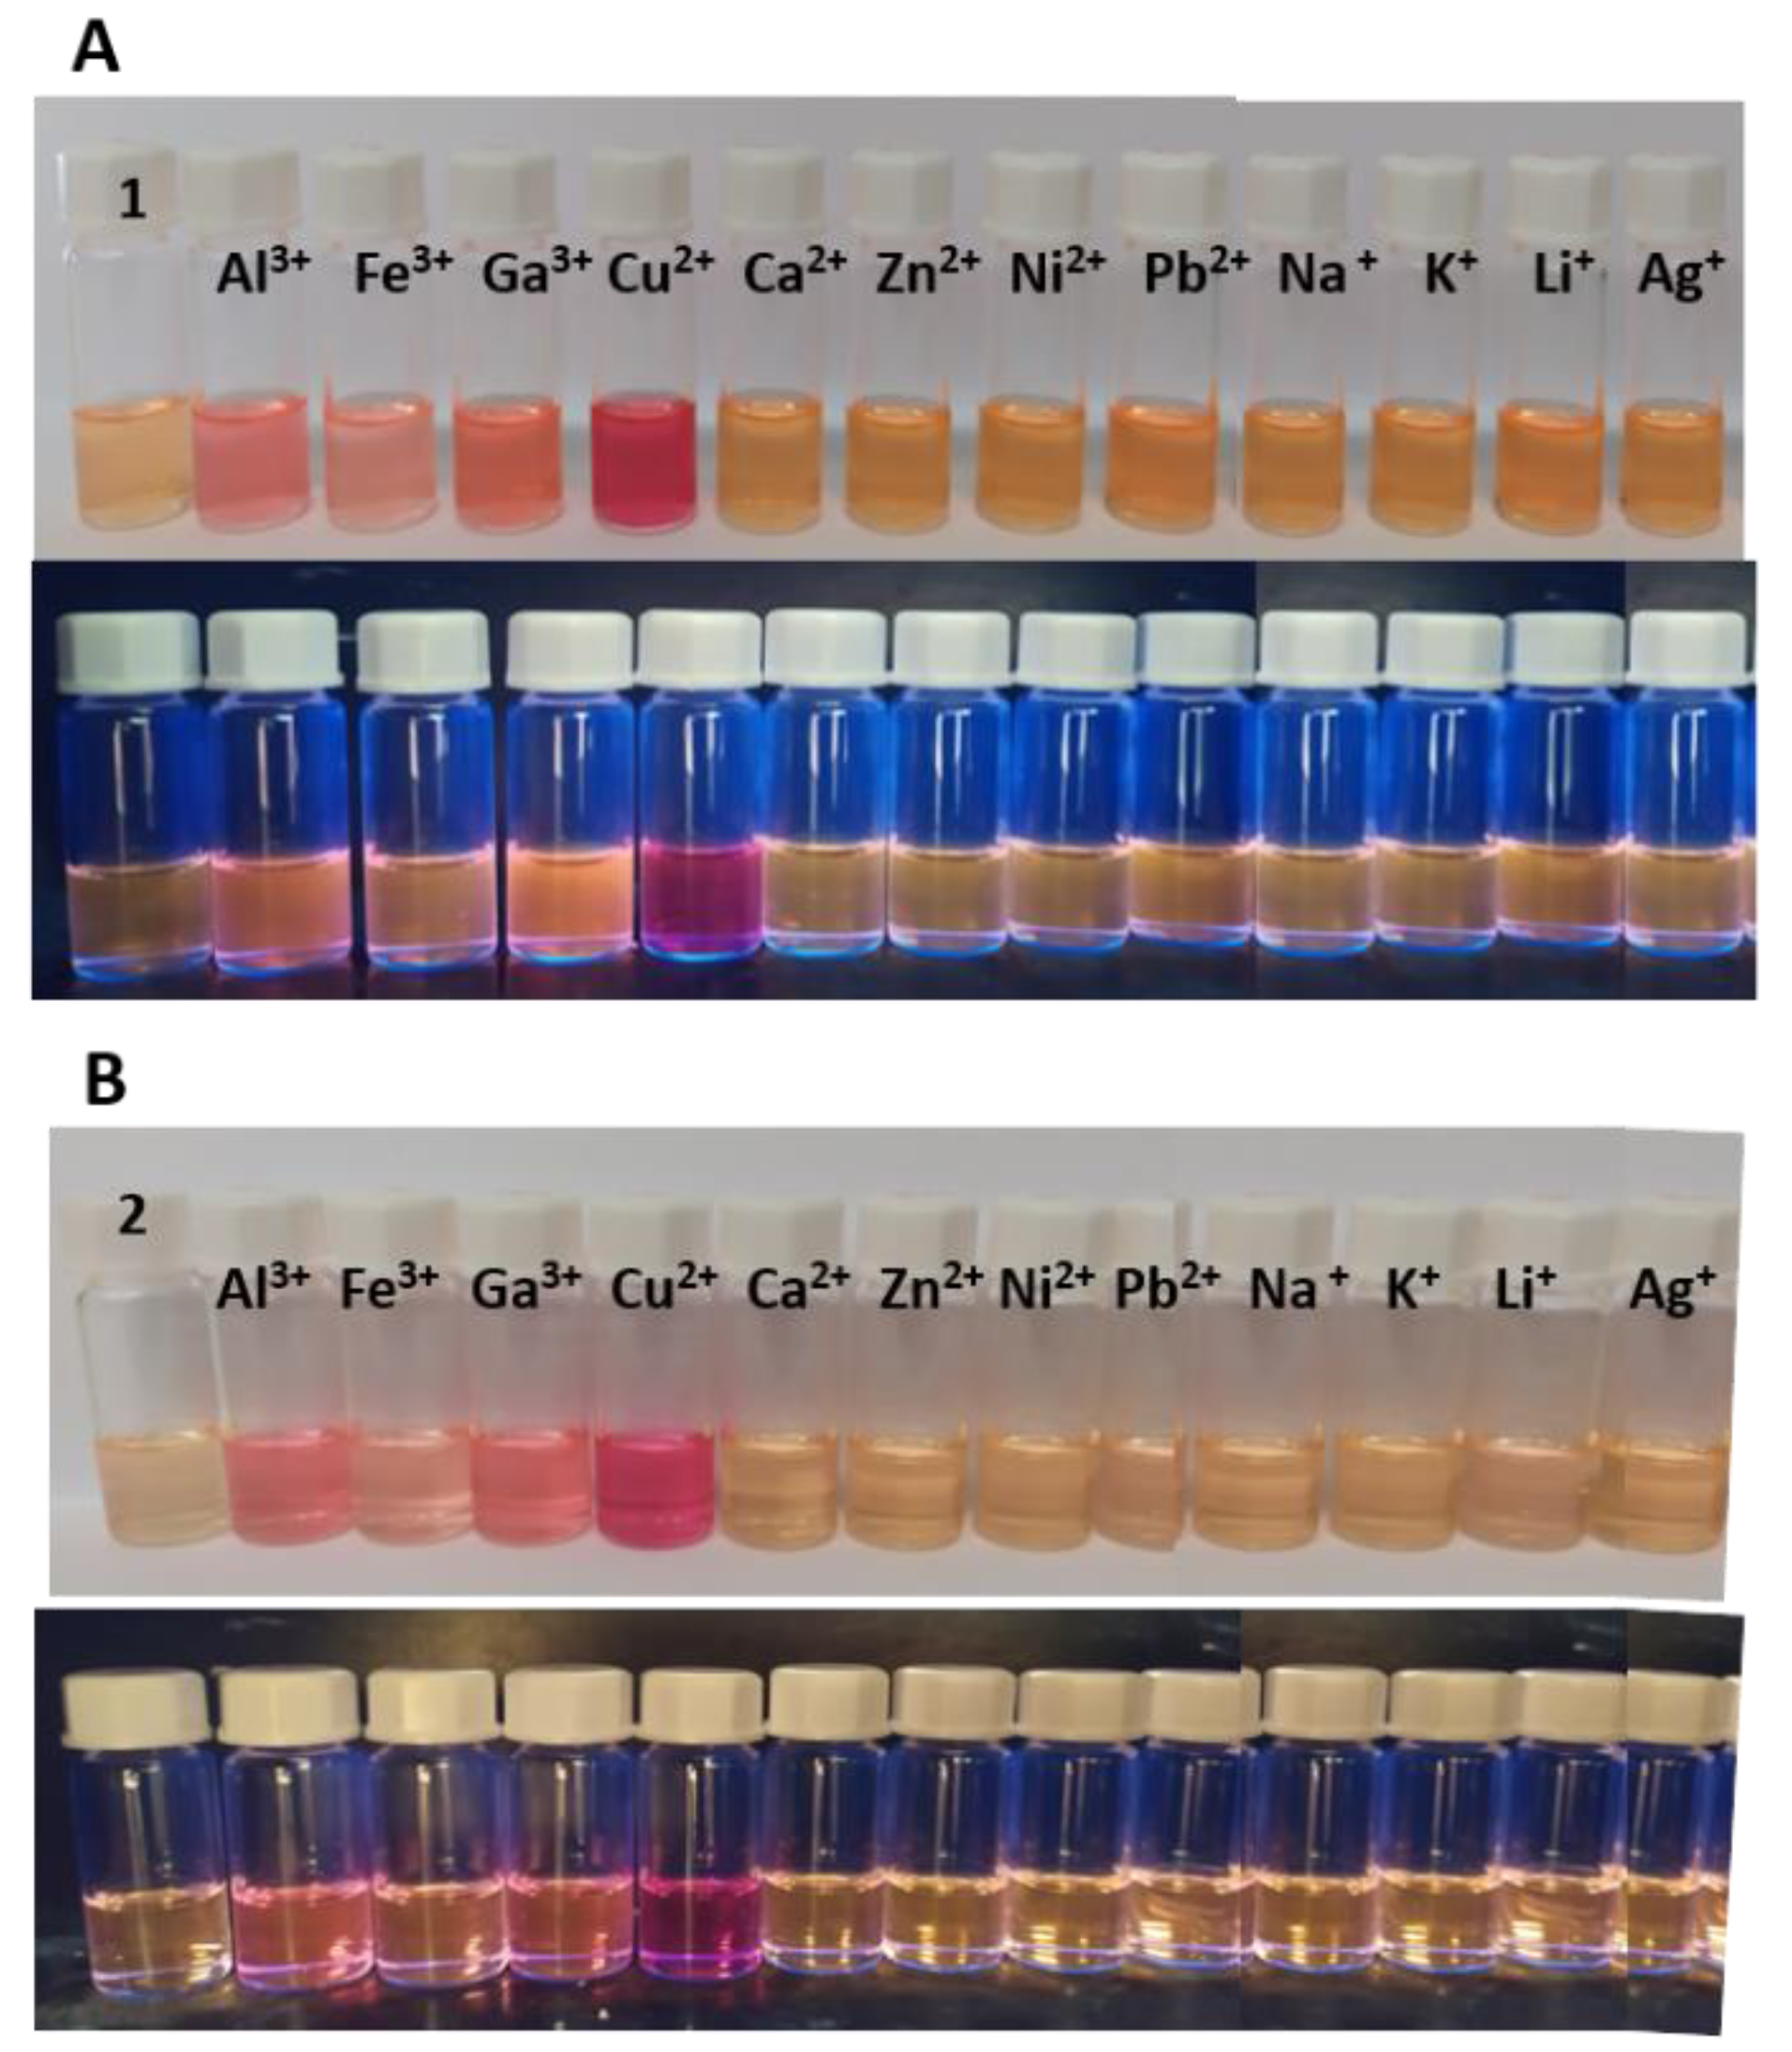
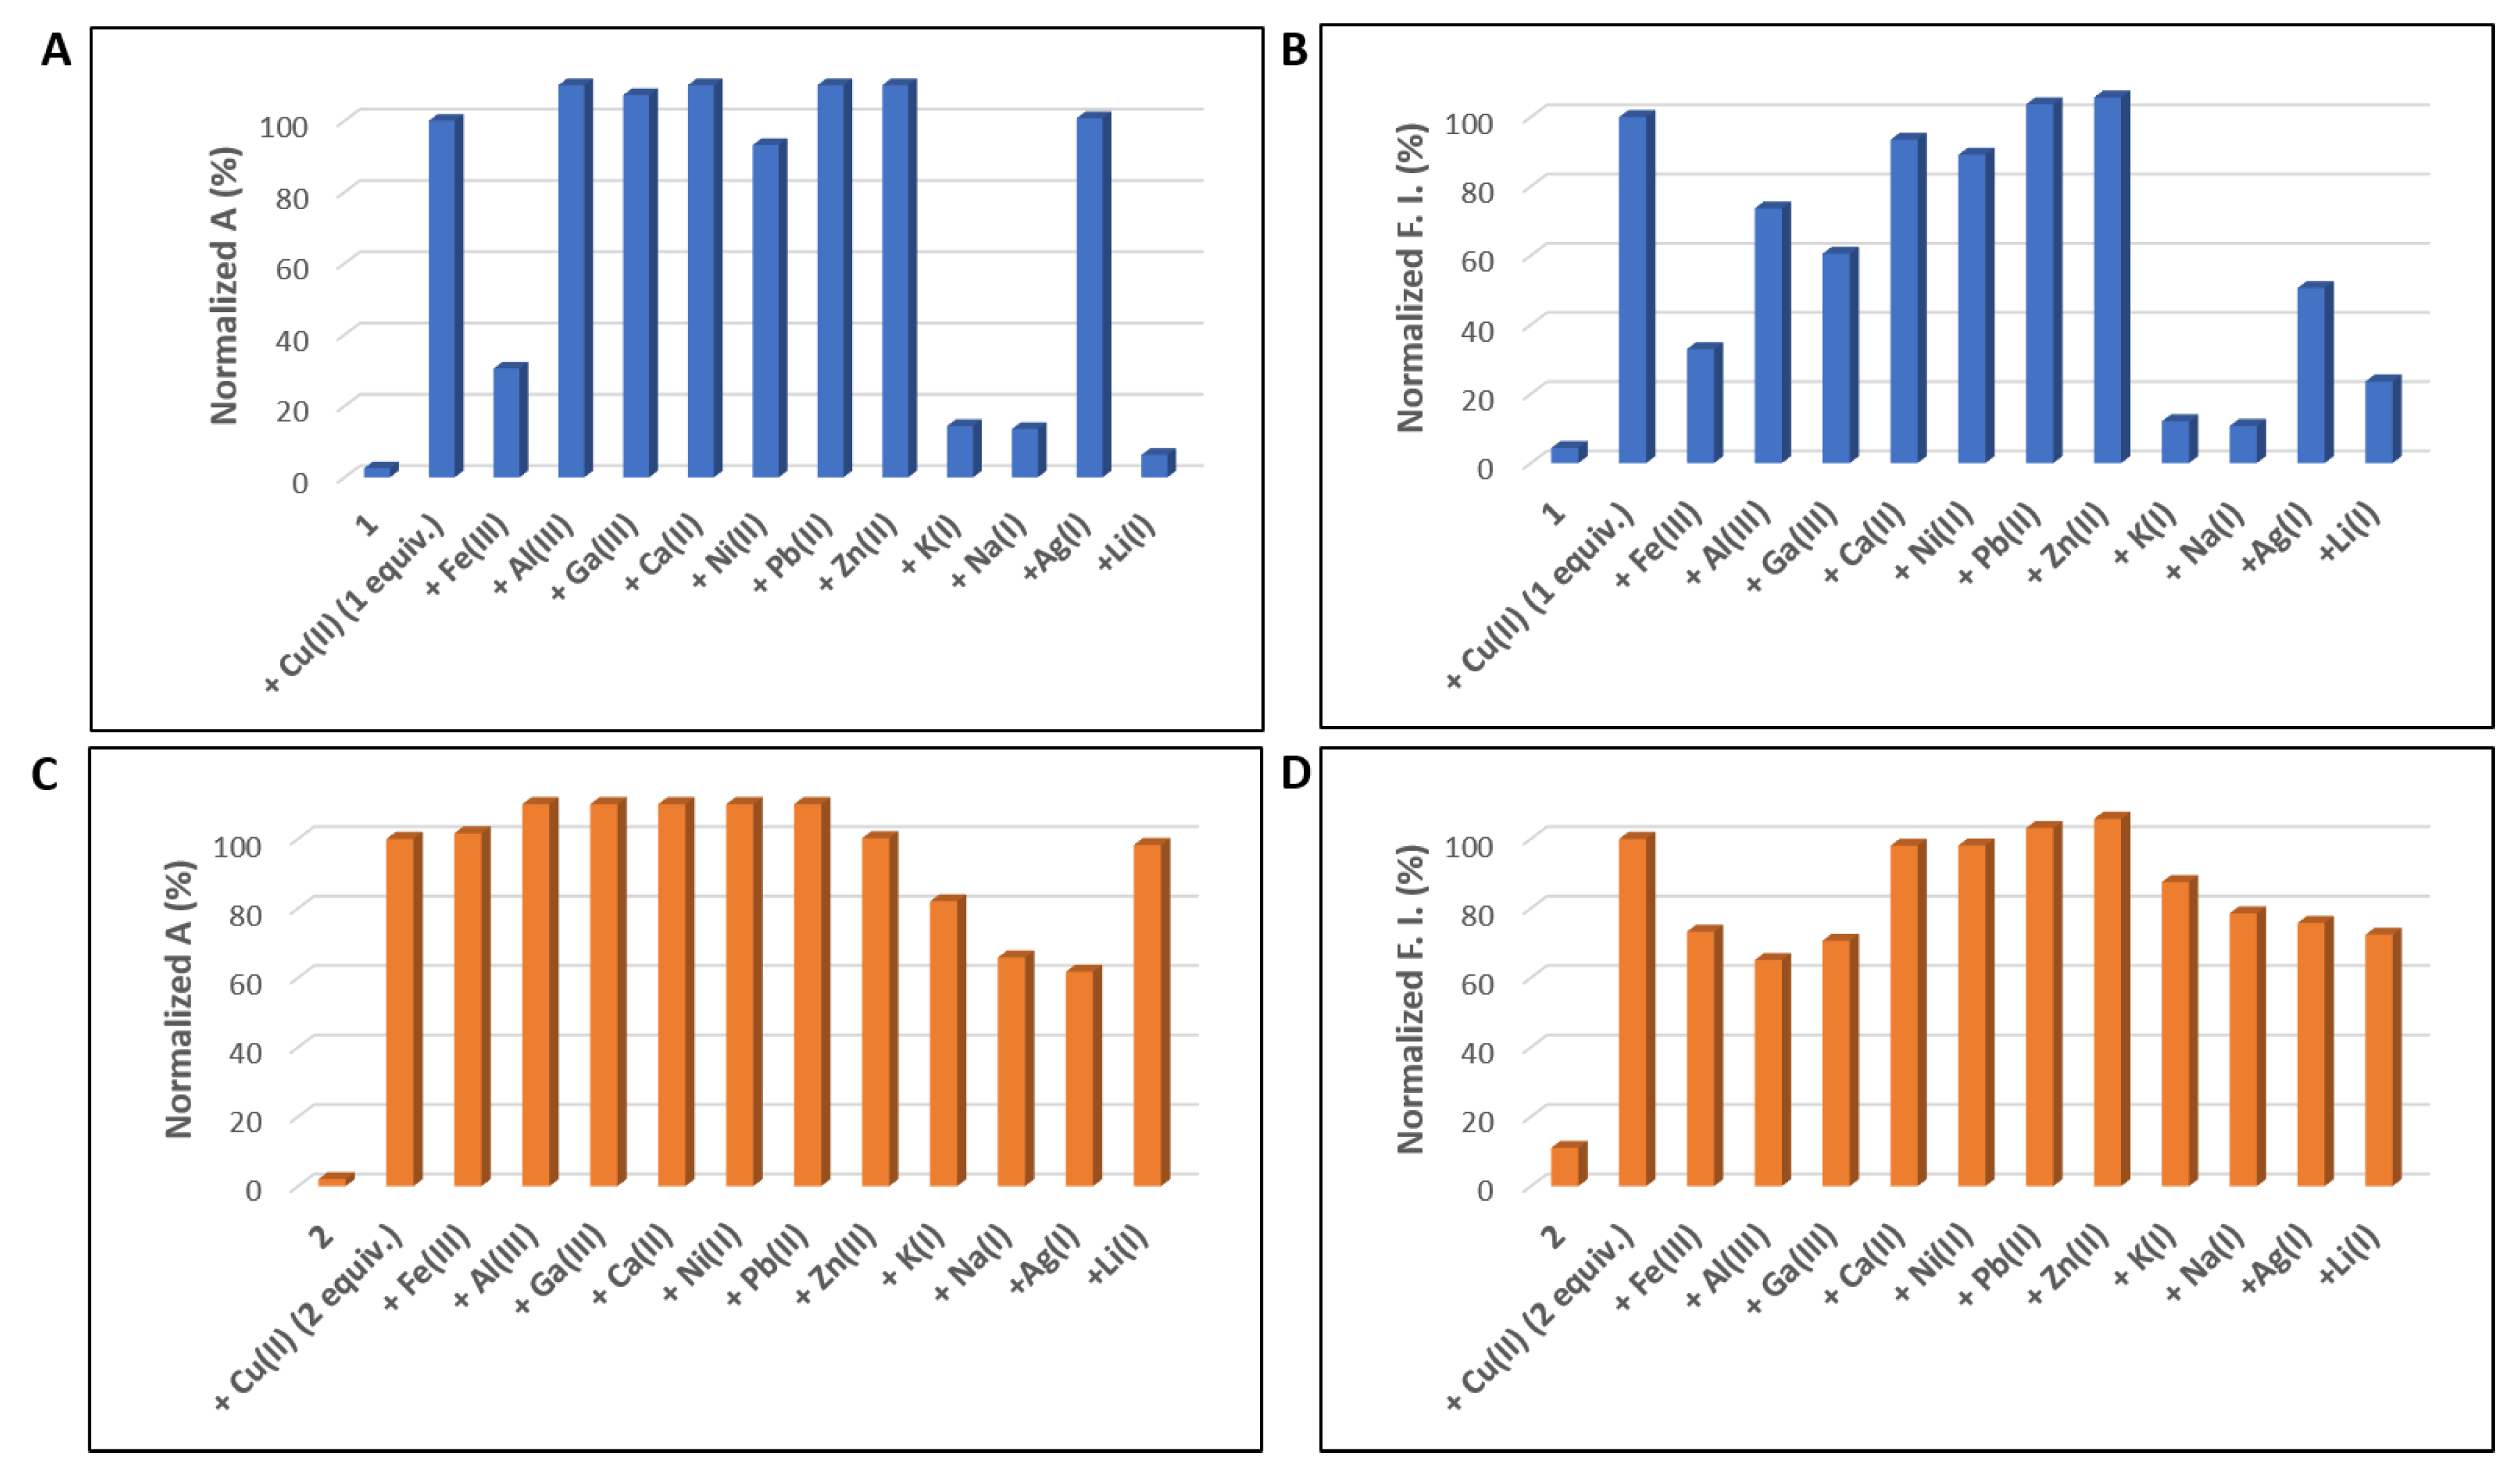
2.4. Competition Studies
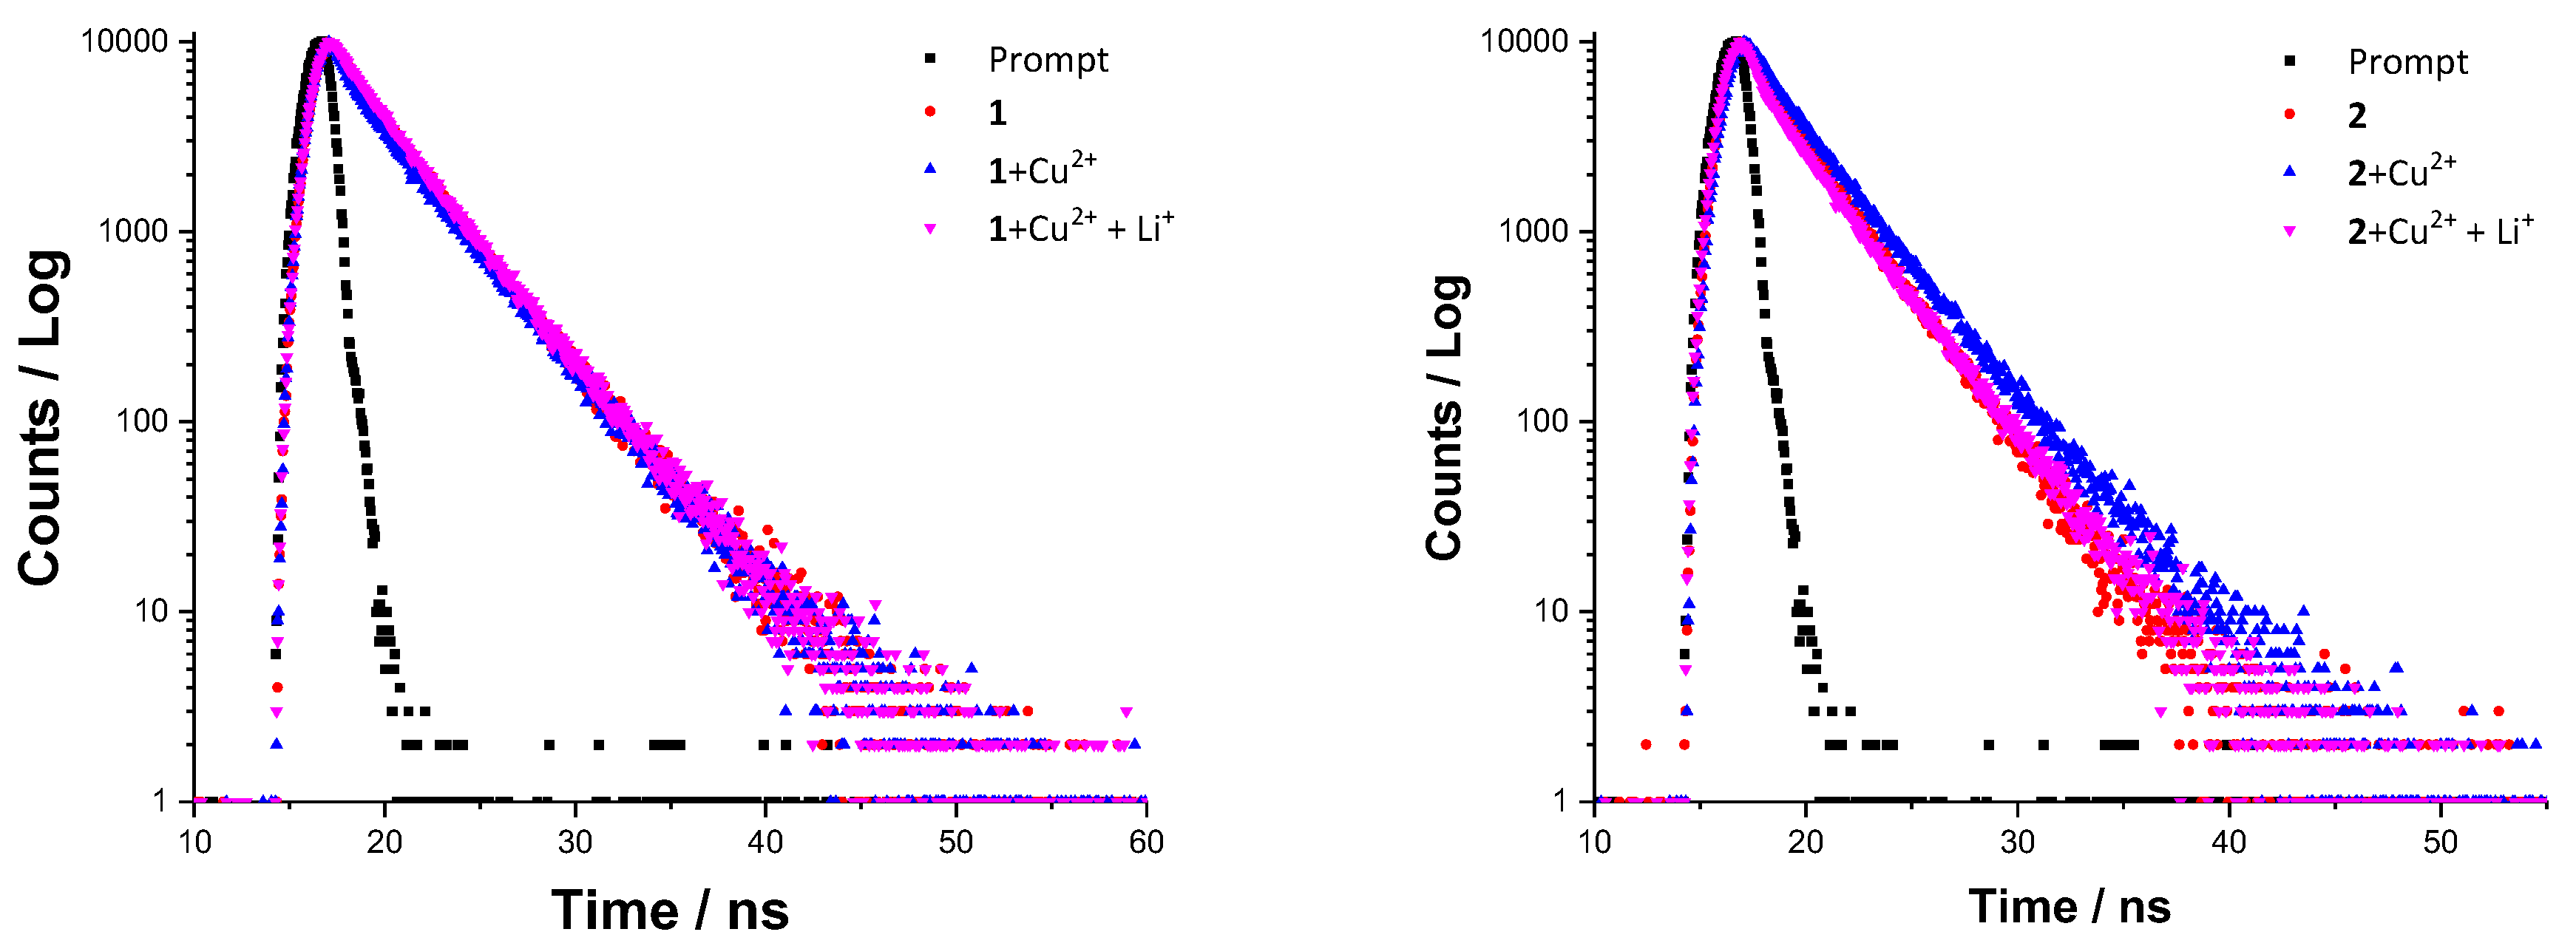
2.5. Mechanism Studies
3. Materials and Methods
3.1. Synthesis
3.2. Synthesis of Chemosensors 1 and 2
3.3. UV-Vis and Fluorescence Spectra Measurements
4. Conclusions
Supplementary Materials
Author Contributions
Funding
Data Availability Statement
Acknowledgments
Conflicts of Interest
Sample Availability
References
- Kaur, M.; Choi, D.H. Diketopyrrolopyrrole: Brilliant red pigment dye-based fluorescent probes and their applications. Chem. Soc. Rev. 2015, 44, 58–77. [Google Scholar] [CrossRef] [PubMed]
- Grzybowski, M.; Gryko, D.T. Diketopyrrolopyrroles: Synthesis, reactivity, and optical properties. Adv. Opt. Mater. 2015, 3, 280–320. [Google Scholar] [CrossRef]
- Auwalu, M.A.; Cheng, S. Diketopyrrolopyrrole fluorescent probes, photophysical and biological applications. Chemosensors 2021, 9, 44. [Google Scholar] [CrossRef]
- Gholami, M.D.; Liu, Q.; Sonar, P.; Manzhos, S.; Ayoko, G.A.; Izake, E.L. Naphthalene flanked diketopyrrolopyrrole: A new functional dye based optical sensors for monitoring cyanide ions in water. Adv. Mater. Technol. 2021, 7, 2100170. [Google Scholar] [CrossRef]
- Wrackmeyer, M.; O’Rourke, A.P.; Pugh, T.; Turner, M.L.; Webb, S.J. Effect of varying substituent on the colour change transitions of diacetylene pigments. Dye. Pigment. 2021, 192, 109397. [Google Scholar] [CrossRef]
- Zhang, S.; Sun, T.; Xiao, D.; Yuan, F.; Li, T.; Wang, E.; Liu, H.; Niu, Q. A dual-responsive colorimetric and fluorescent chemosensor based on diketopyrrolopyrrole derivative for naked-eye detection of Fe3+ and its practical application. Spectrochim. Acta A Mol. Biomol. Spectrosc. 2018, 189, 594–600. [Google Scholar] [CrossRef]
- Zhang, H.; Li, R.; Deng, Z.; Cui, S.; Wang, Y.; Zheng, M.; Yang, W. π-Conjugated oligomers based on aminobenzodifuranone and diketopyrrolopyrrole. Dye. Pigment. 2020, 181, 108552. [Google Scholar] [CrossRef]
- Chen, X.; Pradhan, T.; Wang, F.; Kim, J.S.; Yoon, J. Fluorescent chemosensors based on spiroring-opening of xanthenes and related derivatives. Chem. Rev. 2012, 112, 1910–1956. [Google Scholar] [CrossRef]
- Zhang, Q.; Wong, K.M.C. Photophysical, Ion-Sensing and Biological Properties of Rhodamine-Containing Transition Metal Complexes. Coord. Chem. Rev. 2020, 416, 213336. [Google Scholar] [CrossRef]
- Keller, G.S.; Kamiya, M.; Urano, Y. Recent progress in small spirocyclic, xanthene-based fluorescent probes. Molecules 2020, 25, 5964. [Google Scholar] [CrossRef]
- Qian, X.; Xiao, Y.; Xu, Y.; Guo, X.; Qian, J.; Zhu, W. “Alive” dyes as fluorescent sensors: Fluorophore, mechanism, receptor and images in living cells. Chem. Commun. 2010, 46, 6418–6436. [Google Scholar] [CrossRef] [PubMed]
- Lou, X.; Ou, D.; Li, Q.; Li, Z. An indirect approach for anion detection: The displacement strategy and its application. Chem. Commun. 2012, 48, 8462–8477. [Google Scholar] [CrossRef]
- Goshisht, M.K.; Tripathi, N. Fluorescence-based sensors as an emerging tool for anion detection: Mechanism, sensory materials and applications. J. Mater. Chem. C. Mater. 2021, 9, 9820–9850. [Google Scholar] [CrossRef]
- Ashton, T.D.; Jolliffe, K.A.; Pfeffer, F.M. Luminescent probes for the bioimaging of small anionic species in vitro and in vivo. Chem. Soc. Rev. 2015, 44, 4547–4595. [Google Scholar] [CrossRef] [Green Version]
- Lou, X.; Qiang, L.; Qin, J.; Li, Z. A new rhodamine-based colorimetric cyanide chemosensor: Convenient detecting procedure and high sensitivity and selectivity. ACS Appl. Mater. Interfaces 2009, 1, 2529–2535. [Google Scholar] [CrossRef] [PubMed]
- Hu, Z.-Q.; Wang, X.-M.; Feng, Y.-C.; Ding, L.; Li, M.; Lin, C.-S. A novel colorimetric and fluorescent chemosensor for acetate ions in aqueous media based on a rhodamine 6G–phenylurea conjugate in the presence of Fe (III) ions. Chem. Commun. 2011, 47, 1622–1624. [Google Scholar] [CrossRef]
- Lee, S.; Rao, B.A.; Son, Y.-A. A highly selective fluorescent chemosensor for Hg2+ based on a Squaraine–bis(rhodamine-b) derivative: Part II. Sens. Actuators B Chem. 2015, 210, 519–532. [Google Scholar] [CrossRef]
- Vijay, N.; Balamurugan, G.; Venkatesan, P.; Wu, S.P.; Velmathi, S. A triple action chemosensor for Cu2+ by chromogenic, Cr3+ by fluorogenic and CN− by Relay Recognition Methods with Bio-imaging of HeLa cells. Photochem. Photobiol. Sci. 2017, 16, 1441–1448. [Google Scholar] [CrossRef]
- Das, D.; Alam, R.; Ali, M. Rhodamine 6G-based efficient chemosensor for trivalent metal ions (Al3+, Cr3+ and Fe3+) upon single excitation with applications in combinational logic circuits and memory devices. Analyst 2022, 147, 471–479. [Google Scholar] [CrossRef]
- Mabhai, S.; Dolai, M.; Dey, S.K.; Dhara, A.; Choudhury, S.M.; Das, B.; Dey, S.; Jana, A. Rhodamine-Azobenzene Based Single Molecular Probe for Multiple Ions Sensing: Cu2+, Al3+, Cr3+ and its imaging in human lymphocyte cells. Spectrochim. Acta A Mol. Biomol. Spectrosc. 2019, 219, 319–332. [Google Scholar] [CrossRef]
- Shrivastava, A.; Gupta, V. Methods for the determination of limit of detection and limit of quantitation of the analytical methods. Chron. Young Sci. 2011, 2, 21. [Google Scholar] [CrossRef]
- Brunetti, B.; Desimoni, E. About Estimating the Limit of Detection by the Signal to Noise Approach. Pharm. Anal. Acta. 2015, 6, 1000355. [Google Scholar] [CrossRef]
- Bayindir, S. A Simple Rhodanine-based fluorescent sensor for mercury and copper: The recognition of Hg2+ in aqueous solution, and Hg2+/Cu2+ in organic solvent. J. Photochem. Photobiol. A. Chem. 2019, 372, 235–244. [Google Scholar] [CrossRef]
- Abebe, F.; Perkins, P.; Shaw, R.; Tadesse, S. A Rhodamine-based fluorescent sensor for selective detection of Cu2+ in aqueous media: Synthesis and spectroscopic properties. J. Mol. Struct. 2020, 1205, 127594. [Google Scholar] [CrossRef] [PubMed]
- Gao, Y.; Zhang, C.; Peng, S.; Chen, H. A fluorescent and colorimetric probe enables simultaneous differential detection of Hg2+ and Cu2+ by two different mechanisms. Sens. Actuators. B. Chem. 2017, 238, 455–461. [Google Scholar] [CrossRef]
- Tang, L.; Guo, J.; Wang, N. A new rhodamine b hydrazide hydrazone derivative for colorimetric and fluorescent “off-on” recognition of Copper (II) in aqueous media. Bull. Korean Chem. Soc. 2013, 34, 159–163. [Google Scholar] [CrossRef] [Green Version]
- Elmorsi, T.M.; Aysha, T.S.; Machalický, O.; Mohamed, M.B.I.; Bedair, A.H. A dual functional colorimetric and fluorescence chemosensor based on benzo[f]fluorescein dye derivatives for copper ions and PH; kinetics and thermodynamic study. Sens. Actuators. B. Chem. 2017, 253, 437–450. [Google Scholar] [CrossRef]
- Kamenica, M.; Kothur, R.R.; Willows, A.; Patel, B.A.; Cragg, P.J. Lithium ion sensors. Sensors 2017, 17, 2430. [Google Scholar] [CrossRef] [Green Version]
- Kaur, G.; Singh, A.; Venugopalan, P.; Kaur, N.; Singh, N. Selective recognition of Lithium(I) ions using Biginelli based fluorescent organic nanoparticles in an aqueous medium. RSC Adv. 2016, 6, 1792–1799. [Google Scholar] [CrossRef]
- Kang, J.; Li, E.; Cui, L.; Shao, Q.; Yin, C.; Cheng, F. Lithium ion specific fluorescent reversible extraction-release based on spiropyran isomerization combining crown ether coordination and its bioimaging. Sens. Actuators. B. Chem. 2021, 327, 128941. [Google Scholar] [CrossRef]
- Villemin, E.; Raccurt, O. Optical lithium sensors. Coord. Chem. Rev. 2021, 435, 213801. [Google Scholar] [CrossRef]
- Gehlen, M.H. The centenary of the stern-volmer equation of fluorescence quenching: From the single line plot to the sv quenching map. J. Photochem. Photobiol. C Photochem. Rev. 2020, 42, 100338. [Google Scholar] [CrossRef]
- Rangel, M.; Leite, A.; Silva, A.M.N.; Moniz, T.; Nunes, A.; Amorim, M.J.; Queirós, C.; Cunha-Silva, L.; Gameiro, P.; Burgess, J. Distinctive EPR signals provide an understanding of the affinity of bis-(3-hydroxy-4-pyridinonato) Copper (II) complexes for hydrophobic environments. Dalton Trans. 2014, 43, 9722–9731. [Google Scholar] [CrossRef] [PubMed]
- Martínez-Máñez, R.; Sancenón, F. Fluorogenic and chromogenic chemosensors and reagents for anions. Chem. Rev. 2003, 103, 4419–4476. [Google Scholar] [CrossRef]
- Li, X.; Gao, X.; Shi, W.; Ma, H. Design strategies for water-soluble small molecular chromogenic and fluorogenic probes. Chem. Rev. 2014, 114, 590–659. [Google Scholar] [CrossRef]
- Leite, A.; Silva, A.M.G.; Cunha-Silva, L.; de Castro, B.; Gameiro, P.; Rangel, M. Discrimination of fluorescence light-up effects induced by pH and metal ion chelation on a spirocyclic derivative of Rhodamine B. Dalton Trans. 2013, 42, 6110–6118. [Google Scholar] [CrossRef]
- Almodôvar, V.A.S.; Tomé, A.C. A convenient synthesis of Diketopyrrolopyrrole dyes. Molecules 2021, 26, 4758. [Google Scholar] [CrossRef]


| Solvent | λabs/nm (ε × 104/dm3 mol−1 cm−1) | λem/nm | Stokes shift/nm | ΦF | τ */ns |
|---|---|---|---|---|---|
| Chemosensor 1 | |||||
| CH2Cl2 | 274 (2.27), 322 (2.41), 493 (1.11) | 577 | 80 | 0.43 | 3.250 ± 0.006 |
| EtOH | 264 (2.96), 299 (2.44), 345 (2.63), 511 (1.23) | 567 | 56 | 0.12 | 1.175 ± 0.005 |
| CH3CN | 238 (2.86), 273 (2.42), 320 (2.56), 488 (1.19) | 570 | 82 | 0.15 | 1.98 ± 0.06 |
| Chemosensor 2 | |||||
| CH2Cl2 | 273 (6.00), 324 (5.17), 345 (4.92), 493 (2.53) | 577 | 80 | 0.48 | 2.65 ± 0.03 |
| EtOH | 265 (10.8), 299 (6.98), 346 (5.74), 367 (5.37), 513 (2.84) | 566 | 53 | 0.09 | 1.2 ± 0.6 |
| CH3CN | 238 (10.8), 274 (6.47), 324 (5.58), 344 (4.93), 488 (2.52) | 570 | 82 | 0.11 | 0.85 ± 0.09 |
| Reference | LOD (μmol dm−3) | Sensing Ions |
|---|---|---|
| This work for 1 | 0.46 (UV-Vis), 0.33 (Fluorescence) | Cu2+ (Li+, CN−) |
| This work for 2 | 0.16 (UV-Vis), 0.18 (Fluorescence) | Cu2+ (Li+, CN−) |
| [23] | 3.36 (Fluorescence) | Cu2+ (Hg2+) |
| [24] | 2.11 (Fluorescence) | Cu2+ (CN−) |
| [25] | 1.59 (Fluorescence) | Cu2+ (Hg2+) |
| [26] | 0.080 (Fluorescence) | Cu2+ |
| [27] | 0.5 (UV-Vis) | Cu2+ |
| Chemosensor | fa | KSV (×105)/dm3 mol−1 |
|---|---|---|
| 1+Cu2+ | 0.81 | 18.1 |
| 2+Cu2+ | 0.30 | 8.00 |
Publisher’s Note: MDPI stays neutral with regard to jurisdictional claims in published maps and institutional affiliations. |
© 2022 by the authors. Licensee MDPI, Basel, Switzerland. This article is an open access article distributed under the terms and conditions of the Creative Commons Attribution (CC BY) license (https://creativecommons.org/licenses/by/4.0/).
Share and Cite
Queirós, C.; Almodôvar, V.A.S.; Martins, F.; Leite, A.; Tomé, A.C.; Silva, A.M.G. Synthesis of Novel Diketopyrrolopyrrole-Rhodamine Conjugates and Their Ability for Sensing Cu2+ and Li+. Molecules 2022, 27, 7219. https://doi.org/10.3390/molecules27217219
Queirós C, Almodôvar VAS, Martins F, Leite A, Tomé AC, Silva AMG. Synthesis of Novel Diketopyrrolopyrrole-Rhodamine Conjugates and Their Ability for Sensing Cu2+ and Li+. Molecules. 2022; 27(21):7219. https://doi.org/10.3390/molecules27217219
Chicago/Turabian StyleQueirós, Carla, Vítor A. S. Almodôvar, Fábio Martins, Andreia Leite, Augusto C. Tomé, and Ana M. G. Silva. 2022. "Synthesis of Novel Diketopyrrolopyrrole-Rhodamine Conjugates and Their Ability for Sensing Cu2+ and Li+" Molecules 27, no. 21: 7219. https://doi.org/10.3390/molecules27217219