

Green Synthesis of NiO-SnO2 Nanocomposite and Effect of Calcination Temperature on Its Physicochemical Properties: Impact on the Photocatalytic Degradation of Methyl Orange
 , ,
, , 
Abstract
:1. Introduction
2. Results and Discussion
2.1. XRD Analysis
2.2. SEM Analysis
2.3. UV–Vis DRS Analysis
2.4. FTIR Analysis
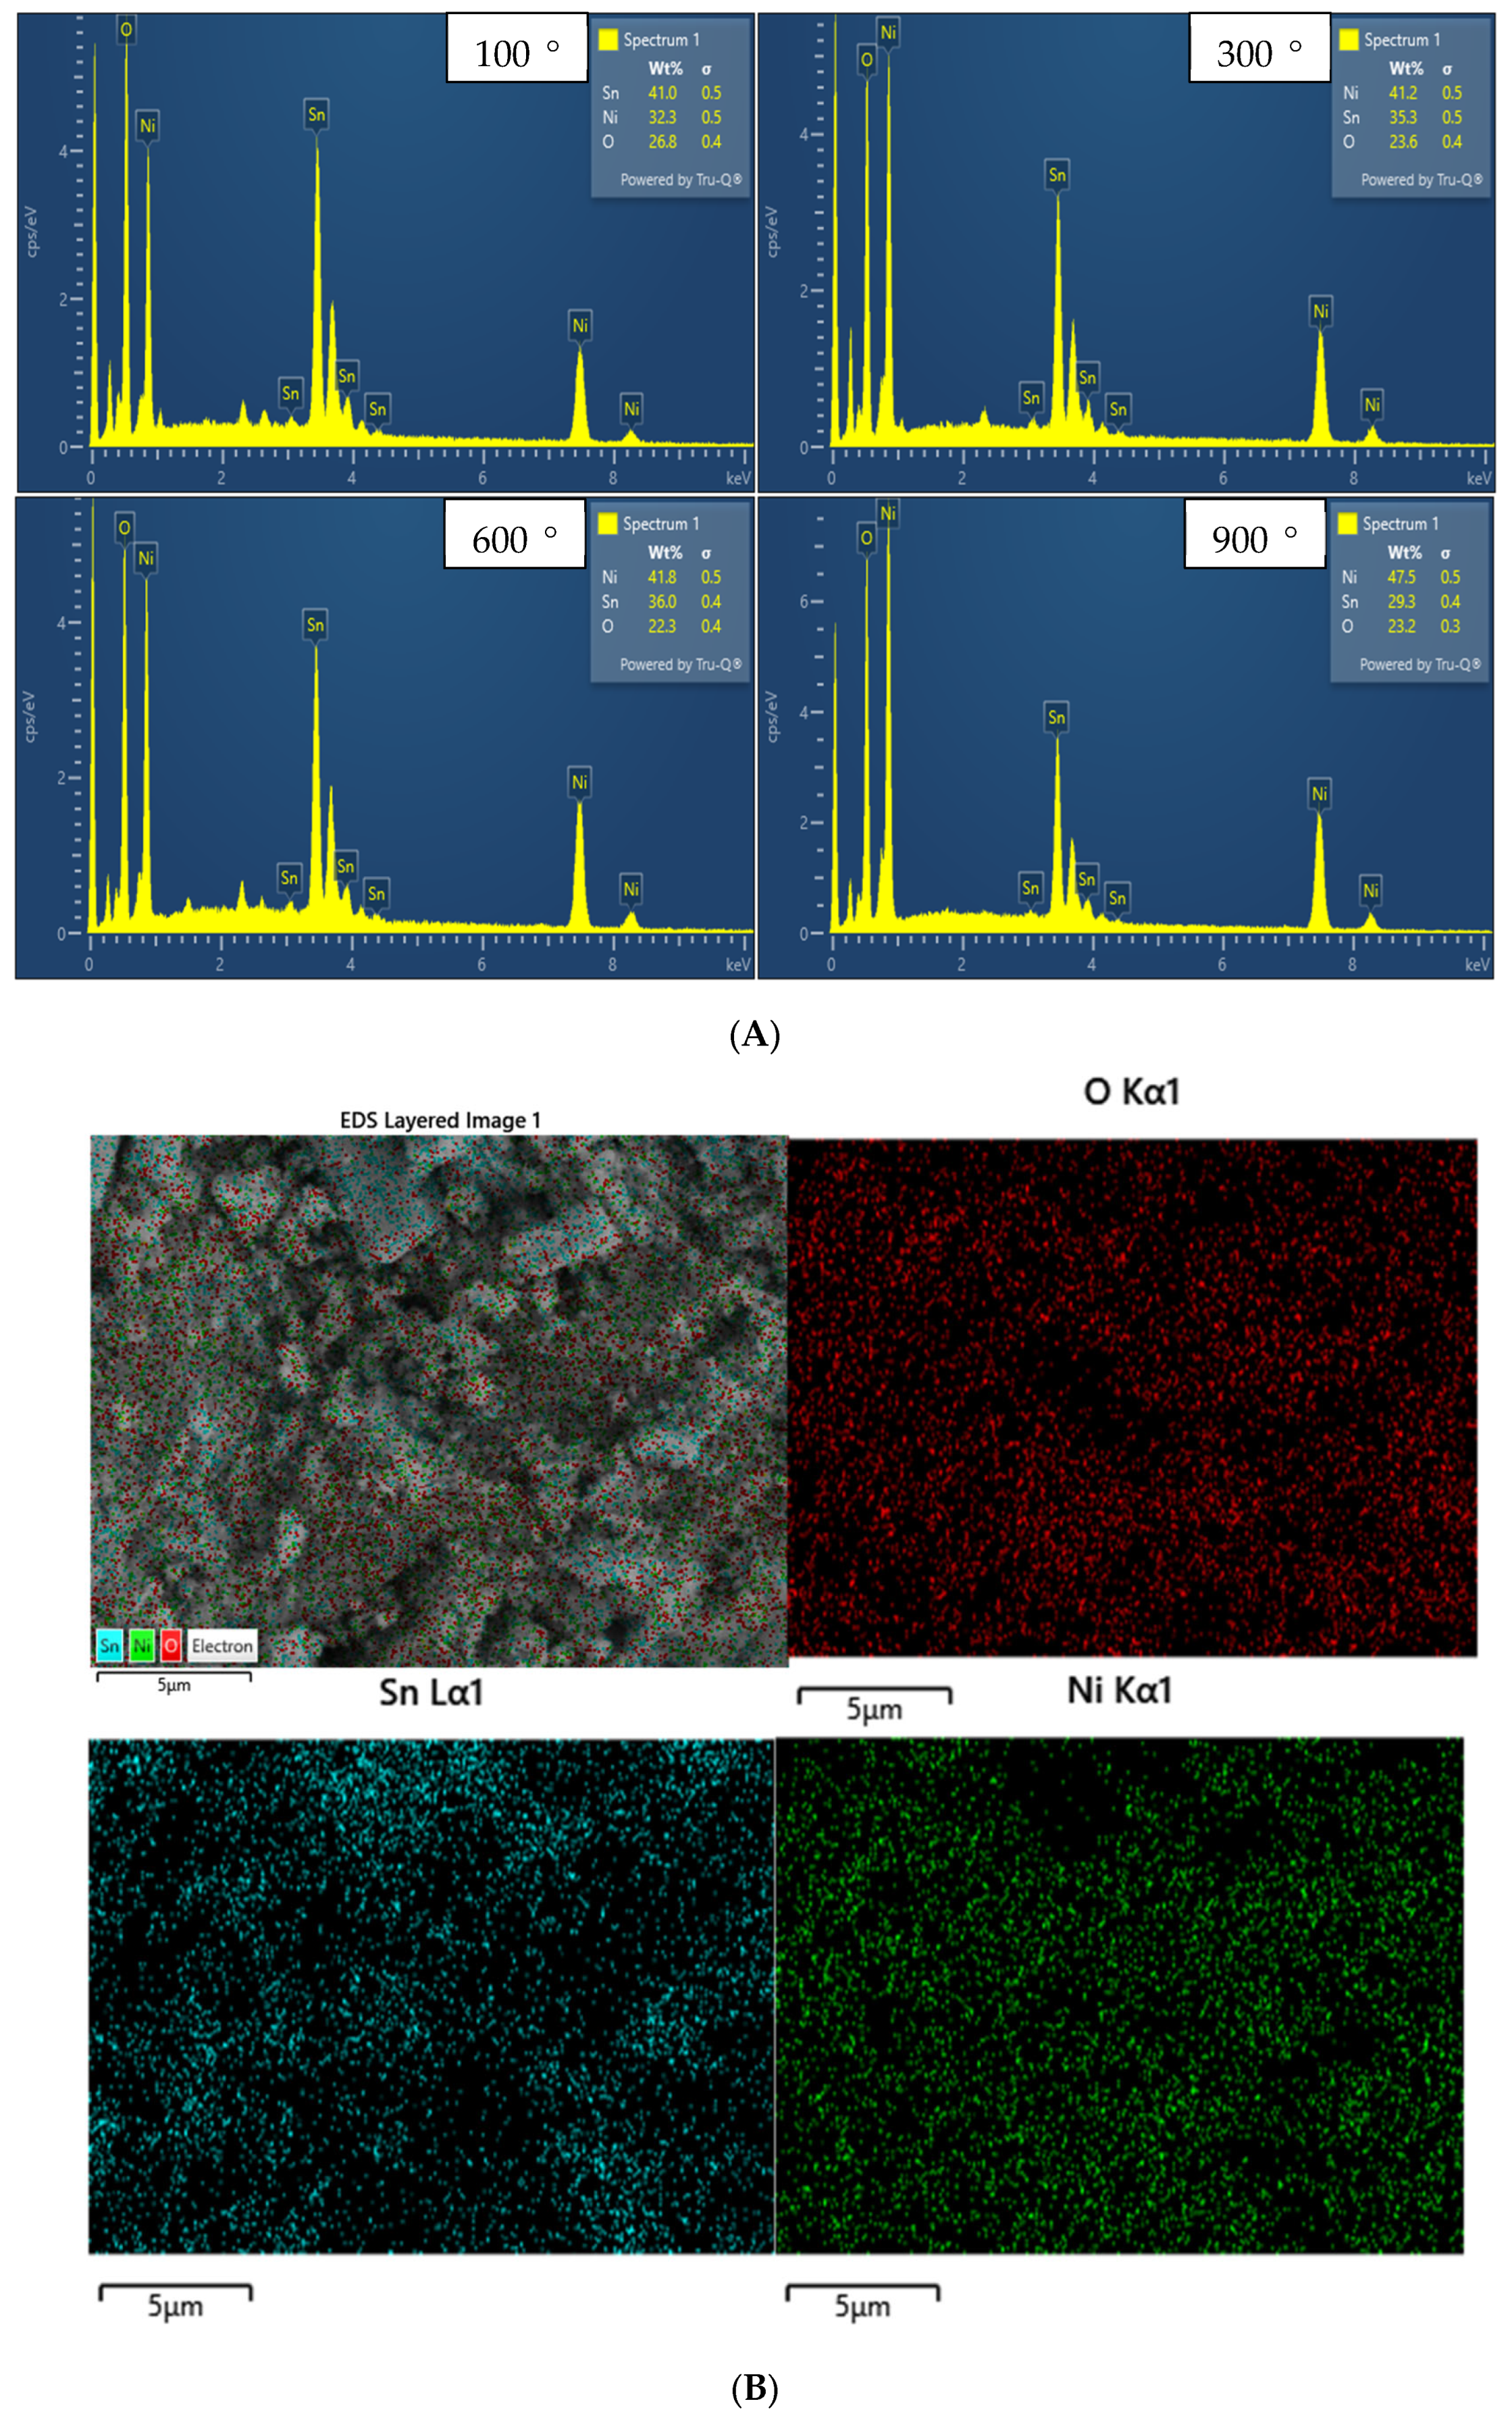
2.5. EDX Analysis
2.6. Photocatalytic Activity
2.7. Factors Affecting the Photocatalytic Activity
2.7.1. Effect of the Annealing Temperature
2.7.2. Effect of the Catalyst Dose
2.7.3. Effect of Initial Concentration of MO
2.7.4. Effect of pH
3. Materials and Methods
3.1. Reagents
3.2. Plant
3.3. Preparation of the Plant Extract
3.4. Green Synthesis of NiO-SnO2 NC
3.5. Physicochemical Characterizations
3.5.1. XRD, SEM, EDX, UV–Vis, and FTIR
3.5.2. Photocatalytic Assay
4. Conclusions
Supplementary Materials
Author Contributions
Funding
Institutional Review Board Statement
Informed Consent Statement
Data Availability Statement
Acknowledgments
Conflicts of Interest
Sample Availability
References
- Scuderi, V.; Amiard, G.; Boninelli, S.; Scalese, S.; Miritello, M.; Sberna, P.M.; Impellizzeri, G. Photocatalytic activity of CuO and Cu2O nanowires. Mater. Sci. Semicond. Process. 2015, 42, 89–93. [Google Scholar] [CrossRef]
- Haq, S.; Shoukat, S.; Rehman, W.; Shah, A. Green fabrication and physicochemical investigations of zinc-cobalt oxide nanocomposite for wastewater treatment. J. Mol. Liq. 2020, 318, 114260. [Google Scholar] [CrossRef]
- Shoukat, S.; Haq, S.; Rehman, W.; Waseem, M.; Imran, M. Fabrication and Characterization of Zinc Titanate Heterojunction for Adsorption and Photocatalytic Applications. J. Inorg. Organomet. Polym. Mater. 2020, 30, 4944–4953. [Google Scholar] [CrossRef]
- Luque, P.A.; Nava, O.; Soto-robles, C.A.; Chinchillas-chinchillas, M.J. Improved photocatalytic efficiency of SnO2 nanoparticles through green synthesis. Optik 2020, 206, 164299. [Google Scholar] [CrossRef]
- Kazazi, M.; Moradi, B.; Delshad Chermahini, M. Enhanced photocatalytic degradation of methyl orange using Ag/Sn-doped CeO2 nanocomposite. J. Mater. Sci. Mater. Electron. 2019, 30, 6116–6126. [Google Scholar] [CrossRef]
- Chatterjee, J.M.; Taheruddin, S.; Mitra, M.; Kulsi, C.; Mndal, A.; Banerjee, D. Visible-Light Influenced Photocatalytic Activity of Polyaniline -Bismuth Selenide Composites for the Degradation of Methyl Orange, Rhodamine B and Malachite Green dyes. Appl. Surf. Sci. 2019, 470, 472–483. [Google Scholar] [CrossRef]
- Gherbi, B.; Laouini, S.E.; Meneceur, S.; Bouafia, A.; Hemmami, H.; Tedjani, M.L.; Thiripuranathar, G.; Barhoum, A.; Menaa, F. Effect of pH Value on the Bandgap Energy and Particles Size for Biosynthesis of ZnO Nanoparticles: Efficiency for Photocatalytic Adsorption of Methyl Orange. Sustainability 2022, 14, 11300. [Google Scholar] [CrossRef]
- Harikumar, B.; Okla, M.K.; Alaraidh, I.A.; Mohebaldin, A.; Soufan, W.; Abdel-Maksoud, M.A.; Aufy, M.; Thomas, A.M.; Raju, L.L.; Khan, S.S. Robust visible light active CoNiO2–BiFeO3–NiS ternary nanocomposite for photo-fenton degradation of rhodamine B and methyl orange: Kinetics, degradation pathway and toxicity assessment. J. Environ. Manag. 2022, 317, 115321. [Google Scholar] [CrossRef]
- Shanker, U. Degradation of hazardous organic dyes in water by nanomaterials. Environ. Chem. Lett. 2017, 15, 623–642. [Google Scholar] [CrossRef]
- Chiu, Y.H.; Chang, T.F.M.; Chen, C.Y.; Sone, M.; Hsu, Y.J. Mechanistic insights into photodegradation of organic dyes using heterostructure photocatalysts. Catalysts 2019, 9, 430. [Google Scholar] [CrossRef]
- Sivakarthik, P.; Thangaraj, V.; Perumalraj, K.; Balaji, J. Synthesis of co-doped tin oxide nanoparticles for photo catalytic degradation of synthetic organic dyes. Dig. J. Nanomater. Biostruct. 2016, 11, 935–943. [Google Scholar]
- Elango, G.; Kumaran, S.M.; Kumar, S.S.; Muthuraja, S.; Roopan, S.M. Green synthesis of SnO2 nanoparticles and its photocatalytic activity of phenolsulfonphthalein dye. Spectrochim. Acta A Mol. Biomol. Spectrosc. 2015, 145, 176–180. [Google Scholar] [CrossRef] [PubMed]
- Wijesinghe, U.; Thiripuranathar, G.; Iqbal, H.; Menaa, F. Biomimetic Synthesis, Characterization, and Evaluation of Fluorescence Resonance Energy Transfer, Photoluminescence, and Photocatalytic Activity of Zinc Oxide Nanoparticles. Sustainability 2021, 13, 2004. [Google Scholar] [CrossRef]
- Wijesinghe, U.; Thiripuranathar, G.; Menaa, F.; Iqbal, H.; Razzaq, A.; Almukhlifi, H. Green Synthesis. Structural Characterization and Photocatalytic Applications of ZnO Nanoconjugates Using Heliotropium Indicum. Catalysts 2021, 11, 831. [Google Scholar]
- Haq, S.; Ehsan, R.; Menaa, F.; Shahzad, N.; Din, S.U.; Shahzad, M.I.; Rehman, W.; Waseem, M.; Alrhabi, W.; Almukhlifi, H.A.; et al. A Novel Shift in the Absorbance Maxima of Methyl Orange with Calcination Temperature of Green Tin Dioxide Nanoparticle-Induced Photocatalytic Activity. Catalysts 2022, 12, 1397. [Google Scholar] [CrossRef]
- Zafar, N.; Uzair, B.; Menaa, F.; Khan, B.A.; Niazi, M.B.K.; Alaryani, F.S.; Majrashi, K.A.; Sajjad, S. Moringa concanensis-Mediated Synthesis and Characterizations of Ciprofloxacin Encapsulated into Ag/TiO2/Fe2O3/CS Nanocomposite: A Therapeutic Solution against Multidrug Resistant E. coli Strains of Livestock Infectious Diseases. Pharmaceutics 2022, 14, 1719. [Google Scholar]
- Iqbal, H.; Razzaq, A.; Uzair, B.; Ul Ain, N.; Sajjad, S.; Althobaiti, N.A.; Albalawi, A.E.; Menaa, B.; Haroon, M.; Khan, M.; et al. Breast Cancer Inhibition by Biosynthesized Titanium Dioxide Nanoparticles Is Comparable to Free Doxorubicin but Appeared Safer in BALB/c Mice. Materials 2021, 14, 3155. [Google Scholar] [CrossRef]
- Haq, S.; Rehman, W.; Waseem, M.; ur-Rehman, M.; Shah, K.H. Modeling, Thermodynamic Study and Sorption Mechanism of Cadmium Ions onto Isopropyl Alcohol Mediated Tin Dioxide Nanoparticles. J. Inorg. Organomet. Polym. Mater. 2020, 30, 1197–1205. [Google Scholar] [CrossRef]
- Haq, S.; Rehman, W.; Waseem, M.; Shah, A.; Khan, A.R.; ur-Rehman, M.; Ahmad, P.; Khan, B.; Ali, G. Green synthesis and characterization of tin dioxide nanoparticles for photocatalytic and antimicrobial studies. Mater. Res. Express 2020, 7, 025012. [Google Scholar] [CrossRef]
- Haq, S.; Ahmad, P.; Khandaker, M.U.; Faruque, M.R.I.; Rehman, W.; Waseem, M.; Din, S.U. Antibacterial, antioxidant and physicochemical investigations of tin dioxide nanoparticles synthesized via microemulsion method. Mater. Res. Express 2021, 8, 035013. [Google Scholar] [CrossRef]
- Haq, S.; Rehman, W.; Waseem, M.; Meynen, V.; Awan, S.A.; Khan, A.R.; Hussain, S.; ul-Abdin, Z.; Ud Din, S.; Hafeez, M.; et al. Effect of Annealing Temperature on Structural Phase Transformations and Band Gap Reduction for Photocatalytic Activity of Mesopores TiO2 Nanocatalysts. J. Inorg. Organomet. Polym. Mater. 2021, 31, 1312–1322. [Google Scholar] [CrossRef]
- Haq, S.; Raja, A.W.; Rehman, S.U.; Mezni, A.; Ben Ali, M.; Hedfi, A.; Shahzad, M.I.; Rehman, W.; Shahzad, N.; Waseem, N.; et al. Phytogenic Synthesis and Characterization of NiO-ZnO Nanocomposite for the Photodegradation of Brilliant Green and 4-Nitrophenol. J. Chem. 2021, 2021, 3475036. [Google Scholar] [CrossRef]
- Tammina, S.K.; Mandal, B.K.; Kadiyala, N.K. Photocatalytic degradation of methylene blue dye by nonconventional synthesized SnO2 nanoparticles. Environ. Nanotechnol. Monit. Manag. 2018, 10, 339–350. [Google Scholar] [CrossRef]
- Khairnar, S.D.; Shrivastava, V.S. Facile synthesis of nickel oxide nanoparticles for the degradation of Methylene blue and Rhodamine B dye: A comparative study. J. Taibah Univ. Sci. 2019, 13, 1108–1118. [Google Scholar] [CrossRef] [Green Version]
- Goel, R.; Jha, R.; Ravikant, C. Investigating the structural, electrochemical, and optical properties of p-type spherical nickel oxide (NiO) nanoparticles. J. Phys. Chem. Solids 2020, 144, 109488. [Google Scholar] [CrossRef]
- Olajire, A.A.; Mohammed, A.A. Green synthesis of nickel oxide nanoparticles and studies of their photocatalytic activity in degradation of polyethylene films. Adv. Powder Technol. 2020, 31, 211–218. [Google Scholar] [CrossRef]
- Barzinjy, A.A.; Hamad, S.M.; Aydın, S.; Ahmed, M.H.; Hussain, F.H.S. Green and eco—Friendly synthesis of Nickel oxide nanoparticles and its photocatalytic activity for methyl orange degradation. J. Mater. Sci. Mater. Electron. 2020, 31, 11303–11316. [Google Scholar] [CrossRef]
- Honarmand, M.; Golmohammadi, M.; Naeimi, A. Biosynthesis of tin oxide (SnO2) nanoparticles using jujube fruit for photocatalytic degradation of organic dyes. Adv. Powder Technol. 2019, 30, 1551–1557. [Google Scholar] [CrossRef]
- Sha, R.; Badhulika, S. Facile green synthesis of reduced graphene oxide/tin oxide composite for highly selective and ultra-sensitive detection of ascorbic acid. J. Electroanal. Chem. 2018, 816, 30–37. [Google Scholar] [CrossRef]
- Yao, W.; Wu, S.; Zhan, L.; Wang, Y. Two-dimensional porous carbon-coated sandwich-like mesoporous SnO2/graphene/mesoporous SnO2 nanosheets towards high-rate and long cycle life lithium-ion batteries. Chem. Eng. J. 2019, 361, 329–341. [Google Scholar] [CrossRef]
- Sunny, N.E.; Kumar, V. Biogenesis, Characterization and Bioefficacy of Tin Oxide Nanoparticles from Averrhoa Bilimbi Fruit Extract. Int. J. Recent Technol. Eng. 2019, 8, 10309–10315. [Google Scholar] [CrossRef]
- Ahmad, M.; Rehman, W.; Khan, M.M.; Qureshi, M.T.; Gul, A.; Haq, S.; Ullah, R.; Rab, A.; Menaa, F. Phytogenic fabrication of ZnO and gold decorated ZnO nanoparticles for photocatalytic degradation of Rhodamine B. J. Environ. Chem. Eng. 2021, 9, 104725. [Google Scholar] [CrossRef]
- Uzair, B.; Liaqat, A.; Iqbal, H.; Menaa, B.; Razzaq, A.; Thiripuranathar, G.; Fatima Rana, N.; Menaa, F. Green and Cost-Effective Synthesis of Metallic Nanoparticles by Algae: Safe Methods for Translational Medicine. Bioengineering 2020, 7, 129. [Google Scholar] [CrossRef] [PubMed]
- Teinkela, J.M.; Noundou, X.S.; Fannang, S.; Meyer, F.; Vardamides, J.C.; Mpondo, E.M.; Krause, R.W.M.; Azebaze, A.G.B.; Nguedia, J.C.A. In vitro antimicrobial activity of the methanol extract and compounds from the wood of Ficus elastica Roxb. ex Hornem. aerial roots. South Afr. J. Bot. 2017, 111, 302–306. [Google Scholar] [CrossRef]
- Bibi, N.; Haq, S.; Rehman, W.; Waseem, M.; Rehman, M.U.; Shah, A.; Basharat, K.; Rasheed, P. Low temperature fabrication of SnO2, ZnO and Zn2SnO4 nanostructures for the degradation of Rhodamine 6G: Characterization. Biointerface Res. Appl. Chem. 2020, 10, 5895–5900. [Google Scholar]
- Hamid, A.; Haq, S.; Ur Rehman, S.; Akhter, K.; Rehman, W.; Waseem, M.; Basharat, K.; Parsa, R.; Shah, A. Calcination temperature-driven antibacterial and antioxidant activities of fumaria indica mediated copper oxide nanoparticles: Characterization. Chem. Pap. 2021, 75, 4189–4198. [Google Scholar] [CrossRef]
- Saranya, P.E.; Selladurai, S. Facile synthesis of NiSnO3/graphene nanocomposite for high-performance electrode towards asymmetric supercapacitor device. J. Mater. Sci. 2018, 53, 16022–16046. [Google Scholar] [CrossRef]
- Rasheed, P.; Haq, S.; Waseem, M.; Rehman, S.U.; Rehman, W.; Bibi, N.; Shah, S.A.A. Green synthesis of vanadium oxide-zirconium oxide nanocomposite for the degradation of methyl orange and picloram. Mater. Res. Express 2020, 7, 025011. [Google Scholar] [CrossRef]
- Nejati, L.; Salavati-niasari, M. Facile synthesis and characterization of NiO-SnO2 ceramic nanocomposite and its unique performance in organic pollutants degradation. J. Mol. Struct. 2017, 1146, 629–634. [Google Scholar] [CrossRef]
- Chan, Y.B.; Selvanathan, V.; Tey, L.H.; Akhtaruzzaman, M.; Anur, F.H.; Djearamane, S.; Watanabe, A.; Aminuzzaman, M. Effect of Calcination Temperature on Structural, Morphological and Optical Properties of Copper Oxide Nanostructures Derived from Garcinia mangostana L. Leaf Extract. Nanomaterials 2022, 12, 3589. [Google Scholar] [CrossRef]
- Hafeez, M.; Shamim, W.; Ehsan, R.; Abdin, Z.U.; Din, S.U.; Haq, S.; Khan, A.; Shahida, S.; Hameed, U. Structural and biological investigation of biogenically synthesized titanium dioxide nanoparticles: Calcination and characterization. Microsc. Res. Tech. 2021, 84, 2372–2380. [Google Scholar] [CrossRef] [PubMed]
- Kim, M.G.; Kang, J.M.; Lee, J.E.; Kim, K.S.; Kim, K.H.; Cho, M.; Lee, S.G. Effects of Calcination Temperature on the Phase Composition, Photocatalytic Degradation, and Virucidal Activities of TiO2 Nanoparticles. ACS Omega 2021, 6, 10668–10678. [Google Scholar] [CrossRef] [PubMed]
- Manjula, P.; Boppella, R.; Manorama, S.V. A facile and green approach for the controlled synthesis of porous SnO2 nanospheres: Application as an efficient photocatalyst and an excellent gas sensing material. ACS Appl. Mater. Interfaces 2012, 4, 6252–6260. [Google Scholar] [CrossRef] [PubMed]
- Fu, L.; Zhen, Y.; Ren, Q.; Wang, A.; Deng, B. Green biosynthesis of SnO2 nanoparticles by plectranthus amboinicus leaf extract their photocatalytic activity toward rhodamine B degradation. J. Ovonic Res. 2015, 11, 21–26. [Google Scholar]
- Ramos-Castillo, C.M.; Rodríguez-Pérez, M.; Ruiz-Gómez, M.Á.; Rodríguez-Gattorno, G.; Villanueva-Cab, J. Synergistic Correlation in the Colloidal Properties of TiO2 Nanoparticles and Its Impact on the Photocatalytic Activity. Inorganics 2022, 10, 125. [Google Scholar]
- Yuan, H.; Xu, J. Preparation, Characterization and Photocatalytic Activity of Nanometer SnO2. Appl. Catal. B Environ. 2010, 1, 269–279. [Google Scholar] [CrossRef]
- Haq, S.; Rehman, W.; Waseem, M.; Rehan, J.; ur-Rehman, M.; Shahid, M. Effect of heating on the structural and optical properties of TiO2 nanoparticles: Antibacterial activity. Appl. Nanosci. 2018, 8, 11–18. [Google Scholar] [CrossRef]


Publisher’s Note: MDPI stays neutral with regard to jurisdictional claims in published maps and institutional affiliations. |
© 2022 by the authors. Licensee MDPI, Basel, Switzerland. This article is an open access article distributed under the terms and conditions of the Creative Commons Attribution (CC BY) license (https://creativecommons.org/licenses/by/4.0/).
Share and Cite
Haq, S.; Sarfraz, A.; Menaa, F.; Shahzad, N.; Din, S.U.; Almukhlifi, H.A.; Alshareef, S.A.; Al Essa, E.M.; Shahzad, M.I. Green Synthesis of NiO-SnO2 Nanocomposite and Effect of Calcination Temperature on Its Physicochemical Properties: Impact on the Photocatalytic Degradation of Methyl Orange. Molecules 2022, 27, 8420. https://doi.org/10.3390/molecules27238420
Haq S, Sarfraz A, Menaa F, Shahzad N, Din SU, Almukhlifi HA, Alshareef SA, Al Essa EM, Shahzad MI. Green Synthesis of NiO-SnO2 Nanocomposite and Effect of Calcination Temperature on Its Physicochemical Properties: Impact on the Photocatalytic Degradation of Methyl Orange. Molecules. 2022; 27(23):8420. https://doi.org/10.3390/molecules27238420
Chicago/Turabian StyleHaq, Sirajul, Anum Sarfraz, Farid Menaa, Nadia Shahzad, Salah Ud Din, Hanadi A. Almukhlifi, Sohad A. Alshareef, Ethar M. Al Essa, and Muhammad Imran Shahzad. 2022. "Green Synthesis of NiO-SnO2 Nanocomposite and Effect of Calcination Temperature on Its Physicochemical Properties: Impact on the Photocatalytic Degradation of Methyl Orange" Molecules 27, no. 23: 8420. https://doi.org/10.3390/molecules27238420