
Migration Modeling as a Valuable Tool for Exposure Assessment and Risk Characterization of Polyethylene Terephthalate Oligomers

1
Division of Molecular and Systems Toxicology, Department of Pharmaceutical Sciences, University of Basel, 4056 Basel, Switzerland
2
Swiss Centre for Applied Human Toxicology (SCAHT), University of Basel, 4055 Basel, Switzerland
3
Product Safety and Analytics Department, Fraunhofer Institute for Process Engineering and Packaging (IVV), 85354 Freising, Germany
*
Author to whom correspondence should be addressed.
Molecules 2023, 28(1), 173; https://doi.org/10.3390/molecules28010173
Submission received: 24 November 2022
/
Revised: 20 December 2022
/
Accepted: 23 December 2022
/
Published: 25 December 2022
(This article belongs to the Special Issue Food Packaging Materials)
Abstract
:Polyethylene terephthalate (PET) is one of the most widely used food contact materials due to its excellent mechanical properties and recyclability. Migration of substances from PET and assessment of compliance are usually determined by experimental testing, which can be challenging depending on the migrants of interest. Low concentrations and missing reference standards, among other factors, have led to inadequate investigation of the migration potential of PET oligomers. Migration modeling can overcome such limitations and is therefore a suitable starting point for exposure and risk assessment. In this study, the activation energy-based (EA) model and the AP model were used to systematically evaluate the migration potential of 52 PET oligomers for 12 different application scenarios. Modeling parameters and conditions were evaluated to investigate their impact and relevance on the assessment of realistic exposures. Obtained results were compared with safety thresholds known from the concept of toxicological thresholds of concern. This allowed the evaluation and identification of oligomers and/or applications where migration or exposure levels may be associated with a potential risk because they exceed these safety thresholds. Overall, this study demonstrated that migration modeling can be a high-throughput, fast, flexible, and suitable approach for comprehensive exposure assessment.
1. Introduction
Polyethylene terephthalate (PET) is currently one of the most widely used materials for food packaging in Europe [1] due to its advanced mechanical properties, clarity, low gas permeability, and relatively low costs [2,3,4]. It is utilized for the production of beverage bottles, packaging and microwave trays, blisters, and multilayer packaging films [1,4,5]. The compliance evaluation of such food contact articles is provided by specific and overall migration tests using food simulants under specific test conditions [6]. In addition to regulatory compliance, migration testing can also be used in support of exposure assessment and risk characterization for non-regulated substances such as non-intentionally added substances (NIAS) [7,8]. However, experimental migration testing is time-consuming, inflexible with respect to temperature variations and packaging system heterogeneity, and in many cases even impossible due to technical or analytical limitations, resulting in the lack of migration data for many NIAS [9,10,11,12].
PET oligomers can be considered as NIAS. The formation of polymer-specific oligomers is unavoidable and can generally be attributed to the thermal or hydrolytic degradation of polymer chains during production of food contact articles [13]. PET oligomers occur in crude and complex mixtures, at varying and often low concentrations, which require sophisticated analytical methods with low limits of detection and quantification. As a necessary prerequisite for quantification, reference standards must be available. The commercial availability of reference standards for PET oligomers, however, is very limited, impeding the experimental quantification of PET oligomers in food (simulants). In addition, the European regulation [6] includes the use of ethanolic food simulants for the compliance assessment of food contact materials (FCMs). However, PET in contact with aqueous ethanol mixtures causes swelling of the material, leading to overestimated migration of oligomers and other migrants [14,15,16]. Overestimating migration levels is beneficial for safety and regulatory compliance, but it is less useful for risk and exposure assessment as it can lead to an overestimation of the actual risk. Elevated temperatures during the migration experiments in combination with aqueous ethanol solutions may also force the formation, hydrolysis [17], or modification of oligomers, rendering the experimental conditions for realistic quantification and evaluation of migrated amounts of PET oligomers inappropriate [18]. Oligomers are usually identified through untargeted screening methods, which are useful for increasing knowledge on the identity of potential migrants [12,19,20,21]. However, these methods are less sensitive compared to targeted quantification and the analysis of complex mixtures is challenging; thus, the identification of all substances, especially those present at low concentrations, is usually not feasible. Therefore, it can be anticipated that some oligomers that migrate from PET remain un-identified.
PET oligomers are not regulated by the European packaging legislation and therefore no specific migration limits have been established, nor has any risk assessment been conducted to date. This also applies to most oligomers originating from other packaging materials. A common practice to circumvent this safety gap is to restrict the migration of oligomers (<1000 g/mol) by applying migration limits of 50 µg/kg [22,23]. Another and more general approach is the use of the toxicological threshold of concern (TTC) concept to estimate Cramer classifications for oligomers and to set migration values into a toxicological assessment context [24,25]. Linear PET oligomers were previously categorized as Cramer Class I substances with an respective exposure limit of 30 µg/kg body weight/day and cyclic oligomers as Cramer Class III substances with a lower exposure limit of 1.5 µg/kg body weight/day [26]. Considering the many hurdles mentioned above, testing migration to such thresholds is challenging, leading to knowledge gaps and uncertainties regarding consumer exposure and risk assessment of these substances. Thus, alternative approaches are urgently needed.
Significant progress has been made in migration modeling over the past two decades [10,27,28,29,30]. It was demonstrated that the prediction of migration can not only overcome experimental limitations, but is also a substantially faster and often more appropriate approach for realistic exposure assessments and low-diffusion food contact materials such as PET. Further development of methods for predicting diffusion coefficients resulted in the validation of the first parameters for diffusion modeling for PET, confirming the applicability of the methodology used in the present study [9]. These advances and the existing limitations associated with experimental testing offer migration modeling as a tool that can be considered a suitable and even more high-throughput type alternative for assessing compliance of PET packaging materials.
In order to understand the potential migration of PET oligomers under realistic conditions of use, migration modeling was employed in this study. The goal of this evaluation was to determine the potential level of consumer exposure that may be linked to specific oligomers and/or applications. Through this work, we aimed to show the usefulness of migration modeling for PET oligomers and its ability to support the compliance and risk assessment process for this group of substances.
2. Results and Discussion
2.1. PET Oligomers for Migration Modeling
For the migration modelling approach, 33 previously identified PET oligomers and 19 hypothetical molecules that are potentially present in the polymer were selected (Table 1). The reported oligomers were extracted from the FCCmigex database [31,32]. The reasoning for the structure of the hypothetical oligomers is based on the molecular weight (MW), reported oligomers, and the chemistry used for synthesis. PET hexamers were chosen as a threshold size for the inclusion of oligomers in this study, with the exception of the first series of oligomers, where it is the octamer. These size thresholds were chosen because larger oligomers significantly exceed a molecular weight of 1000 g/mol. Such substances are associated with a much lower intestinal absorption potential after exposure, resulting in a reduced risk to the consumer [6]. In the polymerization process of PET, terephthalic acid (TPA) or terephthalic acid dimethyl ester are used as main monomers together with ethylene glycol (EG) [33]. To adapt the properties of the PET packaging materials, isophthalic acid (IPA) can be used as a co-monomer. Accordingly, PET oligomers are substances built up from TPA and EG, may be linear or cyclic, and each TPA may be replaced by an IPA unit. Additional EG units such as diethylene glycol (DEG) can also be introduced into the oligomers as a side reaction, leading to a complex situation due to the high number of possible additional isomers. However, the migration and also its prediction are the same or comparable for all isomers, since the identical molecular weight (MW) or nearly identical molecular volumes (MV) are used for migration modeling for such substances.
The selection of oligomers used in this study is represented in Table 1 and individually listed substances represent a group of isomers. Molecular volumes were predicted with the online tool “molinspiration” [34], using the isomers described in more detail in Table S1. The nomenclature based on acronyms and the common chemical names was used from previous reports [35]. The following abbreviations were used for the nomenclature of the PET oligomers: C (cyclic structure), L (linear structure), TPA (terephthalic acid), EG (ethylene glycol), DEG (diethylene glycol).
2.2. Dependence of the Migration on the Diffusion Coefficient
The mass transfer (migration) of substances from FCMs into food or drinks depends on various factors: The concentration of the substance in the material (CP,0), contact time and temperature, diffusion coefficient (DP), partition coefficient (KP/F), surface-to-volume ratio, thickness of the material, and the type of material [7,14,36,37]. If all these factors are known, migration into food or drinks can be predicted by use of diffusion modeling. However, DP is usually unknown for oligomers from FCMs. To address this knowledge gap, several diffusion coefficient prediction models have been developed. Most of these prediction models are over-estimative, which means that the predicted diffusion coefficient is higher, resulting in a (significantly) higher predicted migration compared to real migration into food. For compliance evaluation purposes of PET packaging materials, such overestimative approaches are useful [7,10], because the migration of the oligomers is predicted as worst-case. However, for exposure evaluation and risk assessment, realistic diffusion coefficients should be available. So far, validated parameters that allow realistic diffusion modeling for PET are available for one model [9,14]. The main difference to other models is that this prediction model is based on experimentally determined activation energies of diffusion EA [14], whereas the conventional prediction model is based on a fixed activation energy of 100 kJ/mol for all migrants independent from their molecular weight or volume. Consideration of activation energies is important because activation energies describe the effect of temperature on diffusion coefficients DP. This is important if elevated temperatures are applied, as it is the case for PET microwave and ovenable trays.
Comparison of experimentally reported and predicted diffusion coefficients helps to determine differences and applicability of DP predictions and their models for PET oligomers. Since only diffusion coefficients at high temperatures and for the first series cyclic trimer C[TPA+EG]3 were available in the literature [5], the comparisons were limited to this oligomer and reported conditions. Diffusion coefficients were predicted using the activation energy-based (EA-based) model [14] as well as the AP model (realistic case and upper limit) [7,38] (Table 2). The AP parameter describes the basic diffusion behavior of the PET polymer matrix towards the diffusion of migrants. The results show that the reported diffusion coefficients (DP) for the cyclic PET trimer C[TPA+EG]3 [5] are in great alignment with the predicted DP from the activation energy EA-based and the AP model (realistic case). The AP model (upper limit) is intentionally overestimative, as reflected in the much higher diffusion coefficients compared to the other two models, making it less suitable for realistic migration modeling and thus for this study.
It should be noted, that the diffusion coefficients are determined at very high temperatures of 115–176 °C. The activation energy-based model is validated only for temperature of about 120 °C [9]. Therefore, the comparison of the diffusion coefficients of the cyclic PET trimer at 149 °C and 176 °C is subject to some uncertainty despite their comparability. However, as mentioned above, the activation energy-based prediction model is considering the influence of temperature on the diffusion coefficients on the individual substances. This leads to a more realistic prediction at all temperatures [9] compared to the AP model with a fixed activation energy. The activation energy based prediction model is therefore an applicable method and important to realistically evaluate PET oligomers and their migration potential at different temperatures. Due to the fact, that the AP model is still recommended as standard prediction model for migration prediction [7,37], both prediction models were used in this study.
2.3. Dependence of the Migration on the Partition Coefficient
Along with the diffusion coefficient (DP), the partition coefficient (KP/F) is an additional factor that contributes to the migration modeling results. A major limitation is that for NIAS the partition coefficient between PET and food (simulants) is generally unknown and no practical or validated prediction models for partition coefficients are available. On the other hand, the partition coefficient plays only a role when the equilibrium between the polymer and the contact medium is (nearly) reached [39]. This means that the influence of partitioning is increased with increasing diffusion (e.g., small molecules and/or high temperatures) or the FCM has a (very) low thickness [40]. The impact of partitioning can be assessed and was successfully demonstrated by evaluating the migration under conditions using two different partition coefficients, representing high or low partitioning for simulations [39]. To investigate the contribution of the partition coefficient for PET oligomers, migration of all 52 molecules was simulated for KP/F = 1 and KP/F = 1000 in agreement with the JRC Modeling guidance document [7]. KP/F = 1 can be considered as good solubility of the oligomer in food (worst-case), whereas KP/F = 1000 simulates low solubility of the oligomers in food (best-case). The impact of the partition coefficient on the migration of PET oligomers was calculated for five different applications (time/temperature) with temperatures between 25 °C and 100 °C and application times of 10 min up to 365 days (d). In addition, two different material thicknesses of 10 µm and 2 mm were used to determine whether the effect changes with the thickness and thus the different use of the PET material. The deviations of the results expressed in percent (%) deviation between KP/F = 1 and KP/F = 1000 are summarized in Table 3. The diffusion coefficients used for the migration calculation were predicted either from the EA-based model (marked with EA) or the AP model (marked with AP). The color gradient in Table 3 indicates impact of KP/F with colorless to dark red with increasing impact.
The following conditions were used for the predictions:
Initial concentration in the polymer (CP,0) = 1000 mg/kg (has no influence, because the impact is expressed in % as a relative concentration);
Material thickness of 10 µm or 2 mm, which represents the two extremes in PET food contact applications;
Surface-to-volume ratio of 6 dm2 per 1 kg food, which is the typical ratio used for compliance evaluation, when no further information is available.
The following application conditions (temperatures and time) were used:
Condition 1: 25 °C for 365 d;
Condition 2: 40 °C for 60 d;
Condition 3: 70 °C for 30 min;
Condition 4: 100 °C for 10 min;
Condition 5: 100 °C for 2 h.
The same results were obtained for the two material thicknesses 10 µm and 2 mm. For the EA-based and the AP model, the results for both conditions are shown combined in Table 3. Typically, PET trays or bottles, which are the major applications of PET in the food packaging market, are between these two extremes and have a layer thickness of 200–300 µm. Thus, the material thickness can be neglected, since it has no influence on the migrated amount of the oligomers and is therefore independent of the application conditions used in this study. Considering a variability of ≤10% as acceptable (no dependency on KP/F), as this is a common variability of migration in experimental tests [39], no dependency on KP/F for the EA-based model for all oligomers in applications with low temperatures ≤ 25 °C, even under long-term storage conditions of up to 365 days was observed. The dependency of KP/F is identical for applications at 100 °C (10 min and 2 h), reaching up to 16% deviation for the smallest molecules (<205 Å3, 236 g/mol). When diffusion coefficients were predicted with the AP model, the influence of the partition coefficients is generally higher. This is due to the fact that for the AP model the diffusion coefficients are significantly higher compared to the EA-based model. When using diffusion coefficients from the AP model, KP/F has an impact of up to 28% on the predicted migration already for conditions at 25 °C (365 d) and 40 °C (60 d) for oligomers ≤ 342 Å3 (402 g/mol) and exhibits an even stronger deviation of up to 40% at 100 °C (10 min and 2 h) for molecules ≤ 427 Å3 (491 g/mol).
For the interpretation of the results it is important to notice, that typical storage conditions of PET packed food is at ambient temperature. In addition, many of the oligomers are high molecular weight substances. Therefore, for conditions at ambient or elevated temperatures the partition coefficient is negligible in the migration calculations for PET (EA-based model) and should to be considered for oligomers ≤ 342 Å3 (402 g/mol) for the AP model. In case of heating applications, the partition coefficient should be taken into account for oligomers < 205 Å3 (236 g/mol) for the EA-based model and ≤ 427 Å3 (491 g/mol) for the AP model. However, as mentioned above, the partition is in most cases unknown. Therefore, two calculations should be made, one with a low (KP/F = 1, worst-case) and one with a high partition coefficient (KP/F = 1000, best-case) in order to estimate the concentration range of the predicted migration.
2.4. Migration Modeling of PET Oligomers
To evaluate the migration potential of PET oligomers, 12 different storage or application scenarios were used for predictions. These conditions include applications such as storage at ambient or elevated temperatures (25 °C or 40 °C, respectively) for beverage bottles and short-term or long-term heating applications (70 °C or 100 °C) for microwaveable or ovenable trays (see Materials and Methods for details). A maximum application temperature of 100 °C was selected, based on typical application conditions for PET and assuming that the water content in food dominates and therefore most foods will not reach temperatures higher than 100 °C [41]. In addition to the application conditions, DP, KP/F, and the initial concentrations of migrants within the polymer (CP,0) are needed for migration predictions and were collected from the literature for all PET oligomers [5,13,18,31,32,35,42,43,44,45,46,47,48,49]. For 29 out of 52 oligomers data on CP,0 was available. For four oligomers, the distribution of diethylene glycol units was not defined and therefore the CP,0 values could not be assigned to a single isomer. For all other oligomers, the CP,0 values correspond to the molecules and their respective SMILES as defined in Table S1. Where multiple concentration values were reported for an oligomer, the values were combined into a range for each literature source (Table S2).
To predict migration within a realistic range and compare results, the lowest and highest CP,0 value (CP,0 min and CP,0 max, respectively) was used to predict the migration for each oligomer. Identical CP,0 max and CP,0 min values were used for oligomers with only one CP,0 value (Table S2). Migration predictions were performed with all 12 application conditions using the EA-based model as well as the AP model (realistic case). For all molecules for which a dependency on partitioning was identified (deviation of >10%, Table 3) migration predictions were performed using both partition coefficients KP,F = 1 and KP,F = 1000. For all other oligomers only one partition coefficient, KP/F = 1, was used for the predictions. The obtained migration values were then set into a chemical risk assessment context and the migration was compared to thresholds usually applied for potential DNA-reactive mutagens/carcinogens (0.0025 µg/kg body weight/day), Cramer Class I (30 µg/kg body weight/day), and Cramer Class III (1.5 µg/kg body weight/day) substances. A conventional assumption for evaluating migration and exposure levels in adults is the daily consumption of 1 kg of food by a 60 kg person and that the food is packaged in a cubic container with a surface area of 6 dm2 [6]. Therefore, migration thresholds corresponding to daily exposure levels for adults can be set at 1.8 mg/kg food for linear PET oligomers, categorized as Cramer Class I substances (if no DNA-reactive mutagens/carcinogens), 90 µg/kg food for cyclic oligomers, categorized as Cramer Class III substances (if no DNA-reactive mutagens/carcinogens), and 0.15 µg/kg food for DNA-reactive mutagens/carcinogens. The results are graphically summarized in Figure 1 and Figures S1–S4 for the EA-based model and in Figure 2 and Figures S5–S8 for the AP model. Predicted values for all oligomers applying all conditions and parameters are available in the Supplementary Material.
As expected, migration decreases with decreasing concentrations of the migrant in the polymer, resulting in lower migration predictions for CP,0 min compared to CP,0 max. Additionally, there is a general reduction in migration for the food contact articles in the order 500 mL bottle > 1000 mL bottle > 1500 mL bottle and for rectangular tray > round tray, which is due to the reduction in the surface-to-volume ratios in the same order. Migration is a process that depends on temperature as well as time [7], and a decrease in migration can also be observed following the order: (100 °C, 2 h) > (100 °C, 10 min) > (40 °C, 60 days) > (70 °C, 30 min) > (25 °C, 365 days). Comparing the predictions of the EA-based model with those of the AP model, migration is higher for all conditions due to the consideration of higher diffusion coefficients in the AP model. Despite this difference, both prediction models show similar trends. For neither of the models, the linear oligomers exceed the Cramer Class I threshold under all applied conditions and both CP,0 concentrations. Additionally, no Cramer Class III threshold violation was observed for cyclic oligomers when CP,0 min values were used. Only one oligomer, the cyclic trimer C[TPA+EG]3 for the EA-based model (Figure 1b) and two oligomers, the first series cyclic trimer C[TPA+EG]3 and first series cyclic tetramer C[TPA+EG]4 for the AP model (Figure 2b), exceed the Cramer Class III threshold by applying CP,0 max values. The main difference between the models is that for the EA-based model this can only be observed for a single heating condition (rectangular tray, 100 °C, 2 h) (Figure 1b). In the AP model, C[TPA+EG]3 exceeds the Cramer Class III threshold already at 25 °C (365 d) for all bottle sizes and the C[TPA+EG]4 for the 500 mL bottle (Figure S5b). The cyclic trimer exceeds for the rectangular tray at 70 °C (30 min) (Figure S7b) and for both trays at 100 °C (10 min and 2 h) the Cramer Class III threshold (Figure 2b and Figure S8b). C[TPA+EG]4 violates the Cramer Class III threshold at 100 °C (2 h) for the rectangular tray (Figure 2b). In case of oligomers, for which migration was also predicted with KP/F = 1000, the partition coefficient had no influence on the interpretation of the result, i.e., whether a threshold was violated or not, and can therefore be neglected. Considering the Cramer I and III safety thresholds to be applicable, these results show that for almost all oligomers and conditions used in this study, no significant risk to the consumer can be expected. On the other hand, the first series cyclic trimer has been regularly detected at high concentrations in migration studies and was even detected in human blood [50]. Therefore, a more thorough evaluation is strongly recommended for C[TPA+EG]3 to determine whether the elevated concentration in food may pose a risk to consumers.
Besides the comparison of predicted migrations to Cramer Class I and III thresholds, an additional evaluation was conducted using the threshold for DNA-reactive mutagens and carcinogens. Given the very low allowable concentration (0.15 µg/kg) of such substances, exceedances of the threshold were observed for almost all oligomers under heating conditions and for both prediction models (Figure 1a and Figure 2a). However, when applying the EA-based model for conditions at 25 °C up to 70 °C, the majority of oligomers do not exceed the safety threshold for DNA-reactive mutagens/carcinogens (Figure 1a). For the AP model, in contrast, the results at 25 °C are comparable to those at 100 °C and migration levels are even higher at 25 °C for 365 d (Figure S5a and Figure 2a). The minor difference between those conditions is due the fixed activation energies in the AP model, not correctly considering the temperature influence on the diffusion coefficient DP. When comparing the impact of the partition coefficient KP,F on the migration predictions between the two models, KP/F is again neglectable for the EA-based model, but has to be considered for the AP model when interpreting the results. In case of, for example, the first series cyclic monomer C[TPA+EG] and using CP,0 min for predictions, the migration would be above the threshold with KP/F = 1, but below the threshold for KP/F = 1000. These results show that for exposure assessments it is important to be aware of the differences between the available prediction models for diffusion coefficients as well as the impact of the different parameters and conditions on the migration process.
As almost all oligomers migrate under several conditions at levels above the safety threshold of DNA-reactive mutagens/carcinogens, it is important to further evaluate these substances by in silico and/or in vitro genotoxicity testing. This has already been partially studied in an initial in silico assessment, in which many oligomers, also included in the present study, were investigated using various available genotoxicity assessment tools. None of the oligomers evaluated was found to be of concern due to potential genotoxicity [26]. Given the structural similarity of the oligomers examined in the present study, sharing the same functional groups and differing essentially only in size, it can be assumed that this can be applied to the entire group of oligomers. However, for confirmation purposes, an additional in vitro evaluation with a selection of representative oligomers should be considered.
It is important to mention that the comparison with the safety thresholds has been performed on the basis of reported concentrations of the oligomers in the literature [5,13,18,31,32,35,42,43,44,45,46,47,48,49]. These CP,0 values are therefore snapshots of the PET materials investigated in these previously reported studies and might not be generally applicable for all PET packaging materials. In addition, the oligomeric content of PET FCMs might be influenced by the process conditions and recyclate content. In a circular study on PET bottles, a loop of 11 recycling cycles has been performed [51]. The concentrations of seven oligomers have been monitored during the recycling cycles, and as a general trend the concentrations of the oligomers were decreasing with increasing numbers of recycling cycles. Due to the increasing use of recyclates in all kind of PET packaging materials, the concentration of the PET oligomers might decrease, which has a positive influence on the safety evaluation conducted in this section.
2.5. Modeling of CP,0 for PET Oligomers
As mentioned above, the concentrations of PET oligomers are often unknown for each PET packaging on the market. In addition, (future) trends like the increasing use of recyclates in PET packaging might change the concentrations of PET oligomers in FCMs. Therefore, the safety evaluation in the previous section is a snapshot for the concentrations of the oligomers reported in the literature (Table S2). Because of this uncertainty, another method of evaluation, a reversed migration approach, was used in this study. Based on the same contact conditions and predicted diffusion coefficients, the concentration (CP,0) in the packaging material was calculated, which corresponds to the migration limits for all three conditions using thresholds for Cramer Class I and III substances, and DNA-reactive mutagens/carcinogens (1.8 mg/kg, 90 µg/kg, and 0.15 µg/kg, respectively). This theoretical CP,0 can be considered as the maximum concentration in the PET without violation of the above-mentioned migration threshold limits. All calculations were performed using migration predictions with KP/F = 1 and therefore to evaluate the worst-case and thus the minimum tray or bottle wall concentrations (CP,0) required to reach these thresholds.
The obtained results reflect the trends observed and discussed for migration predictions. With decreasing surface-to-volume and increasing molecular volume, an increase in the bottle or tray wall concentration is required to achieve migrations in the range of the respective safety threshold. Additionally, tray or bottle wall concentrations have to be generally higher in the EA-based model compared to the AP model due to the differences in diffusion coefficients DP (Figure 3). To assess the probability and associated risk of reaching the individual thresholds, a value of 1% (w/w) was assumed as a realistic and applicable limit. Concentrations above 1% are considered unlikely in this study, since even for the most abundant as well as tested first series cyclic trimer, concentrations > 1% were not observed (Table S2). A limit of 1% also results in high confidence in the results and interpretation, since for concentrations up to 1% the validity of the generally accepted physical law of diffusion is given [7].
Therefore, a threshold concentration of 1% was used for the evaluation of the calculated CP,0, with concentrations below this limit being more likely to be observed in PET articles than concentrations above it. The obtained results showed that for both models a migration level of 0.15 µg/kg can be reached with CP,0 < 1% for almost all oligomers and used conditions. Some exceptions are molecules with high MV, ≥849 Å3 for conditions at 25 °C (365 d), ≥1289 Å3 at 40 °C (60 d), and ≥1104 Å3 at 70 °C (30 min, only round tray) when using the EA-based model (Figure 3a,c). However, as discussed above, none of the previously analyzed oligomers showed in silico results of concern, so the application of the threshold for DNA-reactive mutagens and carcinogens is most certainly not a requirement to ensure consumer safety. However, based on the publicly available data, this cannot be categorically excluded at this stage.
The CP,0 concentrations required to reach migrations of 90 µg/kg (Cramer Class III) are significantly higher for all conditions (Figure 3b,d). As a result, when the EA-based model is applied, only very small oligomers ≤ 205 Å3 at 25 °C (365 d), ≤223 Å3 at 40 °C (60 d), and ≤384 Å3 at 70 °C (30 min) or 100 °C (10 min) and also for oligomers with higher MV of ≤646 Å3 at 100 °C (2 h) reach this threshold with CP,0 concentration below 1%. In contrast, for almost all oligomers (≤1146 Å3) concentrations below 1% are sufficient to reach migration levels of 90 µg/kg when applying the AP model for conditions at ambient or elevated temperatures. For short-term heating applications (70 °C, 30 min and 100 °C, 10 min), oligomers ≤ 892 Å3 reach the threshold with CP,0 concentrations below 1%, while for long-term heating applications (100 °C, 2 h), this is the case for even almost all oligomers (≤1146 Å3). At this point it must be mentioned that a calculated CP,0 of >1 × 10⁶ mg/kg corresponds to a content of > 100% of the oligomer in the polymer, which is of course not possible and reasonable. However, these values were not removed because they reflect clearly the impossibility of exceeding or even reaching the respective safety threshold, as they would require concentrations that simply cannot exist. In such cases it can be clearly ruled out that such conditions will ever pose a safety risk. This becomes even more clear for concentrations needed to reach migrations of 1.8 mg/kg (Cramer Class I) (Figure S9). At ambient and elevated temperatures, all oligomers require concentrations of >1% for both models and even almost all >100% with the EA-based model. This results are also comparable for all heating applications and all oligomers ≥ 266 Å3, with one exception for oligomers ≤ 427 Å3 at 100 °C for 2 h and the rectangular tray (AP model). Reaching migration levels of 1.8 mg/kg is therefore very unlikely, and linear oligomers can be considered safe for most applications. However, evaluation of small oligomer under especially long-term heating applications is still recommended.
This results show that even with the lack of CP,0 values and exposure evaluation can be performed in a systematic way identifying conditions and/or oligomers of more or less concern. This can very helpful for prioritization purposes in the risk assessment context. Another advantage of this approach is that these maximum concentrations of the oligomers in PET can be used as reliable quality parameters for monitoring production [36].
3. Materials and Methods
3.1. Diffusion Modelling
AKTS SML software version 4.54 and 6.41 (AKTS AG, Siders, Switzerland) was used for the modeling of all migrations. The model is based on a Finite Element Analysis (FEA) and a description of the diffusion model is published [52]. The molinspiration online tool [34] was used for the calculation of molecular volumes (MV) for all PET oligomers. For the activation energy-based EA model the validated parameters for the prediction of the diffusion coefficient were: a = 1.93 × 10⁻³ 1/K, b = 2.37 cm2/s, c = 11.1 Å3 and d = 1.50 × 10⁻⁵ 1/K [9,14]. For the prediction of diffusion coefficients with the AP model the following parameter were used: A’P = 3.1 and τ = 1577 (realistic case) or A’*P = 6.4 and τ = 1577 (upper limit) [7,10,38].
3.2. Properties and Parameters Used for Migration Modeling
Properties and parameters applied for the predictions were used according to Table 4, Tables S1 and S2, unless otherwise stated. Storage/application conditions for beverage bottles were used and adjusted based on the exposure study conducted in Munich, Germany, in 2007 [40] and the guideline for testing of kitchenware articles [53]:
End of shelf-life under controlled storage conditions: 365 days, 25 °C;
Short-term non-controlled/extreme summer storage condition: 60 days, 40 °C;
Short-term heating in microwave or oven: 10 min, 100 °C or 30 min, 70 °C;
Long-term heating in oven: 2 h, 100 °C.
The temperature of 100 °C was chosen under assumption that the water content in food is dominating and therefore most food will reach not temperatures higher than 100 °C [41].
4. Conclusions
Experimental migration tests on PET oligomers are time consuming and the results are associated with considerable uncertainty, mainly due to the lack of reference standards for most oligomers. The low concentrations in the migration solutions as well as potential swelling effects or hydrolysis when using aqueous ethanolic solutions as food simulants, make the interpretation of the results very difficult.
The use of migration models represents a useful tool for the safety evaluation of PET oligomers. However, diffusion coefficients need to be available for all PET oligomers. Experimentally determined diffusion coefficients are rare in the scientific literature and only available at very high temperatures for the PET first series cyclic trimer. Therefore, prediction models for diffusion coefficients DP are necessary for the migration modeling approach. The results for the diffusion coefficients depend on the prediction model for the diffusion coefficients, based on the over-estimative character of the applied prediction model.
Small oligomers with high diffusion coefficients are the most critical substances that can also pose the greatest risk to consumers, especially when the storage conditions include high temperatures, e.g., in microwave or ovenable trays. In these cases, the prediction model for the diffusion coefficients should include the influence of temperature on the diffusion coefficients. This makes the EA-based model more suitable for a realistic evaluation of the consumer exposure. In addition, the EA-based prediction model is validated for many different substances and temperatures, resulting in a more realistic modeling approach and therefore a more reliable exposure prediction of oligomers. However, the over-estimative AP prediction model can be also applied, resulting in a more conservative evaluation of the results, when typical concentrations available from the literature are applied.
The second major parameter influencing the migration process, the partition coefficient KP,F, plays a minor role and can be neglected in most cases. This is due to the slow diffusion of high molecular weight compounds like PET oligomers in PET. If the partition coefficient can be neglected, the procedure is simplified, because KP,F = 1 can be used for worst-case prediction. In case of doubts, e.g., for small molecules and/or high temperatures a second modeling test should be performed with KP,F = 1000 in order to investigate the influence on partitioning on the predicted migration results.
The third important parameter in the exposure evaluation of PET is the concentration of oligomers in PET (CP,0). These values are often not available from the scientific literature or might change in the future due to increase recyclate content or optimized production conditions. Calculation of the maximum concentration of oligomers in PET solves this problem, and as a positive side effect, reliable quality control parameters are available for production control. The evaluation of CP,0 required to reach safety threshold can be a very useful way of exposure assessment by helping to identify conditions that are more or less likely to be reached and therefore associated with higher or lower risk for the consumer, respectively. This approach can also be readily applied to evaluate the relevance of concentrations associated with observed adverse effects or for other populations with lower safety limits. Additionally, it can further be used for other migrants in PET as PET oligomers.
As an overall conclusion of this study, migration modeling represents a very helpful tool for a systematic exposure evaluation and prioritization of oligomers and/or conditions of concern. It provides a fast, comparable, and comprehensive overview that can easily be used for risk assessment purposes on the migration properties of PET oligomers besides the lack of migration testing data. In addition to the generally known evidence that heating applications and small molecules are of greater concern than low temperature conditions and large oligomers, this study could provide specific numbers needed for a comprehensive exposure assessment for this particular group of substances.
Supplementary Materials
The following supporting information can be downloaded at: https://www.mdpi.com/article/10.3390/molecules28010173/s1, Table S1: SMILES and CAS Registry Numbers (CAS RN) of PET oligomers used for migration predictions; Table S2: Reported concentrations (CP,0) for PET oligomers in food contact materials; Figure S1 to S4: Graphical representation of predicted migrations using the EA based model for (25 °C, 365 d), (40 °C, 60 d), (70 °C, 30 min), and (100 °C, 10 min); Figure S5 to S8: Graphical representation of predicted migrations using the AP model for (25 °C, 365 d), (40 °C, 60 d), (70 °C, 30 min), and (100 °C, 10 min); Figure S9: Maximum bottle and tray wall concentrations (CP,0) of all oligomers corresponding to a migration of 1.8 mg/kg, calculated for the EA based model (grey) and the AP model (blue); Excel sheet: Predicted migration values for all oligomers and conditions summarized Figure 1, Figure 2 and Figures S2–S8.
Author Contributions
Conceptualization, V.N.S. and F.W.; methodology, V.N.S.; validation, V.N.S. and F.W; investigation, V.N.S.; writing—original draft preparation, V.N.S.; writing—review and editing, A.O. and F.W.; visualization, V.N.S.; supervision, A.O. and F.W.; project administration, V.N.S.; funding acquisition, A.O. All authors have read and agreed to the published version of the manuscript.
Funding
This research was funded by Swiss Federal Food Safety and Veterinary Office (FSVO), contract number 0714001652.
Institutional Review Board Statement
Not applicable.
Informed Consent Statement
Not applicable.
Data Availability Statement
The data presented in this study are available on request from the corresponding author.
Acknowledgments
We would like to thank Vincent Dudler from the Federal Food Safety and Veterinary Office (FSVO) who kindly provided the license for the AKTS SML software. During the completion of the manuscript we received the sad news of the passing away of Otto Piringer. He pioneered diffusion modelling and was the father of the AP model, used within our study. We will keep Otto Piringer in fond memory.
Conflicts of Interest
The authors declare no conflict of interest.
Sample Availability
Not applicable.
References
- Plastics Europe Plastics—The Facts 2021. Available online: https://plasticseurope.org/wp-content/uploads/2021/12/Plastics-the-Facts-2021-web-final.pdf (accessed on 29 October 2022).
- Welle, F. The facts about PET, European Federation of Bottled Water. 2018. Available online: https://www.petcore-europe.org/images/news/pdf/factsheet_the_facts_about_pet_dr_frank_welle_2018.pdf (accessed on 29 October 2022).
- Ma, J.; Yu, L.; Chen, S.; Chen, W.; Wang, Y.; Guang, S.; Zhang, X.; Lu, W.; Wang, Y.; Bao, J. Structure-property evolution of poly(ethylene terephthalate) fibers in industrialized process under complex coupling of stress and temperature field. Macromolecules 2019, 52, 565–574. [Google Scholar] [CrossRef]
- Thoden van Velzen, E.U.; Brouwer, M.T.; Stärker, C.; Welle, F. Effect of recycled content and rPET quality on the properties of PET bottles, Part II: Migration. Packag. Technol. Sci. 2020, 33, 359–371. [Google Scholar] [CrossRef]
- Begley, T.H.; Hollifield, H.C. Evaluation of polyethylene terephthalate cyclic trimer migration from microwave food packaging using temperature-time profiles. Food Addit. Contam. 1990, 7, 339–346. [Google Scholar] [CrossRef] [PubMed]
- Commission Regulation (EU) No 10/2011 on plastic materials and articles intended to come into contact with food. Available online: https://eur-lex.europa.eu/LexUriServ/LexUriServ.do?uri=OJ:L:2011:012:0001:0089:en:PDF (accessed on 29 October 2022).
- Brandsch, R.; Dequatre, C.; Mercea, P.; Milana, M.R.; Stoermer, A.; Trier, X.; Vitrac, O.; Schaefer, A.; Simoneau, C. Practical Guidelines on the Application of Migration Modelling for the Estimation of Specific Migration. 2015. Available online: https://op.europa.eu/en/publication-detail/-/publication/1b79bc61-97f6-11e5-983e-01aa75ed71a1/language-en (accessed on 29 October 2022).
- Grob, K.; Pfenninger, S.; Pohl, W.; Laso, M.; Imhof, D.; Rieger, K. European legal limits for migration from food packaging materials: 1. Food should prevail over simulants; 2. More realistic conversion from concentrations to limits per surface area. PVC cling films in contact with cheese as an example. Food Control 2007, 18, 201–210. [Google Scholar] [CrossRef]
- Ewender, J.; Welle, F. A new method for the prediction of diffusion coefficients in poly(ethylene terephthalate)—Validation data. Packag. Technol. Sci. 2022, 35, 405–413. [Google Scholar] [CrossRef]
- Begley, T.; Castle, L.; Feigenbaum, A.; Franz, R.; Hinrichs, K.; Lickly, T.; Mercea, P.; Milana, M.; O’Brien, A.; Rebre, S.; et al. Evaluation of migration models that might be used in support of regulations for food-contact plastics. Food Addit. Contam. 2005, 22, 73–90. [Google Scholar] [CrossRef] [PubMed] [Green Version]
- Poças, M.F.; Oliveira, J.C.; Brandsch, R.; Hogg, T. Feasibility study on the use of probabilistic migration modeling in support of exposure assessment from food contact materials. Risk Anal. 2010, 30, 1052–1061. [Google Scholar] [CrossRef]
- Nerin, C.; Alfaro, P.; Aznar, M.; Domeño, C. The challenge of identifying non-intentionally added substances from food packaging materials: A review. Anal. Chim. Acta 2013, 775, 14–24. [Google Scholar] [CrossRef]
- Hoppe, M.; Fornari, R.; de Voogt, P.; Franz, R. Migration of oligomers from PET: Determination of diffusion coefficients and comparison of experimental versus modelled migration. Food Addit. Contam. Part A 2017, 34, 1251–1260. [Google Scholar] [CrossRef]
- Welle, F. A new method for the prediction of diffusion coefficients in poly(ethylene terephthalate). J. Appl. Polym. Sci. 2013, 129, 1845–1851. [Google Scholar] [CrossRef]
- Franz, R.; Gmeiner, M.; Gruner, A.; Kemmer, D.; Welle, F. Diffusion behaviour of the acetaldehyde scavenger 2-aminobenzamide in polyethylene terephthalate for beverage bottles. Food Addit. Contam. Part A 2016, 33, 364–372. [Google Scholar] [CrossRef] [PubMed] [Green Version]
- Gehring, C.; Welle, F. Migration testing of polyethylene terephthalate: Comparison of regulated test conditions with migration into real food at the end of shelf life. Packag. Technol. Sci. 2018, 31, 771–780. [Google Scholar] [CrossRef]
- Paseiro-Cerrato, R.; Noonan, G.O.; Begley, T.H. Evaluation of long-term migration testing from can coatings into food simulants: Polyester coatings. J. Agric. Food Chem. 2016, 64, 2377–2385. [Google Scholar] [CrossRef] [PubMed]
- Begley, T.H.; Hollifield, H.C. High-performance liquid chromatographic determination of migrating poly(ethylene terephthalate) oligomers in corn oil. J. Agric. Food Chem. 1990, 38, 145–148. [Google Scholar] [CrossRef]
- Omer, E.; Cariou, R.; Remaud, G.; Guitton, Y.; Germon, H.; Hill, P.; Dervilly-Pinel, G.; le Bizec, B. Elucidation of non-intentionally added substances migrating from polyester-polyurethane lacquers using automated LC-HRMS data processing. Anal. Bioanal. Chem. 2018, 410, 5391–5403. [Google Scholar] [CrossRef]
- Bauer, A.; Jesús, F.; Gómez Ramos, M.J.; Lozano, A.; Fernández-Alba, A.R. Identification of unexpected chemical contaminants in baby food coming from plastic packaging migration by high resolution accurate mass spectrometry. Food Chem. 2019, 295, 274–288. [Google Scholar] [CrossRef]
- Sapozhnikova, Y.; Nuñez, A.; Johnston, J. Screening of chemicals migrating from plastic food contact materials for oven and microwave applications by liquid and gas chromatography—Orbitrap mass spectrometry. J. Chromatogr. A 2021, 1651, 462261. [Google Scholar] [CrossRef]
- Schmid, P.; Welle, F. Chemical migration from beverage packaging materials—A review. Beverages 2020, 6, 37. [Google Scholar] [CrossRef]
- Bolognesi, C.; Castle, L.; Cravedi, J.-P.; Engel, K.-H.; Fowler, P.; Franz, R.; Grob, K.; Gürtler, R.; Husøy, T.; Mennes, W.; et al. Scientific Opinion on the safety assessment of the substance, furan-2, 5-dicarboxylic acid, CAS No 3238-40-2, for use in food contact materials. EFSA J. 2014, 12, 3866. [Google Scholar] [CrossRef] [Green Version]
- More, S.J.; Bampidis, V.; Benford, D.; Bragard, C.; Halldorsson, T.I.; Hernández-Jerez, A.F.; Hougaard Bennekou, S.; Koutsoumanis, K.P.; Machera, K.; Naegeli, H.; et al. Guidance on the use of the threshold of toxicological concern approach in food safety assessment. EFSA J. 2019, 17, 5708. [Google Scholar] [CrossRef]
- Kroes, R.; Renwick, A.G.; Feron, V.; Galli, C.L.; Gibney, M.; Greim, H.; Guy, R.H.; Lhuguenot, J.C.; van de Sandt, J.J.M. Application of the threshold of toxicological concern (TTC) to the safety evaluation of cosmetic ingredients. Food Chem. Toxicol. 2007, 45, 2533–2562. [Google Scholar] [CrossRef] [PubMed]
- Tsochatzis, E.D.; Alberto Lopes, J.; Kappenstein, O.; Tietz, T.; Hoekstra, E.J. Quantification of PET cyclic and linear oligomers in teabags by a validated LC-MS method-In silico toxicity assessment and consumer’s exposure. Food Chem. 2020, 317, 126427. [Google Scholar] [CrossRef] [PubMed]
- Poças, M.F.; Oliveira, J.C.; Oliveira, F.A.R.; Hogg, T. A Critical survey of predictive mathematical models for migration from packaging. Crit. Rev. Food Sci. Nutr. 2008, 48, 913–928. [Google Scholar] [CrossRef] [PubMed]
- Lickly, T.D.; Rainey, M.L.; Burgert, L.C.; Breder, C.V.; Borodinsky, L. Using a simple diffusion model to predict residual monomer migration—Considerations and limitations. Food Addit. Contam. 1997, 14, 65–74. [Google Scholar] [CrossRef]
- Limm, W.; Hollifield, H.C. Modelling of additive diffusion in polyolefins. Food Addit. Contam. 1996, 13, 949–967. [Google Scholar] [CrossRef]
- Baner, A.; Brandsch, J.; Franz, R.; Piringer, O. The application of a predictive migration model for evaluating the compliance of plastic materials with European food regulations. Food Addit. Contam. 1996, 13, 587–601. [Google Scholar] [CrossRef]
- Geueke, B.; Groh, K.J.; Maffini, M.V.; Martin, O.V.; Boucher, J.M.; Chiang, Y.-T.; Gwosdz, F.; Jieh, P.; Kassotis, C.D.; Łańska, P.; et al. Systematic evidence on migrating and extractable food contact chemicals: Most chemicals detected in food contact materials are not listed for use. Crit. Rev. Food Sci. Nutr. 2022, 1–11. [Google Scholar] [CrossRef]
- Food Packaging Forum Foundation, FCCmigex Database. 2022. Available online: https://www.foodpackagingforum.org/fccmigex (accessed on 24. December 2022).
- Güçlü, G.; Yalçinyuva, T.; Özgümüş, S.; Orbay, M. Hydrolysis of waste polyethylene terephthalate and characterization of products by differential scanning calorimetry. Thermochim. Acta 2003, 404, 193–205. [Google Scholar] [CrossRef]
- Molinspiration Online Tool. Available online: https://www.molinspiration.com/cgi-bin/properties (accessed on 29 October 2022).
- Schreier, V.N.; Appenzeller-Herzog, C.; Brüschweiler, B.J.; Geueke, B.; Wilks, M.F.; Simat, T.J.; Schilter, B.; Smieško, M.; Muncke, J.; Odermatt, A.; et al. Evaluating the food safety and risk assessment evidence-base of polyethylene terephthalate oligomers: Protocol for a systematic evidence map. Environ. Int. 2022, 167, 107387. [Google Scholar] [CrossRef]
- Welle, F. Food law compliance of poly(ethylene terephthalate) (PET) food packaging materials. In Food Additives and Packaging; Komoprasert, V., Turowski, P., Eds.; Food and Drug Administration: Silver Spring, MD, USA, 2014; pp. 167–195. [Google Scholar] [CrossRef]
- Simoneau, C. Applicability of Generally Recognised Diffusion Models for the Estimation of Specific Migration in Support of EU Directive 2002/72/EC, Publications Office of the European Union. 2010. Available online: https://data.europa.eu/doi/10.2788/85958 (accessed on 29 October 2022).
- Piringer, O.G. Evaluation of plastics for food packaging. Food Addit. Contam. 1994, 11, 221–230. [Google Scholar] [CrossRef] [PubMed]
- Brandsch, R.; Pemberton, M.; Schuster, D.; Welle, F. Impact of partitioning in short-term food contact applications focused on polymers in support of migration modelling and exposure risk assessment. Molecules 2022, 27, 121. [Google Scholar] [CrossRef] [PubMed]
- FoGe Forschungsgemeinschaft für Verpackungs- und Lebensmitteltechnik e.V. Machbarkeitsstudie für ein neues Bewertungsverfahren von migrierfähigen Packstoffkomponenten hinsichtlich der Verbraucherexposition am Beispiel von PET Getränkeflaschen. 2007. Available online: http://www.foge-ev.de/uploads/FoGe_Exposition_PET.pdf (accessed on 29 October 2022).
- Jickells, S.M.; Gramshaw, J.W.; Gilbert, J.; Castle, L. Migration into food during microwave and conventional oven heating. In Food and Packaging Interactions II; Risch, S.J., Hotchkiss, J.H., Eds.; ACS Symposium Series 473; ACS Publications: Washington, DC, USA, 1991; ISBN 9780841221222. [Google Scholar] [CrossRef]
- Ubeda, S.; Aznar, M.; Nerín, C. Determination of oligomers in virgin and recycled polyethylene terephthalate (PET) samples by UPLC-MS-QTOF. Anal. Bioanal. Chem. 2018, 410, 2377–2384. [Google Scholar] [CrossRef] [PubMed]
- Alberto Lopes, J.; Tsochatzis, E.D.; Karasek, L.; Hoekstra, E.J.; Emons, H. Analysis of PBT and PET cyclic oligomers in extracts of coffee capsules and food simulants by a HPLC-UV/FLD method. Food Chem. 2021, 345, 128739. [Google Scholar] [CrossRef] [PubMed]
- Kim, D.J.; Lee, K.T. Determination of monomers and oligomers in polyethylene terephthalate trays and bottles for food use by using high performance liquid chromatography-electrospray ionization-mass spectrometry. Polym. Test. 2012, 31, 490–499. [Google Scholar] [CrossRef]
- Dulio, V.; Po, R.; Borrelli, R.; Guarini, A.; Santini, C. Characterization of low-molecular-weight oligomers in recycled poly(ethylene terephthalate). Die Angew. Makromol. Chem. 1995, 225, 109–122. [Google Scholar] [CrossRef]
- Mutsuga, M.; Tojima, T.; Kawamura, Y.; Tanamoto, K. Survey of formaldehyde, acetaldehyde and oligomers in polyethylene terephthalate food-packaging materials. Food Addit. Contam. 2007, 22, 783–789. [Google Scholar] [CrossRef]
- Nasser, A.L.M.; Lopes, L.M.X.; Eberlin, M.N.; Monteiro, M. Identification of oligomers in polyethyleneterephthalate bottles for mineral water and fruit juice: Development and validation of a high-performance liquid chromatographic method for the determination of first series cyclic trimer. J. Chromatogr. A 2005, 1097, 130–137. [Google Scholar] [CrossRef]
- Begley, T.H.; Hollifield, H.C. Liquid chromatographic determination of residual reactants and reaction by-products in polyethylene terephthalate. J. Assoc. Off. Anal. Chem. Int. 1989, 72, 468–470. [Google Scholar] [CrossRef]
- Ohkado, Y.; Kawamura, Y.; Mutsuga, M.; Tamura, H.O.; Tanamoto, K. Analysis of formaldehyde, acetaldehyde and oligomers in recycled polyethylene terephthalate. J. Food Hyg. Soc. Jpn. 2005, 46, 218–223. [Google Scholar] [CrossRef] [Green Version]
- Diamantidou, D.; Mastrogianni, O.; Tsochatzis, E.; Theodoridis, G.; Raikos, N.; Gika, H.; Kalogiannis, S. Liquid chromatography-mass spectrometry method for the determination of polyethylene terephthalate and polybutylene terephthalate cyclic oligomers in blood samples. Anal. Bioanal. Chem. 2022, 414, 1503–1512. [Google Scholar] [CrossRef] [PubMed]
- Pinter, E.; Welle, F.; Mayrhofer, E.; Pechhacker, A.; Motloch, L.; Lahme, V.; Grant, A.; Tacker, M. Circularity study on PET bottle-to-bottle recycling. Sustainability 2021, 13, 7370. [Google Scholar] [CrossRef]
- Roduit, B.; Borgeat, C.H.; Cavin, S.; Fragnière, C.; Dudler, V. Application of finite element analysis (FEA) for the simulation of release of additives from multilayer polymeric packaging structures. Food Addit. Contam. 2005, 22, 945–955. [Google Scholar] [CrossRef] [PubMed]
- Beldi, G.; Senaldi, C.; Robouch, N.; Hoekstra, E. Testing Conditions for Kitchenware Articles in Contact with Foodstuffs: Plastics, Metals, Silicone and Rubber, The EURL-FCM Harmonised Approach Series. 2021. Available online: https://joint-research-centre.ec.europa.eu/document/download/cd8e6c6f-c982-4fe4-946c-40596a0d2c1e_en?filename=kitchenware-v3-final-20210702.pdf (accessed on 29 October 2022).
Figure 1.
Graphical representation of predicted migrations using the activation energy EA-based model. Migration of PET oligomers for which CP,0 values were available was predicted for PET trays (rectangular and round) under long-term heating conditions (100 °C, 2 h) and evaluated for the exceeding different safety thresholds. Oligomer names in bold represent molecules for which both KP/F = 1 and KP/F = 1000 were used for predictions. (a) Modeled migration of all 29 PET oligomers and their evaluation against the DNA-reactive mutagens/carcinogens safety threshold of 0.15 µg/kg. (b) Modeled migration of cyclic PET oligomers and their evaluation against the Cramer Class III threshold of 90 µg/kg. (c) Modeled migration of linear PET oligomers and their evaluation against the Cramer Class I threshold of 1.8 mg/kg.
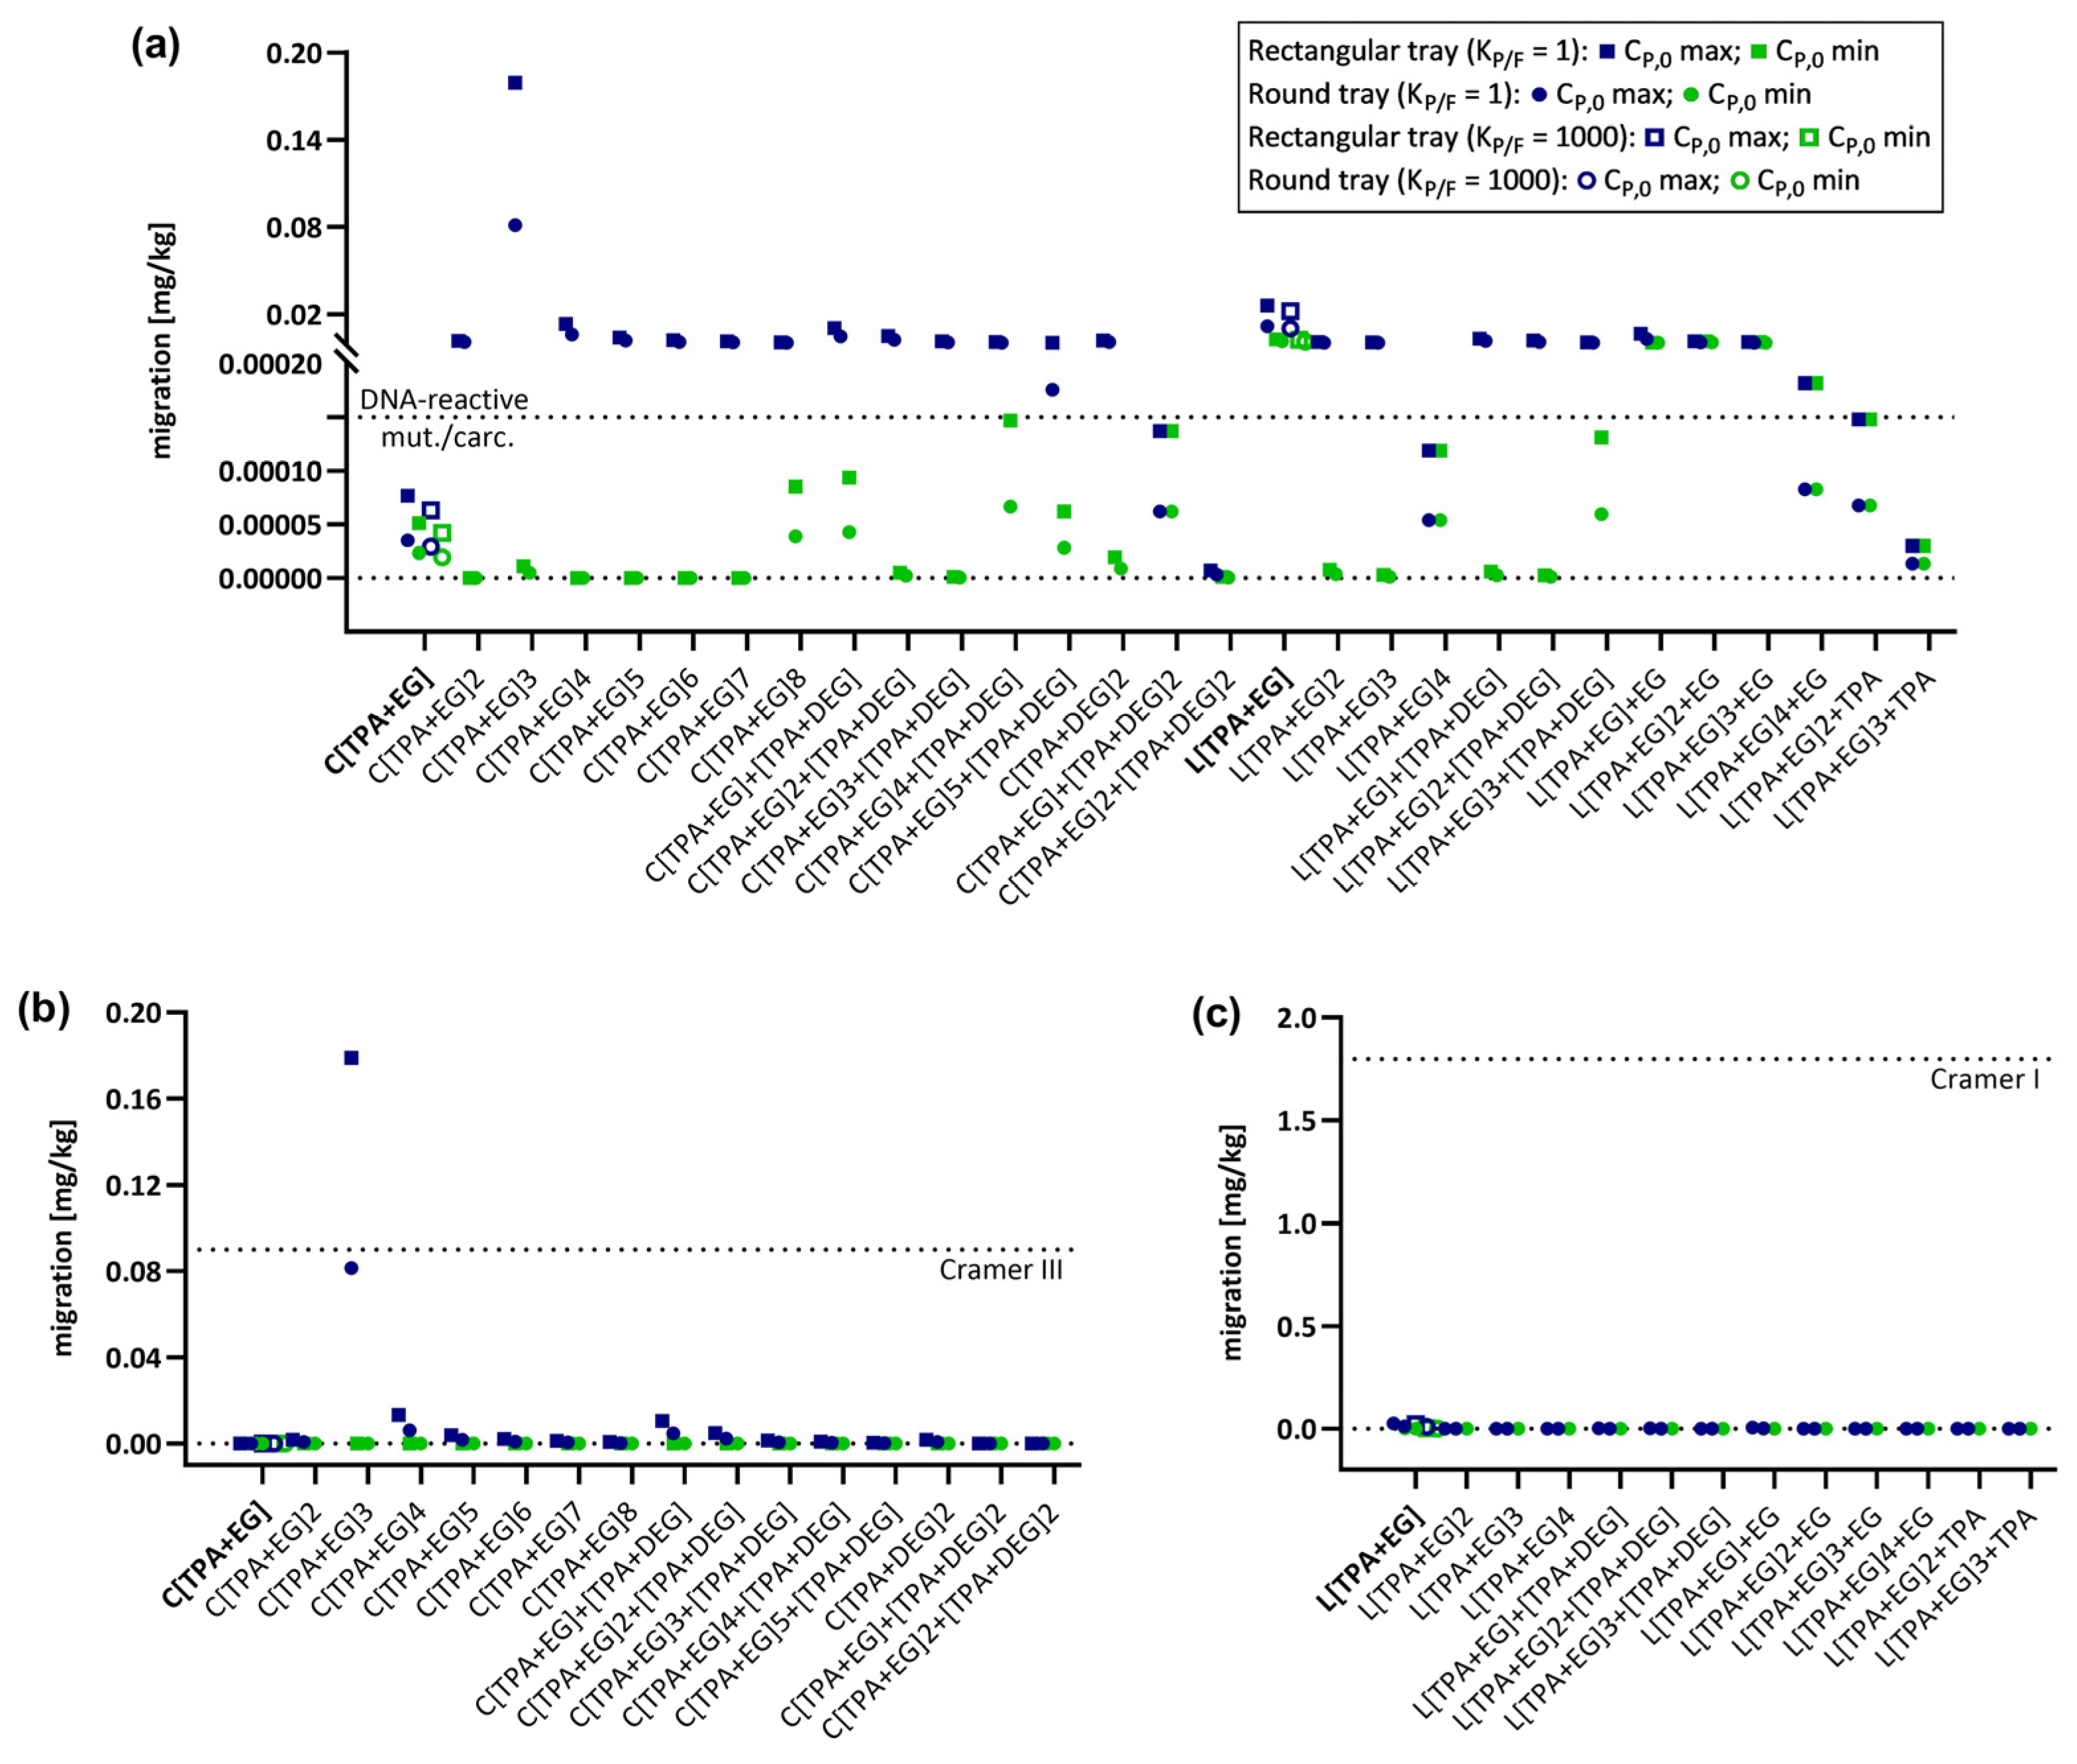
Figure 2.
Graphical representation of predicted migrations using the AP model (realistic case). Migration of PET oligomers for which CP,0 values were available was predicted for PET trays under long-term heating conditions (100 °C, 2 h) and evaluated for the exceeding different safety thresholds. Oligomer names in bold represent molecules for which both KP/F = 1 and KP/F = 1000 were used for predictions. (a) Modeled migration of all 29 PET oligomers and their evaluation against the DNA-reactive mutagens/carcinogens safety threshold of 0.15 µg/kg. (b) Modeled migration of cyclic PET oligomers and their evaluation against the Cramer Class III threshold of 90 µg/kg. (c) Modeled migration of linear PET oligomers and their evaluation against the Cramer Class I threshold of 1.8 mg/kg.
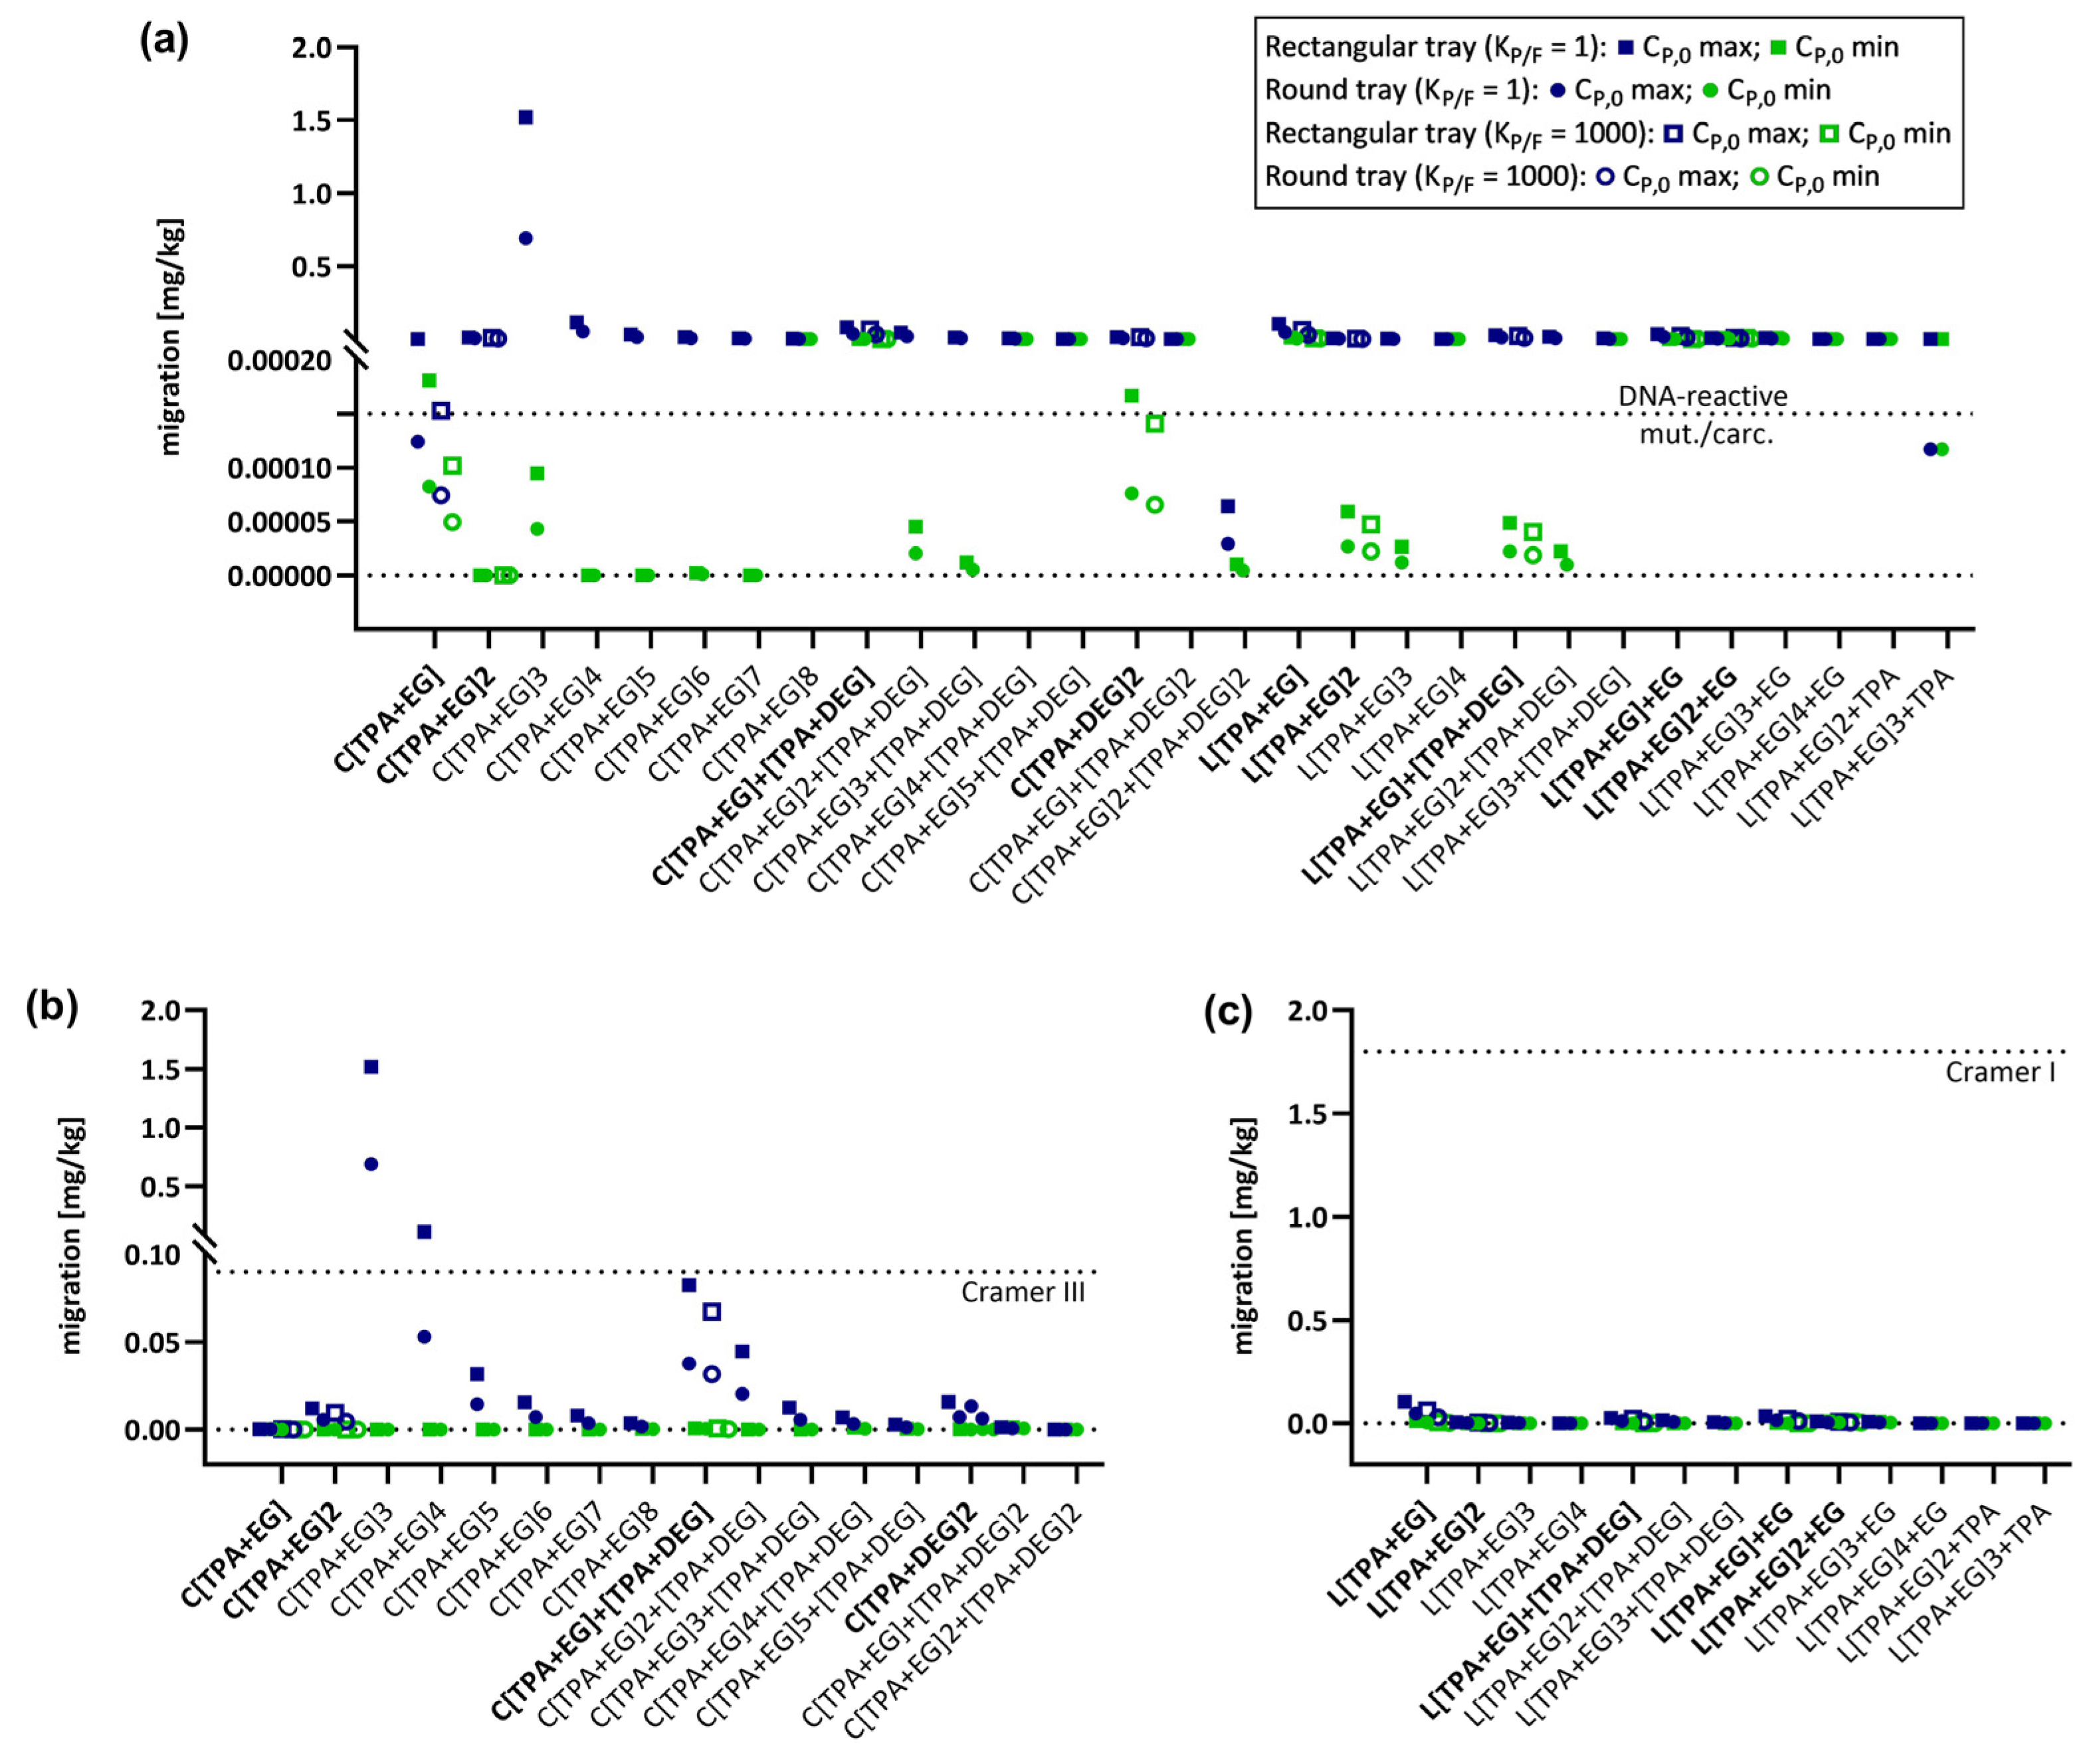
Figure 3.
Maximum bottle and tray wall concentrations (CP,0) of all oligomers corresponding to a migration of 90 µg/kg or 0.15 µg/kg, calculated for the EA-based model (grey) and the AP model (blue). (a) CP,0 concentrations for 500, 1000, and 1500 mL bottle at 25 °C for 365 d and 40 °C for 60 d corresponding to a migration of 0.15 µg/kg. (b) CP,0 concentrations for 500, 1000, and 1500 mL bottles at 25 °C for 365 d and 40 °C for 60 d corresponding to a migration of 90 µg/kg. (c) CP,0 concentrations for rectangular (rec.) and round trays at 70 °C for 30 min and 100 °C for 10 min or 2 h corresponding to a migration of 0.15 µg/kg. (d) CP,0 concentrations for rectangular (rec.) and round trays at 70 °C for 30 min and 100 °C for 10 min and 2 h corresponding to a migration of 90 µg/kg. Red line indicates a CP,0 concentration of 1% (w/w).


Table 1.
Summary of reported PET oligomers and hypothetical molecules. PET oligomer names (acronyms) of the hypothetical PET oligomers are highlighted in grey.
Table 1.
Summary of reported PET oligomers and hypothetical molecules. PET oligomer names (acronyms) of the hypothetical PET oligomers are highlighted in grey.
| PET Oligomer (Acronym) | Common Oligomer Name | Molecular Weight MW [g/mol] | Predicted Molecular Volume MV [Å3] |
|---|---|---|---|
| C[TPA+EG] | First series cyclic monomer | 192.17 | 162.74 |
| C[TPA+EG]2 | First series cyclic dimer | 384.34 | 323.69 |
| C[TPA+EG]3 | First series cyclic trimer | 576.51 | 484.64 |
| C[TPA+EG]4 | First series cyclic tetramer | 768.68 | 645.59 |
| C[TPA+EG]5 | First series cyclic pentamer | 960.85 | 806.54 |
| C[TPA+EG]6 | First series cyclic hexamer | 1153.02 | 967.49 |
| C[TPA+EG]7 | First series cyclic heptamer | 1345.19 | 1128.43 |
| C[TPA+EG]8 | First series cyclic octamer | 1537.36 | 1289.38 |
| C[TPA+DEG] | Second series cyclic monomer | 236.22 | 205.33 |
| C[TPA+EG]+[TPA+DEG] | Second series cyclic dimer | 428.39 | 366.28 |
| C[TPA+EG]2+[TPA+DEG] | Second series cyclic trimer | 620.56 | 527.23 |
| C[TPA+EG]3+[TPA+DEG] | Second series cyclic tetramer | 812.73 | 688.18 |
| C[TPA+EG]4+[TPA+DEG] | Second series cyclic pentamer | 1004.9 | 849.12 |
| C[TPA+EG]5+[TPA+DEG] | Second series cyclic hexamer | 1197.07 | 1010.07 |
| C[TPA+DEG]2 | Third series cyclic dimer | 472.45 | 408.87 |
| C[TPA+EG]+[TPA+DEG]2 | Third series cyclic trimer | 664.62 | 569.82 |
| C[TPA+EG]2+[TPA+DEG]2 | Third series cyclic tetramer | 856.79 | 730.76 |
| C[TPA+EG]3+[TPA+DEG]2 | Third series cyclic pentamer | 1048.96 | 891.71 |
| C[TPA+EG]4+[TPA+DEG]2 | Third series cyclic hexamer | 1241.13 | 1052.66 |
| C[TPA+EG]+[TPA+DEG]3 | Fourth series cyclic tetramer | 900.84 | 773.35 |
| L[TPA+EG] | First series linear monomer | 210.19 | 180.63 |
| L[TPA+EG]2 | First series linear dimer | 402.36 | 341.58 |
| L[TPA+EG]3 | First series linear trimer | 594.52 | 502.53 |
| L[TPA+EG]4 | First series linear tetramer | 786.70 | 663.48 |
| L[TPA+EG]5 | First series linear pentamer | 978.87 | 824.43 |
| L[TPA+EG]6 | First series linear hexamer | 1171.04 | 985.38 |
| L[TPA+EG]7 | First series linear heptamer | 1363.20 | 1146.33 |
| L[TPA+EG]8 | First series linear octamer | 1555.38 | 1307.28 |
| L[TPA+DEG] | Second series linear monomer | 254.24 | 223.22 |
| L[TPA+DEG]+EG | Second series linear monomer + EG | 298.29 | 265.81 |
| L[TPA+EG]+[TPA+DEG] | Second series linear dimer | 446.41 | 384.17 |
| L[TPA+EG]2+[TPA+DEG] | Second series linear trimer | 638.58 | 545.12 |
| L[TPA+EG]3+[TPA+DEG] | Second series linear tetramer | 830.75 | 706.07 |
| L[TPA+EG]4+[TPA+DEG] | Second series linear pentamer | 1022.92 | 867.02 |
| L[TPA+EG]5+[TPA+DEG] | Second series linear hexamer | 1215.09 | 1027.97 |
| L[TPA+DEG]2 | Third series linear dimer | 490.46 | 426.76 |
| L[TPA+EG]+[TPA+DEG]2 | Third series linear trimer | 682.63 | 587.71 |
| L[TPA+EG]2+[TPA+DEG]2 | Third series linear tetramer | 874.80 | 748.66 |
| L[TPA+EG]3+[TPA+DEG]2 | Third series linear pentamer | 1066.97 | 909.61 |
| L[TPA+EG]4+[TPA+DEG]2 | Third series linear hexamer | 1259.14 | 1070.55 |
| L[TPA+EG]+EG | First series linear monomer + EG | 254.24 | 223.22 |
| L[TPA+EG]2+EG | First series linear dimer + EG | 446.41 | 384.17 |
| L[TPA+EG]3+EG | First series linear trimer + EG | 638.58 | 545.12 |
| L[TPA+EG]4+EG | First series linear tetramer + EG | 830.75 | 706.07 |
| L[TPA+EG]5+EG | First series linear pentamer + EG | 1022.92 | 867.02 |
| L[TPA+EG]6+EG | First series linear hexamer + EG | 1215.09 | 1027.97 |
| L[TPA+EG]+TPA | First series linear monomer + TPA | 358.30 | 299.00 |
| L[TPA+EG]2+TPA | First series linear dimer + TPA | 550.47 | 459.94 |
| L[TPA+EG]3+TPA | First series linear trimer + TPA | 742.64 | 620.89 |
| L[TPA+EG]4+TPA | First series linear tetramer + TPA | 934.81 | 781.84 |
| L[TPA+EG]5+TPA | First series linear pentamer + TPA | 1126.98 | 942.79 |
| L[TPA+EG]6+TPA | First series linear hexamer + TPA | 1319.15 | 1103.74 |
Table 2.
Comparison of reported experimentally determined diffusion coefficients (DP) for C[TPA+EG]3 [5] and predicted values from the EA-based prediction model [14] and the AP model (realistic case and upper limit) [7,38].
| Temperature [°C] | DP Measured [cm2/s] | DP Predicted [cm2/s] | ||
|---|---|---|---|---|
| EA Based Model | AP Model (Realistic Case) | AP Model (Upper Limit) | ||
| 176 | 2.9 × 10⁻⁹ | 1.4 × 10⁻⁹ | 2.5 × 10⁻¹⁰ | 6.9 × 10⁻⁹ |
| 149 | 6.6 × 10⁻¹⁰ | 3.8 × 10⁻¹¹ | 4.6 × 10⁻¹¹ | 1.2 × 10⁻⁹ |
| 115 | 1.2 × 10⁻¹² | 2.0 × 10⁻¹³ | 3.8 × 10⁻¹² | 1.0 × 10⁻¹⁰ |
Table 3.
Impact of partitioning at different conditions for PET oligomers predicted by the EA-based model or the AP model (realistic case). For each condition, the deviation of migration in mg/dm2 between the partition coefficients KP/F = 1 and KP/F = 1000 is given in %. The color gradient indicates the impact of KP/F, with the influence increasing as the intensity of red increases.
| PET Oligomer (Acronym) | MW [g/mol] | MV [Å3] | Impact of the Partition Coefficient (KP/F = 1 and KP/F = 1000) on Migration in % Condition/Model * | |||||||||
|---|---|---|---|---|---|---|---|---|---|---|---|---|
| 1/EA | 2/EA | 3/EA | 4/EA | 5/EA | 1/AP | 2/AP | 3/AP | 4/AP | 5/AP | |||
| C[TPA+EG] | 192.17 | 162.74 | 1 | 2 | 2 | 16 | 16 | 26 | 28 | 14 | 40 | 40 |
| L[TPA+EG] | 210.19 | 180.63 | 1 | 1 | 2 | 13 | 13 | 24 | 25 | 13 | 37 | 37 |
| C[TPA+DEG] | 236.22 | 205.33 | 0 | 1 | 1 | 9 | 10 | 21 | 23 | 11 | 34 | 34 |
| L[TPA+DEG] | 254.24 | 223.22 | 0 | 1 | 1 | 8 | 8 | 20 | 21 | 10 | 31 | 31 |
| L[TPA+EG]+EG | 254.24 | 223.22 | 0 | 1 | 1 | 8 | 8 | 20 | 21 | 10 | 31 | 31 |
| L[TPA+DEG]+EG | 298.29 | 265.81 | 0 | 0 | 0 | 5 | 5 | 16 | 17 | 8 | 27 | 27 |
| L[TPA+EG]+TPA | 358.3 | 299.00 | 0 | 0 | 0 | 4 | 4 | 12 | 13 | 6 | 21 | 21 |
| C[TPA+EG]2 | 384.34 | 323.69 | 0 | 0 | 0 | 3 | 3 | 11 | 12 | 5 | 19 | 19 |
| L[TPA+EG]2 | 402.36 | 341.58 | 0 | 0 | 0 | 3 | 3 | 10 | 11 | 5 | 18 | 18 |
| C[TPA+EG]+[TPA+DEG] | 428.39 | 366.28 | 0 | 0 | 0 | 2 | 2 | 9 | 10 | 4 | 16 | 16 |
| L[TPA+EG]+[TPA+DEG] | 446.41 | 384.17 | 0 | 0 | 0 | 2 | 2 | 9 | 9 | 4 | 15 | 15 |
| L[TPA+EG]2+EG | 446.41 | 384.17 | 0 | 0 | 0 | 2 | 2 | 9 | 9 | 4 | 15 | 15 |
| C[TPA+DEG]2 | 472.45 | 408.87 | 0 | 0 | 0 | 2 | 2 | 8 | 8 | 4 | 14 | 14 |
| L[TPA+DEG]2 | 490.46 | 426.76 | 0 | 0 | 0 | 2 | 2 | 7 | 8 | 3 | 13 | 13 |
| L[TPA+EG]2+TPA | 550.47 | 459.94 | 0 | 0 | 0 | 1 | 1 | 6 | 6 | 3 | 10 | 10 |
| C[TPA+EG]3 | 576.51 | 484.64 | 0 | 0 | 0 | 1 | 1 | 5 | 6 | 2 | 9 | 9 |
| L[TPA+EG]3 | 594.52 | 502.53 | 0 | 0 | 0 | 1 | 1 | 5 | 5 | 2 | 9 | 9 |
| C[TPA+EG]2+[TPA+DEG] | 620.56 | 527.23 | 0 | 0 | 0 | 1 | 1 | 4 | 5 | 2 | 8 | 8 |
| L[TPA+EG]2+[TPA+DEG] | 638.58 | 545.12 | 0 | 0 | 0 | 1 | 1 | 4 | 4 | 2 | 8 | 8 |
| L[TPA+EG]3+EG | 638.58 | 545.12 | 0 | 0 | 0 | 1 | 1 | 4 | 4 | 2 | 8 | 8 |
| C[TPA+EG]+[TPA+DEG]2 | 664.62 | 569.82 | 0 | 0 | 0 | 1 | 1 | 4 | 4 | 2 | 7 | 7 |
| L[TPA+EG]+[TPA+DEG]2 | 682.63 | 587.71 | 0 | 0 | 0 | 1 | 1 | 3 | 4 | 2 | 7 | 7 |
| L[TPA+EG]3+TPA | 742.64 | 620.89 | 0 | 0 | 0 | 1 | 1 | 3 | 3 | 1 | 5 | 5 |
| C[TPA+EG]4 | 768.68 | 645.59 | 0 | 0 | 0 | 1 | 1 | 3 | 3 | 1 | 5 | 5 |
| L[TPA+EG]4 | 786.7 | 663.48 | 0 | 0 | 0 | 1 | 1 | 2 | 3 | 1 | 5 | 5 |
| C[TPA+EG]3+[TPA+DEG] | 812.73 | 688.18 | 0 | 0 | 0 | 1 | 1 | 2 | 2 | 1 | 4 | 4 |
| L[TPA+EG]3+[TPA+DEG] | 830.75 | 706.07 | 0 | 0 | 0 | 0 | 0 | 2 | 2 | 1 | 4 | 4 |
| L[TPA+EG]4+EG | 830.75 | 706.07 | 0 | 0 | 0 | 0 | 0 | 2 | 2 | 1 | 4 | 4 |
| C[TPA+EG]2+[TPA+DEG]2 | 856.79 | 730.76 | 0 | 0 | 0 | 0 | 0 | 2 | 2 | 1 | 4 | 4 |
| L[TPA+EG]2+[TPA+DEG]2 | 874.8 | 748.66 | 0 | 0 | 0 | 0 | 0 | 2 | 2 | 1 | 3 | 4 |
| C[TPA+EG]+[TPA+DEG]3 | 900.84 | 773.35 | 0 | 0 | 0 | 0 | 0 | 2 | 2 | 1 | 3 | 3 |
| L[TPA+EG]4+TPA | 934.81 | 781.84 | 0 | 0 | 0 | 0 | 0 | 2 | 2 | 1 | 3 | 3 |
| C[TPA+EG]5 | 960.85 | 806.54 | 0 | 0 | 0 | 0 | 0 | 1 | 2 | 1 | 3 | 3 |
| L[TPA+EG]5 | 978.87 | 824.43 | 0 | 0 | 0 | 0 | 0 | 1 | 1 | 1 | 3 | 3 |
| C[TPA+EG]4+[TPA+DEG] | 1004.9 | 849.12 | 0 | 0 | 0 | 0 | 0 | 1 | 1 | 1 | 2 | 2 |
| L[TPA+EG]4+[TPA+DEG] | 1022.92 | 867.02 | 0 | 0 | 0 | 0 | 0 | 1 | 1 | 1 | 2 | 2 |
| L[TPA+EG]5+EG | 1022.92 | 867.02 | 0 | 0 | 0 | 0 | 0 | 1 | 1 | 1 | 2 | 2 |
| C[TPA+EG]3+[TPA+DEG]2 | 1048.96 | 891.71 | 0 | 0 | 0 | 0 | 0 | 1 | 1 | 1 | 2 | 2 |
| L[TPA+EG]3+[TPA+DEG]2 | 1066.97 | 909.61 | 0 | 0 | 0 | 0 | 0 | 1 | 1 | 1 | 2 | 2 |
| L[TPA+EG]5+TPA | 1126.98 | 942.79 | 0 | 0 | 0 | 0 | 0 | 1 | 1 | 0 | 2 | 2 |
| C[TPA+EG]6 | 1153.02 | 967.49 | 0 | 0 | 0 | 0 | 0 | 1 | 1 | 0 | 2 | 2 |
| L[TPA+EG]6 | 1171.04 | 985.38 | 0 | 0 | 0 | 0 | 0 | 1 | 1 | 0 | 1 | 1 |
| C[TPA+EG]5+[TPA+DEG] | 1197.07 | 1010.07 | 0 | 0 | 0 | 0 | 0 | 1 | 1 | 0 | 1 | 1 |
| L[TPA+EG]5+[TPA+DEG] | 1215.09 | 1027.97 | 0 | 0 | 0 | 0 | 0 | 1 | 1 | 0 | 1 | 1 |
| L[TPA+EG]6+EG | 1215.09 | 1027.97 | 0 | 0 | 0 | 0 | 0 | 1 | 1 | 0 | 1 | 1 |
| C[TPA+EG]4+[TPA+DEG]2 | 1241.13 | 1052.66 | 0 | 0 | 0 | 0 | 0 | 1 | 1 | 0 | 1 | 1 |
| L[TPA+EG]4+[TPA+DEG]2 | 1259.14 | 1070.55 | 0 | 0 | 0 | 0 | 0 | 1 | 1 | 0 | 1 | 1 |
| L[TPA+EG]6+TPA | 1319.15 | 1103.74 | 0 | 0 | 0 | 0 | 0 | 1 | 1 | 0 | 1 | 1 |
| C[TPA+EG]7 | 1345.19 | 1128.43 | 0 | 0 | 0 | 0 | 0 | 0 | 1 | 0 | 1 | 1 |
| L[TPA+EG]7 | 1363.2 | 1146.33 | 0 | 0 | 0 | 0 | 0 | 0 | 0 | 0 | 1 | 1 |
| C[TPA+EG]8 | 1537.36 | 1289.38 | 0 | 0 | 0 | 0 | 0 | 0 | 0 | 0 | 1 | 1 |
| L[TPA+EG]8 | 1555.38 | 1307.28 | 0 | 0 | 0 | 0 | 0 | 0 | 0 | 0 | 1 | 1 |
* For storage conditions 1 to 5, see text. Abbreviations: EA (EA-based prediction model), AP (AP model, realistic case), MW (molecular weight), MV (molecular volume)
Table 4.
Properties and parameters used for migration modeling for different food contact articles.
| Properties and Conditions | Food Contact Articles | ||||
|---|---|---|---|---|---|
| 500 mL Bottle | 1.0 L Bottle | 1.5 L Bottle | Rectangular Tray * | Round Tray ** | |
| Contact surface [cm2] | 420 | 660 | 880 | 566 | 329 |
| Contact volume [L] | 0.5 | 1.0 | 1.5 | 0.5 | 637 |
| Surface/volume [1/cm2] | 0.84 | 0.66 | 0.59 | 1.13 | 0.52 |
| Thickness PET [µm] | 300 | 300 | 300 | 300 | 300 |
| Density PET [g/cm3] | 1.4 | 1.4 | 1.4 | 1.4 | 1.4 |
| Density food/drink [g/cm3] | 1.0 | 1.0 | 1.0 | 1.0 | 1.0 |
| KP/F | 1 or 1000 | 1 or 1000 | 1 or 1000 | 1 or 1000 | 1 or 1000 |
| Temperature and time(application scenarios) | Condition 1 | Condition 1 | Condition 1 | Condition 3 | Condition 3 |
| 25 °C, 365 d | 25 °C, 365 d | 25 °C, 365 d | 70 °C, 0.5 h | 70 °C, 0.5 h | |
| Condition 2 | Condition 2 | Condition 2 | Condition 4 | Condition 4 | |
| 40 °C, 60 d | 40 °C, 60 d | 40 °C, 60 d | 100 °C, 10 min | 100 °C, 10 min | |
| Condition 5 | Condition 5 | ||||
| 100 °C, 2 h | 100 °C, 2 h | ||||
* Trays with the assumed surface in contact (500 mL filling): h = 3.25 cm, w = 12 cm, l = 16 cm. ** Trays with the assumed surface in contact (637 mL filling): h = 4.8 cm, r = 6.5 cm.
Disclaimer/Publisher’s Note: The statements, opinions and data contained in all publications are solely those of the individual author(s) and contributor(s) and not of MDPI and/or the editor(s). MDPI and/or the editor(s) disclaim responsibility for any injury to people or property resulting from any ideas, methods, instructions or products referred to in the content. |
© 2022 by the authors. Licensee MDPI, Basel, Switzerland. This article is an open access article distributed under the terms and conditions of the Creative Commons Attribution (CC BY) license (https://creativecommons.org/licenses/by/4.0/).
Share and Cite
MDPI and ACS Style
Schreier, V.N.; Odermatt, A.; Welle, F. Migration Modeling as a Valuable Tool for Exposure Assessment and Risk Characterization of Polyethylene Terephthalate Oligomers. Molecules 2023, 28, 173. https://doi.org/10.3390/molecules28010173
AMA Style
Schreier VN, Odermatt A, Welle F. Migration Modeling as a Valuable Tool for Exposure Assessment and Risk Characterization of Polyethylene Terephthalate Oligomers. Molecules. 2023; 28(1):173. https://doi.org/10.3390/molecules28010173
Chicago/Turabian StyleSchreier, Verena N., Alex Odermatt, and Frank Welle. 2023. "Migration Modeling as a Valuable Tool for Exposure Assessment and Risk Characterization of Polyethylene Terephthalate Oligomers" Molecules 28, no. 1: 173. https://doi.org/10.3390/molecules28010173