
The Influence of Oxidation and Nitrogenation on the Physicochemical Properties and Sorption Capacity of Activated Biocarbons Prepared from the Elderberry Inflorescence


Abstract
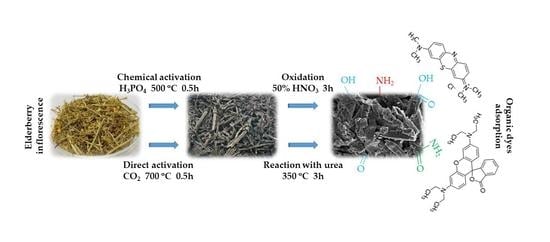
:
1. Introduction
2. Results and Discussion
2.1. Elemental Composition of the Starting Elderberry Inflorescence as Well as Activated Biocarbons Obtained via Its Physical/Chemical Activation and Further Thermochemical Modification
2.2. Acidic-Basic Properties of the Precursor and the Activated Biocarbons Prepared
2.3. Textural Parameters of the Activated Biocarbons Obtained from Elderberry Inflorescence
2.4. Thermal Propeties of the Activated Biocarbons Prepared from Elderberry Inflorescence
2.5. Sorption Performance of the Activated Biocarbons Prepared from Elderberry Inflorescence in Relation to Methylene Blue (MB) and Rhodamine B (RhB)
3. Materials and Methods
3.1. Activated Biocarbons Preparation
3.2. Physicochemical Characterization of the Precursor and Activated Biocarbons
3.3. Adsorption of Methylene Blue (MB) and Rhodamine B(RhB)
4. Conclusions
Author Contributions
Funding
Institutional Review Board Statement
Informed Consent Statement
Data Availability Statement
Conflicts of Interest
Sample Availability
References
- Przepiórski, J. Activated carbon filters and their industrial applications. In Activated Carbon Surfaces in Environmental Remediation, 1st ed.; Bandosz, T.J., Ed.; Elsevier Ltd.: New York, NY, USA, 2006; pp. 421–474. [Google Scholar]
- Çeçen, F.; Aktas, Ö. Activated Carbon for Water and Wastewater Treatment: Integration of Adsorption and Biological Treatment, 1st ed.; Wiley-VCH Verlag GmbH & Co. KGaA: Weinheim, Germany, 2011; pp. 13–41. [Google Scholar]
- Hanami, Z.A.; Lestari, P. Characterization and application of mangosteen peel activated carbon for ammonia gas removal. Environ. Nat. Resour. J. 2021, 19, 320–329. [Google Scholar] [CrossRef]
- Bazan-Woźniak, A.; Nowicki, P.; Pietrzak, R. The influence of activation procedure on the physicochemical and sorption properties of activated carbons prepared from pistachio nutshells for removal of NO2/H2S gases and dyes. J. Clean Prod. 2017, 152, 211–222. [Google Scholar] [CrossRef]
- Cheng, T.; Li, J.; Ma, X.; Zhou, L.; Wu, H.; Yang, L. The adsorption properties of microporous activated carbon prepared from pistachio nut shell for low-concentration VOCs under low-medium temperatures. Environ. Sci. Pollut. Res. 2021, 28, 65216–65228. [Google Scholar] [CrossRef] [PubMed]
- Mahdi, Z.; Yu, Q.J.; El Hanandeh, A. Competitive adsorption of heavy metal ions (Pb2+, Cu2+, and Ni2+) onto date seed biochar: Batch and fixed bed experiments. Sep. Sci. Technol. 2018, 54, 888–901. [Google Scholar] [CrossRef]
- Kazmierczak-Razna, J.; Zioła-Frankowska, A.; Nowicki, P.; Frankowski, M.; Wolski, R.; Pietrzak, R. Removal of Heavy Metal Ions from One- and Two-Component Solutions via Adsorption on N-Doped Activated Carbon. Materials 2021, 14, 7045. [Google Scholar] [CrossRef]
- Attia, A.A.; Girgis, B.S.; Khedr, S.A. Capacity of activated carbon derived from pistachio shells by H3PO4 in the removal of dyes and phenolics. J. Chem. Technol. Biotechnol. 2003, 78, 611–619. [Google Scholar] [CrossRef]
- Bazan-Wozniak, A.; Paluch, D.; Wolski, R.; Cielecka-Piontek, J.; Nosal-Wiercińska, A.; Pietrzak, R. Biocarbons Obtained from Fennel and Caraway Fruits as Adsorbents of Methyl Red Sodium Salt from Water System. Materials 2022, 15, 8177. [Google Scholar] [CrossRef]
- Ani, J.U.; Akpomie, K.G.; Okoro, U.C.; Aneke, L.E.; Onukwuli, O.D.; Ujam, O.T. Potentials of activated carbon produced from biomass materials for sequestration of dyes, heavy metals, and crude oil components from aqueous environment. Appl. Water Sci. 2020, 10, 69. [Google Scholar] [CrossRef] [Green Version]
- Mohammed, A.A.; Al-Musawi, T.J.; Kareem, S.L.; Zarrabi, M.; Al-Ma’Abreh, A.M. Simultaneous adsorption of tetracycline, amoxicillin, and ciprofloxacin by pistachio shell powder coated with zinc oxide nanoparticles. Arab. J. Chem. 2019, 13, 4629–4643. [Google Scholar] [CrossRef]
- Wiśniewska, M.; Nowicki, P.; Szewczuk-Karpisz, K.; Gęca, M.; Jędruchniewicz, K.; Oleszczuk, P. Simultaneous removal of toxic Pb(II) ions, poly(acrylic acid) and Triton X-100 from their mixed solution using engineered biochars obtained from horsetail herb precursor—Impact of post-activation treatment. Sep. Pur. Technol. 2021, 276, 119297. [Google Scholar] [CrossRef]
- Gęca, M.; Wiśniewska, M.; Urban, T.; Nowicki, P. Temperature Effect on Ionic Polymers Removal from Aqueous Solutions Using Activated Carbons Obtained from Biomass. Materials 2022, 16, 350. [Google Scholar] [CrossRef]
- Rodŕíguez-Reinoso, F.; Seṕulveda-Escribano, A. Carbon as Catalyst Support. In Carbon Materials for Catalysis, 1st ed.; Serp, P., Figueiredo, J.S., Eds.; John Wiley & Sons, Inc.: Hoboken, NJ, USA, 2009; pp. 131–155. [Google Scholar]
- Kazmierczak-Razna, J.; Kasprzak, D.; Walkowiak, M.; Pietrzak, R.; Nowicki, P. N-doped sawdust-based activated biocar-bons prepared by microwave-assisted heat treatment as potential electrode materials for supercapacitors. J. Wood Chem. Technol. 2021, 41, 307–320. [Google Scholar] [CrossRef]
- Xu, J.; Gao, Q.; Zhang, Y.; Tan, Y.; Tian, W.; Zhu, L.; Jiang, L. Preparing two-dimensional microporous carbon from Pistachio nutshell with high areal capacitance as supercapacitor materials. Sci. Rep. 2014, 4, srep05545. [Google Scholar] [CrossRef] [Green Version]
- Menéndez-Díaz, J.A.; Martín-Gullón, I. Types of carbon adsorbents and their production. In Activated Carbon Surfaces in Environmental Remediation, 1st ed.; Bandosz, T.J., Ed.; Elsevier Ltd.: New York, NY, USA, 2006; pp. 1–47. [Google Scholar]
- Marsh, H.; Rodríguez-Reinoso, F. Activated Carbon, 1st ed.; Elsevier Ltd.: Oxford, UK, 2006; pp. 243–365. [Google Scholar] [CrossRef]
- Li, L.; Li, Y.; Liu, Y.; Ding, L.; Jin, X.; Lian, H.; Zheng, J. Preparation of a novel activated carbon from cassava sludge for the high-efficiency adsorption of hexavalent chromium in potable water: Adsorption performance and mechanism in-sight. Water 2021, 13, 3602. [Google Scholar] [CrossRef]
- Wang, J.; Wang, R.; Ma, J.; Sun, Y. Study on the Application of Shell-Activated Carbon for the Adsorption of Dyes and Antibiotics. Water 2022, 14, 3752. [Google Scholar] [CrossRef]
- Jawad, A.H.; Abdulhameed, A.S. Statistical modeling of methylene blue dye adsorption by high surface area mesopo-rous activated carbon from bamboo chip using KOH-assisted thermal activation. Energy Ecol. Environ. 2020, 5, 456–469. [Google Scholar] [CrossRef]
- Shirbhate, V.A.; Gulwade, D.P.; Bhandarkar, S.E.; Narsing, S.V. Preparation and spectroscopic characterization of Pis-tachio nut shell’s activated carbon using ZnCl2 for removal of transition metal ions. Mater Today Proc. 2020, 29, 1259–1264. [Google Scholar] [CrossRef]
- Thang, N.H.; Khang, D.S.; Hai, T.D.; Nga, D.T.; Tuan, P.D. Methylene blue adsorption mechanism of activated carbon synthesised from cashew nut shells. RSC Adv. 2021, 11, 26563–26570. [Google Scholar] [CrossRef]
- Rosson, E.; Garbo, F.; Marangoni, G.; Bertani, R.; Lavagnolo, M.C.; Moretti, E.; Talon, A.; Mozzon, M.; Sgarbossa, P. Activated Carbon from Spent Coffee Grounds: A Good Competitor of Commercial Carbons for Water Decontamination. Appl. Sci. 2020, 10, 5598. [Google Scholar] [CrossRef]
- Fallatah, A.M.; Shah, H.U.R.; Ahmad, K.; Ashfaq, M.; Rauf, A.; Muneer, M.; Ibrahim, M.M.; El-Bahy, Z.M.; Shahzad, A.; Babras, A. Rational synthesis and characterization of highly water stable MOF@GO composite for efficient removal of mercury (Hg2+) from water. Heliyon 2022, 8, e10936. [Google Scholar] [CrossRef]
- Ahmad, K.; Nazir, M.A.; Qureshi, A.K.; Hussain, E.; Najam, T.; Javed, M.S.; Shah, S.S.A.; Tufail, M.K.; Hussain, S.; Khan, N.A.; et al. Engineering of Zirconium based metal-organic frameworks (Zr-MOFs) as efficient adsorbents. Mater. Sci. Eng. B 2020, 262, 114766. [Google Scholar] [CrossRef]
- Tolkou, A.K.; Vaclavikova, M.; Gallios, G.P. Impregnated Activated Carbons with Binary Oxides of Iron-Manganese for Efficient Cr(VI) Removal from Water. Water Air Soil Pollut. 2022, 233, 343. [Google Scholar] [CrossRef]
- Salehi, E.; Soroush, F.; Momeni, M.; Barati, A.; Khakpour, A. Chitosan/polyethylene glycol impregnated activated car-bons: Synthesis, characterization and adsorption performance. Front. Chem. Sci. Eng. 2017, 11, 575–585. [Google Scholar] [CrossRef]
- Zięzio, M.; Charmas, B.; Jedynak, K.; Hawryluk, M.; Kucio, K. Preparation and characterization of activated carbons obtained from the waste materials impregnated with phosphoric acid(V). Appl. Nanosci. 2020, 10, 4703–4716. [Google Scholar] [CrossRef]
- Kiani, S.S.; Farooq, A.; Ahmad, M.; Irfan, N.; Nawaz, M.; Irshad, M.A. Impregnation on activated carbon for removal of chemical warfare agents (CWAs) and radioactive content. Environ. Sci. Pollut. Res. 2021, 28, 60477–60494. [Google Scholar] [CrossRef]
- Koo-Amornpattana, W.; Phadungbut, P.; Kunthakudee, N.; Jonglertjunya, W.; Ratchahat, S.; Hunsom, M. Innovative metal oxides (CaO, SrO, MgO) impregnated waste-derived activated carbon for biohydrogen purification. Sci. Rep. 2023, 13, 4705. [Google Scholar] [CrossRef]
- Streletskiy, O.A.; Zavidovskiy, I.A.; Balabanyan, V.Y.; Tsiskarashvili, A.V. Antibacterial properties of modified a-C and ta-C coatings: The effects of the sp2/sp3 ratio, oxidation, nitridation, and silver incorporation. Appl. Phys. A 2022, 128, 929. [Google Scholar] [CrossRef]
- Yaumi, A.; Abu Bakar, M.; Hameed, B. Melamine-nitrogenated mesoporous activated carbon derived from rice husk for carbon dioxide adsorption in fixed-bed. Energy 2018, 155, 46–55. [Google Scholar] [CrossRef]
- Spessato, L.; Duarte, V.A.; Fonseca, J.M.; Arroyo, P.A.; Almeida, V.C. Nitrogen-doped activated carbons with high performances for CO2 adsorption. J. CO2 Util. 2022, 61, 102013. [Google Scholar] [CrossRef]
- Kalak, T.; Kaczmarek, M.; Nowicki, P.; Pietrzak, R.; Tachibana, Y.; Cierpiszewski, R. Preparation of nitrogen-enriched pine sawdust-based activated carbons and their application for copper removal from the aquatic environment. Wood Sci. Technol. 2022, 56, 1721–1742. [Google Scholar] [CrossRef]
- Li, Z.; Ma, X.; Xiong, S.; Ye, Y.; Yao, Z.; Lin, Q.; Zhang, Z.; Xiang, S. Facile synthesis of oxidized activated carbons for high-selectivity and low-enthalpy CO2 capture from flue gas. New J. Chem. 2018, 42, 4495–4500. [Google Scholar] [CrossRef]
- Enders, L.; Casadio, D.S.; Aikonen, S.; Lenarda, A.; Wirtanen, T.; Hu, T.; Hietala, S.; Ribeiro, L.S.; Pereira, M.F.R.; Helaja, J. Air oxidized activated carbon catalyst for aerobic oxidative aromatizations of N-heterocycles. Catal. Sci. Technol. 2021, 11, 5962–5972. [Google Scholar] [CrossRef]
- Deryło-Marczewska, A.; Skrzypczyńska, K.; Kuśmierek, K.; Świątkowski, A.; Zienkiewicz-Strzałka, M. The adsorptive properties of oxidized activated carbons and their applications as carbon paste electrode modifiers. Adsorption 2019, 25, 357–366. [Google Scholar] [CrossRef] [Green Version]
- Rustamaji, H.; Prakoso, T.; Devianto, H.; Widiatmoko, P.; Saputera, W.H. Urea nitrogenated mesoporous activated carbon derived from oil palm empty fruit bunch for high-performance supercapacitor. J. Energy Storage 2022, 52, 104724. [Google Scholar] [CrossRef]
- Nowicki, P.; Gruszczyńska, K.; Urban, T.; Wiśniewska, M. Activated biocarbons obtained from post-fermentation res-idue as potential adsorbents of organic pollutants from the liquid phase. Physicochem. Probl. Miner. Process. 2022, 58, 146357. [Google Scholar]
- Wiśniewska, M.; Rejer, K.; Pietrzak, R.; Nowicki, P. Biochars and activated biocarbons prepared via conventional py-rolysis and chemical or physical activation of mugwort herb as potential adsorbents and renewable fuels. Molecules 2022, 27, 8597. [Google Scholar] [CrossRef]
- Nowicki, P. The effect of mineral matter on the physicochemical and sorption properties of brown coal-based activated carbons. Adsorption 2015, 22, 561–569. [Google Scholar] [CrossRef] [Green Version]
- Charmas, B.; Zięzio, M.; Jedynak, K. Assessment of the Porous Structure and Surface Chemistry of Activated Biocarbons Used for Methylene Blue Adsorption. Molecules 2023, 28, 4922. [Google Scholar] [CrossRef]
- Liao, Y.; Shang, Z.; Ju, G.; Wang, D.; Yang, Q.; Wang, Y.; Yuan, S. Biomass Derived N-Doped Porous Carbon Made from Reed Straw for an Enhanced Supercapacitor. Molecules 2023, 28, 4633. [Google Scholar] [CrossRef]
- Shrestha, R.L.; Chaudhary, R.; Shrestha, T.; Tamrakar, B.M.; Shrestha, R.G.; Maji, S.; Hill, J.P.; Ariga, K.; Shrestha, L.K. Nanoarchitectonics of lotus seed derived nanoporous carbon materials for supercapacitor applications. Materials 2020, 13, 5434. [Google Scholar] [CrossRef]
- Kra, D.O.; Allou, N.B.; Atheba, P.; Drogui, P.; Trokourey, A. Preparation and Characterization of Activated Carbon Based on Wood (Acacia auriculeaformis, Côte d’Ivoire). J. Encapsulation Adsorpt. Sci. 2019, 09, 63–82. [Google Scholar] [CrossRef] [Green Version]
- Doczekalska, B.; Bartkowiak, M.; Waliszewska, B.; Orszulak, G.; Cerazy-Waliszewska, J.; Pniewski, T. Characterization of Chemically Activated Carbons Prepared from Miscanthus and Switchgrass Biomass. Materials 2020, 13, 1654. [Google Scholar] [CrossRef] [PubMed] [Green Version]
- Villabona-Ortíz, Á.; Figueroa-Lopez, K.J.; Ortega-Toro, R. Kinetics and Adsorption Equilibrium in the Removal of Azo-Anionic Dyes by Modified Cellulose. Sustainability 2022, 14, 3640. [Google Scholar] [CrossRef]
- Ying, Z.; Chen, X.; Li, H.; Liu, X.; Zhang, C.; Zhang, J.; Yi, G. Efficient Adsorption of Methylene Blue by Porous Biochar Derived from Soybean Dreg Using a One-Pot Synthesis Method. Molecules 2021, 26, 661. [Google Scholar] [CrossRef] [PubMed]
- Alcaraz, L.; Fernández, A.L.; García-Díaz, I.; López, F.A. Preparation and characterization of activated carbons from winemaking wastes and their adsorption of methylene blue. Adsorpt. Sci. Technol. 2018, 36, 1331–1351. [Google Scholar] [CrossRef] [Green Version]
- Tran, T.H.; Le, A.H.; Pham, T.H.; Nguyen, D.T.; Chang, S.W.; Chung, W.J. Adsorption isotherms and kinetic modeling of methylene blue dye onto a carbonaceous hydrochar adsorbent derived from coffee husk waste. Sci. Total. Environ. 2020, 725, 138325. [Google Scholar] [CrossRef]
- Angın, D.; Altintig, E.; Köse, T.E. Influence of process parameters on the surface and chemical properties of activated carbon obtained from biochar by chemical activation. Bioresour. Technol. 2013, 148, 542–549. [Google Scholar] [CrossRef]
- Fierro, V.; Muñiz, G.; Basta, A.; El-Saied, H.; Celzard, A. Rice straw as precursor of activated carbons: Activation with ortho-phosphoric acid. J. Hazard. Mater. 2010, 181, 27–34. [Google Scholar] [CrossRef]
- Przytulska, A.; Gargol, M.; Gil-Kowalczyk, M.; Nowicki, P. Removal of methylene blue from aqueous solutions via ad-sorption on activated biocarbon obtained from post-extraction residue. Physicochem. Probl. Min. Process. 2022, 58, 146709. [Google Scholar]
- Da Silva Lacerda, V.; Lopez-Sotelo, J.B.; Correa-Guimaraes, A.; Hernandez-Navarro, S.; Sanchez-Bascones, M.; Na-vas-Gracia, L.M.; Martin-Ramos, P.; Martin-Gil, J. Rhodamine B removal with activated carbons obtained from ligno-cellulosic waste. J. Environ. Manag. 2015, 155, 67–76. [Google Scholar] [CrossRef] [Green Version]
- Danish, M.; Ahmad, T.; Hashim, R.; Said, N.; Akhtar, M.N.; Mohamad-Saleh, J.; Sulaiman, O. Comparison of surface properties of wood biomass activated carbons and their application against rhodamine B and methylene blue dye. Surfaces Interfaces 2018, 11, 1–13. [Google Scholar] [CrossRef]
- Ding, L.; Zou, B.; Gao, W.; Liu, Q.; Wang, Z.; Guo, Y.; Wang, X.; Liu, Y. Adsorption of rhodamine-B from aqueous so-lution using treated rice husk-based activated carbon. Colloids Surf. A Physicochem. Eng. Asp. 2014, 446, 1–7. [Google Scholar] [CrossRef]
- Gad, H.M.; El-Sayed, A.A. Activated carbon from agricultural by-products for the removal of Rhodamine-B from aqueous solution. J. Hazard. Mater. 2009, 168, 1070–1081. [Google Scholar] [CrossRef]
- Li, A.; Huang, W.; Qiu, N.; Mou, F.; Wang, F. Porous carbon prepared from lotus leaves as potential adsorbent for effi-cient removal of rhodamine B. Mater. Res. Express 2020, 7, 055505. [Google Scholar] [CrossRef]
- Rao, W.; Piliouras, P.; Wang, X.; Guido, A.; Kugler, K.; Sieren, B.; Wang, L.; Lv, G.; Li, Z. Zwitterionic dye rhodamine B (RhB) uptake on different types of clay minerals. Appl. Clay Sci. 2020, 197, 105790. [Google Scholar] [CrossRef]
- Wawrzyniak, A.; Wiśniewska, M.; Nowicki, P. Carbon Adsorbents Obtained from Pistachio Nut Shells Used as Potential Ingredients of Drinking Water Filters. Molecules 2023, 28, 4497. [Google Scholar] [CrossRef]
- Szymańska, M.; Nowicki, P. Used Filter Cartridges as Potential Adsorbents of Organic Pollutants. Water 2023, 15, 714. [Google Scholar] [CrossRef]
- Foo, K.; Hameed, B. Insights into the modeling of adsorption isotherm systems. Chem. Eng. J. 2010, 156, 2–10. [Google Scholar] [CrossRef]
- Marković, D.D.; Lekić, B.M.; Rajaković-Ognjanović, V.N.; Onjia, A.E.; Rajaković, L.V. A New Approach in Regression Analysis for Modeling Adsorption Isotherms. Sci. World J. 2014, 2014, 930879. [Google Scholar] [CrossRef] [Green Version]


| Sample | Ash | Cdaf 1 | Hdaf | Ndaf | Sdaf | Odiff 2 |
|---|---|---|---|---|---|---|
| Precursor | 9.2 | 49.1 | 7.2 | 2.7 | 0.6 | 40.4 |
| P | 26.2 | 75.8 | 1.2 | 4.0 | 0.3 | 18.7 |
| POX | 2.7 | 69.6 | 2.4 | 4.2 | 0.3 | 23.5 |
| PN | 21.6 | 83.4 | 1.6 | 4.7 | 0.4 | 9.9 |
| C | 8.5 | 84.5 | 3.9 | 2.0 | 0.2 | 9.4 |
| COX | 4.3 | 69.5 | 1.3 | 4.1 | 0.2 | 24.9 |
| CN | 5.9 | 84.8 | 3.6 | 4.6 | 0.1 | 6.9 |
| Sample | Acidic Groups Content [mmol/g] | Basic Groups Content [mmol/g] | Total Content of Surface Groups [mmol/g] | pH of Aqueous Extracts |
|---|---|---|---|---|
| Precursor | 0.74 | 1.19 | 1.93 | 5.09 |
| P | 0.00 | 5.28 | 5.28 | 10.99 |
| POX | 2.72 | 0.90 | 3.62 | 3.65 |
| PN | 0.15 | 4.17 | 4.32 | 10.65 |
| C | 1.18 | 0.60 | 1.78 | 2.62 |
| COX | 1.27 | 1.05 | 2.32 | 4.67 |
| CN | 0.55 | 1.27 | 1.82 | 6.11 |
| Sample | Total 1 | Micropore | Micropore Contribution [%] | Mean Pore Size [nm] | ||
|---|---|---|---|---|---|---|
| Surface Area [m2/g] | Pore Volume [cm3/g] | Area [m2/g] | Volume [cm3/g] | |||
| P | 2 | 0.034 | - | - | - | 67.280 |
| POX | 342 | 0.275 | 278 | 0.155 | 56.4 | 3.210 |
| PN | 56 | 0.117 | 10 | 0.005 | 4.3 | 8.255 |
| C | 316 | 0.460 | 130 | 0.070 | 15.2 | 5.802 |
| COX | 146 | 0.252 | 39 | 0.020 | 7.9 | 6.894 |
| CN | 333 | 0.449 | 167 | 0.087 | 19.4 | 5.389 |
| Sample | T1/°C | T2/°C | T3/°C | T4/°C | T5/°C | T6/°C | ITD/°C | Residual Mass (%) |
|---|---|---|---|---|---|---|---|---|
| P-H | 56.6 | 140.7 | 551.7 | 656.2 | 786.1 | 931.3 | 682.8 | 59.7 |
| POX-H | 52.7 | 276.0 | 582.6 | 677.0 | -- | -- | 850.0 | 63.7 |
| PN-H | 62.0 | -- | -- | 674.2 | -- | -- | 746.5 | 80.2 |
| P-A | 67.4 | 145.1 | 407.1 465.3 | 674.7 | 821.7 | -- | 257.9 | 29.7 |
| POX-A | 71.7 | 271.6 | 591.2 | -- | -- | -- | 364.8 | 15.8 |
| PN-A | 67.7 | -- | 485.0 559.7 | 658.8 | -- | -- | 286.7 | 26.0 |
| Sample | D1/°C | D2/°C | D3/°C | D4/°C | D5/°C | ITD/°C |
|---|---|---|---|---|---|---|
| P-H | * 43.6 | * 140.9 | * 664.1 | -- | -- | 772.9 |
| POX-H | * 51.4 | * 292.6 * 359.3 | * 483.1 * 523.5 | * 657.1 * 695.0 | -- | 861.9 |
| PN-H | * 44.0 | -- | * 476.1 * 536.6 | * 675.7 | -- | 865.2 |
| P-A | Below * 80.7 | * 149.0 | ** 417.2, ** 477.6 | ** 668.6 | ** 847.9 | 293.6 |
| POX-A | * 65.7 | * 207.4 | ** 592.8 | -- | -- | 282.2 |
| PN-A | Below * 92.8 | -- | ** 479.5, ** 563.6 | -- | -- | 290.1 |
| Sample | T1/°C | T2/°C | T3/°C | T4/°C | T5/°C | ITD/°C | Residual Mass (%) |
|---|---|---|---|---|---|---|---|
| C-H | 47.1 | 230.4 | 581.7 | 657.8 | 870.0 | 750.5 | 79.5 |
| COX-H | 57.7 | 307.9 | 510.2 | 583.2 | 650.8 | 846.3 | 57.5 |
| CN-H | 53.6 | 211.2 | 483.1 | 577.7 | 651.0 | 810.7 | 81.0 |
| C-A | 60.8 | 223.8 | 397.5 613.0 713.6 | -- | -- | 327.5 | 9.0 |
| COX-A | 73.8 | -- | 295.4 517.9 | 723.0 | -- | 161.3 | 9.0 |
| CN-A | 47.4 | 221.3 | 400.5 622.9 | -- | -- | 330.0 | 5.2 |
| Sample | D1/°C | D2/°C | D3/°C | D4/°C | D5/°C | D6/°C | ITD/°C |
|---|---|---|---|---|---|---|---|
| C-H | * 43.3 | * 236.2 | -- | * 526.3 | * 663.3 | 758.1 | |
| COX-H | * 54.5 | * 223.0 | * 366.7 | * 460.8 | * 548.6 | * 653.5 * 697.8 | 780.9 |
| CN-H | * 59.6 | * 200.4 | * 360.3 * 433.3 | -- | * 567.4 * 609.5 * 665.4 | -- | 770.9 |
| C-A | Below * 102.0 | * 283.3 | ** 602.3 ** 729.6 | -- | -- | -- | 427.2 |
| COX-A | * 80.8 | -- | ** 513.7 ** 568.1 | ** 740.5 | -- | -- | 232.3 |
| CN-A | * 48.5 | -- | ** 385.2 ** 609.1 | -- | -- | -- | 285.7 |
| Sample | qe | Langmuir Model | Freundlich Model | ||||
|---|---|---|---|---|---|---|---|
| qm | KL | R2 | KF | 1/n | R2 | ||
| P | 11.75 | 11.59 | 10.3976 | 0.9990 | 8.8064 | 0.1916 | 0.6846 |
| POX | 35.54 | 36.90 | 24.6364 | 0.9958 | 32.5013 | 0.0658 | 0.8480 |
| PN | 14.54 | 14.66 | 8.7436 | 0.9995 | 10.9597 | 0.1244 | 0.8485 |
| C | 87.48 | 86.21 | 2.1887 | 0.9977 | 53.9511 | 0.2037 | 0.8307 |
| COX | 278.99 | 277.78 | 36.0000 | 0.9883 | 271.1440 | 0.2704 | 0.9235 |
| CN | 56.50 | 55.87 | 4.9722 | 0.9982 | 42.4131 | 0.1021 | 0.9558 |
| Sample | qe | Langmuir Model | Freundlich Model | ||||
|---|---|---|---|---|---|---|---|
| qmax | KL | R2 | KF | 1/n | R2 | ||
| P | 2.79 | 2.23 | 2.3996 | 0.8901 | 7.2011 | 0.0890 | 0.2307 |
| POX | 4.75 | 4.51 | 0.5985 | 0.9396 | 6.6681 | 0.2215 | 0.9091 |
| PN | - | - | - | - | - | - | - |
| C | 56.12 | 56.82 | 1.5575 | 0.9982 | 34.8980 | 0.1668 | 0.9726 |
| COX | 96.12 | 99.04 | 0.0176 | 0.9944 | 46.6982 | 0.3172 | 0.6727 |
| CN | 51.63 | 52.91 | 2.9077 | 0.9977 | 35.9584 | 0.1381 | 0.5773 |
| Adsorbent | Maximum Adsorbed Amount [mg/g] | Reference |
|---|---|---|
| Methylene blue | ||
| Biochar from soybean dreg | 1274 | [49] |
| Activated carbon from bagasse and cluster stalks | 714–847 | [50] |
| Hydrochar from coffee husks | 418 | [51] |
| Activated carbons from safflower seed | 128 | [52] |
| Activated carbon from rice straw | 109 | [53] |
| Commercial activated carbon from peat | 161 | [54] |
| COX | 279 | This study |
| Rhodamine B | ||
| Activated carbon from lignocellulosic waste | 33 | [55] |
| Activated carbon from wood biomass | 77 | [56] |
| Activated carbon from rice husk | 181 | [57] |
| Activated carbon from bagasse pith | 199 | [58] |
| Activated carbon from lotus leaves | 701 | [59] |
| COX | 96 | This study |
Disclaimer/Publisher’s Note: The statements, opinions and data contained in all publications are solely those of the individual author(s) and contributor(s) and not of MDPI and/or the editor(s). MDPI and/or the editor(s) disclaim responsibility for any injury to people or property resulting from any ideas, methods, instructions or products referred to in the content. |
© 2023 by the authors. Licensee MDPI, Basel, Switzerland. This article is an open access article distributed under the terms and conditions of the Creative Commons Attribution (CC BY) license (https://creativecommons.org/licenses/by/4.0/).
Share and Cite
Dąbrowska, W.; Gargol, M.; Gil-Kowalczyk, M.; Nowicki, P. The Influence of Oxidation and Nitrogenation on the Physicochemical Properties and Sorption Capacity of Activated Biocarbons Prepared from the Elderberry Inflorescence. Molecules 2023, 28, 5508. https://doi.org/10.3390/molecules28145508
Dąbrowska W, Gargol M, Gil-Kowalczyk M, Nowicki P. The Influence of Oxidation and Nitrogenation on the Physicochemical Properties and Sorption Capacity of Activated Biocarbons Prepared from the Elderberry Inflorescence. Molecules. 2023; 28(14):5508. https://doi.org/10.3390/molecules28145508
Chicago/Turabian StyleDąbrowska, Wiktoria, Mateusz Gargol, Małgorzata Gil-Kowalczyk, and Piotr Nowicki. 2023. "The Influence of Oxidation and Nitrogenation on the Physicochemical Properties and Sorption Capacity of Activated Biocarbons Prepared from the Elderberry Inflorescence" Molecules 28, no. 14: 5508. https://doi.org/10.3390/molecules28145508