Article

Identification of the Metabolites of Both Formononetin in Rat Hepatic S9 and Ononin in Rat Urine Samples and Preliminary Network Pharmacology Evaluation of Their Main Metabolites

1
College of Pharmacy, Guizhou University of Traditional Chinese Medicine, Guiyang 550025, China
2
School of Chinese Medicine, Hong Kong Baptist University, Hong Kong SAR 999077, China
3
Departments of, Medicine and Biomedical Engineering, Faculty of Medicine and Health Sciences, McGill University, Montreal, QC H3G1Y6, Canada
4
First Clinical Medical College, Guizhou University of Traditional Chinese Medicine, Guiyang 550001, China
*
Authors to whom correspondence should be addressed.
These authors contributed equally to this work.
Molecules 2023, 28(21), 7451; https://doi.org/10.3390/molecules28217451
Submission received: 9 September 2023 / Revised: 26 October 2023 / Accepted: 27 October 2023 / Published: 6 November 2023
(This article belongs to the Special Issue Therapeutic and Nutraceutical Values of Functional Food)

Abstract

:
Astragalus membranaceus is a traditional Chinese medicine derived from the roots of Astragalus membranaceus (Fisch.) Bge., which has the same medicinal and edible uses in China. It is also widely used in daily food, and its pharmacological effects mainly include antioxidant effects, vascular softening effects, etc. Currently, it is increasingly widely used in the prevention of hypertension, cerebral ischemia, and stroke in China. Formononetin and its glucopyranoside (ononin) are both important components of Astragalus membranaceuss and may play important roles in the treatment of cardiovascular diseases (CVDs). This study conducted metabolic studies using formononectin and its glucopyranoside (ononin), including a combination of the in vitro metabolism of Formonetin using rat liver S9 and the in vivo metabolism of ononin administered orally to rats. Five metabolites (Sm2, 7, 9, 10, and 12) were obtained from the solution incubated with formononetin and rat hepatic S9 fraction using chromatographic methods. The structures of the five metabolites were elucidated as (Sm2)6,7,4′-trihydroxy-isoflavonoid; (Sm7)7,4′-dihydroxy-isoflavonoid; (Sm9)7,8,4′-trihydroxy-isoflavonoid; (Sm10)7,8,-dihydroxy-4′-methoxy-isoflavonoid; and (Sm12)6,7-dihydroxy-4′-methoxy- isoflavonoid on the basis of UV, NMR, and MS data. Totally, 14 metabolites were identified via HPLC-DAD-ESI-IT-TOF-MSn analysis, from which the formononetin was incubated with rat hepatic S9 fraction, and the main metabolic pathways were hydroxylation, demethylation, and glycosylation. Then, 21 metabolites were identified via HPLC-DAD-ESI-IT-TOF-MSn analysis from the urine samples from SD rats to which ononin was orally administered, and the main metabolic pathways were glucuronidation, hydroxylation, demethylation, and sulfonation. The main difference between the in vitro metabolism of formononetin and the in vivo metabolism of ononin is that ononin undergoes deglycemic transformation into Formonetin in the rat intestine, while Formonetin is absorbed into the bloodstream for metabolism, and the metabolic products also produce combined metabolites during in vivo metabolism. The six metabolites obtained from the aforementioned separation indicate the primary forms of formononetin metabolism, and due to their higher contents of similar isoflavone metabolites, they are considered the main active compounds that are responsible for pharmacological effects. To investigate the metabolites of the active ingredients of formononetin in the rat liver S9 system, network pharmacology was used to evaluate the cardiovascular disease (CVD) activities of the six primary metabolites that were structurally identified. Additionally, the macromolecular docking results of six main components and two core targets (HSP90AA1 and SRC) related to CVD showed that formononetin and its main metabolites, Sm10 and Sm12, may have roles in CVD treatment due to their strong binding activities with the HSP90AA1 receptor, while the Sm7 metabolite may have a role in CVD treatment due to its strong binding activity with the SRC receptor.

1. Introduction

Astragalus membranaceus is a traditional Chinese medicine derived from the roots of Astragalus membranaceus (Fisch.) Bge., which has the same medicinal and edible uses in China. It is also widely used in daily food, and its pharmacological effects mainly include antioxidant effects, vascular softening effects, etc. Currently, it is increasingly widely used in the prevention of hypertension, cerebral ischemia, and stroke in China [1,2]. Formononetin and its glucopyranoside (ononin) are both important components of Astragalus membranaceuss, which may play crucial roles in treating cardiovascular diseases (CVDs) [3,4].
Formononetin, a widely distributed natural phytoestrogen, is an important active component in various traditional Chinese medicines, such as Astragali radix, Ononis spinosa, Trifolium pratense L., etc. Its effectiveness has been demonstrated in cancer prevention, in cardiovascular function protection, and in osteoporosis treatment [1,2,3,4,5].
Ononin, the 7-O-glucoside of formononetin, is another significant active constituent and severs as the precursor of formononetin in plants. It exhibits diverse biological activities, including immune regulation, antioxidant effects, and phytoestrogenic properties [6,7,8].
Previous studies on the metabolism of formononetin have indicated numerous metabolites and metabolic pathways, encompassing a 2,3-double bond reduction (dihydroformononetin), 4-carbonyl reduction (equol), open-loop of the B-ring (angolensin), hydroxylation and demethylation reactions, and all metabolites identified through a high-resolution spectral analysis [9,10,11,12,13]. Therefore, it is necessary to investigate the metabolic process of ononin and compare it to that of formononetin by examining the differences in their internal and external metabolisms. By comparison, formononetin was used in rat liver S9 for in vitro metabolic studies to elucidate the main metabolic functions of the liver; however, the overall administration of ononin involves other possible metabolites besides liver metabolism, such as the effects of the gutbacteria and kidneys. The impact of these metabolites with the same isoflavone structure on cardiovascular disease remains unstudied.
Due to the limited oral absorption of formononetin and ononin, it was challenging to comprehensively elucidate the structures of their metabolites though the entire experiment covering the whole metabolic process [14,15]. When administered via oral gavage, ononin is metabolized into formononetin and then absorbed into the blood in the rat intestine [16,17]. This study aims to profile the main metabolites of formononetin in vitro and the main metabolites of ononin in vivo. The formononetin was incubated in hepatic S9 in vitro (mainly phase Ⅰ metabolites) and the ononin was administered via oral gavage to rats in vivo (mainly phase Ⅱ metabolites) [14,15,18,19]. The metabolites in the above samples were analyzed using high-resolution mass spectrometry (HPLC-DAD-ESI-IT-TOF-MSn), and for the rat liver S9 experimental sample of formononetin, we isolated the major metabolites using chromatographic techniques. Due to the fact that these metabolites share the same isoflavone structure, the higher their contents, the more likely they are to be main active forms for treating associated diseases. Furthermore, the isoflavones in Astragalus membranaceus have long been recognized in traditional Chinese medicine for the treatment of CVDs [1,2]. Finally, network pharmacology was employed to study the core metabolites and potential targets associated with CVDs, aiming to identify their main receptors involved in the treatment of CVDs [20,21,22,23]. Moreover, a comparative analysis of the binding activities of these metabolites with those of the respective receptors was conducted, aiming to identify the metabolite exhibiting the highest binding affinity towards the corresponding receptor. Such findings will guide the future applications of formononetin, onion, and their main metabolites [24].

2. Results and Discussion

2.1. Isolation and Determination of the Structure of Formononetin Metabolites

By means of chromatographic methods, five metabolites (Sm2, 7, 9, 10, and 12) were isolated from rat hepatic S9 mixtures incubated with formononetin (Table 1).
Compound Sm2
Sm2 was obtained as a white powder, and it showed [M+H]+ at m/z 271.0597 (predicted to be C15H11O5; theoretical mass: 271.0606; error: −3.32 ppm) in the PI (positive ionization) mass spectrum of HR-TOF-MS, indicating that its molecular formula was C15H10O5. The molecular formula had one more oxygen atom and one less methylene than that of formononetin, suggesting that Sm2 is a monohydroxylated and demethylated metabolite.
1H-NMR and 13C-NMR data: In the 1H-NMR spectrum, the signal assigned to H-OCH3 was not observed at δ 3.77 (3H, s) unlike that of formononetin, while it showed one more hydroxyl at δ 9.74 (1H, brs). The signal assigned to H-6 was not observed at δ 6.91 (1H, d, J = 2.0, 8.8 Hz), unlike that of formononetin, while it showed one more hydroxyl at δ 9.48 (1H, brs). The 13C-NMR spectrum of Sm2 revealed 15 carbon signals and had one less methyl signal at δ 55.6 (C-OCH3) in contrast to that of formononetin, suggesting that demethylation occurred at the methoxyl group linked to C-4′. Sm2 exhibited a C-6 signal at δ 152.6, which was shifted downfield of that of C-8 at δ 115.6 in formononetin, suggesting that the newly added hydroxyl group was linked to C-6. The structure of Sm2 was found to be as 6-hydroxy-4′-demethyl-formononetin via a comparison of its spectral data to those of 6-hydroxy-4′-demethyl-formononetin in the literature [9].
Compound Sm7
Sm7 was obtained as a white powder, and it showed [M+H]+ at m/z 255.0659 (predicted to be C15H11O4; theoretical mass: 255.0657; error: 0.78 ppm) in the PI mass spectrum of HR-TOF-MS, indicating that its molecular formula was C15H10O4. The molecular formula had one less methylene than that of formononetin, suggesting that Sm7 was a demethylated metabolite.
1H-NMR and 13C-NMR data: In the 1H-NMR spectrum, the signal assigned to H-OCH3 was not observed at δ 3.77 (3H, s) in contrast to that of formononetin, and it showed one more hydroxyl at δ 9.50 (1H, brs). The 13C-NMR spectrum of Sm7 revealed 15 carbon signals, and it had one less methyl signal at δ 55.6 (C-OCH3), unlike that of formononetin, suggesting that the demethylation occurred at the methoxyl group linked to C-4′. The structure of Sm7 was elucidated as 4′-demethyl-formononetin (daizein) via a comparison of its spectral data to those of daizein in the literature [25].
Compound Sm9
Sm9 was obtained as a white powder, and it showed [M+H]+ at m/z 271.0597 (predicted to be C15H11O5; theoretical mass: 271.0606; error: −3.32 ppm) in the PI mass spectrum of HR-TOF-MS, indicating that its molecular formula was C15H10O5. The molecular formula had one more oxygen atom and one less methylene atom than that of formononetin, suggesting that Sm9 was a monohydroxylated and demethylated metabolite.
1H-NMR and 13C-NMR data: In the 1H-NMR spectrum, the signal assigned to H-OCH3 was not observed at δ 3.77 (3H, s) in contrast to that of formononetin, and it showed one more hydroxyl at δ 9.50 (1H, brs), and the signal assigned to H-8 was not observed at δ 6.85 (1H, d, J = 2.0 Hz) in contrast to that of formononetin, and showed one more hydroxyl at δ 9.40 (1H, brs). The 13C-NMR spectrum of Sm9 revealed 15 carbon signals, and it had one less methyl signal at δ 55.6 (C-OCH3), unlike formononetin. This suggests that demethylation occurred at the methoxyl group linked to C-4′.
Sm9 exhibited a C-8 signal at δ 133.3, which was shifted downfield relative to that of C-8 at δ 102.6 in formononetin, suggesting that the newly added hydroxyl group was linked to C-8. The structure of Sm9 was found to be 8-hydroxy-4′-demethyl-formononetin via a comparison of its spectral data to those of 8-hydroxy-4′-demethyl-formononetin in the literature [26].
Compound Sm10
Sm10 was obtained as a white powder, and it showed [M+H]+ at m/z 285.0755 (predicted to be C16H13O5; theoretical mass: 285.0763; error: −2.81 ppm) in the PI mass spectrum of HR-TOF-MS, indicating that its molecular formula was C16H12O5. The molecular formula had one more oxygen atom than that of formononetin, suggesting that Sm10 was a monohydroxylated metabolite.
1H-NMR and 13C-NMR data: In the 1H-NMR spectrum, the signal assigned to H-8 was not observed at δ 6.85 (1H, d, J = 2.0 Hz), unlike that of formononetin. One more hydroxy was observed at δ 9.42 (1H, brs). The 13C-NMR spectrum of Sm10 exhibited a C-8 signal at δ 133.4, which was shifted downfield relative to that of C-8 at δ 102.6 in formononetin, suggesting that the newly added hydroxyl group was linked to C-8. In this way, the structure of Sm10 was found to be 8-hydroxy-formononetin via a comparison of its spectral data to those of 8-hydroxy-formononetin in the literature [27].
Compound Sm12
Sm12 was obtained as a white powder, and it showed [M+H]+ at m/z 285.0811 (predicted to be C16H13O5; theoretical mass: 285.0763; error: −1.77 ppm) in the PI mass spectrum of HR-TOF-MS, indicating that its molecular formula was C16H12O5. The molecular formula had one more oxygen atom than that of formononetin, suggesting that Sm12 was a monohydroxylated metabolite.
1H-NMR and 13C-NMR data: In the 1H-NMR spectrum, the signal assigned to H-6 was not observed at δ 7.94 (1H, d, J = 8.8 Hz), unlike that of formononetin, and it showed one more hydroxyl at δ 9.77 (1H, brs). The 13C-NMR spectrum of Sm12 exhibited a C-6 signal at δ 152.7, which was shifted downfield relative to that of C-6 at δ 115.6 in formononetin, suggesting that the newly added hydroxyl group was linked to C-6. In this way, the structure of Sm12 was found to be 6-hydroxy-formononetin via a comparison of its spectral data to those of 6-hydroxy-formononetin in the literature [28].

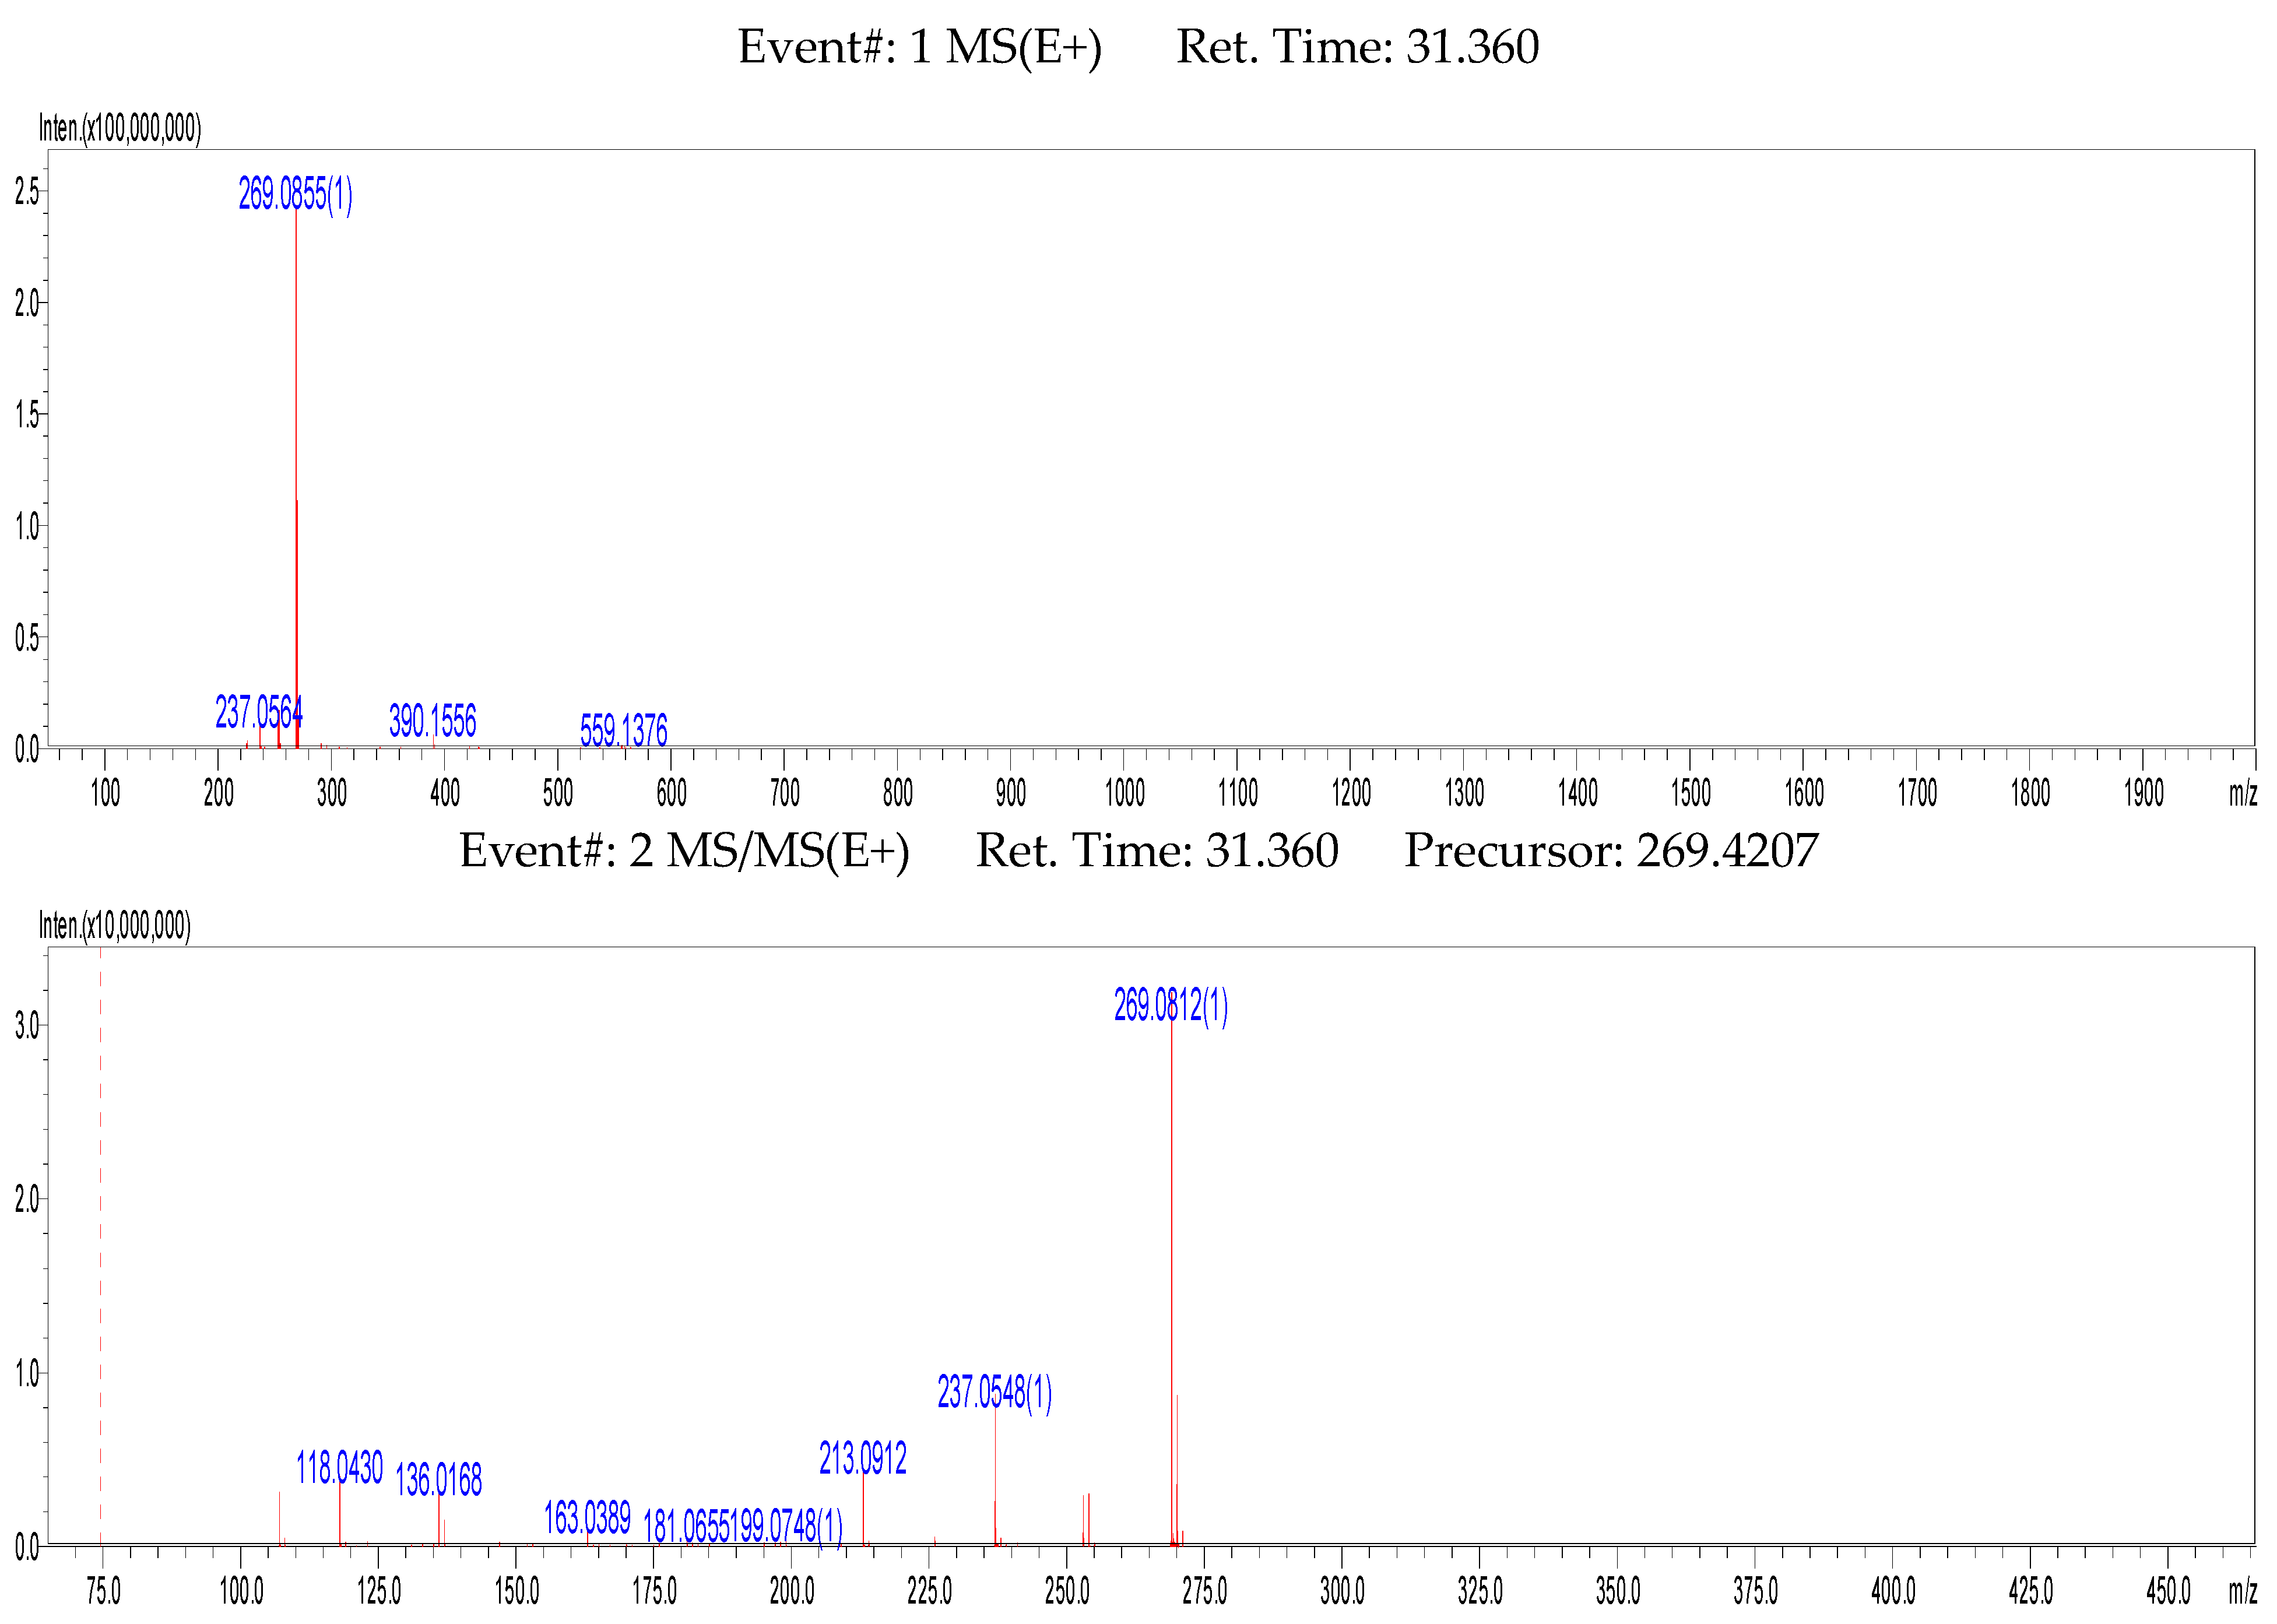
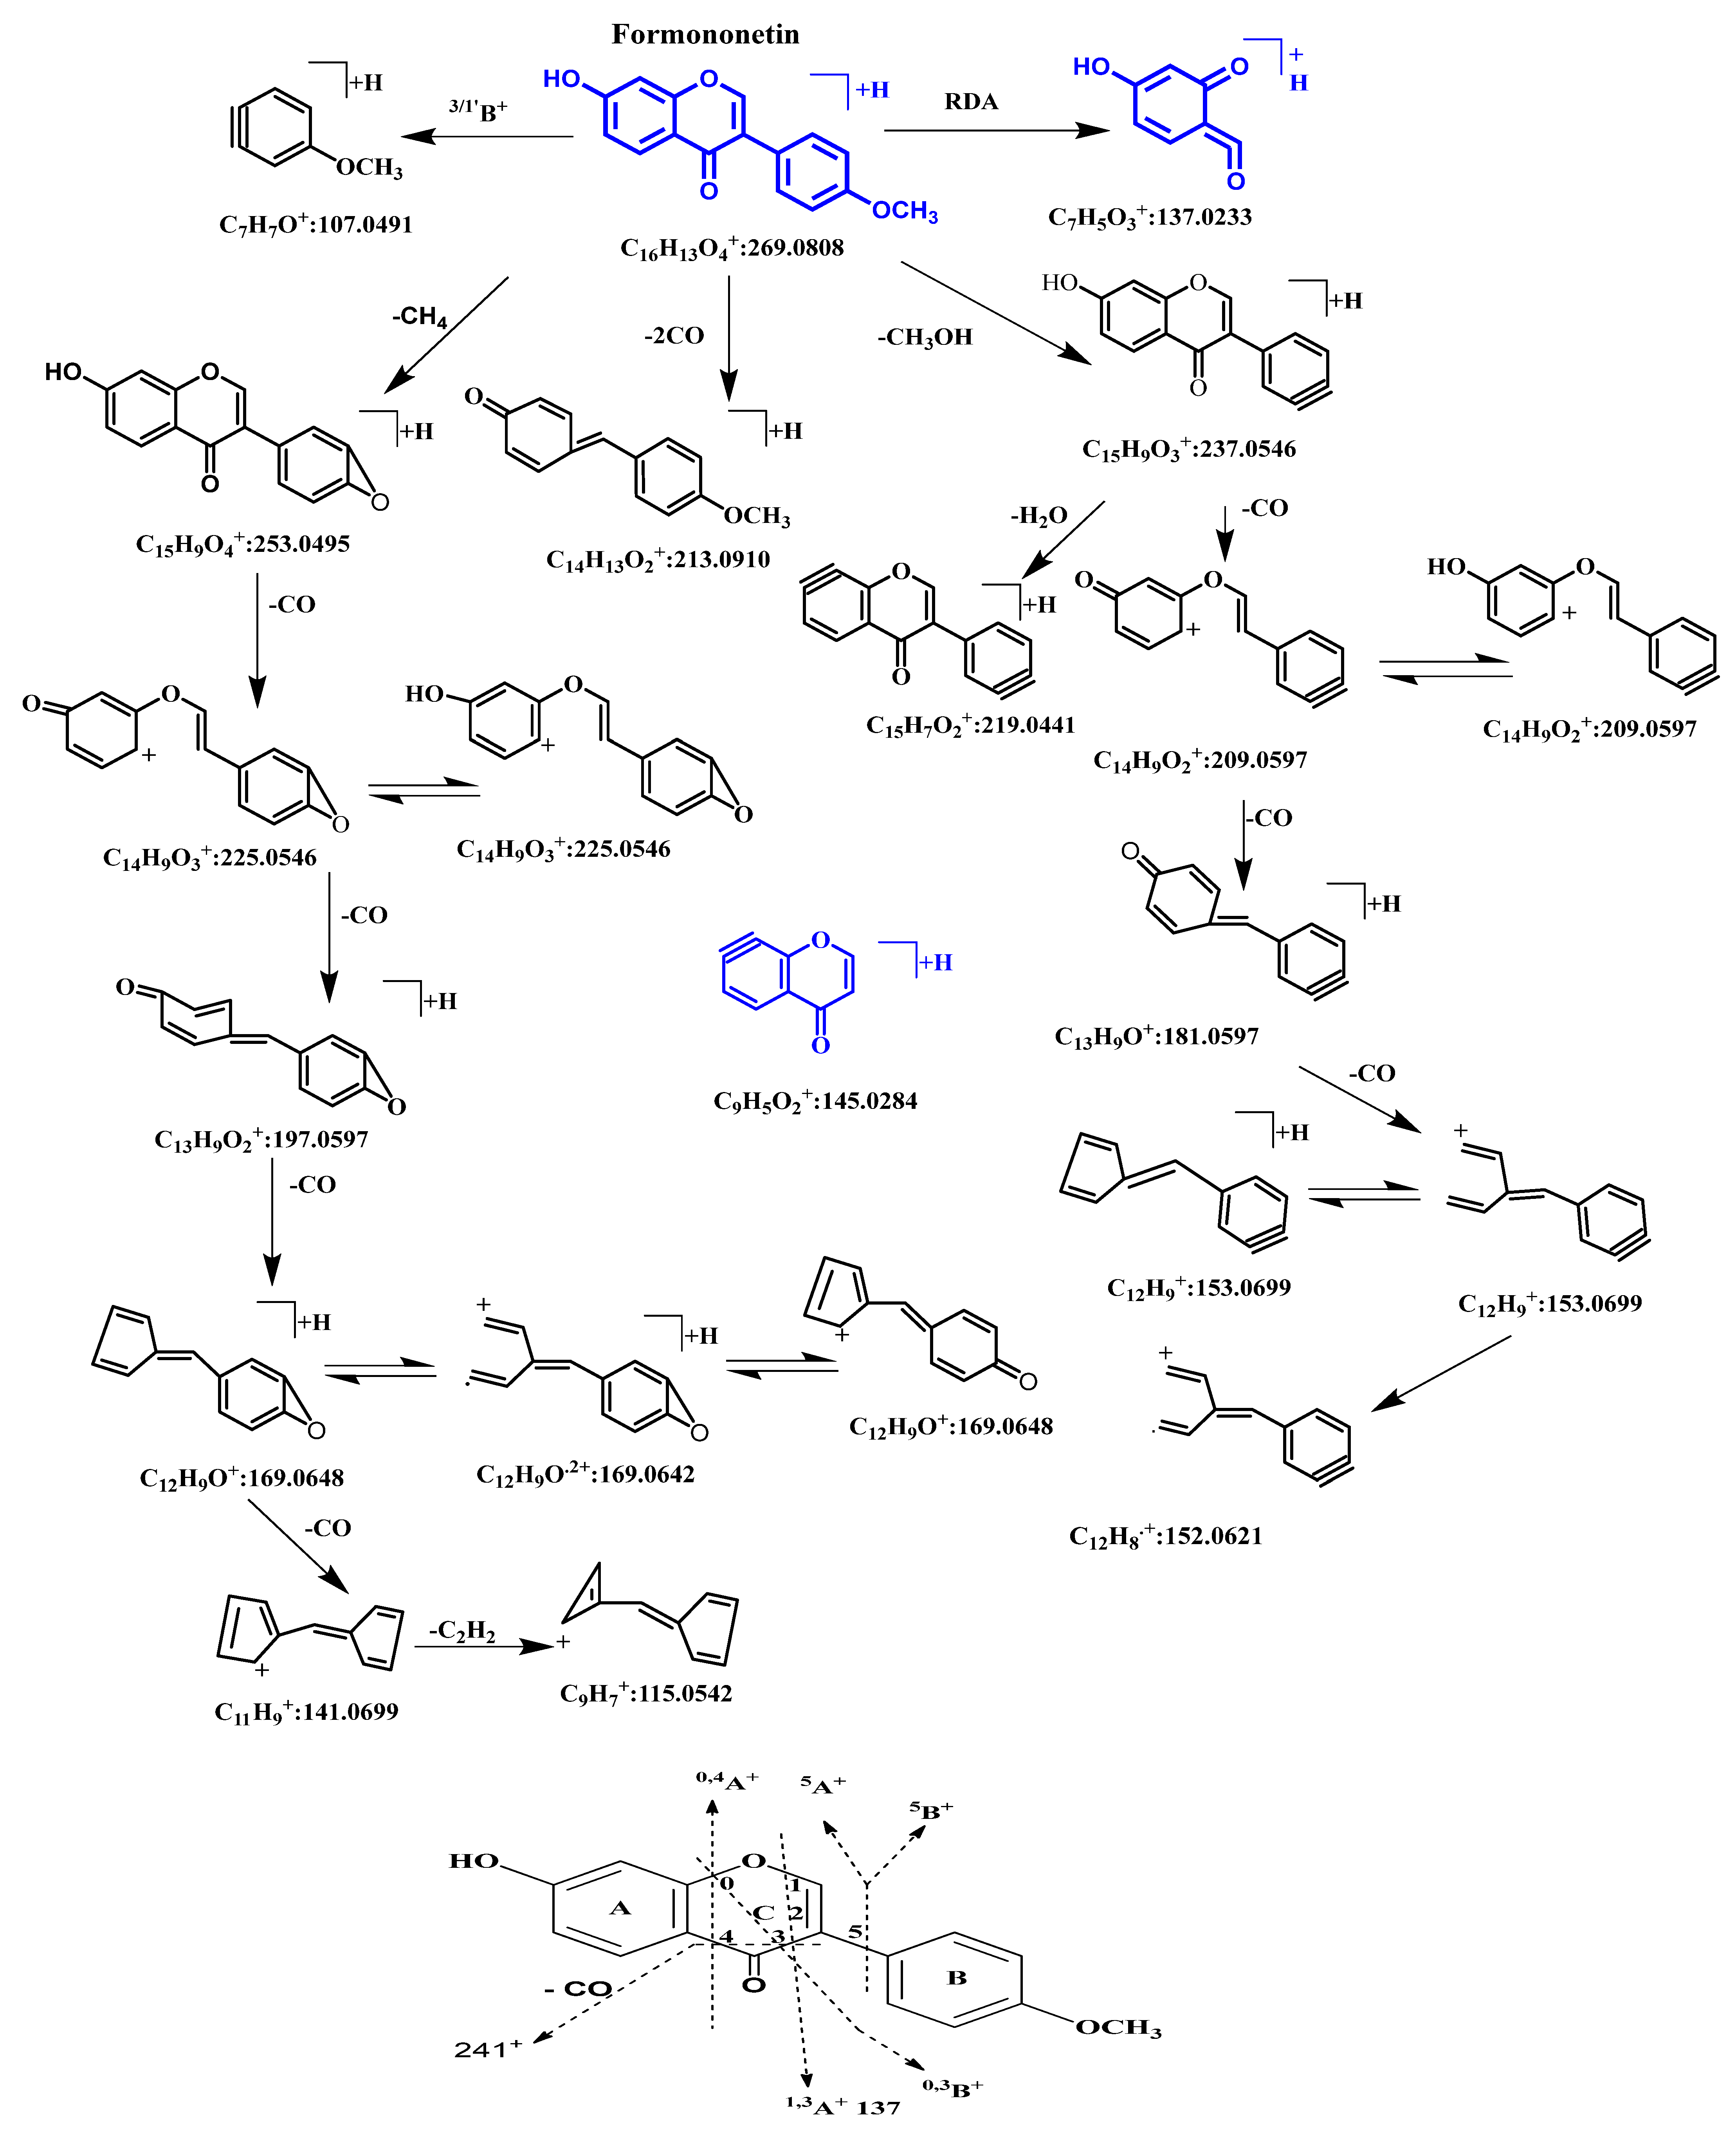
2.2. MSn Fragmentation Behavior of Formononetin

To identify and help elucidate the structures of the metabolites, we first studied the MSn fragmentation behavior of formononetin in the PI (positive ionization) mode and NI (negative ionization) mode. We found that the fragmentation behavior in the PI mode can give more information about the structure than in the NI mode [29,30,31]. We elucidated the structure of the metabolites mostly via a PI mass spectrum, which is shown in Figure 1.
Formononetin had a retention time of 31.205 min. It showed [M+H]+ at m/z 269.0852 (predicated mass: 269.0773; error: 4.49 ppm; element composition: C16H13O4) in the PI mass spectrum and showed [M−H] at m/z 267.0669 in the NI mass spectrum. Its molecular formula was determined to be C16H12O4. In the MS2 PI mass spectrum, it showed a base peak at m/z 269.0812 [M+H]+ and was accompanied by several distinctive fragment ions, including 5B+–2H, 5A+–2H, 1,3A+–2H, M+–CH3OH, M+–CH3OH–CO, M+–CH4, etc. [29,30,31,32,33]. Based on the MS2 and MS3 spectra, its major fragmentation pathways in the PI mode were proposed and are shown in Figure 2.
We used the characteristic retro-Diels–Alder (RDA) cracking fragment (1,3A+–2H; 137) of isoflavone to determine the oxidation of the metabolites; the glucose- and pentose-binding metabolites, with a neutral loss (−162; 132) of the molecular ion peak in the MS2 spectra; glucuronidated metabolites with a neutral loss (−176) of the molecular ion peak in the MS2 spectra; and sulfated metabolites with a neutral loss (−80) of the molecular ion peak in the MS2 spectra.

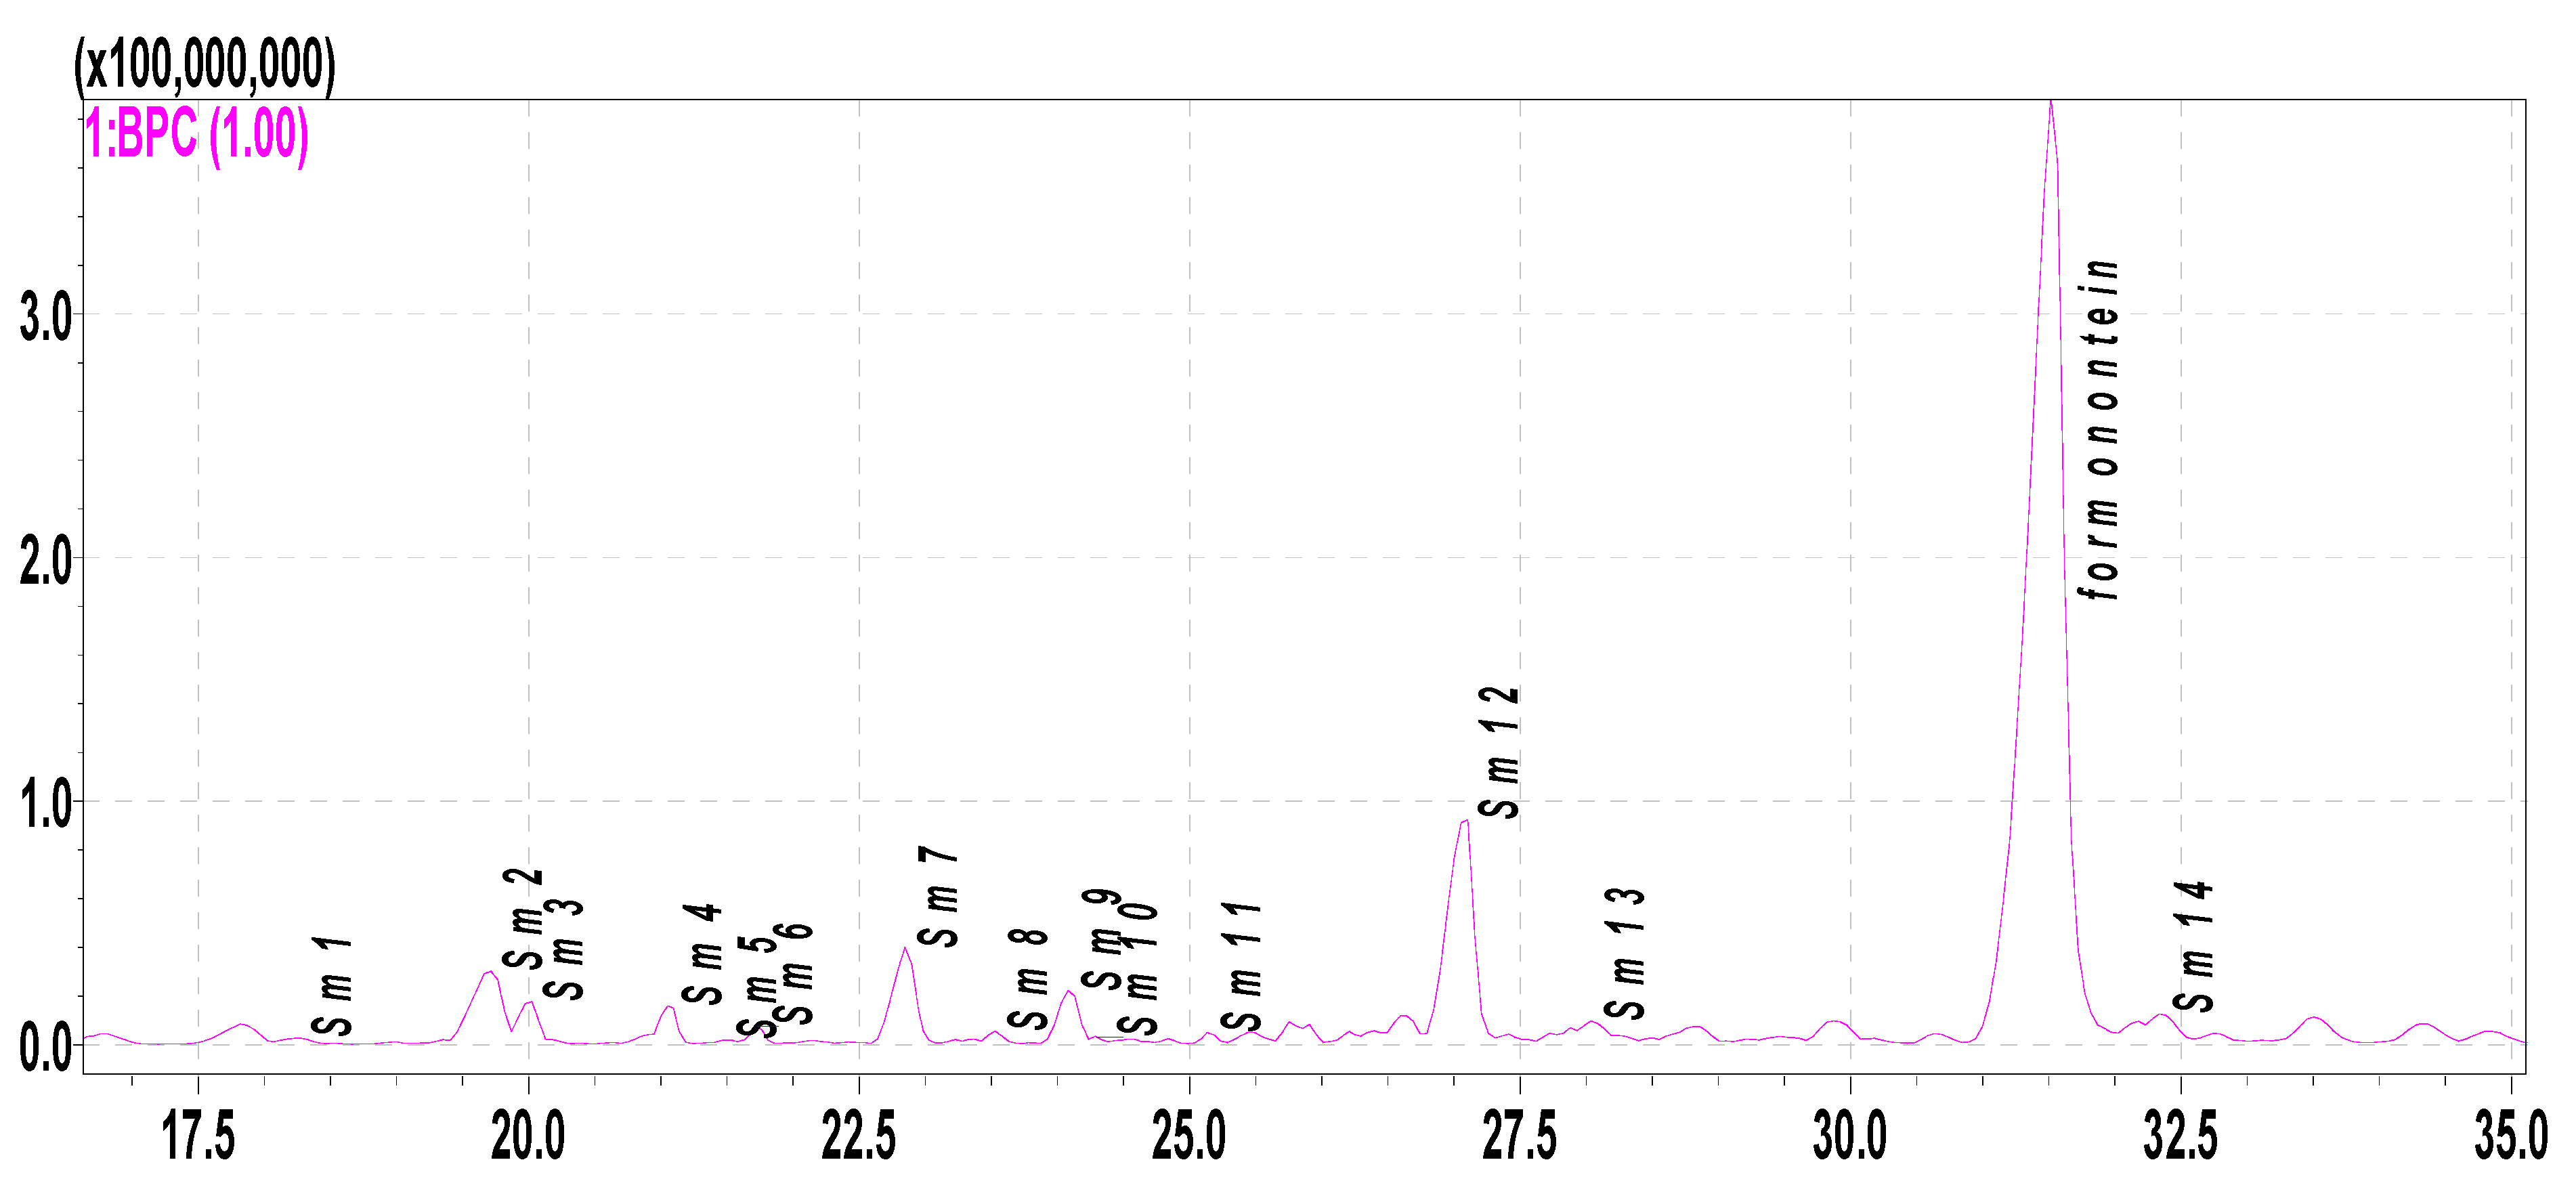
2.3. Metabolite Profiling of Formononetin Using Rat Hepatic S9 by HPLC-DAD-ESI-IT-TOF-MSn Analysis

The metabolites of formononetin in the rat hepatic S9 fraction were analyzed through HPLC-DAD-ESI-IT-TOF-MSn. In this research, 14 metabolites were found and tentatively identified (Figure 3 and Figure 4 and Table 2). Their MS data are shown in the Supplementary Materials (pages 2–9).
S0 was identified as the prototype of formononetin.
Metabolites (glycosylation)—Sm1, Sm3, Sm4, Sm6, Sm8, Sm9, and Sm11
Based on the exact masses of the ions, all of these metabolites had a neutral loss (−162; 132) of the molecular ion peak in the MS2 spectra, suggesting that they were glycosylation metabolites of formononetin.
Sm6, Sm8, and Sm11 showed [M+H]+ at m/z 417.12 (element composition: C21H21O9) in the PI mass spectrum. So, the molecular formula was determined to be C21H20O9 with a neutral loss (132) of the molecular ion peak in the MS2 spectra, thus suggesting that they were hydroxylation and glycosylation (pentose) metabolites of formononetin.
Sm4 showed [M+H]+ at m/z 431.13 (element composition: C22H23O9) in the PI mass spectrum. So, the molecular formula was determined to be C22H22O9 with a neutral loss (162) of the molecular ion peak in the MS2 spectra. Thus, those observations suggested that Sm4 was a glycosylation (glycose) metabolite of formononetin.
Sm1 and Sm3 showed [M−H] at m/z 445.11 (element composition: C22H23O10) in the PI mass spectrum. So, their molecular formula was determined to be C22H22O10 with a neutral loss (162) of the molecular ion peak in the MS2 spectra. The above information suggests that they were hydrolation and glycosylation (glycose) metabolites of formononetin.
Metabolites (hydroxylation)—Sm10, Sm12, Sm13, and Sm5
Sm10, Sm12, and Sm13 showed [M+H]+ at m/z 285.08 (element composition: C16H13O5) in the PI mass spectrum. So, their molecular formula were determined to be C16H12O5, thus suggesting that they were hydroxylation metabolites of formononetin. Sm10 was 7,8,-dihydroxy-4′-methoxy-isoflavonoid and Sm12 was 6,7-dihydroxy-4′-methoxy- isoflavonoid.
Sm5 showed [M+H]+ at m/z 301.07 (element composition: C16H13O6) in the PI mass spectrum. So, the molecular formula was determined to be C16H12O6, thus suggesting that it was a dihydroxylation metabolite of formononetin.
Metabolites (demethylation, methylation, and hydroxylation)—Sm7, Sm14, and Sm2
Sm7 showed [M+H]+ at m/z 255.07 (element composition: C15H11O4) in the PI mass spectrum. So, the molecular formula was determined to be C15H10O4, thus suggesting that Sm7 was a demethylation metabolite of formononetin. Sm7 was 7,4′-dihydroxy-isoflavonoid.
Sm14 showed [M+H]+ at m/z 299.39 (element composition: C17H15O5) in the PI mass spectrum. So, the molecular formula was determined to be C17H14O5, thus suggesting that Sm14 was a methylation and hydroxylation metabolite of formononetin.
Sm2 and Sm9, showed [M+H]+ at m/z 271.06 (element composition: C15H11O5) in the PI mass spectrum. So, the molecular formula was determined to be C15H10O5, thus suggesting that Sm2 was a demethylation and hydroxylation metabolite of formononetin. Sm2 was 6,7,4′-trihydroxy-isoflavonoid, and Sm9 was a demethylation and hydroxylation metabolite of formononetin. Sm9 was 7, 8, 4′-trihydroxy-isoflavonoid.

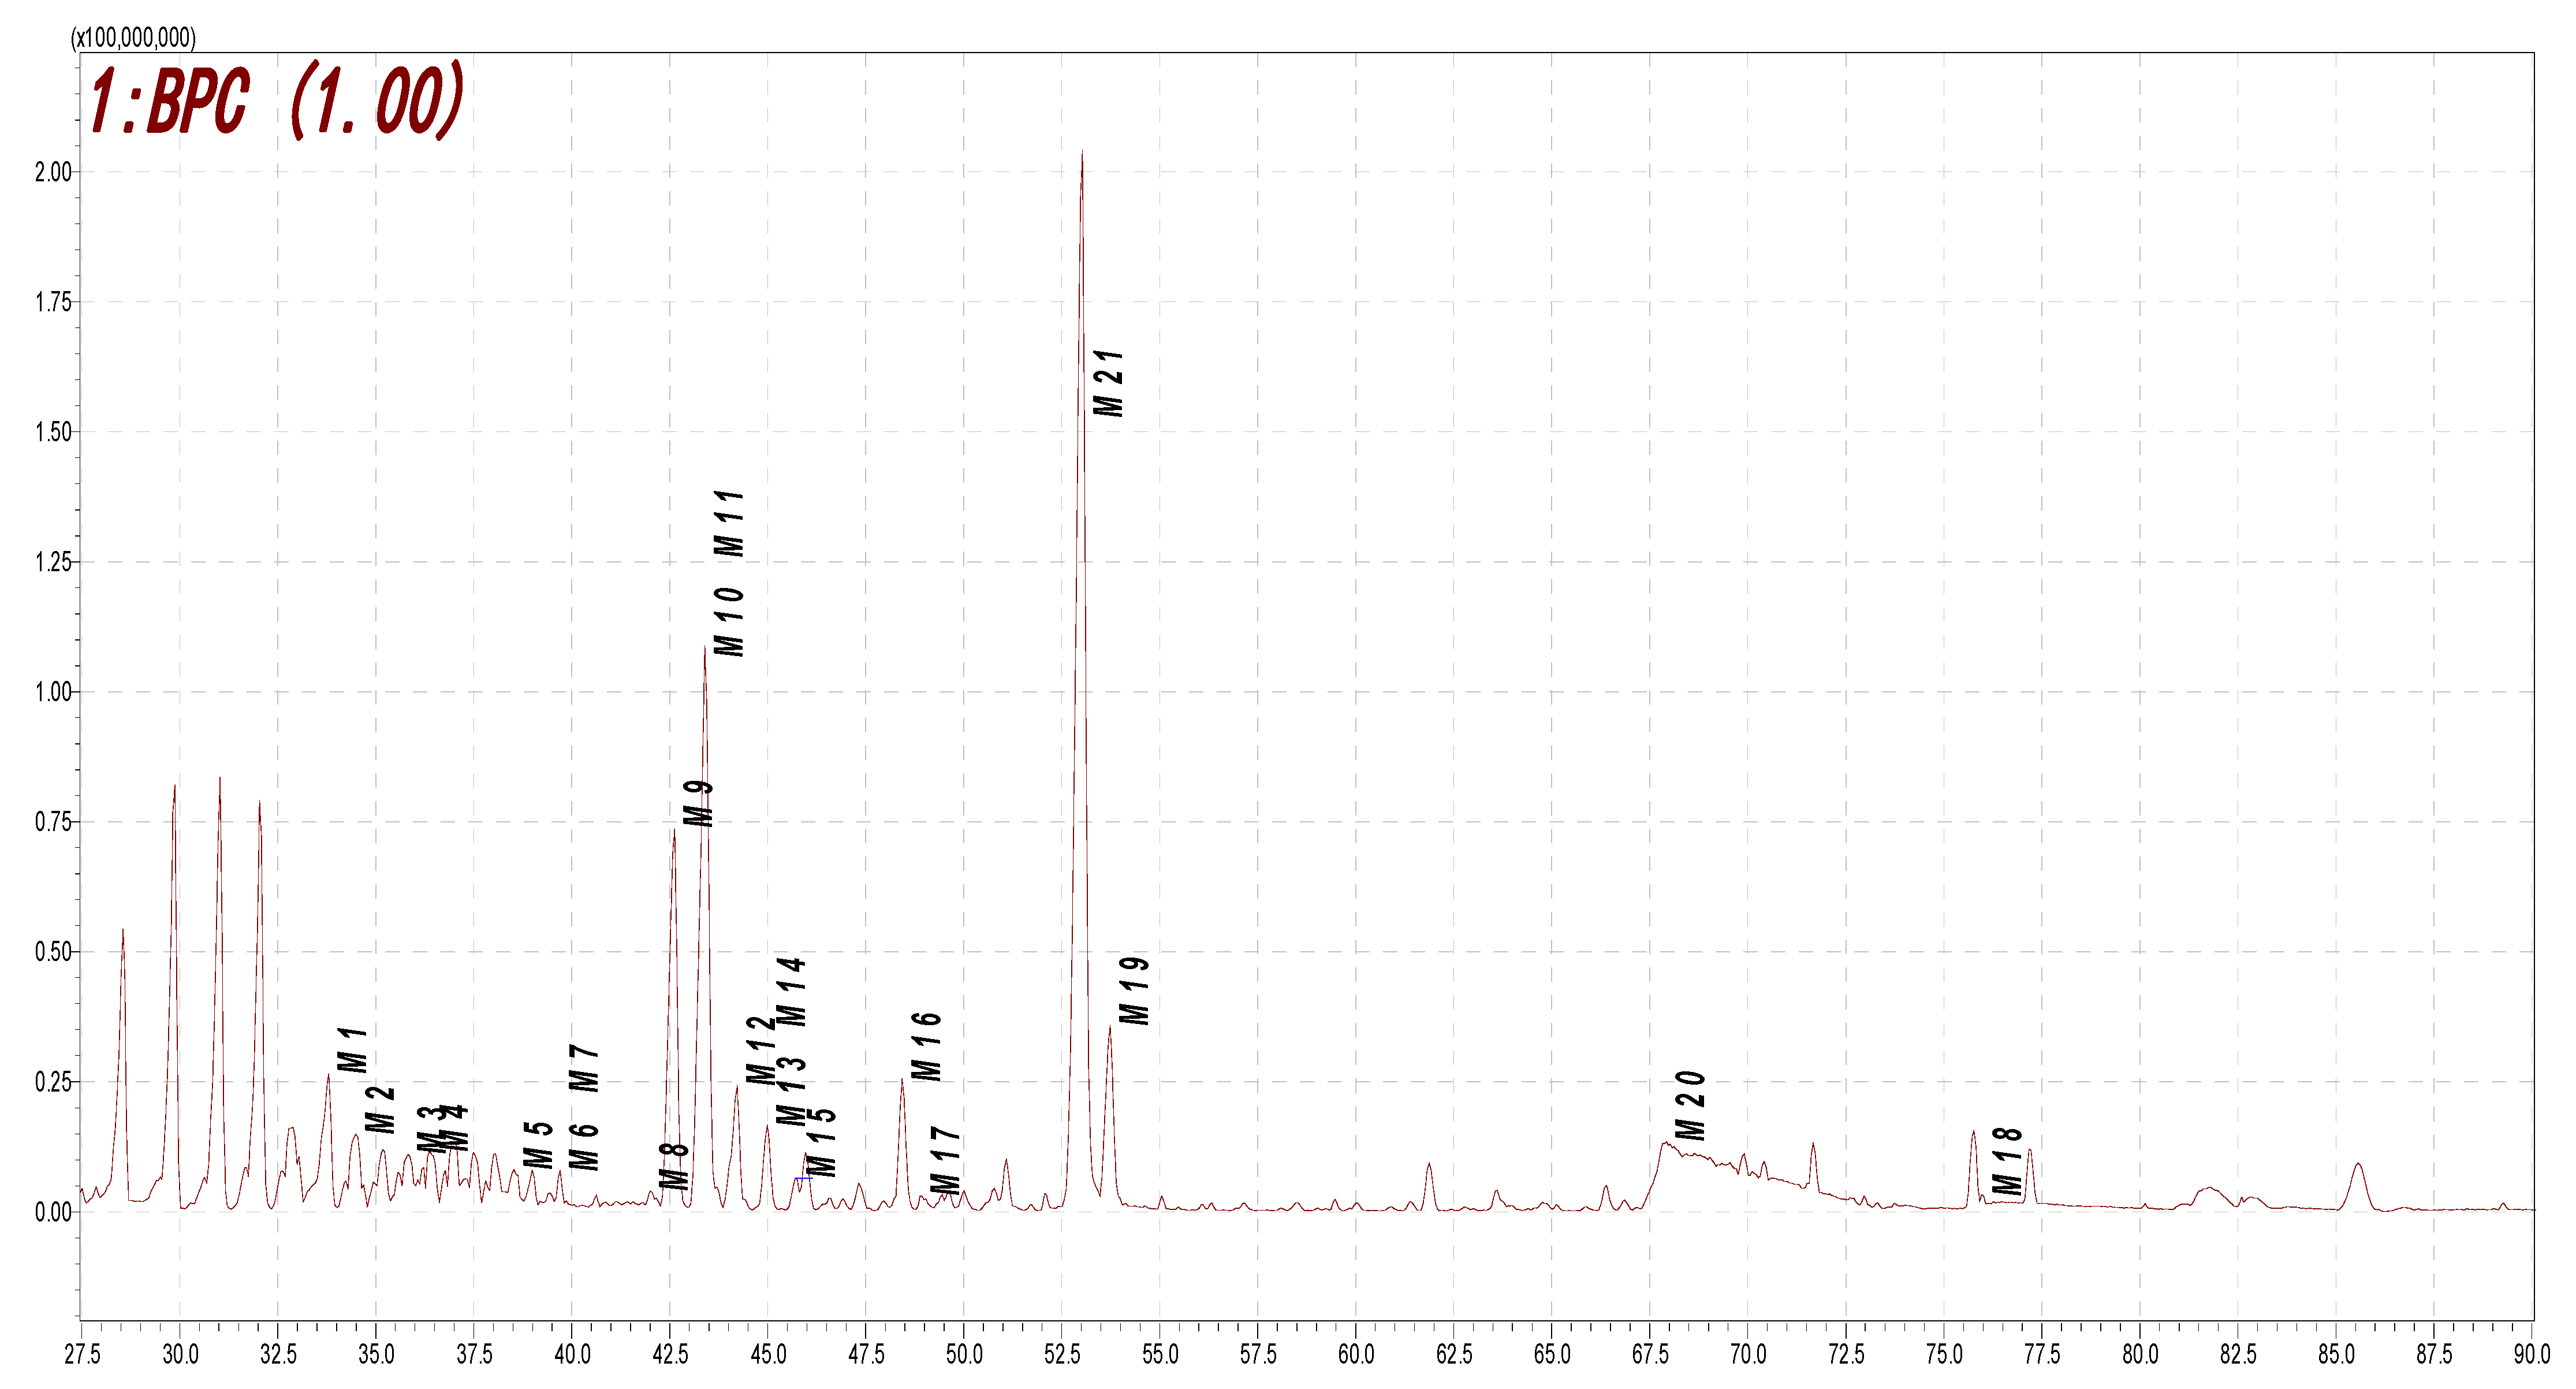
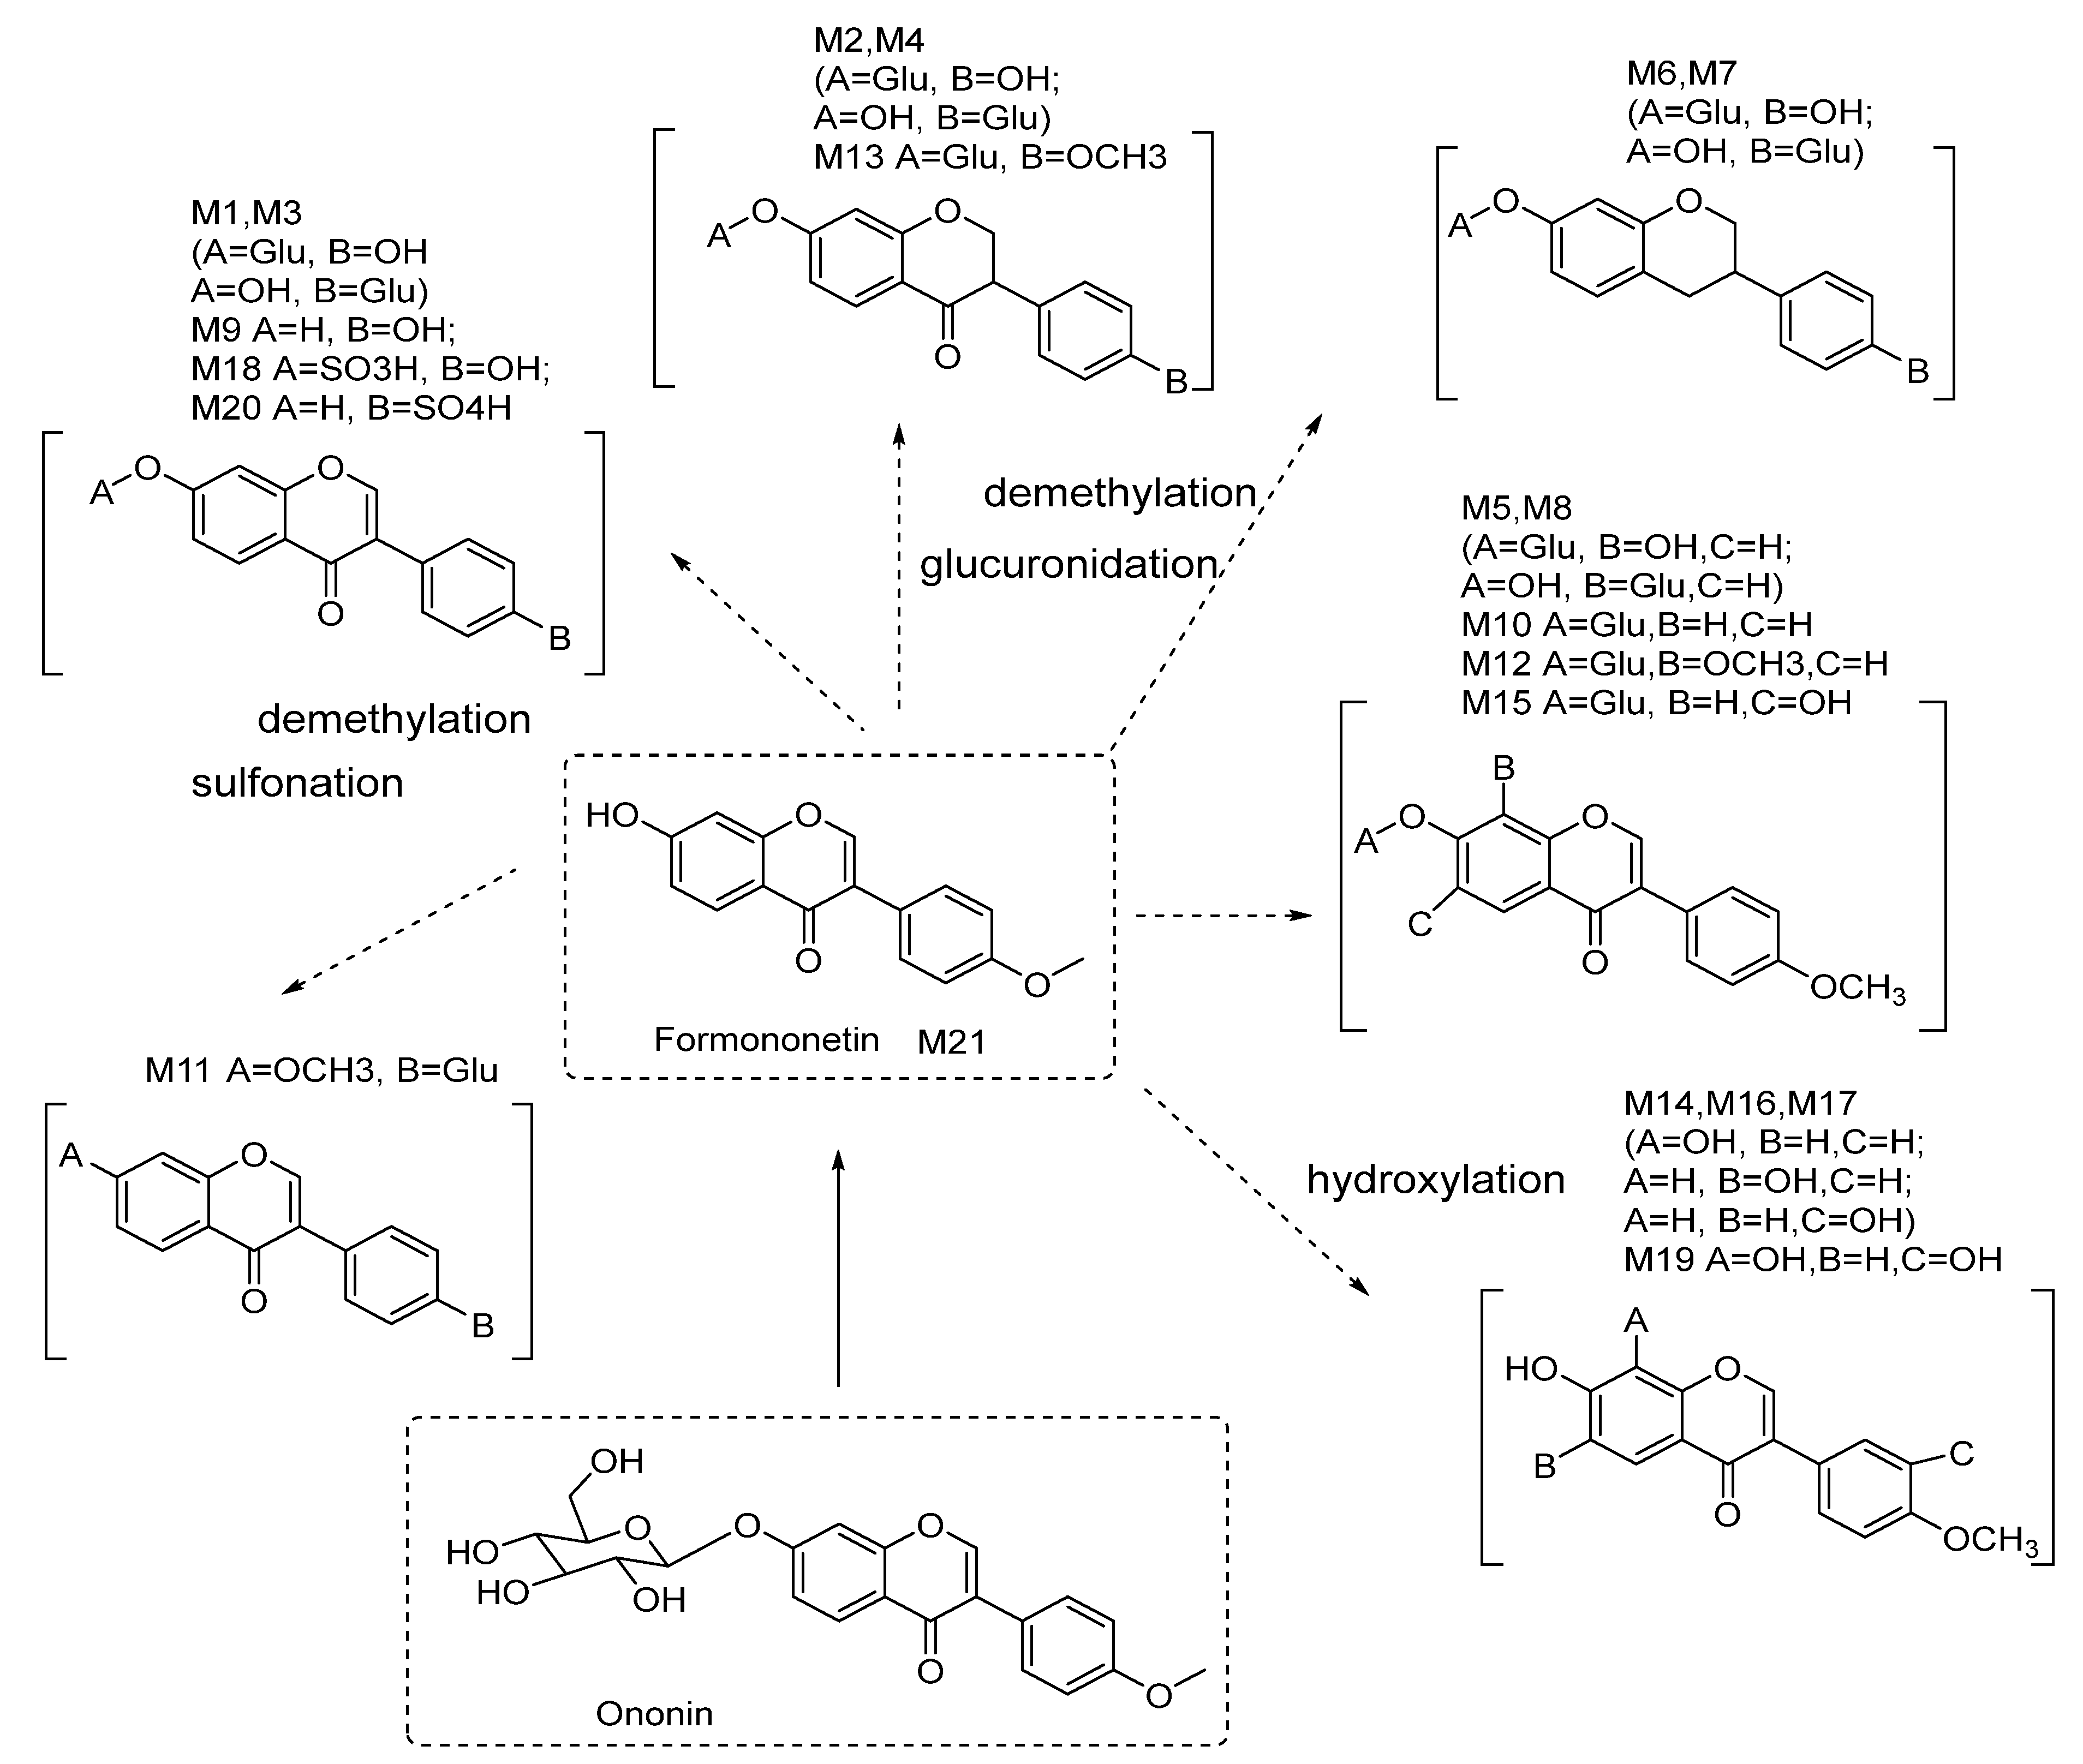
2.4. Metabolite Profiling of Rat Urine Samples after Oral Administration of Ononin via HPLC-DAD-ESI-IT-TOF-MSn Analysis

The metabolites in the rat urine samples collected after the oral administration of ononin were analyzed using the HPLC-DAD-ESI-IT-TOF-MSn technique. In total, 21 metabolites were found and tentatively identified, as shown in Figure 5 and Figure 6 and in Table 3. Their MS data are shown in the Supplementary Materials (pages 11–17).
Metabolites (glucuronidation)—M1, M2, M3, M4, M5, M6, M7, M8, M10, M11, M12, M13, and M15
Based on the exact masses of the ions, all of these metabolites had a neutral loss (−176) of the molecular ion peak in the MS2 spectra, suggesting that they were glucuronidation metabolites of formononetin.
M10 and M11 showed [M+H]+ at m/z 445.11 (element composition: C22H21O10) in the PI mass spectrum. So, the molecular formula was determined to be C22H20O10 with a neutral loss (176) of the molecular ion peak in the MS2 spectra, thus suggesting that they were glucuronidation metabolites of formononetin.
M1 and M3 showed [M−H] at m/z 429.08 (element composition: C21H19O10) in the PI mass spectrum. So, the molecular formula was determined to be C21H18O10 with a neutral loss (176) of the molecular ion peak in the MS2 spectra, thus suggesting that they were demethylation and glucuronidation metabolites of formononetin.
M5, M8, and M15 showed [M−H] at m/z 459.09 (element composition: C22H21O11) in the PI mass spectrum. So, the molecular formula was determined to be C22H20O11 with a neutral loss (176) of the molecular ion peak in the MS2 spectra, thus suggesting that they were hydroxylation and glucuronidation metabolites of formononetin.
M6 and M7 showed [M−H] at m/z 417.12 (element composition: C21H23O9) in the PI mass spectrum. So, the molecular formula was determined to be C21H22O9 with a neutral loss (176) of the molecular ion peak in the MS2 spectra, thus suggesting that they were hydrogenation, carbonyl reduction, and glucuronidation metabolites of formononetin.
M2 showed [M−H] at m/z 431.10 (element composition: C21H21O10) in the PI mass spectrum. So, the molecular formula was determined to be C21H20O10 with a neutral loss (176) of the molecular ion peak in the MS2 spectra, thus suggesting that M2 was a hydrogenation, demethylation, and glucuronidation metabolite of formononetin.
M12 showed [M+H]+ at m/z 475.12 (element composition: C23H23O11) in the PI mass spectrum. So, the molecular formula was determined to be C23H22O11 with a neutral loss (176) of the molecular ion peak in the MS2 spectra, thus suggesting that M12 was a hydroxylation, methylation, and glucuronidation metabolite of formononetin.
M13 showed [M+H]+ at m/z 447.13 (element composition: C22H23O10) in the PI mass spectrum. So, the molecular formula was determined to be C22H22O10 with a neutral loss (176) of the molecular ion peak in the MS2 spectra, thus suggesting that M13 was a hydrogenation, demethylation, and glucuronidation metabolite of formononetin.
Metabolites (sulfonation)—M19 and M20
Based on the exact masses of the ions, all of these metabolites had a neutral loss (−80) of the molecular ion peak in the MS2 spectra, suggesting that they were sulfonation metabolites of formononetin.
M19 and M20 showed [M+H]+ at m/z 335.02 (element composition: C15H11O7S) in the PI mass spectrum. So, the molecular formula was determined to be C15H10O7S with a neutral loss (80) of the molecular ion peak in the MS2 spectra, thus suggesting that they were demethylation and sulfonation metabolites of formononetin.
Metabolites (hydroxylation, demethylation, and methylation)—M9, M14, M16, M17, and M18
M14, M16, and M17 showed [M+H]+ at m/z 285.08 (element composition: C16H13O5) in the PI mass spectrum. So, the molecular formula was determined to be C16H12O5, thus suggesting that they were hydroxylation metabolites of formononetin.
M9 showed [M+H]+ at m/z 255.07 (element composition: C15H11O4) in the PI mass spectrum. So, the molecular formula was determined to be C15H10O4, thus suggesting that M9 was a demethylation metabolite of formononetin.
M18 showed [M+H]+ at m/z 299.09 (element composition: C17H15O5) in the PI mass spectrum. So, the molecular formula was determined to be C17H14O5, thus suggesting that M18 was a hydroxylation and methylation metabolite of formononetin.
M21 showed [M+H]+ at m/z 269.08 (element composition: C16H13O4) in the PI mass spectrum. So, the molecular formula was determined to be C16H12O4, thus suggesting that M18 was the formononetin.

2.5. Results of Network Pharmacology and Macromolecular Docking

A search for targets corresponding to the six metabolites was conducted, the duplicates were deleted, and a total of 240 targets were obtained. Through the Genecards database (https://auth.lifemapsc.com/), 16,554 cardiovascular disease prediction targets were obtained. The active ingredient cardiovascular disease target was venny 2.1.0., 219 intersection targets were obtained, and the intersection rate was 1.3%. The intersection targets were submitted in the String11.0 database to obtain the intersection target protein interaction network diagram. The topological map of the intersection target of the active ingredient and cardiovascular disease was exported based on the Betweenness Centrality value in the Cytoscape 3.9.1 software. Ranked by the Betweenness Centrality value, the first two core targets (HSP90AA1 and SRC) related to cardiovascular disease were selected for macromolecular docking with six core components, and the results are shown in Figure 7 and Table 4 and Table 5.
The macromolecular docking results of the six main components and two core targets (HSP90AA1 and SRC) related to cardiovascular diseases showed that the binding energies of Sm2, Sm9, Sm12, and formononetin with the SRC target and the binding energies of the Sm7 components with the HSP90AA1 target were all less than −4.25 kcal/mol. This indicates that there is certain activity between Sm7 and the HSP90AA1 receptor, and there is certain activity between Sm2, Sm9, Sm12, and formononetin with the SRC receptor of cardiovascular disease; however, the binding energies of Sm9, Sm12, and formononetin with the HSP90AA1 target, and the binding energy of Sm7 with the SRC target are all less than −5.0 kcal/mol, indicating that Sm10, Sm12, and formononetin have good binding activities with HSP90AA1 receptors, and there is also a good binding activity between Sm7 with the SRC receptors.

2.6. Discussion

We evaluated the major fragmentation pathways of formononetin and its metabolites, which were identified using the NMR methods, and then speculated on the proposed metabolites.
Fourteen metabolites were identified when formononetin was incubated with the rat hepatic S9 fraction. Additionally, when ononin was administered orally to the rats, 21 previously unknown metabolites were simultaneously identified in their urine through an HPLC-DAD-ESI-IT-TOF-MSn analysis [1,14,15,16].
The research on the metabolic profiling analysis referred to previous studies in the literature to identify the structures of the metabolites [9,10,11,12,13]. When formononetin was incubated in hepatic S9 and the ononin was administered orally to the rats, these metabolic pathways were involved in hydroxylation and demethylation. These results indicate that hydroxylation and demethylation are the main phase I metabolic reactions in the hepatic transformation of formononetin in vitro and in the metabolism of ononin in vivo, and it was also confirmed that hydroxylation occurred most at carbon-6 and carbon-8 of the A-ring based on the NMR data [10,11]. The combination reaction when formononetin was incubated in hepatic S9 was mainly glycosylation; however, when ononin was administered via oral gavage to the rats, the combination reactions were mainly glucuronidation and sufonation, and a glycosylation reaction in rabbit liver microsomal fraction and zebrafish larvae been reported, too [34,35,36]. The present study is also the first to report that formononetin is able to combine with glucose (or pentose) when incubated in rat hepatic S9, but a reaction was not observed when ononin was orally administrated in vivo. Compared with formononetin incubated with rat hepatic S9 fraction, we found that the open-loop reaction of the B-ring, the 2,3-double bond reduction, and the 4-carbonyl reduction were transformed by the intestinal bacteria during the metabolism of ononin before it was absorbed into the blood [11,12,13].
When we study the metabolism of ononin, because there is poor absorption through oral administration in vivo, it is difficult to isolate and identify each metabolite [14,15]. However, the S9 fraction can be obtained via a simple modification to the crude S9 preparation and more accurately reflects the metabolism as a metabolic system; it was much easier to apply hepatic S9 incubation to the isolation and structural identification of those metabolites. This was the first time to describe the metabolic profiling of ononin by using rat liver S9 incubation in vitro in combination with administrated by oral gavage in vivo.
Finally, the researchers conducted a network pharmacological analysis of the main components in similar structures, hoping to provide a reference for the subsequent determination of active structures. Through network pharmacology and macromolecular docking, the relationship between six metabolic components isolated from rat liver S9 after the hatching of formononetin and potential targets of CVD were analyzed, and six metabolites were found to be involved in the main roles of 10 receptors in the treatment of CVD. We compared the binding activity of these metabolites with that of the first two receptors (HSP90AA and SRC) and found the metabolites with the strongest binding abilities to the corresponding receptors. These research results also indicate that a prototype drug may produce a large number of metabolites after administration, and the specific molecular form that plays a therapeutic role may be the prototype or may be metabolites produced by the prototype, which require a specific analysis. In summary, the above research on formononetin and its glycosides (onion) has a certain guiding role for their further applications [22,23].
Because the content of isoflavone glycoside is generally greater than that of aglycone in plants, when understanding the metabolites of both formononetin and ononin, it is helpful to evaluate their safety after they enter the body [1,3,4]. It has been demonstrated that some of the metabolites of both formononetin and ononin have shown effective activities according to previous pharmacological studies [37,38,39]. The findings in this research will provide a solid basis for further studies on the metabolism of other isoflavonoids in animals, too.

3. Materials and Methods

3.1. Materials and Reagents

Formononetin and ononin (both >98%) were isolated from Astragali Radix (the roots of Astragalus membranaceus (Fish.) Bge. ), which was identified by Ya-Zhou Zhang using chromatographic methods, including column chromatography on D-101 macroporous adsorption resin (Cangzhou Baoen Co., Ltd., Cangzhou, Hebei Province, China), 200–300 mesh normal-phase silica gel (Qingdao Marine Chemical Factory, Qingdao, Shandong Province, China), reversed-phase C18 silica gel (YMC, YMC Co., Ltd., Kyoto, Japan), and Sephadex LH-20 (GE Healthcare Co., Ltd., Chicago, IL, USA). The structures were determined to be formononetin and ononin on the basis of UV, NMR, and MS data. HPLC-grade acetonitrile was purchased from Fisher Chemicals (Princeton, NJ, USA), pure water was purchased from Wahaha Co., Ltd. (Hangzhou, Zhejiang Province, China) and NADP, glucose-6-phosphate, and Tris-HCl buffer were purchased form Sigma, Co., Ltd. (St. Louis, MO, USA). Other reagents (sodium chloride, potassium hydroxide, hydrochloride, and dimethyl sulfoxide) were of analytical grade and were purchased from Beijing Fine Chemicals Co., Ltd. (Beijing, China).

3.2. Ethical Approval of Animal Experiments

Adult male Sprague Dawley rats (250–350 g) were bought from the Experimental Animal Center of Guizhou University of Traditional Chinese Medicine. They were handled in accordance with the Guide for the Care and Use of Laboratory Animals of the USA’s National Institutes of Health. The experiments were also approved by the Biomedical Ethical Committee of Guizhou University of Traditional Chinese Medicine (No. 776).

3.3. Preparation of the Rat Hepatic S9 Fraction

The rats were induced via i.p. phenobarbital with a dosage of 60 mg/kg before use, the rats were euthanized via decapitation 24 h later, and the livers were removed from the abdominal cavities quickly, and then their wet weights were determined. Subsequently, the livers were minced and homogenized using a homogenizer (Ultra-Turrax T8, Ika-Werke, Gmbh & Co. KG, Staufen, Germany) in cold 1.15% KCl in 0.05 M Tris-HCl buffer (pH 7.4) to the 4-fold volume of the wet liver weight. The homogenate was centrifuged at 9000× g for 30 min at 4 °C. The 9000× g supernatant (S9) was removed and either stored at −70 °C or used immediately [18,19].

3.4. Rat Hepatic S9 Incubation for Metabolite Profiling

The general procedure of incubation was conducted as previously reported [18]. In brief, 25 mL each of 1.15% KCl, 5 mM MgCl2, 5 mM glucose-6-phosphate, 0.5 mM NADP, and hepatic S9 fraction (20 mg protein per mL) in 0.05 M Tris-HCl buffer (pH 7.4) were successively added to a 250 mL flask (on ice) to obtain a final volume of 125 mL. The incubation was conducted in three groups: (1) A test group for metabolite profiling was incubated with 100 mL cofactors and 25 mL hepatic S9 and spiked with 10 mg formononetin (100 μL DMSO solution). (2) Control group 1, excluding endogenous S9 metabolites, was incubated with 100 mL cofactors and 25 mL hepatic S9 but no formononetin. (3) Control group 2, to evaluate the stability of formononetin, was incubated with 125 mL cofactors (25 mL hepatic S9 was replaced by 25 mL 1.15% KCl in Tris-HCl) spiked with 10 mg formononetin (100 μL DMSO solution).

3.5. Enlarged Rat Hepatic S9 Incubation for Isolation of Metabolites

The incubation method was the same as that described in previous reports [18]. In total, 400 mg formononetin was dissolved in 2.4 mL DMSO and added to 5000 mL reaction mixture (containing 1000 mL rat hepatic S9 fraction). Then, the mixture was incubated at 37 °C (each 125 mL for incubation). After 4 h, 5000 mL acetonitrile was added to completely stop the reaction. The mixture was centrifuged for 30 min (200 or 300 mL per round of centrifugation), and the supernatant was evaporated under reduced pressure to produce a solution (200 mL). All the solutions were subjected to D-101 macroporous adsorption resin column chromatography. They were first eluted with water and then with methanol to give two fractions. Metabolite 1 (10.8 mg), metabolite 2 (11.1 mg), metabolite 3 (10.2 mg), metabolite 4 (2.3 mg), and metabolite 5 (4.2 mg) were isolated from fraction 2. Then, each metabolite was purified on a preparative HPLC system (including an Alltech 426 HPLC pump and a UVIS 200 detector). The purity of each metabolite was found to be above 98% via HPLC analysis using an Agilent 1200 series instrument equipped with a binary gradient system, a thermostatted column oven, and a DAD-UV detector.

3.6. Rats’ Urine Samples Collected after Oral Administered with Ononin

Male SD rats (250–350 g, n = 3) were given ononin via oral gavage at a dose of 400 mg/kg body weight. We collected the urine 48 h later and labeled it sampling A. Urine collected 48 h before administration were labeled blank B. Urine was concentrated to dryness at 40 °C and the precipitate was dissolved with methanol and 30 mL supersonic for 10 min. After that, supernatant was accepted and filtered through the millipore filter (0.45 μm) before HPLC-DAD-ESI-IT-TOF-MSn analysis.

3.7. The Instrument Parameters of HPLC-DAD-ESI-IT-TOF-MSn

The analyses were performed on a Shimadzu liquid phase chromatography and mass spectrograph (LC/MS) tandem with an IT-TOF instrument, which consisted of a CBM-20A system controller, two LC-20AD pumps, an SIL-20AC autosampler, a CTO-20A column oven, an SPD-M20A PDA detector, an ESI ion source, and an IT-TOF mass spectrometer.
The ESI-IT-TOF-MSn parameters were set as follows: (1) Flow rate: 0.2000 mL/min (split from HPLC effluent). (2) Detected in alternating positive ion (PI) and negative ion (NI) mode. (3) Ion source temperature: 250 °C; curved desolvation line temperature: 250 °C; ESI nebulization gas flow (nitrogen): 1.5 L/min; ESI voltage: 4.5 kV; detector voltage: 1.80 kV; ion accumulation time: 20 ms; relative collision energy: 50%. (4) Mass range: m/z 220–1000 in MS, m/z 50–1000 in MS2 and MS3. (5) A data-dependent program was used in analysis so that the two most abundant ions in each scan were selected and subjected to MS2 and MS3 analyses. (6) All data were acquired and processed using Shimadzu LCMS solution Version 3.36, Formula Predictor Version 1.01, and Accurate Mass Calculator software (Shimadzu Corporation, Guangzhou, China, LCMS solution, version 3). (7) Mass calibration was carried out using a trifluoroacetic acid sodium solution (2.5 mmol/L) from 50 to 1000 Da.

3.8. Spectroscopic Methods

UV spectra (200–400 nm) were recorded using an LCMS-IT-TOF instrument with a DAD detector. High-resolution mass spectrography data were obtained using an LCMS-IT-TOF instrument with a TOF mass analyzer or a Bruker Apex IV FT-MS (7.0T). One- and two-dimensional NMR spectra were obtained on a Bruker DRX 400 spectrometer with a 5 mm probe at room temperature. Metabolites were dissolved in 0.5 mL dimethyl sulfoxide-d6 (DMSO-d6) containing tetramethylsilane (TMS) as an internal standard. Chemical shifts (δ) were reported in ppm and coupling constants (J) were reported in Hertz.

3.9. Research on Network Pharmacology and Macromolecular Docking

Firstly, the Isometric SMILES numbers of the isolated metabolites were pasted onto the SwissTargetPrediction to obtain the corresponding targets for each compound. Then, the GeneCards database was searched for potential targets of cardiovascular diseases, and then Venny map of compounds and cardiovascular targets was made on the Venny2.1 website to obtain intersection targets, and the intersection targets were pasted on String database and the software Cytoscape 3.9.1 for PPI network mapping. The intersection targets with Betweenness Centrality values of 0 and those below 85 were rounded off, and the Betweenness Centrality values from high to low were divided into three parts. The innermost layer was the target with the largest Betweenness Centrality value, and the topological map of the intersection target of active ingredient and cardiovascular disease of Betweenness Centrality value was derived. Finally, based on the above research results, macromolecular docking verification was carried out, and compounds with higher selection values were selected as ligands and core targets as receptors for macromolecular docking [20,21,22,23]. In macromolecular docking, it is generally believed that a binding energy between ligand and protein < −4.25 kcal/mol indicates that there is a specific binding activity between them. A Binding energy < −5.0 kcal/mol indicates that they have good binding activity. A Binding energy < −7.0 kcal/mol indicates that the ligand has strong binding activity to the receptor [22,23].

4. Conclusions

In conclusion, this study focuses on the metabolism of formononetin and its glycosides (onion) in rats, both in vivo and in vitro. Firstly, 6 metabolites of formononetin were isolated from rat liver S9 after incubation in vitro, and 14 possible metabolites were identified through high-resolution mass spectrometry. Additionally, 21 possible metabolites were identified through high-resolution mass spectrometry in the collected rat urine samples after the in vivo administration of onion. The results indicate that the main forms of formononetin and its glycosides (onion) after metabolism are basically similar, except for the binding reactions. This suggests that the metabolism of formononectin primarily occurs in the livers of rats. The six metabolites obtained represent the main form of formononetin metabolism due to the higher content of similar isoflavone metabolites; it also indicates that they are the main active components responsible for producing pharmacological effects. Due to the fact that a prototype drug may produce a large number of metabolites after administration, the prototype or metabolites may play therapeutic roles, which require a specific network pharmacological analysis. Finally, the above six metabolites isolated from rat liver S9 incubated in vitro by formononetin were analyzed via network pharmacology and macromolecular docking technology, and 10 receptors related to CVD were found. Among them, HSP90AA and SRC showed significant impacts based on their binding energies. In conclusion, this study found that formononetin and its main metabolites, Sm10 and Sm12, may have roles in the treatment of CVD due to their good binding activities with the HSP90AA1 receptor, while Sm7 may have a role due to its good binding activity with the SRC receptor. In the future, research will involve animal and clinical experiments to further validate these findings.

Supplementary Materials

The following supporting information can be downloaded at: https://www.mdpi.com/article/10.3390/molecules28217451/s1, Figure S1. 1H and 13C NMR spectrum of Formononetin; Figure S2. 1H and 13C NMR spectrum of Ononin; Figure S3. 1H and 13C NMR spectrum of Sm2; Figure S4. 1H and 13C NMR spectrum of Sm7; Figure S5. 1H and 13C NMR spectrum of Sm9; Figure S6. 1H and 13C NMR spectrum of Sm10; Figure S7. 1H and 13C NMR spectrum of Sm12; Figure S8–S16 and Sm0-Sm14. MSn spectra of S9 with formononetin in PI mode; Figure S17–S23 and M1–M21. MSn spectra of ononin in urine sample in PI mode; Table S1. Proposed metabolites of formononetin in hepatic S9 incubated sample by LC/MS analysis; Table S2. Proposed metabolites of ononin in rat biological sample by LC/MS analysis.

Author Contributions

Y.-Z.Z., Q.-S.H. and H.-B.C. designed the experiments, analyzed the data, and prepared the manuscript. Y.-Z.Y., T.W. and Q.-L.C. conducted the experiments, devised the methodology, and collected the data. All authors confirmed the final manuscript. Y.-Z.Z. and H.-B.C. provided the funding for this research work, designed the work, and modified the paper. All authors have read and agreed to the published version of the manuscript.

Funding

This study was supported by Guizhou Province, Science and Technology Department, Natural Science Fund, Qiankehe Foundation. Grant No. [2018]1071 and No. [2020]1Z071, Guizhou University of Traditional Chinese Medicine, National Nature Supply Fund, Grant No. 2018YFC170810501 and the Innovation and Technology Fund in Hong Kong (MHP/023/20).

Institutional Review Board Statement

Not applicable.

Informed Consent Statement

Not applicable.

Data Availability Statement

Available upon request and with regulations.

Conflicts of Interest

The authors declare no conflict of interest.

References

  1. Fu, J.; Wang, Z.; Huang, L.; Zheng, S.; Wang, D.; Chen, S.; Zhang, H.; Yang, S. Review of the botanical characteristics, phytochemistry, and pharmacology of Astragalus membranaceus (Huangqi). Phytother. Res. 2014, 28, 1275–1283. [Google Scholar] [CrossRef] [PubMed]
  2. Li, S.; Sun, Y.; Huang, J.; Wang, B.; Gong, Y.; Fang, Y.; Liu, Y.; Wang, S.; Guo, Y. Anti-tumor effects and mechanisms of Astragalus membranaceus (AM) and its specific immunopotentiation: Status and prospect. J. Ethnopharmacol. 2020, 258, 112797. [Google Scholar] [CrossRef] [PubMed]
  3. Tay, K.C.; Tan, L.T.H.; Chan, C.K.; Hong, S.L.; Chan, K.G.; Yap, W.H.; Pusparajah, P.; Lee, L.-H.; Goh, B.H. Formononetin: A review of its anticancer potentials and mechanisms. Front. Pharmacol. 2019, 10, 820. [Google Scholar] [CrossRef] [PubMed]
  4. Dutra, J.M.; Espitia, P.J.; Batista, R.A. Formononetin: Biological effects and uses—A review. Food Chem. 2021, 359, 129975. [Google Scholar] [CrossRef] [PubMed]
  5. Mu, H.; Bai, Y.H.; Wang, S.T.; Zhu, Z.M.; Zhang, Y.W. Research on antioxidant effects and estrogenic effect of formononetin from Trifolium pratense (red clover). Phytomedicine 2009, 16, 314–319. [Google Scholar] [CrossRef]
  6. Dong, L.; Yin, L.; Zhang, Y.; Fu, X.; Lu, J. Anti-inflammatory effects of ononin on lipopolysaccharide-stimulated RAW 264.7 cells. Mol. Immunol. 2017, 83, 46–51. [Google Scholar] [CrossRef]
  7. Chen, X.; Zhang, M.; Ahmed, M.; Surapaneni, K.M.; Veeraraghavan, V.P.; Arulselvan, P. Neuroprotective effects of ononin against the aluminium chloride-induced Alzheimer’s disease in rats. Saudi J. Biol. Sci. 2021, 28, 4232–4239. [Google Scholar] [CrossRef]
  8. Cao, J.; Li, T.; Liu, T.; Zheng, Y.; Liu, J.; Yang, Q.; Li, X.; Lu, W.; Wei, Y.; Li, W. A Study of the Mechanisms and Characteristics of Fluorescence Enhancement for the Detection of Formononetin and Ononin. Molecules 2023, 28, 1543. [Google Scholar] [CrossRef]
  9. Cayen, M.N.; Tang, G.; Common, R.H. Urinary conversion products of biochanin A and formononetin in the fowl. Biochim. Biophys. Acta Gen. Subj. 1965, 111, 349–357. [Google Scholar] [CrossRef]
  10. Shutt, D.A.; Braden, A.W.H. The significance of equol [7,4′-dihydroxyisoflavan] in relation to the estrogenic responses in sheep ingesting clover with a high formononetin content. Aust. J. Agr. Res. 1968, 19, 545–553. [Google Scholar] [CrossRef]
  11. Kulling, S.E.; Lehmann, L.; Metzler, M. Oxidative metabolism and genotoxic potential of major isoflavone phytoestrogens. J. Chromatogr. B 2002, 777, 211–218. [Google Scholar] [CrossRef] [PubMed]
  12. Heinonen, S.; Waehaelae, K.; Adlercreutz, H. Identification of urinary metabolites of the red clover isoflavones formononetin and biochanin A in human subjects. J. Agric. Food Chem. 2004, 52, 6802–6809. [Google Scholar] [CrossRef] [PubMed]
  13. Jeong, E.J.; Jia, X.; Hu, M. Disposition of Formononetin via Enteric Recycling: Metabolism and Excretion in Mouse Intestinal Perfusion and Caco-2 Cell Models. Mol. Pharm. 2005, 2, 319–328. [Google Scholar] [CrossRef]
  14. Hendrich, S. Bioavailability of isoflavones. J. Chromatogr. B 2002, 777, 203–210. [Google Scholar] [CrossRef] [PubMed]
  15. Cremoux, P.; Leclercq, G.; Jacquot, Y. Controversies concerning the use of phytoestrogens in menopause management: Bioavailability and metabolism. Maturitas 2010, 65, 334–339. [Google Scholar] [CrossRef] [PubMed]
  16. Hosoda, K.; Furuta, T.; Ishii, K. Simultaneous determination of glucuronic acid and sulfuric acid conjugated metabolites of daidzein and genistein in human plasma by high-performance liquid chromatography. J. Chromatogr. B 2010, 878, 628–636. [Google Scholar] [CrossRef]
  17. Wen, X.D.; Qi, L.W.; Li, B. Microsomal metabolism of calycosin, formononetin and drug–drug interactions by dynamic microdialysis sampling and HPLC–DAD–MS analysis. J. Pharmaceut. Biomed. 2009, 50, 100–105. [Google Scholar] [CrossRef]
  18. Wu, W.N.; Mckown, L.A.; Moyer, M.D.; Johannsen, T.B.; Takacs, A.R. In vitro metabolism of mifepristone (RU-486) in rat, monkey and human hepatic S9 fractions: Identification of three new mifepristone metabolites. Xenobiotica 1999, 29, 1089–1100. [Google Scholar] [CrossRef]
  19. Zhang, Y.Z.; Xu, F.; Dong, J.; Liang, J.; Hashi, Y.; Shang, M.Y.; Wang, X.; Cai, S.Q. Profiling the metabolites of astrapterocarpan in rat hepatic 9000 g supernatant. Chin. J. Nat. Med. 2019, 17, 842–857. [Google Scholar] [CrossRef]
  20. Li, S.; Zhang, B. Traditional Chinese medicine network pharmacology: Teory, methodology and application. Chin. J. Nat. Med. 2013, 11, 110–120. [Google Scholar] [CrossRef]
  21. Daina, A.; Michielin, O.; Zoete, V. SwissTargetPrediction: Updated data and new features for efcient prediction of protein targets of small molecules. Nucleic Acids Res. 2019, 47, 357–364. [Google Scholar] [CrossRef]
  22. Sherman, B.T.; Hao, M.; Qiu, J. A web server for functional enrichment analysis and functional annotation of gene list. Nucleic Acids Res. 2022, 23, 216–221. [Google Scholar] [CrossRef] [PubMed]
  23. Taylor, R.D.; Jewsbury, P.J.; Essex, J.W. A review of protein-small molecule docking methods. J. Comput.-Aided Mol. Des. 2002, 16, 151–166. [Google Scholar] [CrossRef] [PubMed]
  24. Patwardhan, B. Ethnopharmacology and drug discovery. J. Ethnopharmacol. 2005, 100, 50–52. [Google Scholar] [CrossRef] [PubMed]
  25. Dickinson, J.M.; Smith, G.R.; Randel, R.D.; Pemberton, I.J. In vitro metabolism of formononetin and biochanin A in bovine rumen fluid. J. Anim. Sci. 1988, 66, 1969–1973. [Google Scholar] [CrossRef]
  26. Chang, H.H.; Robinson, A.R.; Chan, A.H. Radioactive conversion products of intramuscularly injected [4-14C]-formononetin including sulfates in the urine of hens. Can. J. Biochem. 1977, 55, 50–55. [Google Scholar] [CrossRef]
  27. Nilsson, A.; Hill, J.L.; Davies, H.L. In vitro study of formononetin and biochanin A metabolism in rumen fluid from sheep. Biochim. Biophys. Acta. Gen. Subj. 1967, 148, 92–98. [Google Scholar] [CrossRef]
  28. Lindsay, D.R.; Kelly, R.W. Metabolism of phytoestrogens in sheep. Aust. Vet. J. 1970, 46, 219–222. [Google Scholar] [CrossRef]
  29. March, R.E.; Miao, X.S.; Metcalfe, C.D.; Stobiecki, M.; Marczak, L. A fragmentation study of an isoflavone glycoside, genistein-7-O-glucoside, using electrospray quadrupole time-of-flight mass spectrometry at high mass resolution. Int. J. Mass. Spectrom. 2004, 232, 171–183. [Google Scholar] [CrossRef]
  30. Heinonen, S.M.; Hoikkala, A.; Wähälä, K.; Adlercreutz, H. Metabolism of the soy isoflavones daidzein, genistein and glycitein in human subjects. Identification of new metabolites having an intact isoflavonoid skeleton. J. Steroid. Biochem. 2003, 87, 285–299. [Google Scholar] [CrossRef]
  31. Yu, J.; Wu, Q.; Qiao, S.L.; Yu, Z.P.; Jin, N.Z.; Yu, B.Y. Simultaneous determination of phytoestrogens and key metabolites in breast cancer patients’ urine by liquid chromatography–tandem mass spectrometry. J. Pharmaceut. Biomed. 2009, 50, 939–946. [Google Scholar] [CrossRef] [PubMed]
  32. Zhang, Y.Z.; Xu, F.; Yi, T.; Zhang, J.Y.; Tang, Y.N.; Chen, H.B. Investigations of the fragmentation behavior of 11 isoflavones with ESI-IT-TOF-MSn. Chin. Pharm. J. Sci. 2014, 23, 631–641. [Google Scholar] [CrossRef]
  33. Zhang, Y.Z.; Xu, F.; Yi, T.; Zhang, J.Y.; Xu, J.; Tang, Y.N.; Chen, H.B. Chemical profile analysis and comparison of two versions of the classic TCM formula Danggui Buxue Tang by HPLC-DAD-ESI-IT-TOF-MSn. Molecules 2014, 19, 5650–5673. [Google Scholar] [CrossRef] [PubMed]
  34. Labow, R.S.; Layne, D.S. Formation of glucosides of isoflavones and of other phenols by rabbit liver microsomal fractions. Biochem. J. 1972, 128, 491–497. [Google Scholar] [CrossRef]
  35. Qi, L.W.; Yu, Q.T.; Li, P.; Li, S.L.; Wang, Y.X.; Sheng, L.H.; Yi, L. Quality evaluation of Radix Astragali through a simultaneous demermination of six major active isoflavonoids and four main saponins by high-performance liquid chromatography coupled with diode array and evaporative light scattering detectors. J. Chromatogr. A 2006, 1134, 162–169. [Google Scholar] [CrossRef] [PubMed]
  36. Li, H.F.; Li, T.; Yang, P.; Wang, Y.; Tang, X.J.; Liu, L.J.; Xu, F.; Cai, S.Q. Global profiling and structural characterization of metabolites of ononin using HPLC-ESI-IT-TOF-MSn after oral administration to rats. J. Agric. Food Chem. 2020, 68, 15164–15175. [Google Scholar] [CrossRef]
  37. Nestel, P.; Fujii, A.; Zhang, L. An isoflavone metabolite reduces arterial stiffness and blood pressure in overweight men and postmenopausal women. Atherosclerosis 2007, 192, 184–189. [Google Scholar] [CrossRef] [PubMed]
  38. Bednarek, P.; Frański, R.; Kerhoas, L.; Einhorn, J.; Wojtaszek, P. Profling changes in metabolism of isoflavonoids and their conjugates in Lupinus albus treated with biotic elicitor. Phytochemistry 2001, 56, 77–85. [Google Scholar] [CrossRef]
  39. Huh, J.E.; Seo, D.M.; Baek, Y.H.; Choi, D.Y.; Park, D.S.; Lee, J.D. Biphasic positive effect of formononetin on metabolic activity of human normal and osteoarthritic subchondral osteoblasts. Int. Immunopharmacol. 2010, 10, 500–507. [Google Scholar] [CrossRef]
Figure 1. MS1–3 data of formononetin in positive ion (PI) LC/MS spectrum.
Molecules 28 07451 g001aMolecules 28 07451 g001b
Figure 2. Proposed major fragmentation pathways and nomenclature adopted for cross-ring cleavages in PI mode of formononetin.
Molecules 28 07451 g002
Figure 3. Proposed metabolites of formononetin incubated in hepatic S9 as indicated via LC/MS analysis (BPC).
Molecules 28 07451 g003
Figure 4. Proposed metabolites of formononetin in hepatic S9 incubated samples.
Molecules 28 07451 g004
Figure 5. Proposed metabolites of ononin in rat biological sample as indicated via LC/MS analysis (BPC).
Molecules 28 07451 g005
Figure 6. Proposed metabolites of ononin in rat biological samples as indicated via LC/MS analysis.
Molecules 28 07451 g006
Figure 7. Schematic diagram of network pharmacology and macromolecular docking of six separated metabolites.
Molecules 28 07451 g007
Table 1. The 1H and 13C-NMR spectra of metabolites of formononetin.
FormononetinSm7Sm5Sm10Sm9Sm2
δCδH (J = Hz)δCδH (J = Hz)δCδH (J = Hz)δCδH (J = Hz)δCδH (J = Hz)δCδH (J = Hz)
1
2153.58.32 s153.38.30 s153.48.37 s153.18.27 s153.48.31 s152.78.22 s
3123.6 123.0 123.0 122.8 123.1 123.2
4175.0 175.1 175.5 174.7 175.6 174.8
5127.77.94d (9)127.77.94d (8)116.17.45d (8)108.57.37 s116.17.44d (8)108.67.36 s
6115.66.91dd (2,8)115.66.90dd (2,8)114.76.94d (8)145.19.77 s114.66.92d (8)145.19.48 s
7163.010.78 s162.910.76 s150.510.31 s151.310.41 s150.410.28 s151.310.38 s
8102.66.85d (2)102.56.85d (2)133.49.42 s103.26.89 s133.39.41 s103.26.87 s
9157.9 157.6 147.2 152.7 147.2 152.8
10117.1 117.1 117.9 117.0 117.9 117.0
1′124.7 123.9 124.8 125.0 123.4 123.4
2′130.57.48d (8)130.57.35d (8)130.67.49d (8)130.57.47d (8)130.67.36d (8)130.57.34d (8)
3′114.16.96d (8)115.46.78 (8)114.06.96 (8)114.06.95 (8)115.46.78 (8)115.36.77d (8)
4′159.4 157.99.50 s159.4 159.3 157.69.50 s157.59.75 s
5′114.16.96d (8)115.46.78 (8)114.06.96 (8)114.06.95 (8)115.46.78 (8)115.36.77d (8)
6′130.57.48d (8)130.57.35d (8)130.67.49d (8)130.57.47d (8)130.67.36d (8)130.57.34d (8)
-OCH355.63.77 s 55.63.77 s55.63.77 s
Table 2. Proposed metabolites of formononetin in hepatic S9 incubated sample as indicated via LC/MS analysis.
MetabolitestR (min)[M+H]+
(m/z)
[M−H]
(m/z)
FormulaError (ppm)Main Fragment in
MS2 or MS3
Metabolic Pathways
S031.205269.0852267.0669C16H12O44.49269, 237, 213, 163, 118, 107Prototype (formononetin)
Sm118.568447.1289445.1134C22H22O10−0.45447, 285(−162), 229, 152hydroxylation, glycosylation
Sm219.663271.0597269.0452C15H10O5−3.32271, 253, 225, 215, 197, 169,
153
hydroxylation, demethylation
Sm320.413 445.1115C22H22O10−4.49 hydroxylation, glycosylation
Sm420.897431.1337 C22H22O9−1.16431, 269(−162), 237, 213, 181,
152, 136
glycosylation
Sm521.483301.0699299.0560C16H12O61.34301, 286, 269, 241, 229, 153dihydroxylation
Sm622.458417.1179415.1011C21H20O9−4.34417, 285(−132), 268, 152, 124hydroxylation,
glycosylation (pentose)
Sm722.847255.0659253.0493C15H10O40.78255, 227, 199, 137, 152, 109demethylation
Sm823.227417.1188415.1025C21H20O9−0.96417, 285(−132), 229, 152,hydroxylation,
glycosylation (pentose)
Sm923.425271.0606 C15H10O5−3.32271, 253, 225, 215, 197, 169,
153
hydroxylation, demethylation
Sm1024.080285.0755283.0599C16H12O5−2.81285, 253, 225, 197, 141hydroxylation
Sm1125.132417.1193415.1055C21H20O91.68417, 285(−132), 253, 152, 123hydroxylation,
glycosylation (pentose)
Sm1227.053285.0811283.0611C16H12O51.77285, 211, 183, 152hydroxylation
Sm1327.518285.0756283.0604C16H12O5−2.46285, 270, 229, 211, 197, 183,
152
hydroxylation
Sm1432.385299.385 C17H14O50.33299, 270, 254, 237, 213, 181hydrolation, methylation
Table 3. Proposed metabolites of ononin in rat biological samples as indicated via LC/MS analysis.
MetabolitestR (min)[M+H]+
(m/z)
[M−H]
(m/z)
FormulaError
(ppm)
Main Fragment in
MS2 or MS3
Metabolic Pathways
M133.707431.0954429.0815C21H18O10−1.63429, 253(−176), 224, 208, 175, 135demethylation, glucuronidation
M234.397 431.0982C21H20O100.93431, 255(−176), 175, 149hydrogenation, demethylation, glucuronidation
M335.872 429.0833C21H18O102.56429, 253(−176), 224, 175demethylation, glucuronidation
M436.372 431.0967C21H20O10−2.55 hydrogenation, demethylation, glucuronidation
M538.525 459.0938C22H20O112.40459, 283(−176), 268hydroxylation, glucuronidation
M639.447 417.1188C21H22O90.48 hydrogenation, carbonyl reduction, glucuronidation
M739.705 417.1181C21H22O9−1.20 hydrogenation, carbonyl reduction, glucuronidation
M842.007461.1097459.0923C22H20O112.82461, 285(−176), 270, 152, 123hydroxylation, glucuronidation
M942.627255.0668253.0525C15H10O44.31255, 199, 152, 137demethylation
M1043.143445.1127443.0983C22H20O10−1.80445, 269(−176), 237, 118glucuronidation
M1143.445445.1114443.0988C22H20O10−4.72443, 267(−176), 152, 175glucuronidation
M1243.703475.1224473.1077C23H22O11−3.37 methylation, hydroxylation, glucuronidation
M1344.168447.1294445.1158C22H22O100.67445, 269(−176), 254, 175, 135hydrogenation, demethylation, glucuronidation
M1444.988285.0778283.0611C16H12O55.26283, 268, 224, 131hydroxylation
M1545.652461.1067459.0924C22H20O11−0.65461, 285(−176)hydroxylation, glucuronidation
M1648.427285.0760283.0617C16H12O5−1.05283, 268, 224hydroxylation
M1748.935285.0779 C16H12O55.61285, 241hydroxylation
M1853.890299.0905 C 17H14O5−4.68299, 284, 243, 166, 137hydroxylation, methylation
M1967.932335.0203333.0083C15H10O7S1.19333, 253(−80), 224, 135demethylation, sulfonation
M2076.412335.0229333.0092C15H10O7S4.20333, 253(−80), 225, 211, 135demethylation, sulfonation
M2152.977269.0847267.0654C16H12O4−1.12 formononetin
Table 4. The top 10 cardiovascular-related disease targets.
No.Names of the ReceptorsBetweenness
1HSP90AA14195.108
2SRC3675.1655
3ESR12125.8835
4HSPA81557.0778
5APP1246.3787
6AHR1209.1862
7EGFR1152.9003
8PLG1064.3462
9CYP1B11034.5195
10HDAC1950.46075
Table 5. Macromolecular docking results of core components and corresponding core targets.
Six Isolated MetabolitesBinding Energy/kcal.mol−1
HSP90AA1SRC
6,7,4′-trihydroxy-isoflavonoid (Sm2)−4.04−4.38
7,4′-dihydroxy-isoflavonoid (Sm7)−4.76−5.01
7,8,4′-trihydroxy-isoflavonoid (Sm9)−4.18−4.5
7,8-dihydroxy-4′-methoxy-isoflavonoid (Sm10)−5.4−4.06
6,7-dihydroxy-4′-methoxy-isoflavonoid (Sm12)−5.16−4.89
Formononetin (prototype)−5.37−4.37
Disclaimer/Publisher’s Note: The statements, opinions and data contained in all publications are solely those of the individual author(s) and contributor(s) and not of MDPI and/or the editor(s). MDPI and/or the editor(s) disclaim responsibility for any injury to people or property resulting from any ideas, methods, instructions or products referred to in the content.

