Article

Possibilities and Limitations of the Sono-Fenton Process Using Mid-High-Frequency Ultrasound for the Degradation of Organic Pollutants

by
Efraím A. Serna-Galvis
1,2,*,
Javier Silva-Agredo
1,
Judy Lee
3,
Adriana Echavarría-Isaza
2 and
Ricardo A. Torres-Palma
1,*
1
Grupo de Investigación en Remediación Ambiental y Biocatálisis (GIRAB), Instituto de Química, Facultad de Ciencias Exactas y Naturales, Universidad de Antioquia UdeA, Medellín 050010, Colombia
2
Grupo de Catalizadores y Adsorbentes (CATALAD), Instituto de Química, Facultad de Ciencias Exactas y Naturales, Universidad de Antioquia UdeA, Medellín 050010, Colombia
3
School of Chemistry and Chemical Engineering, University of Surrey, Guildford GU2 7XH, UK
*
Authors to whom correspondence should be addressed.
Molecules 2023, 28(3), 1113; https://doi.org/10.3390/molecules28031113
Submission received: 30 November 2022 / Revised: 16 January 2023 / Accepted: 17 January 2023 / Published: 22 January 2023
(This article belongs to the Special Issue Photo-Fenton Process in Water Treatment)

Abstract

:
Mid-high-frequency ultrasound (200–1000 kHz) eliminates organic pollutants and also generates H2O2. To take advantage of H2O2, iron species can be added, generating a hybrid sono-Fenton process (sF). This paper presents the possibilities and limitations of sF. Heterogeneous (a natural mineral) and homogeneous (Fe2+ and Fe3+ ions) iron sources were considered. Acetaminophen, ciprofloxacin, and methyl orange were the target organic pollutants. Ultrasound alone induced the pollutants degradation, and the dual competing role of the natural mineral (0.02–0.20 g L−1) meant that it had no significant effects on the elimination of pollutants. In contrast, both Fe2+ and Fe3+ ions enhanced the pollutants’ degradation, and the elimination using Fe2+ was better because of its higher reactivity toward H2O2. However, the enhancement decreased at high Fe2+ concentrations (e.g., 5 mg L−1) because of scavenger effects. The Fe2+ addition significantly accelerated the elimination of acetaminophen and methyl orange. For ciprofloxacin, at short treatment times, the degradation was enhanced, but the pollutant complexation with Fe3+ that came from the Fenton reaction caused degradation to stop. Additionally, sF did not decrease the antimicrobial activity associated with ciprofloxacin, whereas ultrasound alone did. Therefore, the chemical structure of the pollutant plays a crucial role in the feasibility of the sF process.

1. Introduction

Hybrid systems, where two or more advanced oxidation processes (AOPs) are applied simultaneously, are known to promote the effective degradation of pollutants [1]. The sono-Fenton process (sF) is a very popular hybrid AOP that combines the Fenton reaction with ultrasound waves [US, 20–2000 kHz, represented by the symbol “)))”] to deal with recalcitrant contaminants. The ultrasound-based process involves using the acoustic cavitation phenomenon, i.e., the formation, growth, and implosive collapse of microbubbles in aqueous media, to produce chemical effects. The implosion of micro-bubbles generates localized hot spots with transient temperatures up to 5000 K and pressures ~1000 atm. Such extreme conditions lead to the cleavage of water molecules and dissolve oxygen into radicals (Equations (1)–(4)). These radical species can either react with pollutants within the bubble or in the bubble-liquid interface. Large nonvolatile and very hydrophilic molecules cannot enter the cavitation bubbles or come close to the interfacial zone, and consequently, they react slowly with a few radicals that reach the solution bulk [2]. In addition to the reaction with the pollutants, some sonogenerated hydroxyl radicals can recombine, leading to the accumulation of H2O2 (Equation (5)) [3]. In turn, the Fenton process involves reactions of peroxides (usually hydrogen peroxide) with iron ions to form active oxygen species (such as HO•) that oxidize organic pollutants (Equations (6) and (7)) [4].
H2O + ))) → •H + HO•,
O2 + ))) → 2 •O,
H2O + •O → 2 HO•,
O2 + •H → •O + HO•,
2HO• → H2O2,
Fe2+ + H2O2 → Fe3+ + HO• + HO,
Fe3+ + H2O2 → Fe2+ + HOO• + H+,
The hybrid sF process takes advantage of H2O2 accumulated from the HO• recombination during the ultrasonic treatment (Equation (5)) to promote Fenton-type reactions (Equations (6) and (7)) enhancing the degradation kinetics, minimizing the use of reagents (iron and hydrogen peroxide), and thus limiting secondary pollution and costs [5].
Diverse experimental configurations are possible for the sF process. Low (20–150 kHz) and mid-high (200–2000 kHz) frequency ultrasound reactors can be used [2,6,7,8]. It should be mentioned that at low-ultrasound frequencies there is a low generation of hydroxyl radicals, and consequently, a small accumulation of H2O2 (particularly very low at low applied power, i.e., <100 W). Then, hydrogen peroxide from an external source should be added to the reaction systems [6,7].
The sF systems can also use homogeneous or heterogeneous iron sources. For homogeneous systems, salts such as FeCl3× 6H2O and FeSO4× 7H2O are typically utilized [9]. Meanwhile, for the heterogeneous systems, Fe3O4 magnetic nanoparticles [9], Fe3O4/ZnO/graphene nanocomposites [10], pyrite nanorods [11], Fe2O3 on SBA-15 mesoporous silica [8], zero-valent iron (ZVI) [12,13], and iron-containing zeolites [2] or iron oxides supported on zeolites [14], among others, have been evaluated. It is reported that the ultrasonic component can decrease the mass transfer limitations for solid–liquid heterogeneous systems [9].
Many studies report successful application of the sF process to degrade organic pollutants. However, most of this research primarily focuses on the hybrid sF process using low ultrasound frequency (i.e., below 150 kHz) [6,9,10,11,12,13,14,15,16,17]. Furthermore, since most studies consider only one pollutant, the role of the pollutant’s nature in the sF process is not well examined [2,8,18]. Therefore, we developed systematic research, applying mid-high ultrasound frequency (200–1000 kHz) to degrade three representative pollutants, i.e., an antibiotic (ciprofloxacin), an analgesic (acetaminophen), and a dye (methyl orange), to evaluate the role of the pollutant’s nature. Both heterogeneous and homogeneous sF systems were considered. For the heterogeneous system, a natural mineral from Colombia was tested. This material was selected because of its high feasibility for use in Fenton-based systems according to previous research [19]). Ferrous and ferric salts were employed for the homogeneous sources. Special attention was paid to the interaction of the pollutant with iron, the decrease of biological activity, and the primary transformations experienced by the pollutants. Moreover, the advantages and limitations of the different sF configurations are discussed.

2. Results and Discussion

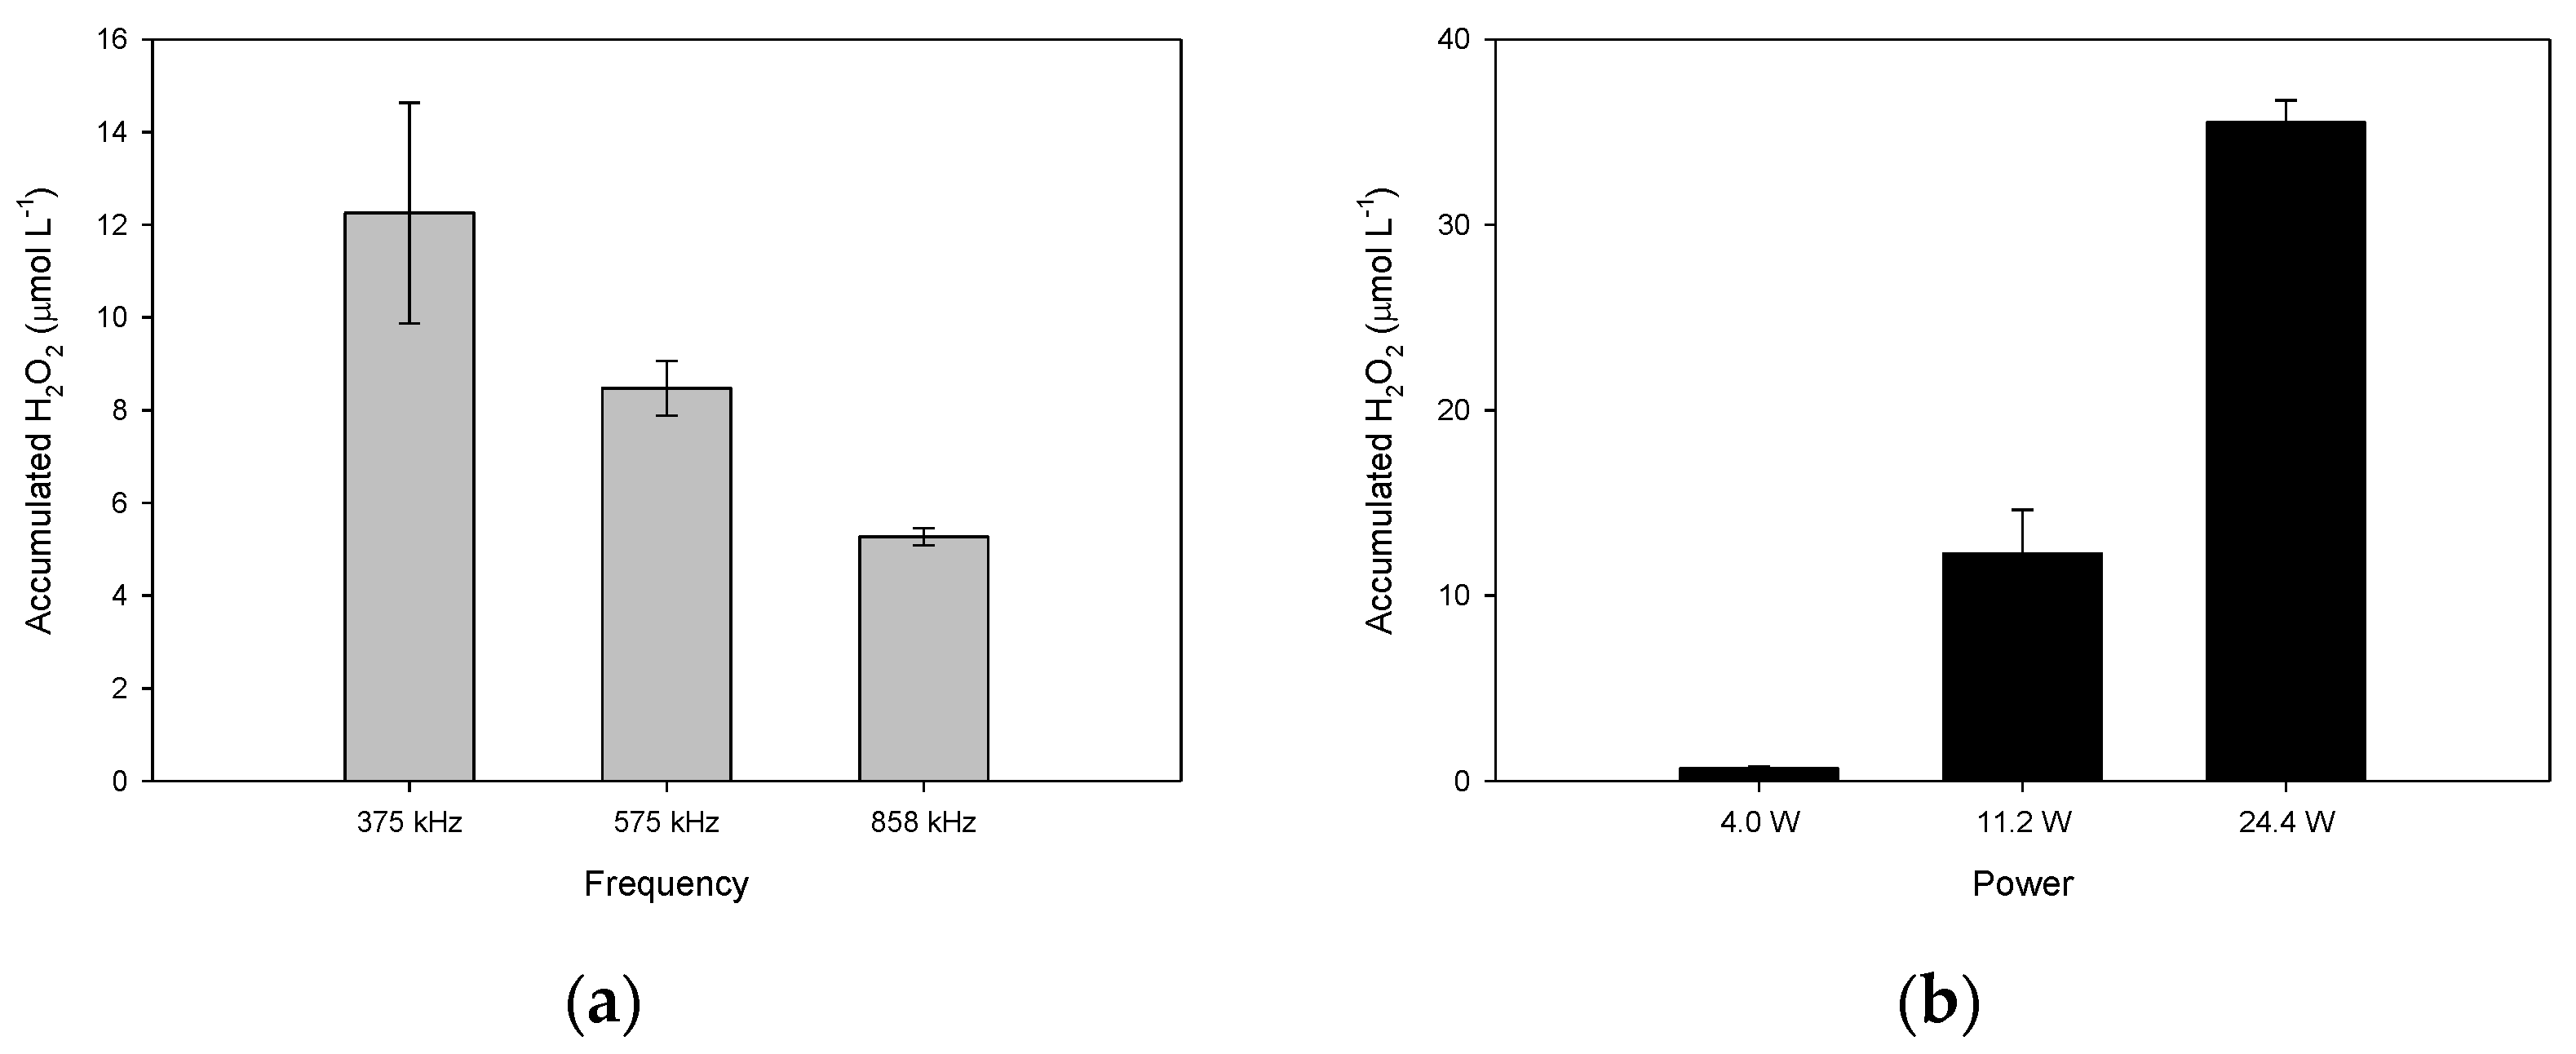
2.1. Suitable Conditions for the Operation of the Ultrasound Reactor to Produce H2O2

Initially, the capability of the sonochemical reactor to produce hydrogen peroxide (Equation (5)) in distilled water at different frequencies (375, 575, 858 kHz) was established. From Figure 1a, it can be noted that, as the ultrasound frequency increased, the accumulation of H2O2 diminished. In general, the size of the bubble decreases as the ultrasonic frequency increases [20,21]. Hence, at high frequencies (e.g., 858 kHz), the cavitation bubbles collapse so quickly that they do not achieve maximum size; this decreases the production of hydroxyl radicals [22], and a low level of hydrogen peroxide formation is observed. Therefore, the accumulation of H2O2 is more favored at 375 kHz than at 858 kHz.
At 375 kHz of frequency, the effect of the actual acoustic power on the accumulation of H2O2 was evaluated. As seen in Figure 1b, more hydrogen peroxide accumulated as the power was augmented from 4.0 to 24.4 W. In the literature, it is proposed that, at high power, the bubble could expand more during the rarefaction stage of the acoustic cycle and increase the bubble radius, allowing the bubble to cavitate, which can also increase the population of cavitation bubbles [20,21]. Furthermore, as the acoustic power is augmented, more violent cavitation events occur [23]. Consequently, more radicals are formed at higher acoustic power values, leading to a higher H2O2 accumulation. Considering the results in Figure 1, 375 Hz and 24.4 W were selected as suitable operational conditions to perform the sF process.

2.2. Heterogeneous Sono-Fenton Processes for the Elimination of Pollutants

After determining the suitable operational conditions for the hydrogen peroxide sonoproduction, the conditions were applied through ultrasound alone and with the sF process, using the natural mineral as a heterogenous source of iron at two concentrations (0.02 and 0.20 g L−1, Figure 2a) and starting with MO as a model organic pollutant. The sonochemical process alone degraded ~56% of the pollutant at 30 min of treatment. However, the addition of the natural mineral did not enhance the MO degradation. At the two concentrations of the natural solid, the pollutant evolution was very close to that obtained in its absence. It is important to mention that MO is not adsorbed on the mineral (Figure S1 in the Supplementary Materials), which is explained by the very low surface area (19.79 m2 g−1) of this solid material. Furthermore, if the MO pollutant is replaced by ACE (Figure 2b), a low effect of the solid on the pseudo-first-order kinetic constants for the treatments was observed. Similar to the results observed for MO, ACE was not adsorbed on the mineral surface (Figure S2a).
We should mention that another work in the literature reports that the addition of a heterogenous iron source to high-frequency ultrasound improves the degradation of organic pollutants (Table 1). However, such a system only truly works if a high concentration of H2O2 from an external source is also added at the beginning of the process [8]. MO and ACE are non-volatile and soluble compounds; thus, they are degraded by the sonogenerated hydroxyl radicals that reach the solution bulk. Concomitant to the interaction of these pollutants with HO•, the recombination of radicals leads to the formation of hydrogen peroxide (Equation (5)). The interaction of the heterogeneous iron source with hydrogen peroxide is therefore expected [24]. Moreover, the solid particles could promote the degradation of pollutants by providing additional nuclei for the formation of cavitation bubbles. However, the attenuation of the ultrasound waves by the particles may have adverse effects, which could reduce the degradation of the pollutant. Then, the net effect is dependent on the ultrasound system and solid material [2,25,26,27,28].
To better understand the role of the tested solids, a control experiment (distilled water without pollutants) was carried out. The evolutions of the sonogenerated H2O2 in the presence and absence of the natural mineral were compared (Figure 2c). It was found that the hydrogen peroxide accumulation was lower when the solid was present than in its absence. The decrease of the H2O2 concentration can therefore be associated with the quenching of waves by the presence of the solid particles of the mineral and/or the interaction among H2O2 and the ferric (=Fe3+) or ferrous species (=Fe2+) in the mineral (Figure S2b presents the XRD pattern of this mineral, demonstrating the predominance of hematite “Fe2O3”, with some traces of siderite “FeCO3”), which can produce degrading radicals (Equations (8) and (9)).
=Fe2+ + H2O2 → =Fe3+ + HO• + HO,
=Fe3+ + H2O2 → =Fe2+ + HOO• + H+,
It is also important to consider that small amounts of iron could be leached from the solid. Indeed, in our research team’s previous work regarding the use of this natural mineral in a photo-Fenton system, we found that less than 0.1 mg L−1 is leached from the solid material [19]. Thereby, in the sono-Fenton system, the involvement of the homogenous component of Fenton (Equations (6) and (7)) is plausible, and this also contributes to the decrease in the H2O2 concentration observed in Figure 2c.
Hence, the results of degradation in Figure 2 suggested that, despite the solids which may induce some attenuation of the ultrasound waves, the reaction system in the presence of the iron species in the solid particles and the leached iron can generate enough radicals to degrade the target pollutant. A balance among the contrary phenomena is proposed to explain the similar pollutants degradations in the absence and presence of a heterogeneous iron source (i.e., the Colombian natural mineral). Furthermore, these results also indicate that the sonochemical processes could be applied to treat polluted water even if it contains a high concentration of suspended solids (e.g., 0.20 L−1).
However, when this work is compared with other reports in the literature (Table 1), it can be noted that our results were similar to those reported for the heterogeneous sono-Fenton process at mid-high-frequency (e.g., 850 kHz) [2]. Moreover, results in the literature also show that the performance of the sono-Fenton at mid-high-frequency can be enhanced by the addition of H2O2. At low frequencies (<150 kHz), the physical effects of ultrasound (which are stronger than at high frequencies) play a relevant role, favoring the iron leaching, increasing the turbulence and mass transfer, and promoting particle disaggregation which augments the active sites on the catalyst surface (Table 1).

2.3. Homogeneous Sono-Fenton to Degrade Diverse Organic Pollutants

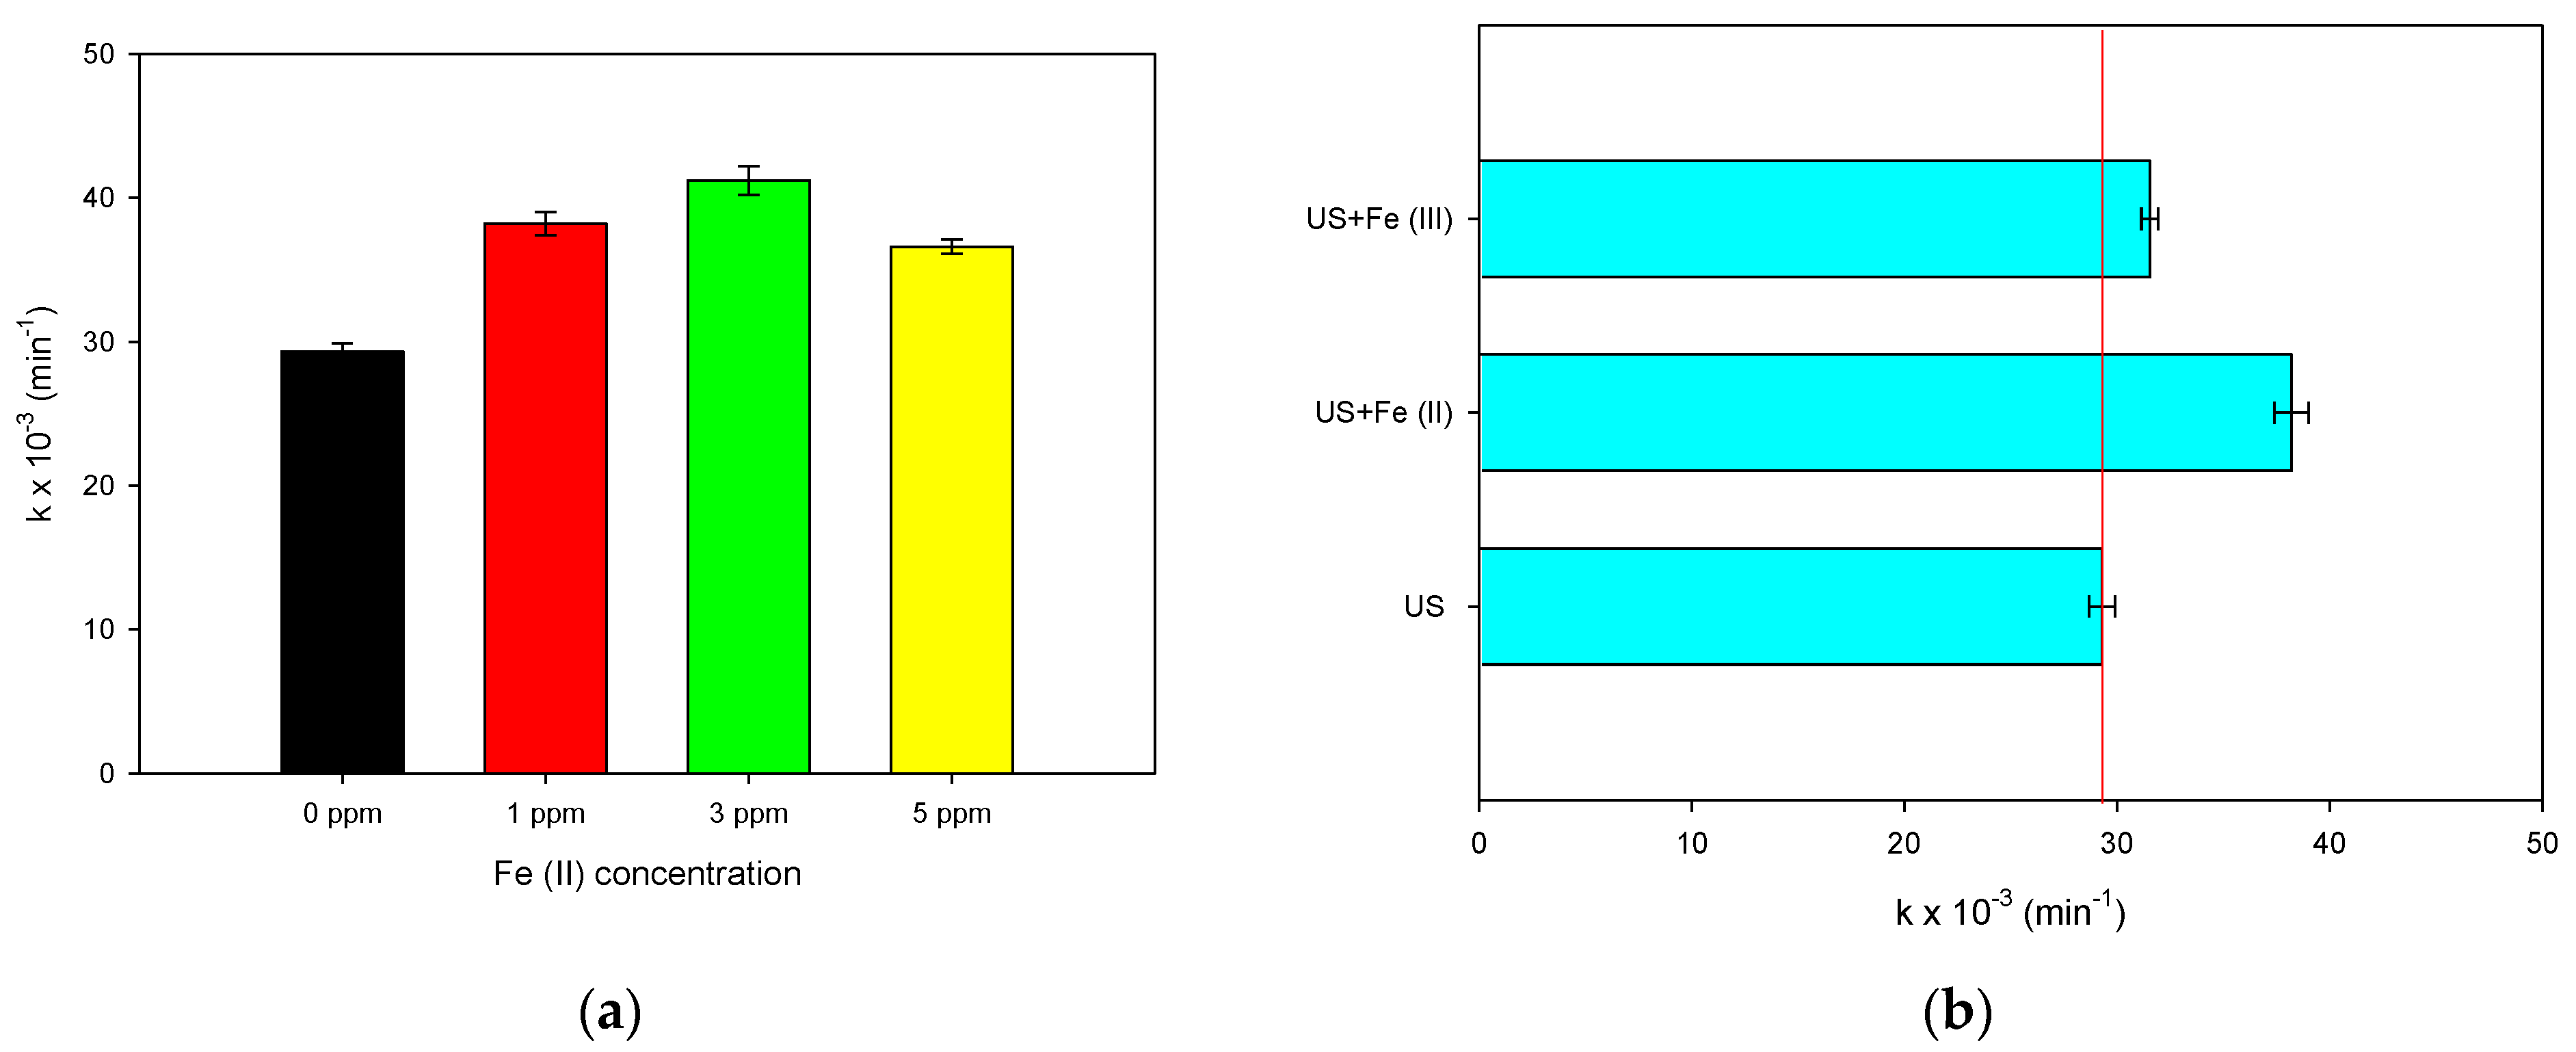
2.3.1. Effect of Iron (II) Concentration and Iron Species (II or III)

The other strategy to perform an sF process is the addition of soluble iron salts (e.g., iron sulfates or iron chlorides) obtaining a homogeneous system. Herein, the homogeneous sF involving ferrous ion (from FeSO4× 7H2O) was assessed first. Three different amounts of Fe2+ (1.0, 3.0, and 5.0 mg L−1) were added to the sonochemical reactor, and the sF process was developed using MO as the probe molecule (Figure 3a). The presence of ferrous ions at 1 mg L−1 augmented the pseudo-first-order rate constant (k) regarding the system with no iron, and when the Fe2+ was increased up to 3 mg L−1, a higher acceleration of the pollutant degradation was observed. However, if the ferrous iron concentration is 5 mg L−1, the k-value is lower than the one obtained at 1 mg L−1.
The presence of ferrous ions in the solution bulk of the sonochemical system promotes the production of extra hydroxyl radicals through the Fenton reactions with the sonogenerated H2O2 (Equations (5) and (6)), improving the degradation of the pollutants [2] according to Figure 3a. As the Fe2+ concentration increases, higher production of radicals and degrading effects are seen. Nonetheless, an excess of ferrous ions (e.g., 5 mg L−1) induced a scavenging interaction between iron and hydroxyl radical (Equation (10), [4,29]), and the radicals are consumed, competing with the pollutant degradation. Thereby, the sF process at low or moderate concentrations of ferrous ions has excellent possibilities, but at a high Fe2+ concentration, its ability to degrade pollutants could be limited.
Fe2+ + HO• → Fe3+ + HO,
Once the effect of the iron (II) concentration on the sF process was established, the treatment of MO as a probe pollutant, under the substitution of ferrous ions by ferric ions, was performed. Figure 3b compares the pseudo-first-order kinetics constants (k-values) for the treatment of MO by sF using Fe2+ or Fe3+. The ferric ion also improved the degradation kinetics of the pollutant, but the enhancing effect induced by Fe2+ is superior to that obtained when Fe3+ is added (Figure 3b). Such findings are explained by considering the interaction between the two iron species with hydrogen peroxide and the formed radicals, respectively. The reaction of Fe2+ with H2O2 (Equation (6), k: 53–76 M−1 s−1) is faster than the Fe3+-H2O2 interaction (Equation (7), k < 10−2 M−1 s−1) [29,30,31]. The former reaction (Equation (6)) also produces the hydroxyl radical (E°: 2.73 V, [4]), and this oxidizing agent is stronger than hydroperoxyl radical (E°: 1.44–1.65 V, [32]), which is formed from the Fe3+-H2O2 interaction (Equation (7)).

2.3.2. Degradation of Diverse Organic Pollutants by Homogeneous Sono-Fenton

The results in the previous sections showed that soluble salts of iron (II) at low concentrations are more convenient to obtain positive effects on the sF process. Therefore, such conditions (1.0 mg L−1 of Fe2+) were used to treat other organic pollutants aiming to evaluate the effect of the nature of the contaminant on the performance of the process. The degradation of the pharmaceuticals ACE and CIP were considered (Figure 4). Figure 4a compares the ACE evolution under the action of ultrasound alone and with sF. The addition of soluble iron (II) to the sonochemical reaction increased the ACE degradation from 43% to 80% (after 30 min of treatment) compared to the action of ultrasound alone. To better support the role of the ferrous ions in the system, the accumulation of H2O2, after 30 min of ACE treatment in the absence and presence of the ferrous ions was measured.
As seen in Figure 4b, the accumulation of hydrogen peroxide in the sF process (US + Fe (II)) is lower than in the sonochemical system alone (US), indicating the generation of extra radicals by the Fenton reaction (Equations (6) and (7)), which is responsible for the acceleration of the ACE degradation. In turn, Figure 4c depicts the case of CIP treatment using the sonochemical system and sF process. In contrast to the results observed for ACE or MO, the addition of iron (US + Fe (II), sF) improved the antibiotic degradation in the first 5 min of treatment, but the pollutant elimination stopped after this. Even at 30 min after the process began, the removals of CIP by sonochemistry and sF were the same. In the sF system, it is possible that the Fe3+, which is produced from the Fenton reaction (Equation (6)), interacted with the non-degraded molecules of CIP, thus limiting the iron availability.
As shown in Figure 4d, the interaction of ferric ions with CIP produced a new band between 400 and 600 nm in the UV-Vis spectrum. Moreover, the mixture of the antibiotic and the ferric ions induced an intense yellow coloration of the solution. These results evidenced the formation of a CIP-Fe3+ complex [33]. However, no interaction between ferrous ions and CIP was observed (Figure S3). Recent studies have also reported that the interaction between fluoroquinolones (CIP belongs to this antibiotics class) and ferric ions leads to the formation of stable complexes [33,34]. It can be noted that CIP has the keto-carbonyl moiety (structure with a higher number of lone electron pairs), which favors the interaction between this fluoroquinolone and ferric ion through chelation [35,36,37]. This contrasts with the case of ACE, which is not able to form complex iron ions. In fact, the presence of ferric or ferrous ions in the ACE solution did not generate new adsorption bands, as supported by the UV-Vis spectra in Figure S4.
Therefore, the results in Figure 4b could be explained by considering that, at the beginning of the CIP treatment by sF, the ferrous ions reacted with the sonogenerated H2O2 inducing an acceleration of the pharmaceutical degradation and producing ferric ions (Equation (6)). Subsequently, the ferric ions are complexed by the remaining molecules of CIP. The formed complex is a charged hydrophilic molecule [33,38] that is placed far away from the cavitation bubble and the hydroxyl radicals. Consequently, the complex is recalcitrant to the sonochemical action, and the CIP concentration remains constant, as observed in Figure 3b. Thus, the above results from the degradation of CIP, ACE, and MO by the sF system indicate that the nature of the pollutant strongly influenced the process performance. Thereby, sF is more suitable for degrading organic contaminants that have no complexation capability toward the iron species.
A comparison of the homogeneous sono-Fenton process with the existing literature (Table 2) shows that our system had similar results to those obtained using mid-high-frequency ultrasound by the single addition of Fe2+, which accelerates the elimination of the contaminant. It is also reported that an excess of ferrous ions induces scavenging effects. From information available in the literature, it can also be noted that the performance of the sono-Fenton process at high frequencies is improved by the external addition of H2O2. Other studies indicate that low-frequency ultrasound in combination with Fe2+ and H2O2 is also useful for degrading organic contaminants, even presenting better results than Fenton systems or ultrasound alone. Most studies utilize ferrous ions, and a few of them report that ferric ions have a lower enhancing rate in eliminating pollutants. Additionally, the complexation of the target pollutant with iron species is not reported or discussed in the previous literature about the sono-Fenton process (Table 2).

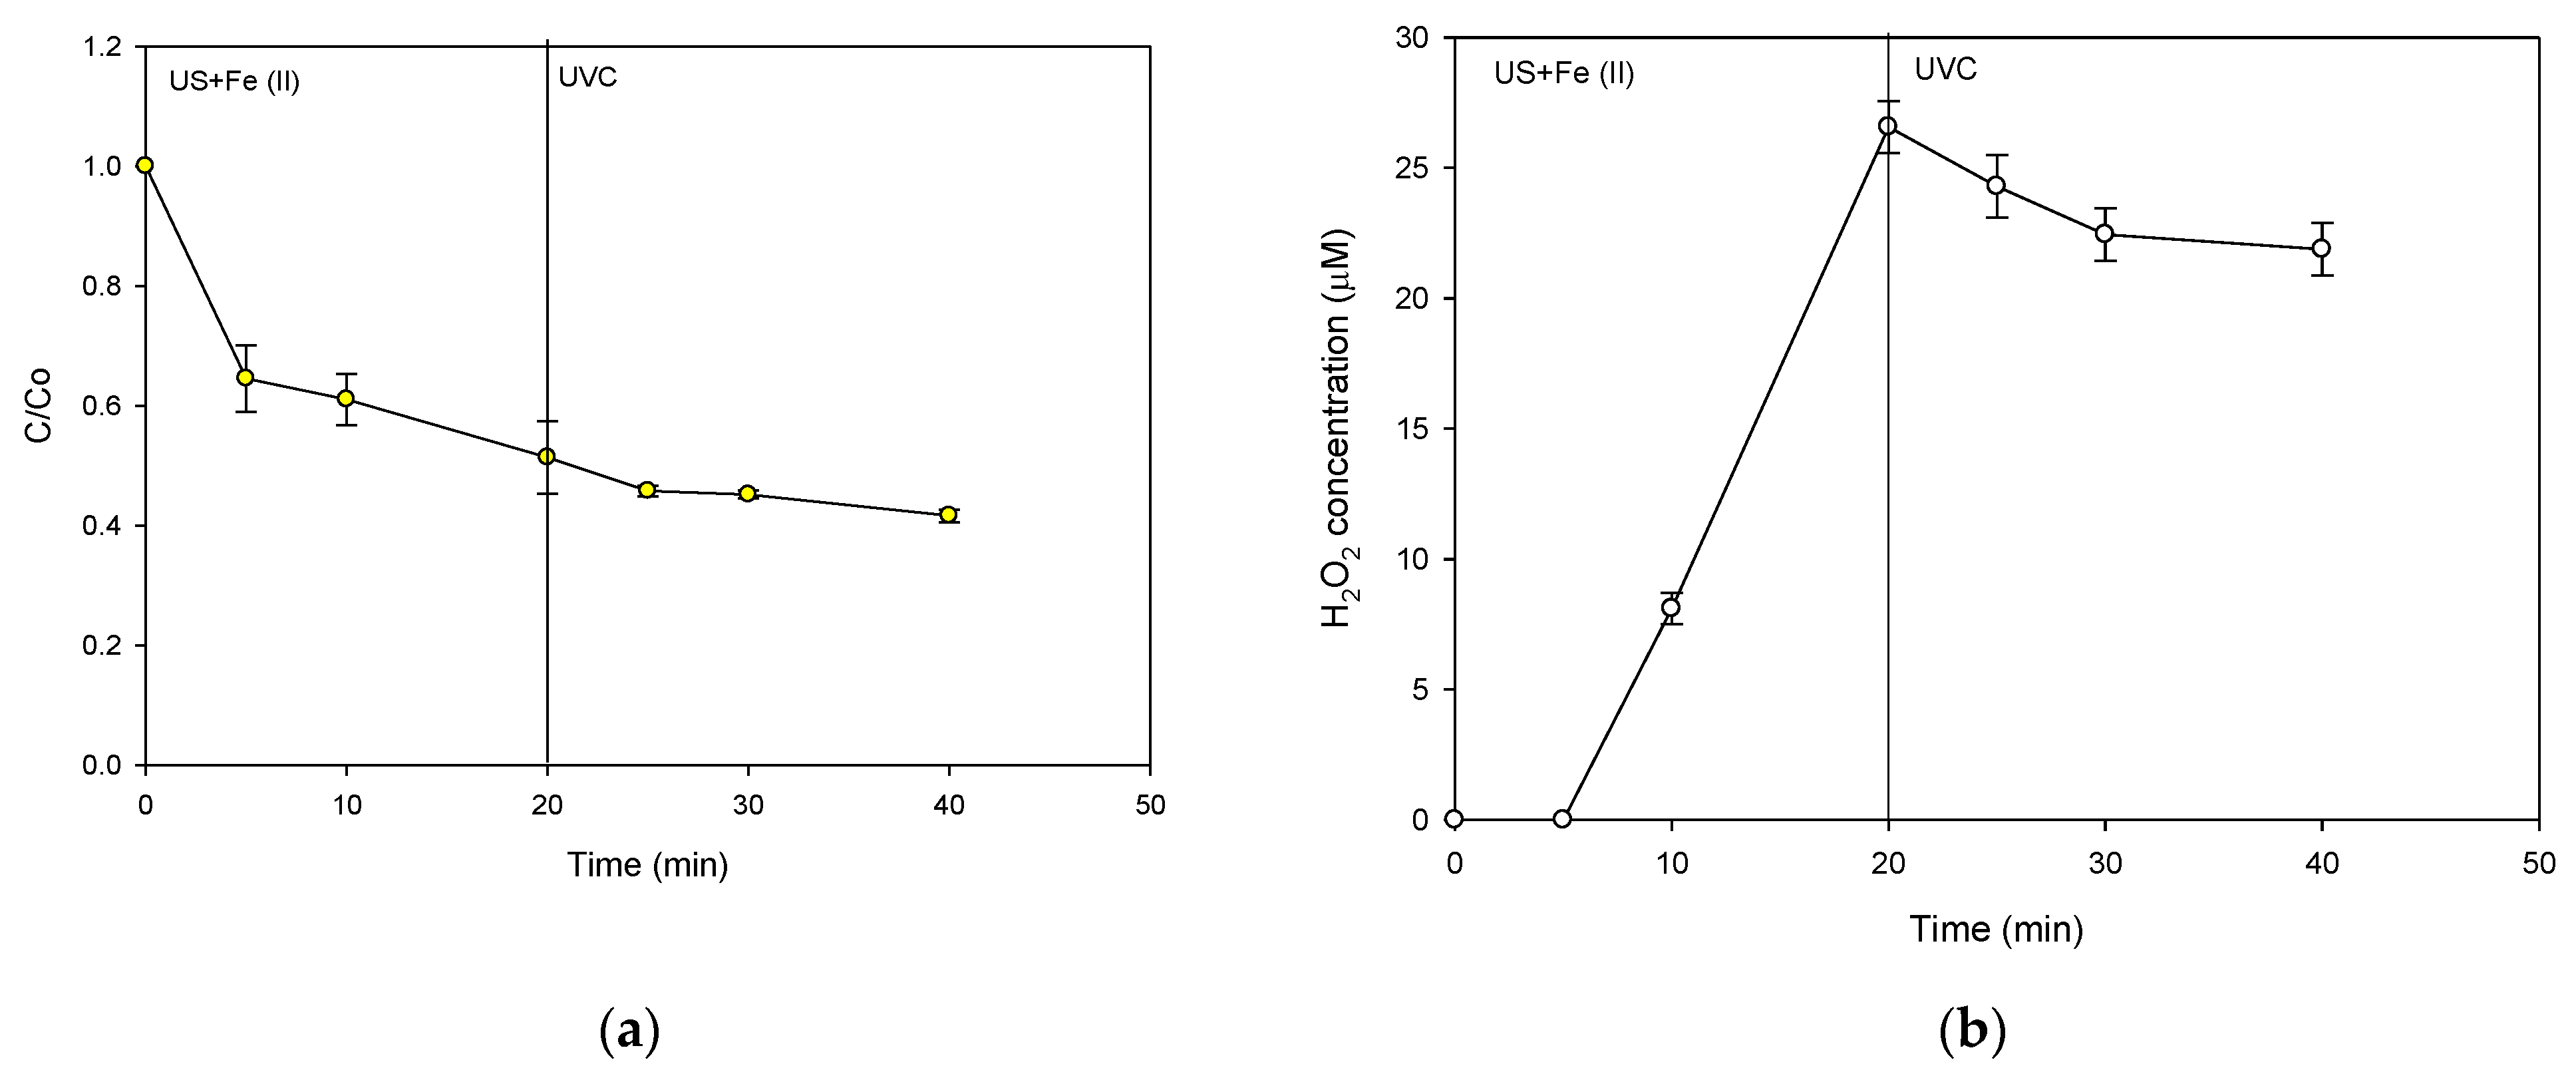
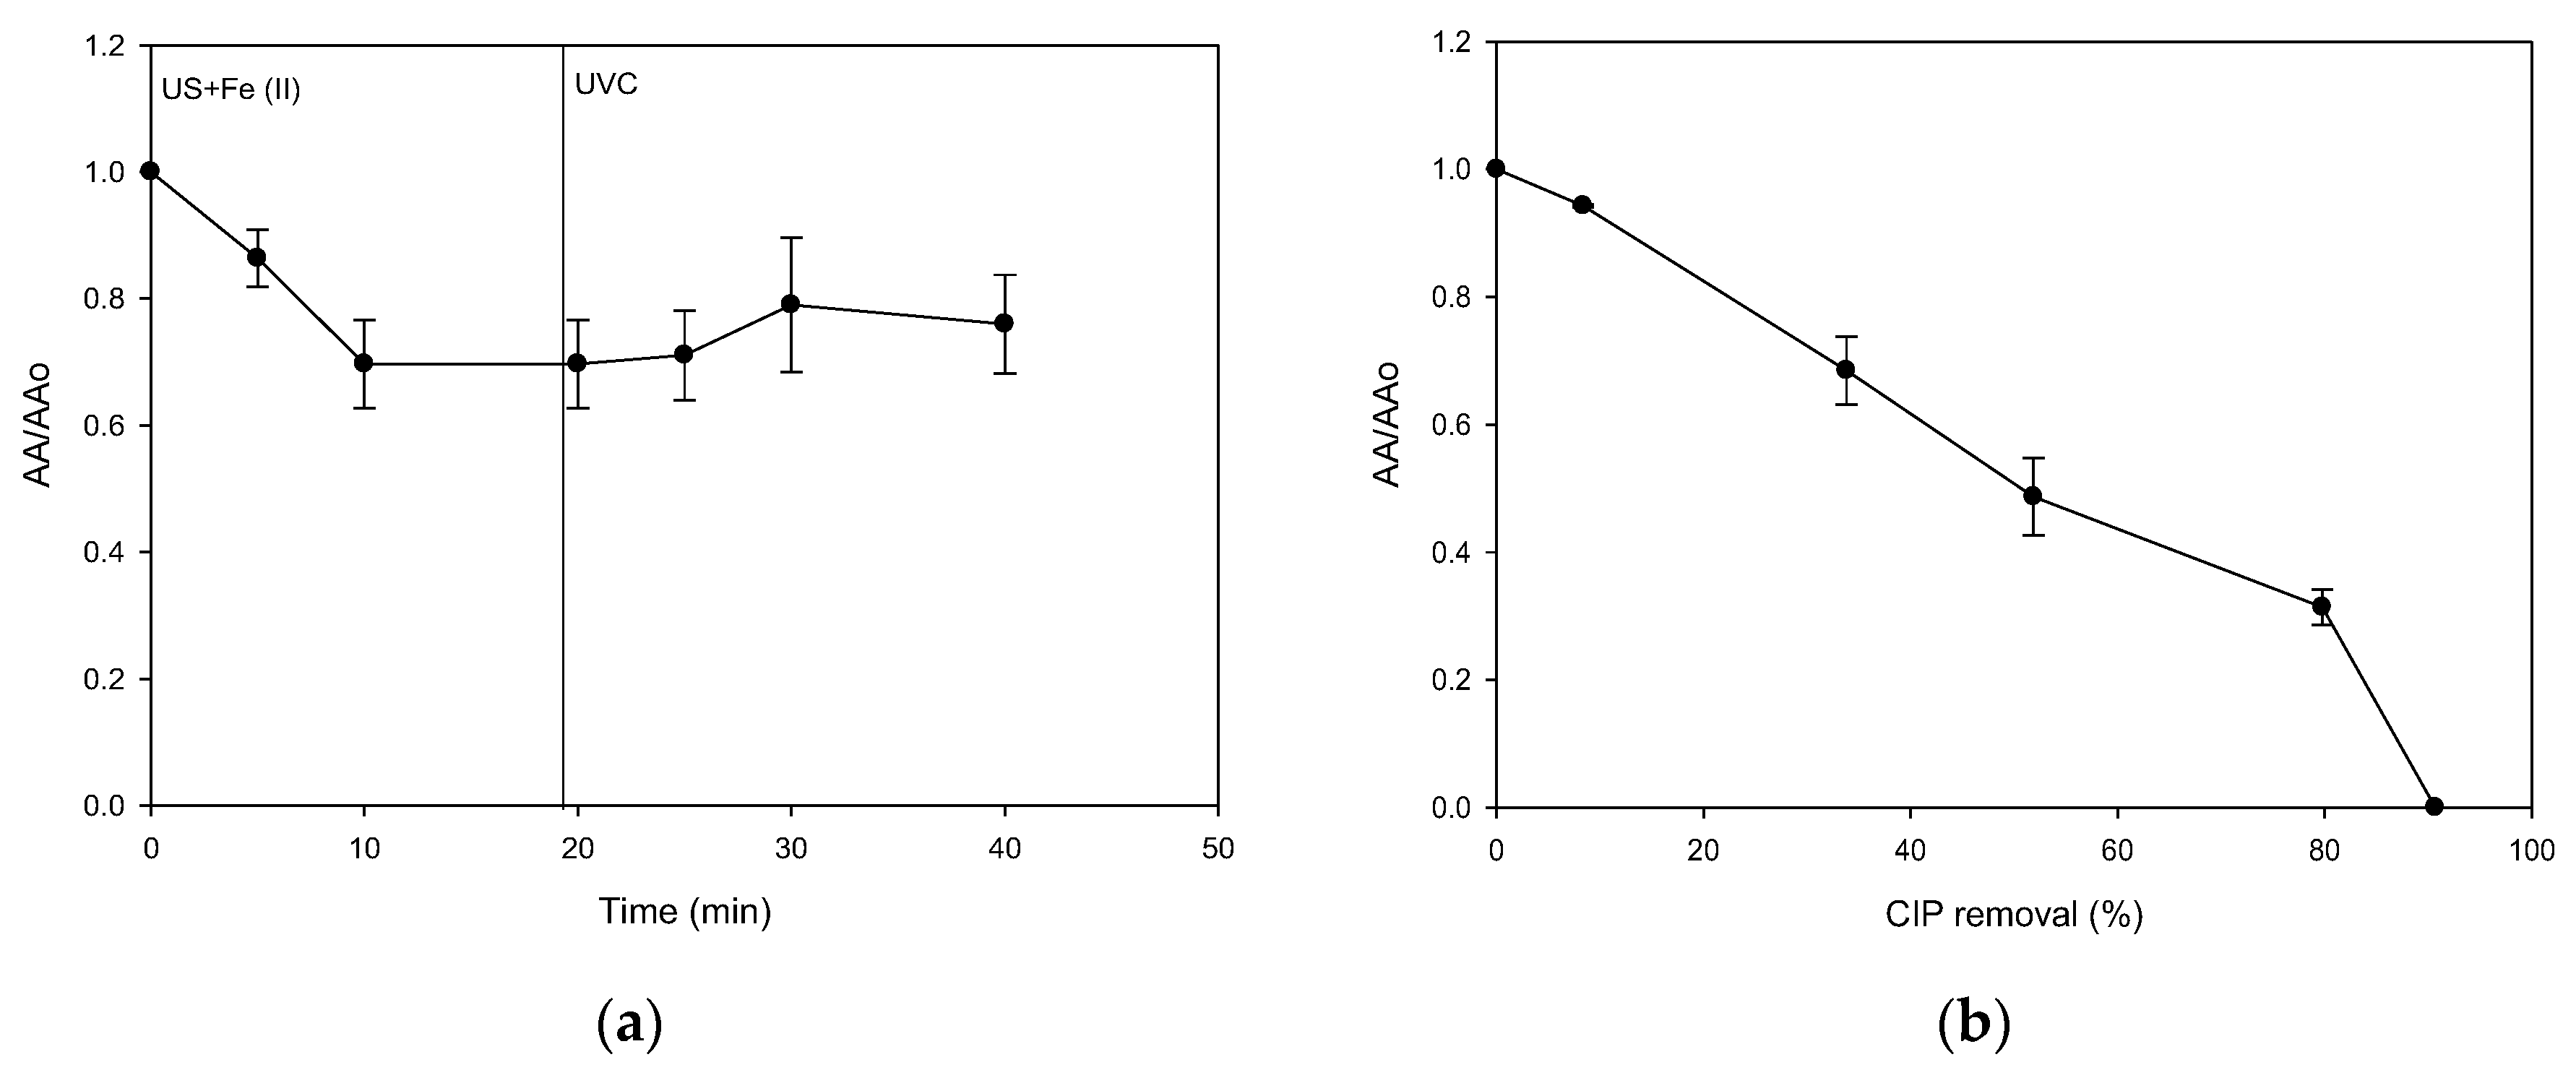
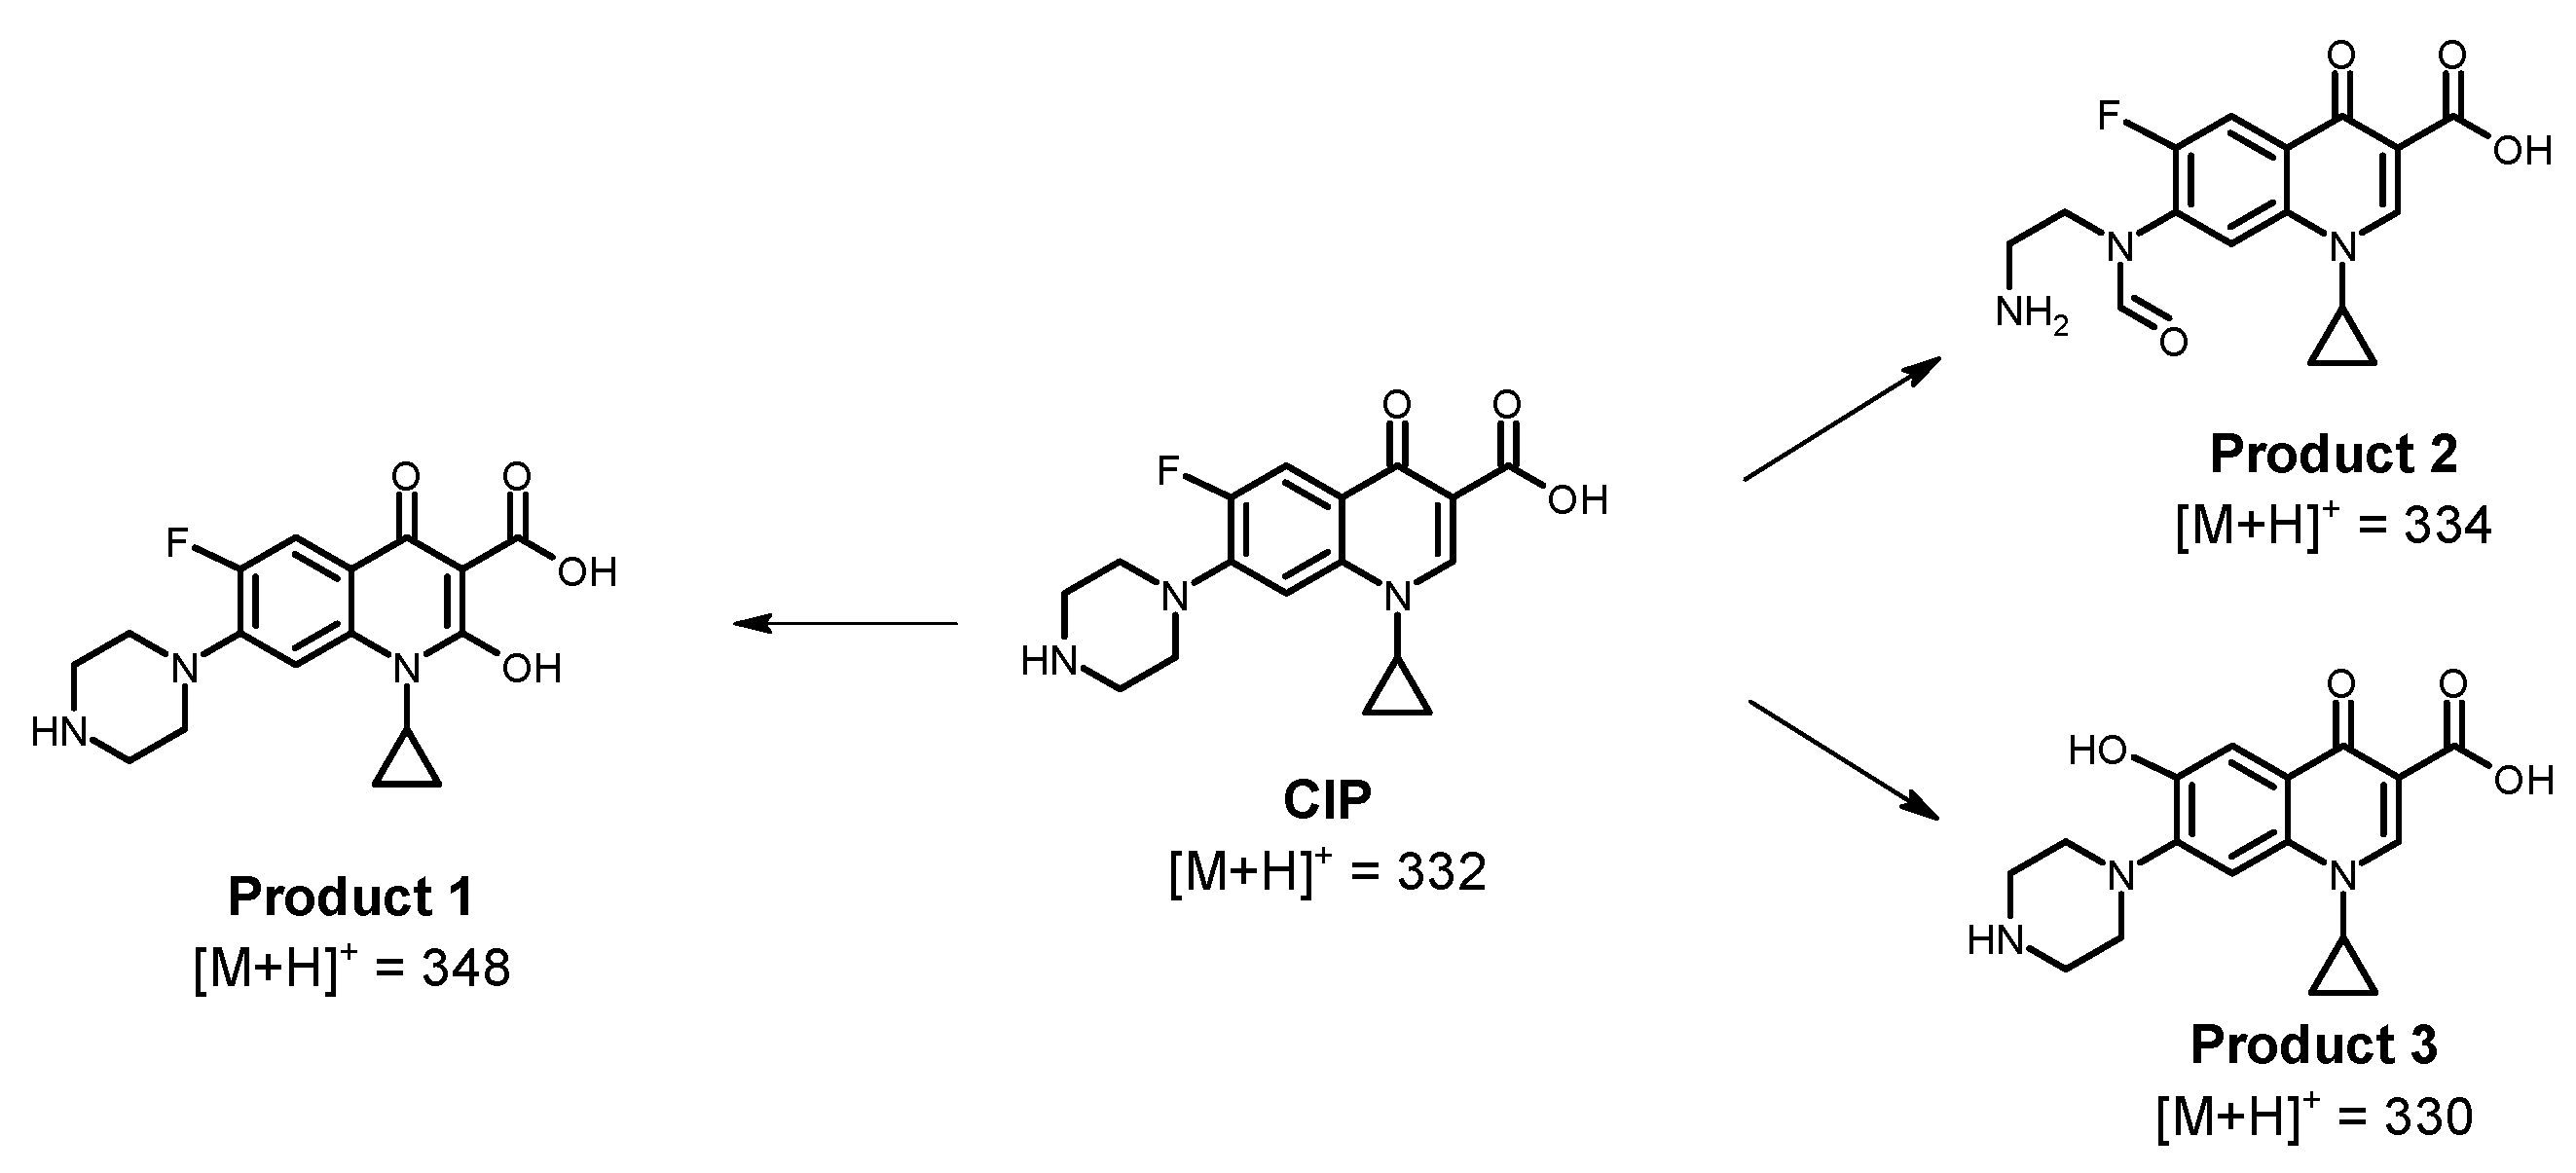
2.4. A Strategy for the Treatment of CIP

As shown in Section 2.3.2, the sF system was not able to degrade CIP because of the production of an organo-complex stable to the sonochemical action. Therefore, considering the capability of the formed complex to absorb ultraviolet light (Figure 4d), the photo-treatment was tested using very energetic irradiation (i.e., UVC light at 254 nm). This type of light was selected for its ability to photolyze H2O2 (Equation (11)) and promote the photo-reduction of aqua-complex of ferric ions (Equation (12)), producing hydroxyl radicals profitable for the degradation of the pollutant [41,42]. Hence, after 20 min of application of the sF process, the resultant solution was removed from the ultrasound reactor, transferred into a beaker, and subsequently irradiated using UVC light (a sequential treatment, i.e., sF followed by the UVC action).
H2O2 + hv254 nm → 2 HO•,
Fe3+ + H2O + hv254 nm → Fe2+ + HO• + H+
From Figure 5a, it can be noted that the treatment using ultraviolet irradiation had a low degrading action on the complexed CIP. the H2O2 evolution presented in Figure 5b also indicated a low consumption of hydrogen peroxide. The low photodegradation of the complexed CIP can be associated with the relocation of part of the electron density from the organic structure (i.e., CIP) on the metal ion [33,43]. Indeed, previous theoretical works have reported that the interaction of fluoroquinolones with the metal cations increases the activation energy for some photo-transformation pathways, thus making the complex more recalcitrant than the free antibiotic to the light action [43,44,45]. Furthermore, as the complex had strong adsorption of the UVC light, this may affect the production of radicals by the hydrogen peroxide photolysis (Equation (11)) or the photo-reduction of aqua-complex of ferric ions (Equation (12)). Hence, the degradation of the complexed CIP and the H2O2 consumption are low under the UVC light action, as observed in Figure 5.
To analyze the treatment extent, the antimicrobial activity (AA) evolution corresponding to the sequential treatment (sF followed by UVC) was also stated (Figure 6a). It can be noted that the initial ultrasound step led to a decrease in the AA (~30% after 20 min of treatment). However, the photochemical component had no significant effect on the AA decrease. These results regarding the AA evolution were consistent with those observed in Figure 5. As the elimination of the antibiotic stopped, the AA remained approximately constant. Hence, the decrease in antimicrobial activity was related to the diminution in the concentration of CIP. Moreover, it should be remarked that the sequential system was unable to decrease the AA completely.
As the sF process is limited, the capability of the ultrasound system alone to decrease the AA associated with CIP was also assessed (Figure 6b). This process achieved a complete decrease in AA. Indeed, at 90% of CIP removal, the AA was 100% decreased, suggesting that the residual CIP amount (i.e., ~3.1 µmol L−1) is below its minimum inhibitory concentration (MIC), and the degradation products could have lower AA than the parent antibiotic because of structural modifications on the antibiotic, which would be induced by the action of the process [38]. Therefore, to better understand the AA evolution under the US action, the primary transformation products were elucidated (Figure 7).
The sonochemical action induced a hydroxylation of the quinolone nucleus (Product 1), cleavage plus oxidation of the piperazyl ring (Product 2), and substitution of the fluorine on CIP (Product 3, Figure 7). These products come from the attacks of the sonogenerated hydroxyl radicals. They have also been detected during the treatment of CIP by other oxidative processes, such as pulsed radiolysis [46], photocatalysis using bismuth oxybromide [47], electrochemical [48], and persulfates-based systems [49,50], in addition to photolytic and photocatalytic treatments [51]. The modifications on the quinolone (Product 1) and piperazyl (Product 2) rings may alter the acid/base speciation and decrease the lipophilicity and the cell permeability [51], thus diminishing the AA. In turn, the fluorine replacement on the CIP structure (as shown for Product 3) could also diminish the antimicrobial action as the fluorine atom on CIP plays a determinant role in the cell permeation [51] as well as inhibiting the DNA gyrase (which is the action mode of this antibiotic on bacteria [52]). Such structural transformations on CIP by the sonochemical explain the AA decrease observed in Figure 6b. Therefore, the sF has limited performance for eliminating ciprofloxacin, and it is more convenient for this antibiotic treatment to use ultrasound alone.

3. Materials and Methods

3.1. Reagents

Ciprofloxacin (CIP) and acetaminophen (ACE) were provided by Laproff laboratories (Medellín, Colombia). Acetonitrile, hydrochloric acid, Iron (III) chloride hexahydrate, Iron (II) sulfate heptahydrate, methyl orange (MO), and nutrient agar were purchased from Merk (Darmstadt, Germany). Formic acid was obtained from Carlo Erba (Barcelona, Spain). Peptone and yeast extract powders were purchased from Oxoid (Basingstoke, UK). All the culture media and broths were sterilized at 121 °C using an autoclave. All solutions were prepared using distilled water.
As the heterogeneous iron source, a natural mineral was used. This material was obtained from an iron mine in Colombia (Duitama, Boyacá). It was used without any pretreatment. The specific surface area was estimated at 19.79 m2 g−1 by the Brunauer–Emmett–Teller (BET) theory, and N2 physisorption measurements on a Micromeritics 3Flex apparatus were used for the measurements. The natural mineral contained 81.3% by mass of iron (as iron oxides, mainly hematite with traces of siderite, see Figure S2b) [19].

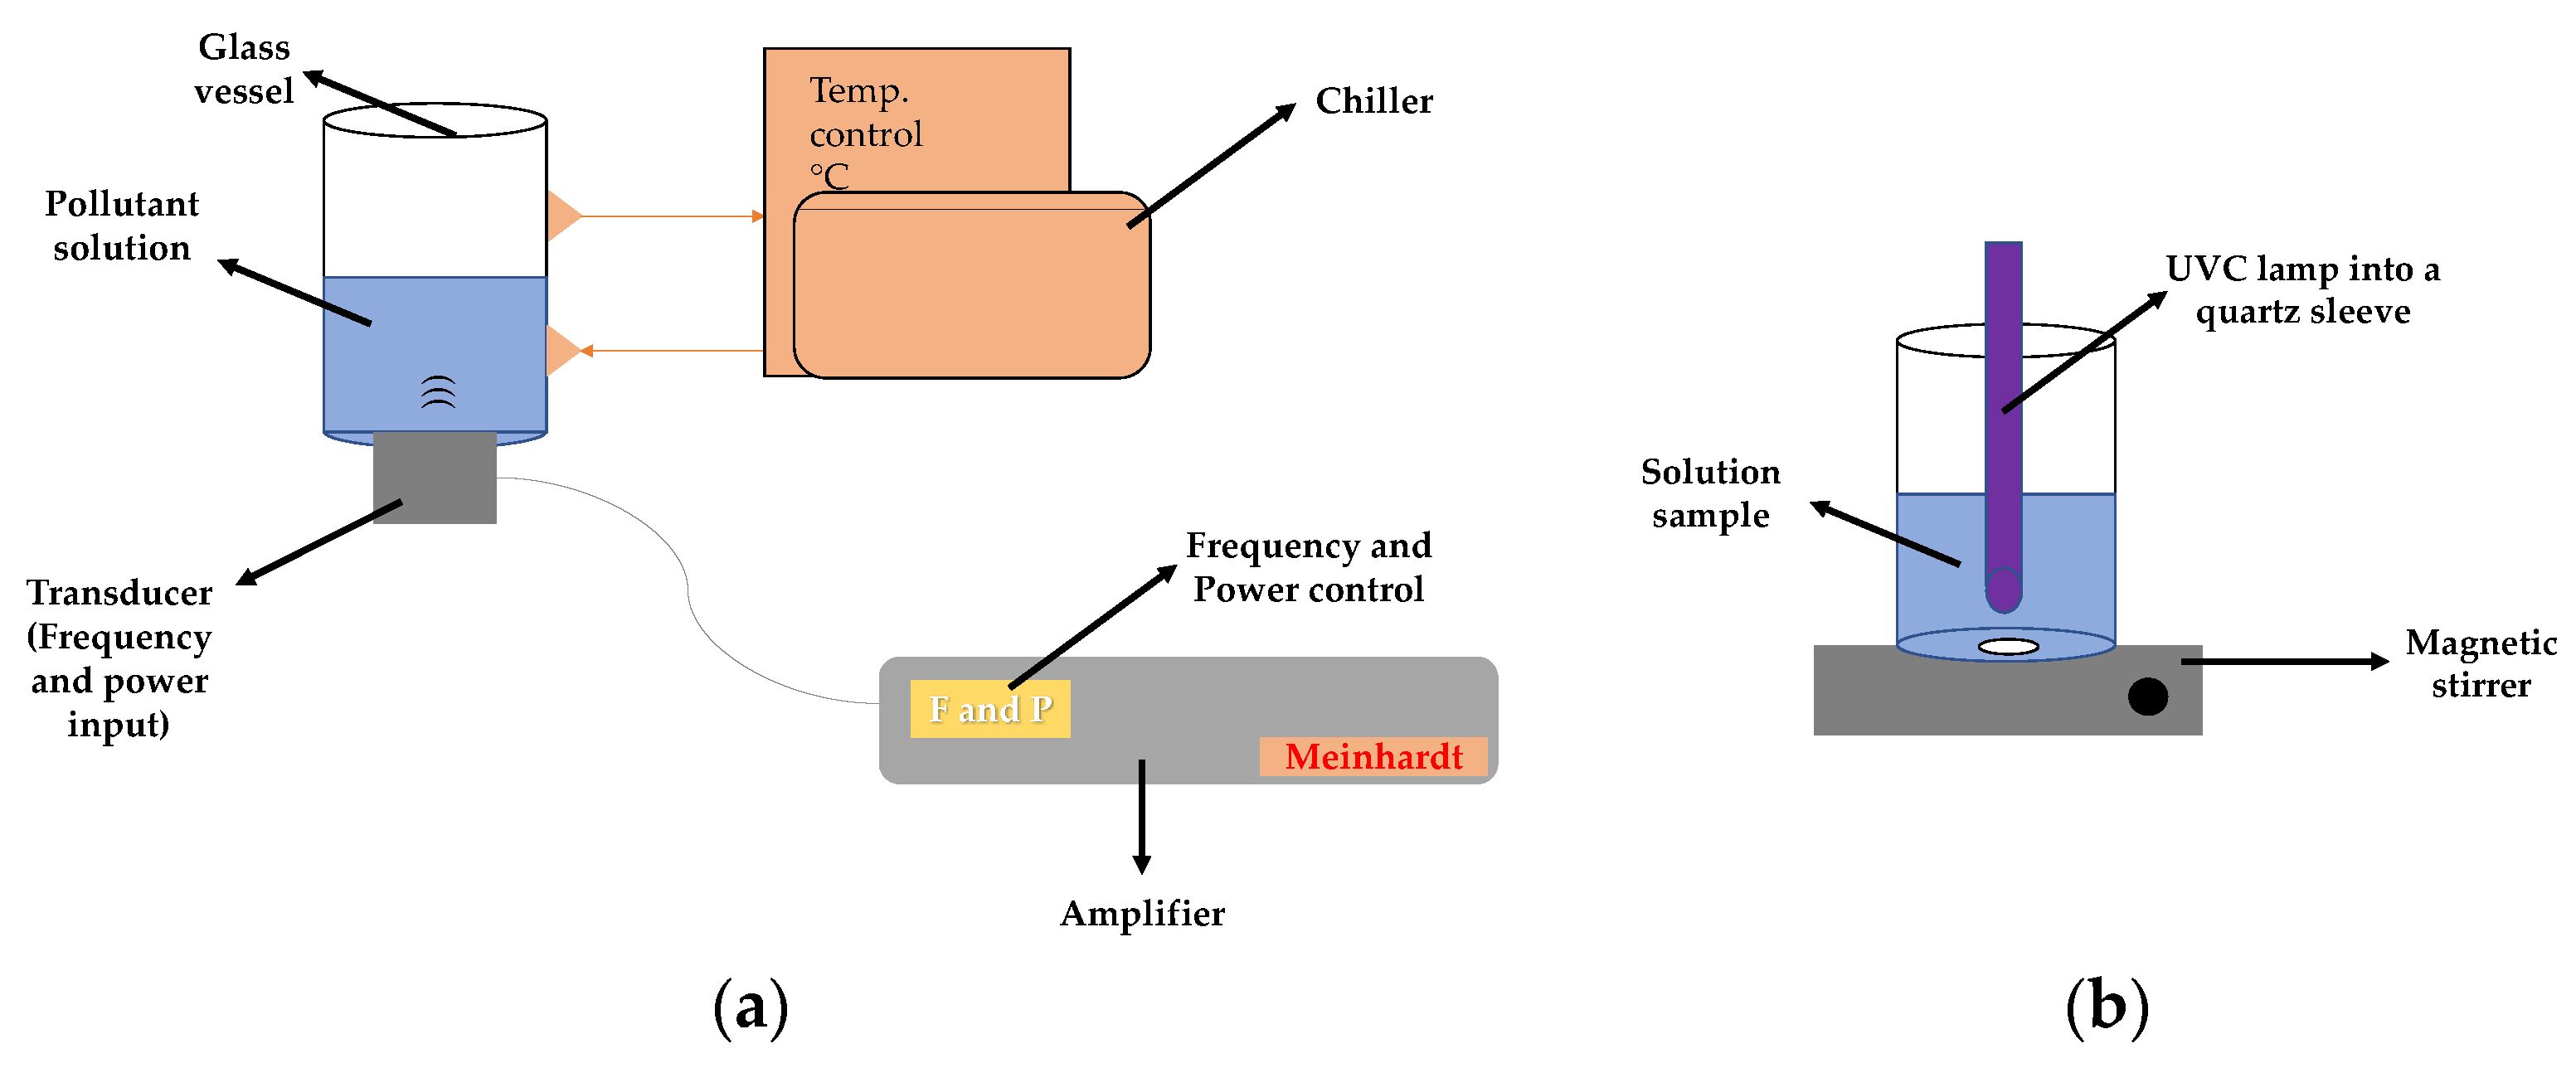
3.2. Reaction System

Sonochemical experiments were carried out in a high-frequency Meinhardt Ultrasonics reactor (i.e., >200 kHz) equipped with a cylindrical glass vessel containing 250 mL of pharmaceutical solution. The ultrasound waves were emitted from a transducer (with the possibility of operation at three different frequencies: 375, 575, and 858 kHz) placed at the bottom of the reactor. In this reactor, both frequency and power can be changed (Figure 8a). The actual ultrasound power was determined by the calorimetric method [53].
For the photo-treatment of the solutions previously treated by ultrasound, a homemade reflective reactor was used that was equipped with three Osram Puritec (HNS G5, 60 W) UVC lamps (Wilmington, MA, USA) and a main emission peak at 254 nm. A beaker containing 250 mL of the sample that was under constant magnetic stirring was submitted to the UVC action (Figure 8b). The actual photon flux of UVC light in the reactor was 3.02 × 10¹⁷ photons s−1 (determined by actinometry using ferrioxalate [54]).

3.3. Analyses

The evolution of the pharmaceuticals during treatments was followed by using a UHPLC Thermo Scientific (Waltham, MA, USA) Dionex UltiMate 3000 instrument equipped with an Acclaim™ 120 RP C18 column (5 µm, 4.6 mm × 150 mm) and a diode array detector. The chromatographic conditions of each pharmaceutical, such as composition mobile phase, flow, and detection wavelength, are detailed in Table 3. In the case of the methyl orange, its degradation was followed by measuring the absorbance at 465 nm using a UV5 Mettler-Toledo spectrophotometer. During the pollutants’ treatment, samples of 0.5 mL were periodically taken from the reaction systems (the total taken volume was always lower than 10% of the initial volume in each system). The degradations fitted well to pseudo-first-order kinetics, and the rate constants (k) were obtained as the slope of the ln (C/Co) vs. time plots, as illustrated in Figure S9. Table S1 summarizes the k-values associated with the degradation of the target pollutants, with their corresponding errors and correlation coefficients.
Accumulation of sonogenerated hydrogen peroxide was estimated by iodometry [40]. An aliquot of 600 µL from the reactors was added to a quartz cell containing 1350 µL of potassium iodide (0.1 M) and 50 µL of ammonium heptamolybdate (0.01M). After 5 min, the absorbance at 350 nm was measured using a spectrophotometer (UV5 Mettler Toledo).
The evolution of the antimicrobial activity of CIP was analyzed by the diffusion agar method [55], using 30 µL of the sample, S. aureus (ATCC 25923) as the indicator microorganism, and the incubation was performed at a Memmert incubator at 37 °C during 24 h.
The primary transformation products were established using an HPLC Agilent 1200 series coupled to an Agilent LC/MSD VL SQ mass spectrometer (Santa Clara, CA, USA). The column and mobile phase were operated under the same conditions presented in Table 3. The injection volume was 10 µL and the mass spectrometer detector was operated in positive ion mode [56].
XRD analysis for the natural mineral was carried out in an X’Pert MPD PRO from PANalytical (Malvern, UK) apparatus using Cu Kα radiation at a grazing incident angle of 4°. The sample was sieved to separate the large aggregates and avoid X-ray reflection due to size. It was then suspended in MQ-water and dropped/fixed on a glass slide [19].

4. Conclusions

The heterogeneous iron source had a low effect on the degrading action of the sonochemical process because, despite the solid particles of the natural mineral could induce some attenuation of the ultrasound waves, the system can generate enough radicals to degrade the target pollutants. In the homogenous sF performance, a strong dependence on both the oxidation state and concentration of iron was observed, where the use of ferrous ions, at relatively low concentrations, promotes the formation of extra hydroxyl radicals beneficial to enhance the degradation of the pollutants. Finally, it must be considered that the interaction of the pollutants with the iron species can alter the degrading action. In fact, the formation of ferric complexes makes some pollutants recalcitrant to the action of ultrasound or UVC light. In this last case, it is convenient to utilize ultrasound alone, which can efficiently degrade the non-complexed pollutant. In fact, in the case of antibiotics such as CIP, the ultrasound alone is even able to decrease the antimicrobial activity thanks to transformations induced by the sonochemical process to the parent pollutant.

Supplementary Materials

The following supporting information can be downloaded at: https://www.mdpi.com/article/10.3390/molecules28031113/s1, Figure S1: Adsorption of MO on the natural mineral; Figure S2: (a) Adsorption of ACE on the natural mineral, (b) XRD pattern of the Colombian natural mineral, Figure S3: UV-Visible spectrum of CIP and its interaction with ferrous ions; Figure S4: UV-Visible spectrum of ACE and its mixture with ferric and ferrous ions; Figure S5: Mass spectrum of CIP; Figure S6: Mass spectrum of Product 1; Figure S7: Mass spectrum of Product 2; Figure S8: Mass spectrum of Product 3. Figure S9: pseudo-first-order rate constant (k) determination example, Table S1: Values of pseudo-first-order constants (k) for the degradation of the target pollutants.

Author Contributions

Conceptualization, E.A.S.-G., J.L., A.E.-I. and R.A.T.-P.; methodology, E.A.S.-G. and J.S.-A.; formal analysis, E.A.S.-G. and J.S.-A.; investigation, E.A.S.-G.; resources, J.L., A.E.-I. and R.A.T.-P.; writing—original draft preparation, E.A.S.-G.; writing—review and editing, J.S.-A., J.L., A.E.-I. and R.A.T.-P.; project administration, J.L. and R.A.T.-P.; funding acquisition, J.L. and R.A.T.-P. All authors have read and agreed to the published version of the manuscript.

Funding

This research was funded by MINCIENCIAS COLOMBIA, grant No. 1115-852-69594 (PRO-CEC-AGUA); and the ROYAL SOCIETY-UK, project “Sound” methods of remediating emerging contaminants in hospital wastewater (ICA/R1/191053).

Institutional Review Board Statement

Not applicable.

Informed Consent Statement

Not applicable.

Data Availability Statement

Data will be available by request through email to the corresponding authors.

Conflicts of Interest

The authors declare no conflict of interest.

Sample Availability

Samples of the compounds are not available from the authors.

References

  1. Chakma, S.; Moholkar, V.S. Physical mechanism of sono-Fenton process. AIChE J. 2013, 59, 4303–4313. [Google Scholar] [CrossRef]
  2. Dükkanci, M.; Vinatoru, M.; Mason, T.J. The sonochemical decolourisation of textile azo dye Orange II: Effects of Fenton type reagents and UV light. Ultrason. Sonochem. 2014, 21, 846–853. [Google Scholar] [CrossRef] [PubMed]
  3. Montoya-Rodríguez, D.M.; Serna-Galvis, E.A.; Ferraro, F.; Torres-Palma, R.A. Degradation of the emerging concern pollutant ampicillin in aqueous media by sonochemical advanced oxidation processes—Parameters effect, removal of antimicrobial activity and pollutant treatment in hydrolyzed urine. J. Environ. Manag. 2020, 261, 110224. [Google Scholar] [CrossRef]
  4. Pignatello, J.J.; Oliveros, E.; Mackay, A. Advanced Oxidation Processes for Organic Contaminant Destruction Based on the Fenton Reaction and Related Chemistry. Crit. Rev. Environ. Sci. Technol. 2006, 36, 1–84. [Google Scholar] [CrossRef]
  5. Papoutsakis, S.; Miralles-Cuevas, S.; Gondrexon, N.; Baup, S.; Malato, S.; Pulgarin, C. Coupling between high-frequency ultrasound and solar photo-Fenton at pilot scale for the treatment of organic contaminants: An initial approach. Ultrason. Sonochem. 2015, 22, 527–534. [Google Scholar] [CrossRef]
  6. Basturk, E.; Karatas, M. Advanced oxidation of Reactive Blue 181 solution: A comparison between Fenton and Sono-Fenton Process. Ultrason. Sonochem. 2014, 21, 1881–1885. [Google Scholar] [CrossRef]
  7. Al-Musawi, T.J.; Kamani, H.; Bazrafshan, E.; Panahi, A.H.; Silva, M.F.; Abi, G. Optimization the Effects of Physicochemical Parameters on the Degradation of Cephalexin in Sono-Fenton Reactor by Using Box-Behnken Response Surface Methodology. Catal. Lett. 2019, 149, 1186–1196. [Google Scholar] [CrossRef]
  8. Bremner, D.H.; Molina, R.; Martínez, F.; Melero, J.A.; Segura, Y. Degradation of phenolic aqueous solutions by high frequency sono-Fenton systems (US–Fe2O3/SBA-15–H2O2). Appl. Catal. B Environ. 2009, 90, 380–388. [Google Scholar] [CrossRef]
  9. Huang, R.; Fang, Z.; Yan, X.; Cheng, W. Heterogeneous sono-Fenton catalytic degradation of bisphenol A by Fe3O4 magnetic nanoparticles under neutral condition. Chem. Eng. J. 2012, 197, 242–249. [Google Scholar] [CrossRef]
  10. Saleh, R.; Taufik, A. Degradation of methylene blue and congo-red dyes using Fenton, photo-Fenton, sono-Fenton, and sonophoto-Fenton methods in the presence of iron(II,III) oxide/zinc oxide/graphene (Fe3O4/ZnO/graphene) composites. Sep. Purif. Technol. 2019, 210, 563–573. [Google Scholar] [CrossRef]
  11. Khataee, A.; Gholami, P.; Vahid, B.; Joo, S.W. Heterogeneous sono-Fenton process using pyrite nanorods prepared by non-thermal plasma for degradation of an anthraquinone dye. Ultrason. Sonochem. 2016, 32, 357–370. [Google Scholar] [CrossRef]
  12. Weng, C.H.; Lin, Y.T.; Yuan, H.M. Rapid decoloration of Reactive Black 5 by an advanced Fenton process in conjunction with ultrasound. Sep. Purif. Technol. 2013, 117, 75–82. [Google Scholar] [CrossRef]
  13. Cai, M.; Su, J.; Lian, G.; Wei, X.; Dong, C.; Zhang, H.; Jin, M.; Wei, Z. Sono-advanced Fenton decolorization of azo dye Orange G: Analysis of synergistic effect and mechanisms. Ultrason. Sonochem. 2016, 31, 193–200. [Google Scholar] [CrossRef] [PubMed]
  14. Chen, F.; Li, Y.; Cai, W.; Zhang, J. Preparation and sono-Fenton performance of 4A-zeolite supported α-Fe2O3. J. Hazard. Mater. 2010, 177, 743–749. [Google Scholar] [CrossRef]
  15. Wang, C.; Shih, Y. Degradation and detoxification of diazinon by sono-Fenton and sono-Fenton-like processes. Sep. Purif. Technol. 2015, 140, 6–12. [Google Scholar] [CrossRef]
  16. Siddique, M.; Farooq, R.; Price, G.J. Synergistic effects of combining ultrasound with the Fenton process in the degradation of Reactive Blue 19. Ultrason. Sonochem. 2014, 21, 1206–1212. [Google Scholar] [CrossRef] [Green Version]
  17. Baştürk, E.; Alver, A. Modeling azo dye removal by sono-fenton processes using response surface methodology and artificial neural network approaches. J. Environ. Manag. 2019, 248, 109300. [Google Scholar] [CrossRef]
  18. Adityosulindro, S.; Barthe, L.; González-Labrada, K.; Jáuregui Haza, U.J.; Delmas, H.; Julcour, C. Sonolysis and sono-Fenton oxidation for removal of ibuprofen in (waste) water. Ultrason. Sonochem. 2017, 39, 889–896. [Google Scholar] [CrossRef] [Green Version]
  19. Villegas-Guzman, P.; Giannakis, S.; Rtimi, S.; Grandjean, D.; Bensimon, M.; de Alencastro, L.F.; Torres-Palma, R.; Pulgarin, C. A green solar photo-Fenton process for the elimination of bacteria and micropollutants in municipal wastewater treatment using mineral iron and natural organic acids. Appl. Catal. B Environ. 2017, 219, 538–549. [Google Scholar] [CrossRef]
  20. Rayaroth, M.P.; Aravind, U.K.; Aravindakumar, C.T. Degradation of pharmaceuticals by ultrasound-based advanced oxidation process. Environ. Chem. Lett. 2016, 14, 259–290. [Google Scholar] [CrossRef]
  21. Brotchie, A.; Grieser, F.; Ashokkumar, M. Effect of power and frequency on bubble-size distributions in acoustic cavitation. Phys. Rev. Lett. 2009, 102, 084302. [Google Scholar] [CrossRef] [PubMed]
  22. Rayaroth, M.P.; Aravind, U.K.; Aravindakumar, C.T. Sonochemical degradation of Coomassie Brilliant Blue: Effect of frequency, power density, pH and various additives. Chemosphere 2015, 119, 848–855. [Google Scholar] [CrossRef] [PubMed]
  23. Merouani, S.; Hamdaoui, O.; Saoudi, F.; Chiha, M. Sonochemical degradation of Rhodamine B in aqueous phase: Effects of additives. Chem. Eng. J. 2010, 158, 550–557. [Google Scholar] [CrossRef]
  24. Jojoa-Sierra, S.D.; Herrero-Albillos, J.; Ormad, M.P.; Serna-Galvis, E.A.; Torres-Palma, R.A.; Mosteo, R. Wüstite as a catalyst source for water remediation: Differentiated antimicrobial activity of by-products, action routes of the process, and transformation of fluoroquinolones. Chem. Eng. J. 2022, 435, 134850. [Google Scholar] [CrossRef]
  25. Liang, J.; Komarov, S.; Hayashi, N.; Kasai, E. Improvement in sonochemical degradation of 4-chlorophenol by combined use of Fenton-like reagents. Ultrason. Sonochem. 2007, 14, 201–207. [Google Scholar] [CrossRef] [PubMed]
  26. Drijvers, D.; Van Langenhove, H.; Beckers, M. Decomposition of phenol and trichloroethylene by the ultrasound/H2O2/CuO process. Water Res. 1999, 33, 1187–1194. [Google Scholar] [CrossRef]
  27. Morosini, V.; Chave, T.; Virot, M.; Moisy, P.; Nikitenko, S.I. Sonochemical water splitting in the presence of powdered metal oxides. Ultrason. Sonochem. 2016, 29, 512–516. [Google Scholar] [CrossRef]
  28. Berberidou, C.; Poulios, I.; Xekoukoulotakis, N.P.; Mantzavinos, D. Sonolytic, photocatalytic and sonophotocatalytic degradation of malachite green in aqueous solutions. Appl. Catal. B Environ. 2007, 74, 63–72. [Google Scholar] [CrossRef]
  29. Giraldo-Aguirre, A.L.; Serna-Galvis, E.A.; Erazo-Erazo, E.D.; Silva-Agredo, J.; Giraldo-Ospina, H.; Flórez-Acosta, O.A.; Torres-Palma, R.A. Removal of β-lactam antibiotics from pharmaceutical wastewaters using photo-Fenton process at near-neutral pH. Environ. Sci. Pollut. Res. 2018, 25, 20293–20303. [Google Scholar] [CrossRef]
  30. Enric Brillas Electro-Fenton, UVA Photoelectro-Fenton and Solar Photoelectro-Fenton Treatments of Organics in Waters Using a Boron-Doped Diamond Anode: A Review. J. Mex. Chem. Soc. 2014, 58, 239–255.
  31. Sun, Y.; Pignatello, J.J. Photochemical Reactions Involved in the Total Mineralization of 2,4-D by Fe3+/H2O2/UV. Environ. Sci. Technol. 1993, 27, 304–310. [Google Scholar] [CrossRef]
  32. Cuerda-Correa, E.M.; Alexandre-Franco, M.F.; Fernández-González, C. Advanced Oxidation Processes for the Removal of Antibiotics from Water. An Overview. Water 2020, 12, 102. [Google Scholar] [CrossRef] [Green Version]
  33. Serna-Galvis, E.A.; Martínez-Mena, Y.L.; Porras, J.; Ávila-Torres, Y.; Silva-Agredo, J.; Torres-Palma, R.A. Understanding the Role of Complexation of Fluoroquinolone and β-Lactam Antibiotics with Iron (III) on the Photodegradation under Solar Light and UVC Light. Water 2021, 13, 2603. [Google Scholar] [CrossRef]
  34. Sciscenko, I.; Arques, A.; Varga, Z.; Bouchonnet, S.; Monfort, O.; Brigante, M.; Mailhot, G. Significant role of iron on the fate and photodegradation of enrofloxacin. Chemosphere 2021, 270, 129791. [Google Scholar] [CrossRef]
  35. Aristilde, L.; Sposito, G. Molecular modeling of metal complexation by a fluoroquinolone antibiotic. Environ. Toxicol. Chem. 2008, 27, 2304–2310. [Google Scholar] [CrossRef]
  36. Efthimiadou, E.K.; Karaliota, A.; Psomas, G. Mononuclear metal complexes of the second-generation quinolone antibacterial agent enrofloxacin: Synthesis, structure, antibacterial activity and interaction with DNA. Polyhedron 2008, 27, 1729–1738. [Google Scholar] [CrossRef]
  37. Albini, A.; Monti, S. Photophysics and photochemistry of fluoroquinolones. Chem. Soc. Rev. 2003, 32, 238. [Google Scholar] [CrossRef]
  38. Sciscenko, I.; Garcia-Ballesteros, S.; Sabater, C.; Castillo, M.A.; Escudero-Oñate, C.; Oller, I.; Arques, A. Monitoring photolysis and (solar photo)-Fenton of enrofloxacin by a methodology involving EEM-PARAFAC and bioassays: Role of pH and water matrix. Sci. Total Environ. 2020, 719, 137331. [Google Scholar] [CrossRef]
  39. Torres, R.; Pétrier, C.; Combet, E.; Moulet, F.; Pulgarin, C. Bisphenol A Mineralization by Integrated Ultrasound-UV-Iron (II) Treatment. Environ. Sci. Technol. 2007, 41, 297–302. [Google Scholar] [CrossRef] [PubMed] [Green Version]
  40. Serna-Galvis, E.A.; Silva-Agredo, J.; Giraldo-Aguirre, A.L.; Torres-Palma, R.A. Sonochemical degradation of the pharmaceutical fluoxetine: Effect of parameters, organic and inorganic additives and combination with a biological system. Sci. Total Environ. 2015, 524–525, 354–360. [Google Scholar] [CrossRef]
  41. Giannakis, S.; Jovic, M.; Gasilova, N.; Pastor Gelabert, M.; Schindelholz, S.; Furbringer, J.-M.M.; Girault, H.; Pulgarin, C. Iohexol degradation in wastewater and urine by UV-based Advanced Oxidation Processes (AOPs): Process modeling and by-products identification. J. Environ. Manag. 2017, 195, 174–185. [Google Scholar] [CrossRef] [PubMed]
  42. Giannakis, S.; Hendaoui, I.; Jovic, M.; Grandjean, D.; De Alencastro, L.F.; Girault, H.; Pulgarin, C. Solar photo-Fenton and UV/H2O2 processes against the antidepressant Venlafaxine in urban wastewaters and human urine. Intermediates formation and biodegradability assessment. Chem. Eng. J. 2017, 308, 492–504. [Google Scholar] [CrossRef] [Green Version]
  43. Wei, X.; Chen, J.; Xie, Q.; Zhang, S.; Li, Y.; Zhang, Y.; Xie, H. Photochemical behavior of antibiotics impacted by complexation effects of concomitant metals: A case for ciprofloxacin and Cu(II). Environ. Sci. Process. Impacts 2015, 17, 1220–1227. [Google Scholar] [CrossRef]
  44. Wang, S.; Wang, Z.; Hao, C.; Peijnenburg, W.J.G.M. DFT/TDDFT insights into effects of dissociation and metal complexation on photochemical behavior of enrofloxacin in water. Environ. Sci. Pollut. Res. 2018, 25, 30609–30616. [Google Scholar] [CrossRef] [PubMed]
  45. Wang, S.; Wang, Z. Elucidating Direct Photolysis Mechanisms of Different Dissociation Species of Norfloxacin in Water and Mg2+ Effects by Quantum Chemical Calculations. Molecules 2017, 22, 1949. [Google Scholar] [CrossRef] [PubMed] [Green Version]
  46. An, T.; Yang, H.; Li, G.; Song, W.; Cooper, W.J.; Nie, X. Kinetics and mechanism of advanced oxidation processes (AOPs) in degradation of ciprofloxacin in water. Appl. Catal. B Environ. 2010, 94, 288–294. [Google Scholar] [CrossRef]
  47. Zhang, X.; Li, R.; Jia, M.; Wang, S.; Huang, Y.; Chen, C. Degradation of ciprofloxacin in aqueous bismuth oxybromide (BiOBr) suspensions under visible light irradiation: A direct hole oxidation pathway. Chem. Eng. J. 2015, 274, 290–297. [Google Scholar] [CrossRef]
  48. Wang, Y.; Shen, C.; Zhang, M.; Zhang, B.; Yu, Y. The electrochemical degradation of ciprofloxacin using a SnO2-Sb/Ti anode : Influencing factors, reaction pathways and energy demand. Chem. Eng. J. 2016, 296, 79–89. [Google Scholar] [CrossRef]
  49. Ji, Y.; Ferronato, C.; Salvador, A.; Yang, X.; Chovelon, J.M. Degradation of ciprofloxacin and sulfamethoxazole by ferrous-activated persulfate: Implications for remediation of groundwater contaminated by antibiotics. Sci. Total Environ. 2014, 472, 800–808. [Google Scholar] [CrossRef]
  50. Mahdi-Ahmed, M.; Chiron, S. Ciprofloxacin oxidation by UV-C activated peroxymonosulfate in wastewater. J. Hazard. Mater. 2014, 265, 41–46. [Google Scholar] [CrossRef]
  51. Paul, T.; Dodd, M.C.; Strathmann, T.J. Photolytic and photocatalytic decomposition of aqueous ciprofloxacin : Transformation products and residual antibacterial activity. Water Res. 2010, 44, 3121–3132. [Google Scholar] [CrossRef]
  52. Andersson, M.I.; MacGowan, A.P. Development of the quinolones. J. Antimicrob. Chemother. 2003, 51 (Suppl. 1), 1–11. [Google Scholar] [CrossRef] [PubMed]
  53. Kimura, T.; Sakamoto, T.; Leveque, J.M.; Sohmiya, H.; Fujita, M.; Ikeda, S.; Ando, T. Standardization of ultrasonic power for sonochemical reaction. Ultrason. Sonochem. 1996, 3, S157–S161. [Google Scholar] [CrossRef]
  54. Martín-Sómer, M.; Moreno-SanSegundo, J.; Álvarez-Fernández, C.; van Grieken, R.; Marugán, J. High-performance low-cost solar collectors for water treatment fabricated with recycled materials, open-source hardware and 3d-printing technologies. Sci. Total Environ. 2021, 784, 147119. [Google Scholar] [CrossRef] [PubMed]
  55. Serna-Galvis, E.A.; Silva-Agredo, J.; Giraldo-Aguirre, A.L.; Flórez-Acosta, O.A.; Torres-Palma, R.A. High frequency ultrasound as a selective advanced oxidation process to remove penicillinic antibiotics and eliminate its antimicrobial activity from water. Ultrason. Sonochem. 2016, 31, 276–283. [Google Scholar] [CrossRef] [PubMed]
  56. Serna-Galvis, E.A.; Cáceres-Peña, A.C.; Torres-Palma, R.A. Elimination of representative fluoroquinolones, penicillins, and cephalosporins by solar photo-Fenton: Degradation routes, primary transformations, degradation improvement by citric acid addition, and antimicrobial activity evolution. Environ. Sci. Pollut. Res. 2020, 27, 41381–41393. [Google Scholar] [CrossRef]
Figure 1. Capability of the ultrasound reactor to produce H2O2 in distilled water at 20 min of sonication. (a) Effect of the ultrasound frequency (V: 250 mL, P: 11.2 W); (b) Effect of ultrasound power (V: 250 mL, f: 375 kHz).
Molecules 28 01113 g001
Figure 2. Heterogeneous sono-Fenton for degrading organic pollutants. (a) Effect of mineral concentration on the MO degradation; (b) Effect of the natural mineral (at 0.20 g L−1) on ACE degradation; (c) Hydrogen peroxide evolution in distilled water in the absence (DW) and presence of the solid iron source (DW + mineral) at 0.20 g L−1. Experimental conditions: f: 375 kHz, P: 34.4 W, [MO]initial = [ACE]initial: 30.6 µmol L−1, pHinitial: 5.6, and V: 250 mL.
Molecules 28 01113 g002
Figure 3. Homogeneous sono-Fenton for degrading MO as the probe compound. (a) Effect of iron (II) ions concentration; (b) Effect of the iron species (II or III, at 1 ppm (mg L−1)). Experimental conditions: f: 375 kHz, P: 34.4 W, [MO]initial: 30.6 µmol L−1, pHinitial: 5.6, and V: 250 mL.
Molecules 28 01113 g003
Figure 4. Treatment of ACE and CIP by the homogeneous sono-Fenton process (a) Degradation of ACE; (b) H2O2 accumulation during the treatment of ACE; (c) Degradation of CIP, (d) Experimental evidence based on the UV-Vis spectrum for the formation of the CIP-Fe3+ complex. Experimental conditions: f: 375 kHz, P: 34.4 W, [ACE]initial: [CIP]initial: 30.6 µmol L−1, [Fe2+]: 1.0 mg L−1, pH initial: 5.6, and V: 250 mL.
Molecules 28 01113 g004
Figure 5. Sequential application of sF and UVC. (a) Evolution of CIP under the action of US followed by UVC irradiation; (b) Evolution of the H2O2 accumulation during the CIP treatment under the action of US followed by UVC irradiation. Experimental conditions: f: 375 kHz, P: 34.4 W, [CIP]initial: 30.6 µmol L−1, [Fe2+]: 1.0 mg L−1 (18.0 µmol L−1), pHinitial: 5.6, V: 250 mL, and UVC: 3.02 × 10¹⁷ photons s−1.
Molecules 28 01113 g005
Figure 6. Evolution of the antimicrobial activity (AA). (a) Evolution of AA associated with CIP under the action of sF (US+ Fe (II)) followed by UVC irradiation; (b) Evolution of AA associated with CIP under the action of the sonochemical process alone. Experimental conditions: f: 375 kHz, P: 34.4 W, [CIP]initial: 30.6 µmol L−1, [Fe2+]: 1.0 mg L−1 (18.0 µmol L−1), pHinitial: 5.6, V: 250 mL, and UVC: 3.02 × 10¹⁷ photons s−1.
Molecules 28 01113 g006
Figure 7. Primary transformation products for CIP under the action of ultrasound process alone. The mass spectra of CIP and its primary transformation products are presented in Figures S5–S8.
Molecules 28 01113 g007
Figure 8. Scheme of the experimental setups. (a) Ultrasound reactor for the sono-Fenton process, in this reactor, frequency and power can be adjusted. (b) Reactor for the photo-treatment.
Molecules 28 01113 g008
Table 1. Comparison of the tested heterogeneous sono-Fenton system with other cases reported in the literature.
Heterogeneous Iron SourceUltrasound
System
Target
Pollutant
Main ResultsReference
Fe2O3/SBA-15
(0.6 g L−1)
20, 382, 584, and 1142 kHz, with external addition of H2O2
(1.19 g L−1)
PhenolHighest elimination of aromatic compounds and mineralization at 584 kHz due to its highest acoustic power and elevated production of degrading radicals.
Iron ions are leached from the solid catalyst.
[8]
ZSM-5 zeolite containing iron
(0.1 mmol L−1 of iron)
850 kHz, with the external addition of H2O2
(5.0 mmol L−1)
Orange IIThe degradation of Orange II induced by the sono-Fenton system was very similar to that obtained under the combination of ultrasound with hydrogen peroxide.[2]
4A-zeolite supported α-Fe2O3
(0.5 g L−1)
40 kHzOrange IIThe removal of the pollutant is related to adsorption on the catalyst, heterogeneous, and homogeneous (iron dissolved into the solution) Fenton reaction.[14]
Zero valent iron-ZVI
(0.5 g L−1)
28 kHz, without and with external addition of H2O2
(30–100 µmol L−1)
Orange GUltrasound promotes the leaching of iron ions, which enhances the dye degradation regarding ultrasound alone or adsorption on the ZVI. Moreover, the external addition of H2O2 increases the degradation and mineralization. However, an excess of H2O2 induces scavenging effects. [13]
Zero valent iron-ZVI
(1.0 g L−1)
60 kHz, with the external addition of H2O2
(10.3 mmol L−1)
Reactive Black 5Synergistic effects for the dye degradation by the ZVI/H2O2/ultrasound combination.
Hydrogen peroxide produced from sonolysis in contact with Fe (II), coming from ZVI corrosion, triggers the Fenton reaction.
[12]
Pyrite nanorods
(0.6 g L−1)
40 kHz, with the external addition of H2O2
(1.0 mmol L−1)
Reactive Blue 69The sono-elimination of the target dye is significantly improved by the addition of pyrite nanorods and H2O2, reporting synergy for the combination of ultrasound with pyrite and hydrogen peroxide. Synergy is explained considering that ultrasound waves increase the turbulence and mass transfer and also promote particle disaggregation by augmenting the active sites on the catalyst surface. In turn, the crevices of the solid particles act as cavitation nuclei. [11]
Fe3O4/ZnO/graphene composites40 kHz is added to a Fenton processMethylene blue and Congo-redThe addition of ultrasound irradiation to the Fenton process improves the degradation of both dyes.[10]
Fe3O4 magnetic nanoparticles
(0.585 g L−1)
40 kHz, with the external addition of H2O2
(160 mmol L−1)
Bisphenol-ANo adsorption of the pollutant on the catalyst. The decomposition of H2O2 into radicals promoted by ultrasound plus disaggregation of particles favors the Fenton reaction, leading to synergistic effects on the degradation of bisphenol-A. [9]
Natural mineral containing iron oxides, mainly hematite (Fe2O3)
(0.20 g L−1)
375 kHzMO and ACEDegradation of the pollutants by sono-Fenton was very close to that obtained by ultrasound aloneThis work
Table 2. Comparison of the tested homogeneous sono-Fenton system with other cases reported in the literature.
Homogeneous
Iron Source
Ultrasound
System
Target
Pollutant
Main ResultsReference
Fe2+
(10 mg L−1)
35 and 53 kHz, with the external addition of H2O2
(50 mg L−1)
Reactive Blue 181The sono-Fenton process has superior performance compared to the Fenton system in terms of degrading the target pollutant because of the production of some oxidizing agents as a result of sonication.[6]
Fe2+
(3.0 mg L−1)
20 kHz, with the external addition of H2O2
(0.5 mmol L−1)
Reactive Blue 19The combination of ultrasound with Fe2+ and H2O2 leads to a higher degradation of the dye than the individual components (even more than the Fenton system) of the sono-Fenton process. [16]
Fe2+
(0.134 mmol L−1)
20 kHz, with the external addition of H2O2
(6.4 mmol L−1)
IbuprofenThe addition of Fe2+ and H2O2 to the ultrasound reactor increases both the degradation and mineralization of the pharmaceutical.[18]
Fe2+
(Different concentrations)
850 kHz, without and with the external addition of H2O2
(Diverse concentrations)
Orange IIAcceleration of the pollutant degradation by adding Fe2+, taking advantage of the sono-generated H2O2. The external addition of both Fe2+ and H2O2 lead to the best dye degradation. However, an excess of Fe2+ and H2O2 leads to scavenging effects.[2]
Fe2+
(0.1 mmol L−1)
300 kHzBisphenol-AThe degradation and mineralization of bisphenol-A are enhanced by the presence of ferrous ions due to the Fenton reaction using the H2O2 coming from the sonochemical system.[39]
Fe2+
(90 µmol L−1)
600 kHzFluoxetineThe degradation of fluoxetine is enhanced by the presence of ferrous ions that react with the sonogenerated H2O2.[40]
Fe2+
(90 µmol L−1)
375 kHzAmpicillinThe degradation and mineralization of ampicillin are enhanced by the presence of ferrous ions due to the Fenton reaction using the H2O2 coming from the sonochemical system.[3]
Fe2+ (1.0, 3.0, and 5.0 mg L−1) and Fe3+ (1.0 mg L−1)375 kHzMO, ACE, and CIPAcceleration of the MO and ACE degradation by adding Fe2+ by taking advantage of the sono-generated H2O2. However, an excess of Fe2+ leads to scavenging effects. Ferrous ions are more efficient than Ferric ions at accelerating the degradation of pollutants. Furthermore, CIP is complexed by Fe3+, limiting the performance of the sono-Fenton process. This work
Table 3. Chromatographic conditions for analyses of CIP and ACE.
PharmaceuticalAcetonitrile/Formic Acid
(%/%)
Detection Wavelength
(nm)
Flow
(mL min−1)
Ciprofloxacin
(CIP)
15/852781.0
Acetaminophen
(ACE)
15/852430.6
Disclaimer/Publisher’s Note: The statements, opinions and data contained in all publications are solely those of the individual author(s) and contributor(s) and not of MDPI and/or the editor(s). MDPI and/or the editor(s) disclaim responsibility for any injury to people or property resulting from any ideas, methods, instructions or products referred to in the content.

