
Physicochemical Properties of Plasma-Activated Water and Its Control Effects on the Quality of Strawberries


1
School of Food Science and Engineering, South China University of Technology, Guangzhou 510641, China
2
Academy of Contemporary Food Engineering, South China University of Technology, Guangzhou Higher Education Mega Centre, Guangzhou 510006, China
3
Shanwei Cathay Group, Shanwei 516601, China
*
Author to whom correspondence should be addressed.
Molecules 2023, 28(6), 2677; https://doi.org/10.3390/molecules28062677
Submission received: 1 March 2023
/
Revised: 13 March 2023
/
Accepted: 14 March 2023
/
Published: 16 March 2023
(This article belongs to the Special Issue Food Chemistry in Asia)
Abstract
:In this study, the effects of plasma-activated water (PAW), generated by dielectric barrier discharge cold plasma at the gas–liquid interface, on the quality of fresh strawberries during storage were investigated. The results showed that, with the prolongation of plasma treatment time, the pH of PAW declined dramatically and the electrical conductivity increased significantly. The active components, including NO2−, NO3−, H2O2, and O2−, accumulated gradually in PAW, whereas the concentration of O2− decreased gradually with the treatment time after 2 min. No significant changes were found in pH, firmness, color, total soluble solids, malondialdehyde, vitamin C, or antioxidant activity in the PAW-treated strawberries (p > 0.05). Furthermore, the PAW treatment delayed the quality deterioration of strawberries and extended their shelf life. Principal component analysis and hierarchical cluster analysis showed that the PAW 2 treatment group demonstrated the best prolonged freshness effect, with the highest firmness, total soluble solids, vitamin C, and DPPH radical scavenging activity, and the lowest malondialdehyde and ∆E* values, after 4 days of storage. It was concluded that PAW showed great potential for maintaining the quality of fresh fruits and extending their shelf life.
1. Introduction
Over the last few decades, physical techniques have shown great potential for preserving strawberries. These include refrigeration [1,2], irradiation [3], and preheating treatments [4]. However, these technologies have negative influences on the internal and external quality parameters of strawberries, causing serious nutritional loss and even loss in commercial value. Cold plasma technology, as a new and efficient nonthermal processing technology, has gained attention in the field of food preservation. Cold plasma technology makes use of charged, highly reactive gas molecules and substances at ambient temperatures to rapidly act on contaminated microorganisms on food surfaces [5]. It is particularly beneficial for the treatment of heat-sensitive products and the sterilization of internally-packaged foods. Due to the high reactivity of active particles in plasma, they can interact with nearly all cellular components and play a significant role in food quality maintenance [6].
Cold plasma generators suitable for use in food storage and safety can generally be subdivided into atmospheric pressure plasma jet (APPJ) generators and dielectric barrier discharge (DBD) generators. APPJs have their own structural characteristics which can lead to different sterilization effects different distances from the nozzle [7]. As for DBD cold plasma, the entire agricultural product is placed within the plasma discharge region, leading to coverage of all external surfaces. The irregular shape and relative dielectric constant of the product itself can influence the uniform electric field in the reactor where it is placed, resulting in an uneven electric field intensity on the surface of the product [8]. Therefore, the direct action of cold plasma on the surface of food materials usually causes physical damage and limits the application of plasma technology to fresh fruits and vegetables. In recent years, functionalized water, such as plasma-activated water (PAW), as an intermediate medium, was developed to eliminate the limitations of direct cold plasma treatment [9]. Ordinary sterile or distilled water treated by a plasma device is known as PAW. PAW produces numerous short-lived actives, such as ∙OH, 1O2, and O2−, as well as long-lived actives, such as H2O2, O3, and NO3− [10]. This gives PAW the advantage of broad-spectrum efficient sterilization [11,12]. The inactivation of PAW is the result of a combination of high oxidation type and low pH [13,14]. The homogeneity of the solution and the good fluidity of the liquid can compensate for the inhomogeneity of direct treatment by cold plasma. In addition, these active substances are unstable and can break down quickly. Therefore, no hazardous compounds remain on the surface of agricultural products treated with PAW [15]. As such, PAW has been recognized as having great potential applications in food quality and safety maintenance.
PAW has been confirmed to be effective in microbial inactivation [16,17], seed germination and growth [18,19], meat curing [20], pesticide residue degradation [21,22], and food preservation. PAW has been successfully used to extend the shelf life of fruits, including pears [23], kumquats [24], apples [25], and kiwis [26]. Relatively little information is available, however, on the physicochemical properties of PAW generated by DBD plasma devices and its applications in strawberry preservation.
Therefore, in this study, an atmospheric pressure DBD cold plasma system was used to prepare PAW with a large number of active substances at the gas–liquid interface. The variations of reactive oxygen species (ROS) and reactive nitrogen species (RNS) in PAW, with different treatment times, were investigated. The effects of PAW treatment on the quality of strawberries—in terms of pH, firmness, color, total soluble solids (TSS) content, malondialdehyde (MDA) content, vitamin C (VC) content, and antioxidant activity—were also investigated and reported herein. The study aimed to determine the efficacy of PAW technology for strawberry preservation.
2. Results and Discussion
2.1. pH and Electrical Conductivity Changes of PAW
As shown in Figure 1a, the pH of PAW decreased as the treatment time increased. Compared with PAW 0, the pH of PAW 1 was significantly decreased, which was caused by the ionization of water producing H+ and acidic substances, such as nitrous acid and nitric acid [27]. After 1 min of plasma treatment, the pH of the PAWs tended to decrease more gently, with minimal variation between PAW 5 and PAW 1. The PAW solutions were somewhat stable.
Electrical conductivity is a measure of a substance’s ability to transmit electrical current, and the presence of foreign particles in water greatly affects conductivity. Figure 1b shows the conductivity variation of PAWs. Within 5 min, the conductivity of the PAW drastically increased. The primary reason for this significant increase was that a large number of active substances such as ROS and RNS (which are generated in the process of ionizing air dissolving in water) were formed [28].
2.2. NO2− and NO3− Concentration Changes of PAW
The detection of NO2− and NO3− in PAW is the primary indication for the formation of RNS. Their antibacterial activities have attracted considerable interest [29,30]. The changes of NO2− and NO3− concentrations in PAW are shown in Figure 2a,b. With the increase of plasma activation time, the concentration of NO2− steadily increased, which was mainly due to the reaction of RNS substances such as NO, NO2, etc., generated by ionized air dissolved in water with OH− and H2O. NO2− can inhibit bacteria and protect color, and has a significant inhibitory effect on both Listeria monocytogenes and Clostridium botulinum [31]. Additionally, the concentration of NO3− in PAW also rose gradually, showing similar changing rules as were observed with respect to NO2−. Shen et al. [32] showed that NO3− was a secondary product in PAW, mainly from the reaction of NO2 and NO2− with OH− and H2O2 produced by the ionized gas. It has been proven that NO3− expands the bacteriostatic activity of PAW to a certain extent and positively contributes to the sterilization effect in synergy with NO2− [33].
2.3. H2O2 and O2− Concentration Changes of PAW
H2O2 and O2− are the main ROS in PAW and play an important role in antibacterial activity. The concentration changes of H2O2 and O2− are shown in Figure 2c,d. The concentration of H2O2 increased significantly with the extension of treatment time, to 5372.69 μmol/L at 5 min, which was about 110 times higher than at 1 min. In contrast to the variable rule of H2O2 concentration, O2− concentration showed a trend of rapid increase followed by a rapid decline. After 2 min treatment, O2− concentration reached the highest value of 33,727.93 μmol/L and then dropped sharply to 4054.05 μmol/L after 5 min treatment. Although O2− has considerable oxidative activity, it causes less intracellular damage, as it is thought to be unable to penetrate the cell membrane [34]. However, O2− can be converted to hydrogen peroxide radicals (HOO∙) in PAW (), which can damage intracellular components by penetrating the cell membrane.
As shown in Figure 1a, when the treatment time was 3 min, the pH of the PAW dropped to below 4.8 (the acid hydrolysis constant (pKa) of the reaction is 4.8) and a large amount of O2− was converted into HOO∙ [35]. In addition, excessive H+ in the solution led to the conversion of a large amount of O2− into H2O2 [36]. The above two reactions could satisfactorily explain the reason for the sharp decline of O2− after the treatment time reached 3 min.
2.4. Visual Assessment of Strawberry during Storage
As shown in Figure 3b, fresh strawberries without any treatment (control group) showed signs of surface spoilage on day 2 of storage at 20 °C After 4 days of storage, a substantial number of grey fungi appeared and the strawberries completely lost their edibility. Almost no visible spoilage was detected on the strawberries treated with PAW, particularly in the PAW 3 and PAW 2 treatment groups, and the strawberries still had good cosmetic qualities up to day 6, indicating that PAW inhibited the growth of fungi, in addition to bacteria. During the 6-day storage period, there were no discernible differences in visual preservation between PAW 2 and PAW 3.
2.5. Strawberry Quality Changes
Table 1 illustrates the effects of PAW treatment on the hardness and color of the strawberries. After 3 min treatment, the surface hardness, L*, a*, and b* of strawberries did not differ significantly from the fresh group (p > 0.05). In addition, when ∆E* > 3, it indicated that the color difference could be perceived; when ∆E* < 3, the color difference was not obvious [37]. In addition, pH value, an important parameter for sensory evaluation, was not significantly different between PAW 2 and PAW 3 groups, as compared to the fresh group (p > 0.05). On the other hand, the TSS, VC, and antioxidant capacity of the strawberries are essential markers for determining the nutritional quality of strawberries. As shown in Table 2, the TSS and VC content of the PAW-treated groups were not significantly different from the untreated groups (p > 0.05), indicating that PAW treatment did not affect TSS and VC content. Furthermore, the antioxidant capacity of treated strawberries was comprehensively evaluated by measuring DPPH radical scavenging activity and total antioxidant capacity. Table 2 shows that there was no significant difference among the treatment group (p > 0.05), indicating that PAW treatment did not significantly reduce the antioxidant capacity of strawberries. Therefore, it was concluded that PAW treatment had no significant adverse effects on strawberry quality.
The sensory and nutritional changes between 0 and 4 days of storage are illustrated in Table 1 and Table 2. The hardness of all samples decreased significantly with the increase of storage time (p < 0.05). The hardness was higher in the PAW treatment group compared to the control group, with the PAW 2 treatment group showing the slowest decreasing trend. As expected, the ∆E* value of the control group and PAW 0 reached 9.56 and 11.8. respectively, after 4 days of storage, indicating that the strawberries had lost their commercial value. The degree of color reduction after PAW treatment was much less than that of the control group and PAW 0. Apart from the PAW 1 treatment group, the ∆E* value of the PAW 2 and PAW 3 treatment groups were controlled at 6.21 and 8.08, respectively. In addition, the content of MDA in strawberries increased with the extension of storage time due to the decrease of antioxidant levels in strawberry tissue cells. Based on the above analysis, the overall quality decline rate of the PAW treatment group was lower than that of the untreated group during storage, indicating that PAW treatment had a positive effect on strawberry preservation.
2.6. Optimal Plasma Processing Condition Selection Using Multivariate Analysis Techniques
2.6.1. Hierarchical Cluster Analysis
HCA was used to process the data matrix of each quality index of strawberry before and after treatment. HCA is a multivariate statistics technique that gradually categorizes data based on the similarity of the specified data matrix [38]. The result of the heat map with HCA operation is depicted in Figure 4. Using the color scale as a reference, various color blocks represent distinct values of relevant variables.
As can be seen from Figure 4, HCA divided the results of each processing group into two categories, with C-0, PAW 1-0, PAW 2-0, and PAW 3-0 sorted into one category, which visually indicated that the PAW treatment had no significant adverse effect on fresh strawberries. In contrast, the control and experimental groups, after 4 days of storage, were classified into another category, indicating that the quality of strawberries decreased to varying degrees after 4 days of storage. According to the tree diagram, the three groups of C-4 data and PAW 0-4 data were merged first, and then the three groups of PAW 3-4 data were later integrated into the same cluster. On the other hand, another three groups of PAW 2-4 data and PAW 1-4 data were ordered into another cluster. This indicated that, after 4 days of storage, the strawberry quality indexes of the control group and PAW 0 were similar, which was consistent with the analysis above. The heat map showed that the data from the PAW 3 group were closest to the quality indicators of the control group and PAW 0 samples. However, the current analysis could not directly analyze the difference between PAW 2 and PAW 1, and further analysis was required.
2.6.2. Principal Component Analysis
To better explain and comprehend the quality variation of strawberries throughout storage, PCA analysis was performed on the storage start (0 days) and storage end (4 days) data in Table 1 and Table 2. PCA is a method of unsupervised statistical analysis that allows the raw data matrix to be compressed and downscaled to perform data analysis in a more parsimonious manner [39]. The feasibility of PCA analysis was first validated (KMO = 0.759; Chi-Square = 217.6; p < 0.05) using a correlation coefficient matrix to extract data for each experimental group for days 0 and 4 in Table 1 and Table 2 above, and the data were analyzed using the maximum variance method. Table 3 shows the total variance in PCA analysis. Two principal components with eigenvalues greater than 1 could be extracted, among which the eigenvalue of the first principal component (PC1) was 5.263 and that of the second principal component (PC2) was 1.427, which could interpret 52.631% and 14.272% of the original data, respectively. The remaining principal components (PC4-PC10) were all less than 1 and were excluded from the statistical analysis [40].
Loading variable plot (Figure 5a) showed that PC1 was positively correlated with hardness, L* value, DPPH radical scavenging activity, and total antioxidant capacity, and negatively correlated with MDA content, accounting for 52.63% of the total variance, while PC2 was positively correlated with TSS, explaining 14.27% of the total variance. PC1 and PC2 together explained 66.90% of the total variance. As shown in Figure 5b, the principal component score plots for the different experimental groups were compared after 0 and 4 days of storage. To get a clear view of the changes in the quality of strawberries in each treatment group during the storage period, Figure 5b was decomposed into five separate principal component score plots, corresponding to five treatments (Figure 5c–g). After 4 days of storage, PAW 2 (Figure 5f) showed minimal migration on PC1 and PC2 after storage (ΔPC1 = 0.78, ΔPC2 = 0.15), confirming the excellent preservation effect exerted by PAW2.
In the absence of significant effects of the above PAW treatments on strawberry quality, the migrations of PC1 and PC2 in each treatment group after storage were much lower than that of the experimental group with controls, indicating that PAW treatment had a maintenance effect on the freshness of strawberries. This also indicated that the PAW treatment had no significant adverse effects on the strawberry quality. PAW treatment had a certain delaying effect on the declining quality of strawberries, and the PAW 2 treatment in this study led to the best preservation effect. Under this treatment, the concentrations of the main oxidation active substances, including NO2−, NO3−, H2O2, and O2−, in the PAW 2 treatment group reached 0.397 mg/L, 35.612 mg/L, 1323.13 μmol/L, and 33,727.93 μmol/L, respectively. Among them, O2− concentration was the highest in the treatment groups. O2− can inhibit the activity of enzymes in the strawberry metabolism process and reduce the production of ethylene (which has a ripening effect in strawberries), allowing for optimal strawberry preservation.
3. Material and Methods
3.1. Materials and Chemicals
Fresh milk strawberries were purchased from Dandong, Liaoning province, and stored in a refrigerator at 4 °C in the laboratory. Trichloroacetic acid, thiobarbiturate acid, 1,1-diphenyl-2-trinitrophenylhydrazine, anhydrous ethanol, sodium dihydrogen phosphate, disodium hydrogen phosphate, p-aminobenzene sulfonamide, sodium nitrite, N-1-Naphthylethylenediamine Dihydrochloride, concentrated hydrochloric acid, sulfamic acid, and sodium nitrate were purchased from Aladdin Industries (Shanghai, China). The hydrogen peroxide detection kit and superoxide anion free radical detection kit were acquired from Shanghai Yuanye Biotechnology Co., Ltd. (Shanghai, China). The total antioxidant capacity detection kit was provided by Biyuntian Biotechnology Co., Ltd. (Shanghai, China), and the VC test strip was purchased from Merck (Darmstadt, Germany).
3.2. Plasma Device and Preparation of PAW
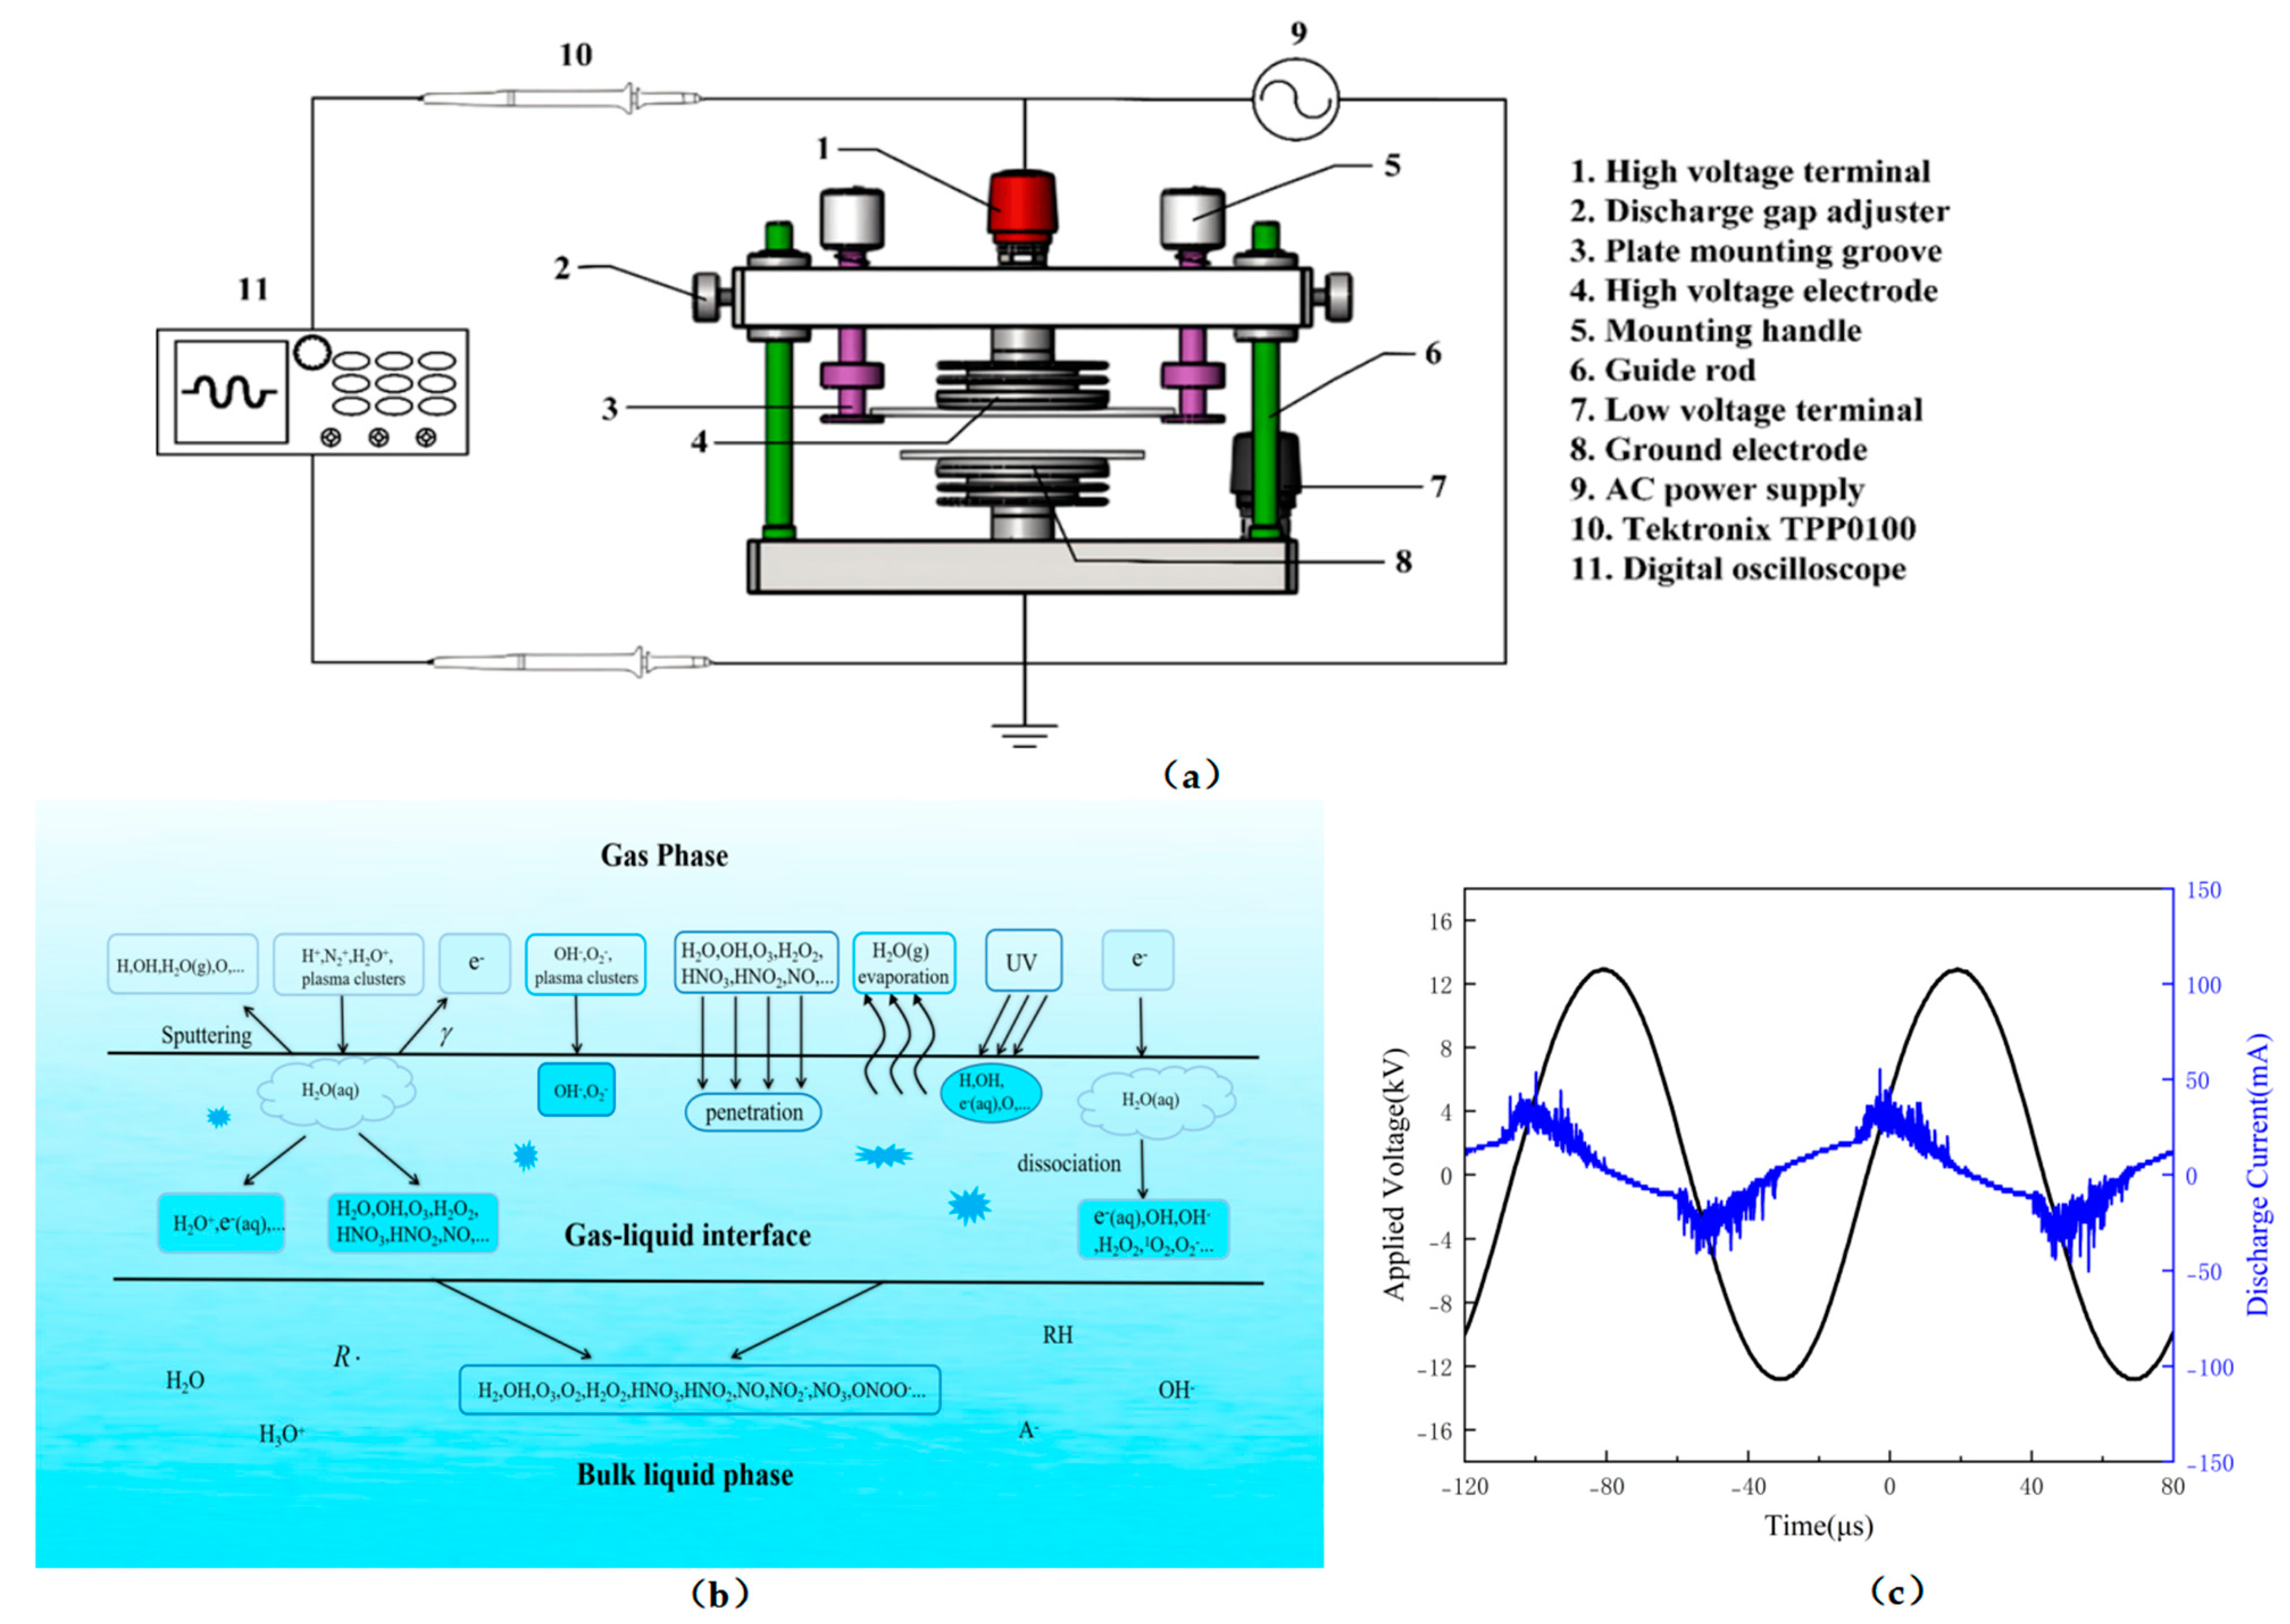
The atmospheric pressure DBD cold plasma system is shown in Figure 6a. The DBD plasma system configuration used in this study consisted of a DBD plasma reactor, a high-frequency AC power supply (CTP-2000 K, Nanjing Suman Electronics Co., Ltd., Nanjing, China), and an oscilloscope (TBS1107, Tektronix Inc., Beaverton, OR, USA, bandwidth 1 GHz). The plasma reactor was composed of two circular high-voltage and low-voltage steel electrodes with diameters of 50 mm and a circular upper quartz glass dielectric barrier with a diameter of 102 mm and a thickness of 1 mm. Figure 6b shows the chemical reaction generated by DBD plasma at the gas–liquid interface. In this study, the power supply was able to provide a sinusoidal wave output with an operating input voltage of 50 V and an input current of 1 A. Figure 6c shows the typical discharge voltage and current waveforms.
In this case, PAW was prepared by generating plasma on the water surface using atmospheric pressure air as the working supply gas at room temperature. The distance between the quartz plate and the water surface was 3 mm. Deionized water was activated by plasma for 0, 1, 2, 3, 4, and 5 min to prepare 10 mL of PAW, respectively. To make it easy to understand and define, PAW 1, PAW 2, PAW 3, PAW 4, and PAW 5 were denoted as referring to PAW after 1, 2, 3, 4, and 5 min of plasma activation, respectively. Additionally, PAW 0 was used to refer to water without plasma activation.
3.3. Pretreatment of Strawberries
Strawberries—with basically the same color and appearance, without external mechanical damage, complete, and undecomposed—were selected for the study by means of a colorimeter. The strawberries were placed in a cool and dry place after leaf removal and weighing. The strawberries were randomly divided into 5 groups, with 12 strawberries in each group. For the control group, strawberries were not subjected to any soaking treatment. For the other 4 treatment groups, the strawberries were immersed in PAW 0, PAW 1, PAW 2, and PAW 3 (duration time of 20 min), respectively. After pretreatment, the strawberries were moved to an incubator with a constant temperature and humidity (temperature: 20 ± 2 °C, relative humidity: 70 ± 5%) for 6 days. The strawberries were photographed and the quality indexes of strawberries were measured every 2 days.
3.4. Measurement of Physicochemical Properties of PAW
Both pH and conductivity were measured immediately after different plasma activation times for deionized water. The pH was measured at 25 ± 1 °C with a pH meter (Mettler-Toledo, Greisensee, Switzerland). The electrical conductivity was determined by a conductivity meter (DDS-307, Leici, Shanghai, China). The concentration of H2O2 in PAW was quantified by a hydrogen peroxide assay kit [41]. Similarly, the concentration of superoxide anion (O2−) in PAW was measured by a superoxide anion radical assay kit. The level of NO3− and NO2− in PAW were measured by the spectrophotometric method, as described by [32].
3.5. Quality Analysis of Strawberry
3.5.1. pH Measurement
Using a knife, a strawberry sample that weighed 15 g was taken. The juice was extracted from the sample and ground in a self-sealing bag. After the pH meter was calibrated, the electrode was submerged in the sample solution, and the data was recorded after the reading had stabilized. Each measurement was repeated three times for each sample and the average value was taken as the pH value of the sample solution. The method was based on that of [14], with appropriate modifications. Samples of strawberries were taken and the hardness of the pulp at each location was determined by a texture analyzer (TA.XTplusC, Stable Micro System, London, UK) at three equally-spaced locations around the equatorial part of the strawberries.
3.5.2. Firmness
The method was based on that of [14], with appropriate modifications. Samples of strawberries were taken and the hardness of the pulp at each location was determined by a texture analyzer (TA.XTplusC, Stable Micro System, London, UK) at three equally-spaced locations around the equatorial part of the strawberries.
3.5.3. Color Quality
The color of the strawberries was characterized by a colorimeter (CR-400, Konica Minolta Inc., Tokyo, Japan) at room temperature, and the chroma value was expressed by the CIE system. For calibration, a standard whiteboard (L* = 95.35, a* = 0.01, b* = 2.30) was used before the measurements. The color value was expressed as L* (+brightness, −darkness), a* (+red, −green), and b* (+yellow, −blue). Total color difference ∆E reflected the total color difference of the sample, calculated by the following formula [42]:
where L0*, a0*, and b0* are chromaticity values of the untreated group, and L*, a*, and b* are chromaticity values of the treated group.
3.5.4. Total Soluble Solids
The TSS levels of the strawberries were evaluated using a handheld Brix meter (Atago, Co., Ltd., Tokyo, Japan) at room temperature. A drop of juice obtained from a strawberry sample was placed on the handheld Brix meter to measure the soluble solids content. Before each measurement, a zero calibration was performed with deionized water, and the measurement was repeated three times for each sample.
3.6. Malondialdehyde
Strawberry samples (1 g) were homogenized with 5 mL of trichloroacetic acid (100 g/L). The homogenate was centrifuged at 10,000 rpm for 10 min at 4 °C. Subsequently, 2 mL of the supernatant was taken, and 2 mL of thiobarbituric acid (0.67%, w/v) was added to the supernatant. The mixed solution was heated in distilled water at 100 °C for 20 min, then removed and cooled. The supernatant was taken and its absorbance was recorded at 450, 532, and 600 nm [14]. The MDA content was calculated based on the following equation:
3.7. Vitamin C Content
1 mL of freshly squeezed strawberry juice was diluted to 5 mL and the VC content of the strawberry juice was measured using an RQflex20 reflectometer. The VC test strip was immersed in the diluted sample solution for 5 s, then taken out and shaken off the surface. The test strip was inserted into the reflectometer and the VC content (mg/L) was read directly. The VC content was calculated based on the following equation:
where C0 is the VC content (mg/L) of the test strip and N is the sample dilution.
3.8. Determination of Antioxidant Activities
3.8.1. Total Antioxidant Capacity
The total antioxidant capacity of strawberries was assessed using the total antioxidant capacity (ABTS) kit. ABTS working solution (200 μL) was added to each 96-well enzyme labeled plate. Then, 10 μL of deionized water was added to the control well, and 10 μL of sample solution was added to the sample well. Next, 10 μL of Trolox series standard solution (0.15, 0.3, 0.6, 0.9, 1.2, and 1.5 mM) was added to the standard well, followed by incubation for 2–6 min at room temperature and measurement of A414 using an enzyme marker (Synergy2, BioTek, model S, Winooski, VT, USA). The standard curve was plotted using the Trolox series standard solution as the horizontal coordinate and the absorbance value as the vertical coordinate to obtain the regression equation. The absorption value of the sample was substituted into the regression equation to obtain the total antioxidant capacity of the sample, which was calculated by the following formula:
where C0 is the total antioxidant capacity (mmol/L) derived from the absorbance in the sample to be measured on the standard curve and N is the sample dilution.
3.8.2. DPPH Radical Scavenging Activity
The DPPH radical scavenging activity of strawberries was determined according to the method in [43], with appropriate modification. Briefly, 1 mL of freshly squeezed strawberry juice was taken in a sterile tube and an appropriate amount of deionized water (4 mL) was added as the sample solution. Standard tubes, assay tubes, and control tubes were set, and then 1 mL of ethanol and 3 mL of DPPH solution were added to the standard tube. In the assay tube, 1 mL of the sample solution and 3 mL of the DPPH solution were combined. Then, 1 mL of the sample solution and 3 mL of ethanol were incorporated into the control tube. The three sets of tubes were protected from light for 30 min, after which the absorbance values of the standard, control, and assay tubes were determined using a UV spectrophotometer at room temperature (25 °C) at the UV absorption peak of 517 nm. These were recorded as A0, A1, and A2, correspondingly. The DPPH radical scavenging activity was calculated using the following equation:
3.9. Statistical Analysis
OriginLab 8.0 software (OriginLab Inc., Northampton, MA, USA) and SPSS software (version 20.0, IBM, Chicago, IL, USA) was adopted to perform statistical analysis. Statistical differences were determined using one-way or multifactorial analysis of variance (ANOVA) followed by the post hoc Turkey test. Additionally, the differences were further determined by the least significant difference test at p < 0.05 level. Each experiment was repeated in triplicate and the results were presented as mean values ± standard deviation. Multivariate data analyses, including principal component analysis (PCA) and hierarchical cluster analysis (HCA), were performed using SPSS.
4. Conclusions
The PAW prepared using DBD cold plasma treatment for 2 min was the most suitable for the preservation of strawberries. The physicochemical properties of PAW were related to PAW treatment time. The PAW treatment did not significantly damage the quality of the strawberries themselves. On the contrary, PAW treatment was able to delay the quality deterioration of strawberries during the storage period. Multivariate data analyses, including PCA and HCA, showed that the PAW 2 treatment had the best quality indicators after 4 days of storage, among which hardness, L* value, and antioxidant activities were the most significant. It was therefore concluded that PAW proved, in this work, to be a promising nonthermal technology for use in the maintenance of the quality of strawberries, as well as the extension of their shelf life. In the future, a more comprehensive understanding of the generation and reaction of short-lived ROS will be needed to elucidate the oxidation mechanism of the PAW method.
Author Contributions
X.Y.: methodology, data curation, formal analysis, writing—original draft. C.Z.: methodology, writing—review and editing. Q.L.: methodology, writing—review and editing. J.-H.C.: conceptualization, methodology, data curation, writing—review and editing, supervision. All authors have read and agreed to the published version of the manuscript.
Funding
The authors are grateful to the National Natural Science Foundation of China (32272466) for its support. This research was also supported by the Key R&D Program of Shanwei (2022A008), Guangdong Basic and Applied Basic Research Foundation (2021A1515010644, 2021A1515110396), and Guangzhou Basic and Applied Basic Research Foundation (202201010008).
Institutional Review Board Statement
Not applicable.
Informed Consent Statement
Not applicable.
Data Availability Statement
Not applicable.
Conflicts of Interest
The authors declare no conflict of interest.
Sample Availability
Samples of the compounds are not available from the authors.
References
- Cordenunsi, B.R.; Genovese, M.I.; do Nascimento, J.R.O.; Hassimotto, N.M.A.; dos Santos, R.J.; Lajolo, F.M. Effects of temperature on the chemical composition and antioxidant activity of three strawberry cultivars. Food Chem. 2005, 91, 113–121. [Google Scholar] [CrossRef]
- Sahari, M.A.; Boostani, F.M.; Hamidi, E.Z. Effect of low temperature on the ascorbic acid content and quality characteristics of frozen strawberry. Food Chem. 2004, 86, 357–363. [Google Scholar] [CrossRef]
- Maraei, R.W.; Elsawy, K.M. Chemical quality and nutrient composition of strawberry fruits treated by γ-irradiation. J. Hazard. Mater. 2017, 10, 80–87. [Google Scholar] [CrossRef] [Green Version]
- Teribia, N.; Buvé, C.; Bonerz, D.; Aschoff, J.; Hendrickx, M.; Van Loey, A. Impact of processing and storage conditions on color stability of strawberry puree: The role of PPO reactions revisited. J. Food Eng. 2021, 294, 110402. [Google Scholar] [CrossRef]
- Niemira, B.A. Cold Plasma Decontamination of Foods. Annu. Rev. Food Sci. Technol. 2012, 3, 125–142. [Google Scholar] [CrossRef]
- Mir, S.A.; Shah, M.A.; Mir, M.M. Understanding the role of plasma technology in food industry. Food Bioprocess Technol. 2016, 9, 734–750. [Google Scholar] [CrossRef]
- Kolb, J.F.; Mattson, A.M.; Edelblute, C.M.; Hao, X.L.; Malik, M.A.; Heller, L.C. Cold DC-operated air plasma jet for the inactivation of infectious microorganisms. IEEE Trans. Plasma Sci. 2012, 40, 3007–3026. [Google Scholar] [CrossRef]
- Butscher, D.; Zimmermann, D.; Schuppler, M.; von Rohr, P.R. Plasma inactivation of bacterial endospores on wheat grains and polymeric model substrates in a dielectric barrier discharge. Food Control 2016, 60, 636–645. [Google Scholar] [CrossRef]
- Xiang, Q.; Fan, L.; Li, Y.; Dong, S.; Li, K.; Bai, Y. A review on recent advances in plasma-activated water for food safety: Current applications and future trends. Crit. Rev. Food Sci. Nutr. 2022, 62, 2250–2268. [Google Scholar] [CrossRef]
- Zhang, Z.; Xu, Z.; Cheng, C.; Wei, J.; Lan, Y.; Ni, G.; Sun, Q.; Qian, S.; Zhang, H.; Xia, W.; et al. Bactericidal effects of plasma induced reactive species in dielectric barrier gas-liquid discharge. Plasma Chem. Plasma Process. 2017, 37, 415–431. [Google Scholar] [CrossRef]
- Kelar Tucekova, Z.; Vacek, L.; Krumpolec, R.; Kelar, J.; Zemanek, M.; Cernak, M.; Ruzicka, F. Multi-hollow surface dielectric barrier discharge for bacterial biofilm decontamination. Molecules 2021, 26, 910. [Google Scholar] [CrossRef] [PubMed]
- Qi, Z.; Tian, E.; Song, Y.; Sosnin, E.A.; Skakun, V.S.; Li, T.; Xia, Y.; Zhao, Y.; Lin, X.; Liu, D. Inactivation of shewanella putrefaciens by plasma activated water. Plasma Chem. Plasma Process. 2018, 38, 1035–1050. [Google Scholar] [CrossRef]
- Tian, Y.; Ma, R.; Zhang, Q.; Feng, H.; Liang, Y.; Zhang, J.; Fang, J. Assessment of the physicochemical properties and biological effects of water activated by non-thermal plasma above and beneath the water surface. Plasma Process. Polym. 2015, 12, 439–449. [Google Scholar] [CrossRef]
- Ma, R.; Wang, G.; Tian, Y.; Wang, K.; Zhang, J.; Fang, J. Non-thermal plasma-activated water inactivation of food-borne pathogen on fresh produce. J. Hazard. Mater. 2015, 300, 643–651. [Google Scholar] [CrossRef]
- Adhikari, B.; Adhikari, M.; Ghimire, B.; Park, G.; Choi, E.H. Cold atmospheric plasma-activated water irrigation induces defense hormone and gene expression in tomato seedlings. Sci. Rep. 2019, 9, 16080. [Google Scholar] [CrossRef] [Green Version]
- Guo, L.; Yao, Z.; Yang, L.; Zhang, H.; Qi, Y.; Gou, L.; Xi, W.; Liu, D.; Zhang, L.; Cheng, Y.; et al. Plasma-activated water: An alternative disinfectant for S protein inactivation to prevent SARS-CoV-2 infection. Chem. Eng. J. 2021, 421, 127742. [Google Scholar] [CrossRef]
- Guo, L.; Xu, R.; Gou, L.; Liu, Z.; Zhao, Y.; Liu, D.; Zhang, L.; Chen, H.; Kong, M.G. Mechanism of Virus Inactivation by Cold Atmospheric-Pressure Plasma and Plasma-Activated Water. App. Environ. Microbiol. 2018, 84, e00726-18. [Google Scholar] [CrossRef] [Green Version]
- Guragain, R.P.; Baniya, H.B.; Pradhan, S.P.; Pandey, B.P.; Subedi, D.P. Influence of plasma-activated water (PAW) on the germination of radish, fenugreek, and pea seeds. AIP Adv. 2021, 11, 125304. [Google Scholar] [CrossRef]
- Gao, X.; Zhang, A.; Heroux, P.; Sand, W.; Sun, Z.; Zhan, J.; Wang, C.; Hao, S.; Li, Z.; Li, Z.; et al. Effect of Dielectric Barrier Discharge Cold Plasma on Pea Seed Growth. J. Agric. Food Chem. 2019, 67, 10813–10822. [Google Scholar] [CrossRef]
- Inguglia, E.S.; Oliveira, M.; Burgess, C.M.; Kerry, J.P.; Tiwari, B.K. Plasma-activated water as an alternative nitrite source for the curing of beef jerky: Influence on quality and inactivation of Listeria innocua. Innov. Food Sci. Emerg. Technol. 2020, 59, 102276. [Google Scholar] [CrossRef]
- Ali, M.; Sun, D.-W.; Cheng, J.-H.; Esua, O.J. Effects of combined treatment of plasma activated liquid and ultrasound for degradation of chlorothalonil fungicide residues in tomato. Food Chem. 2022, 371, 131162. [Google Scholar] [CrossRef]
- Sarangapani, C.; Scally, L.; Gulan, M.; Cullen, P.J. Dissipation of pesticide residues on grapes and strawberries using plasma-activated water. Food Bioprocess Technol. 2020, 13, 1728–1741. [Google Scholar] [CrossRef]
- Chen, C.; Liu, C.; Jiang, A.; Guan, Q.; Sun, X.; Liu, S.; Hao, K.; Hu, W. The effects of cold plasma-activated water treatment on the microbial growth and antioxidant properties of fresh-cut pears. Food Bioprocess Technol. 2019, 12, 1842–1851. [Google Scholar] [CrossRef]
- Guo, J.; Qin, D.; Li, W.; Wu, F.; Li, L.; Liu, X. Inactivation of Penicillium italicum on kumquat via plasma-activated water and its effects on quality attributes. Int. J. Food Microbiol. 2021, 343, 109090. [Google Scholar] [CrossRef] [PubMed]
- Liu, C.; Chen, C.; Jiang, A.; Sun, X.; Guan, Q.; Hu, W. Effects of plasma-activated water on microbial growth and storage quality of fresh-cut apple. Innov. Food Sci. Emerg. Technol. 2020, 59, 102276. [Google Scholar] [CrossRef]
- Zhao, Y.; Chen, R.; Liu, D.; Wang, W.; Niu, J.; Xia, Y.; Qi, Z.; Zhao, Z.; Song, Y. Effect of nonthermal plasma-activated water on quality and antioxidant activity of fresh-cut kiwifruit. IEEE Trans. Plasma Sci. 2019, 47, 4811–4817. [Google Scholar] [CrossRef]
- Bruggeman, P.; Leys, C. Non-thermal plasmas in and in contact with liquids. J. Phys. D-Appl. Phys. 2009, 42, 053001. [Google Scholar] [CrossRef]
- Hoeben, W.F.L.M.; van Ooij, P.P.; Schram, D.C.; Huiskamp, T.; Pemen, A.J.M.; Lukes, P. On the possibilities of straightforward characterization of plasma activated water. Plasma Chem. Plasma Process. 2019, 39, 597–626. [Google Scholar] [CrossRef] [Green Version]
- Schnabel, U.; Andrasch, M.; Weltmann, K.-D.; Ehlbeck, J. Inactivation of vegetative microorganisms and bacillus atrophaeus endospores by reactive nitrogen species (RNS). Plasma Process. Polym. 2014, 11, 110–116. [Google Scholar] [CrossRef]
- Lukes, P.; Dolezalova, E.; Sisrova, I.; Clupek, M. Aqueous-phase chemistry and bactericidal effects from an air discharge plasma in contact with water: Evidence for the formation of peroxynitrite through a pseudo-second-order post-discharge reaction of H2O2 and HNO2. Plasma Sources Sci. Technol. 2014, 23, 015019. [Google Scholar] [CrossRef]
- Thirumdas, R.; Kothakota, A.; Annapure, U.; Siliveru, K.; Blundell, R.; Gatt, R.; Valdramidis, V.P. Plasma activated water (PAW): Chemistry, physico-chemical properties, applications in food and agriculture. Trends Food Sci. Technol. 2018, 77, 21–31. [Google Scholar] [CrossRef]
- Shen, J.; Tian, Y.; Li, Y.; Ma, R.; Zhang, Q.; Zhang, J.; Fang, J. Bactericidal effects against s-aureus and physicochemical properties of plasma activated water stored at different temperatures. Sci. Rep. 2016, 6, 28505. [Google Scholar] [CrossRef] [Green Version]
- Horsch, A.M.; Sebranek, J.G.; Dickson, J.S.; Niebuhr, S.E.; Larson, E.M.; Lavieri, N.A.; Ruther, B.L.; Wilson, L.A. The effect of pH and nitrite concentration on the antimicrobial impact of celery juice concentrate compared with conventional sodium nitrite on Listeria monocytogenes. Meat Sci. 2014, 96, 400–407. [Google Scholar] [CrossRef] [PubMed]
- Das, K.; Roychoudhury, A. Reactive oxygen species (ROS) and response of antioxidants as ROS-scavengers during environmental stress in plants. Front. Environ. Sci. 2014, 2, 53. [Google Scholar] [CrossRef] [Green Version]
- Zhang, R.; Wang, L.; Wu, Y.; Guan, Z.; Jia, Z. Bacterial decontamination of water by bipolar pulsed discharge in a gas-liquid-solid three-phase discharge reactor. IEEE Trans. Plasma Sci. 2006, 34, 1370–1374. [Google Scholar] [CrossRef]
- Halliwell, B.; Gutteridge, J.M. Free Radicals in Biology and Medicine; Oxford University Press: New York, NY, USA, 2015. [Google Scholar]
- Tiwari, B.K.; Muthukumarappan, K.; O’Donnell, C.P.; Cullen, P.J. Colour degradation and quality parameters of sonicated orange juice using response surface methodology. LWT-Food Sci. Technol. 2008, 41, 1876–1883. [Google Scholar] [CrossRef]
- Huang, J.Y.; Guo, X.P.; Qiu, Y.B.; Chen, Z.Y. Cluster and discriminant analysis of electrochemical noise data. Electrochim. Acta. 2007, 53, 680–687. [Google Scholar] [CrossRef]
- Tian, Y.; Li, D.; Luo, W.; Zhu, Z.; Li, W.; Qian, Z.; Li, G.; Sun, D.-W. Rapid freezing using atomized liquid nitrogen spray followed by frozen storage below glass transition temperature for Cordyceps sinensis preservation: Quality attributes and storage stability. LWT-Food Sci. Technol. 2020, 123, 109066. [Google Scholar] [CrossRef]
- Tian, Y.; Sun, L.; Tanzeela, N.; Liang, D.; Gou, X.; Guo, Y. Multivariate statistical analysis of the quality of apple juice to integrate and simplify juice industrial production technologies. CyTA-J. Food 2018, 16, 190–198. [Google Scholar] [CrossRef]
- Zhao, Y.M.; Ojha, S.; Burgess, C.M.; Sun, D.W.; Tiwari, B.K. Influence of various fish constituents on inactivation efficacy of plasma-activated water. Int. J. Food Sci. Technol. 2020, 55, 2630–2641. [Google Scholar] [CrossRef]
- Illera, A.E.; Chaple, S.; Sanz, M.T.; Ng, S.; Lu, P.; Jones, J.; Carey, E.; Bourke, P. Effect of cold plasma on polyphenol oxidase inactivation in cloudy apple juice and on the quality parameters of the juice during storage. Food Chem. X 2019, 3, 100049. [Google Scholar] [CrossRef] [PubMed]
- Shen, Q.; Zhang, B.; Xu, R.; Wang, Y.; Ding, X.; Li, P. Antioxidant activity in vitro of the selenium-contained protein from the Se-enriched Bifidobacterium animalis 01. Anaerobe 2010, 16, 380–386. [Google Scholar] [CrossRef] [PubMed]
Figure 1.
The values of (a) pH and (b) electrical conductivity with the plasma activation time increase.
Figure 1.
The values of (a) pH and (b) electrical conductivity with the plasma activation time increase.
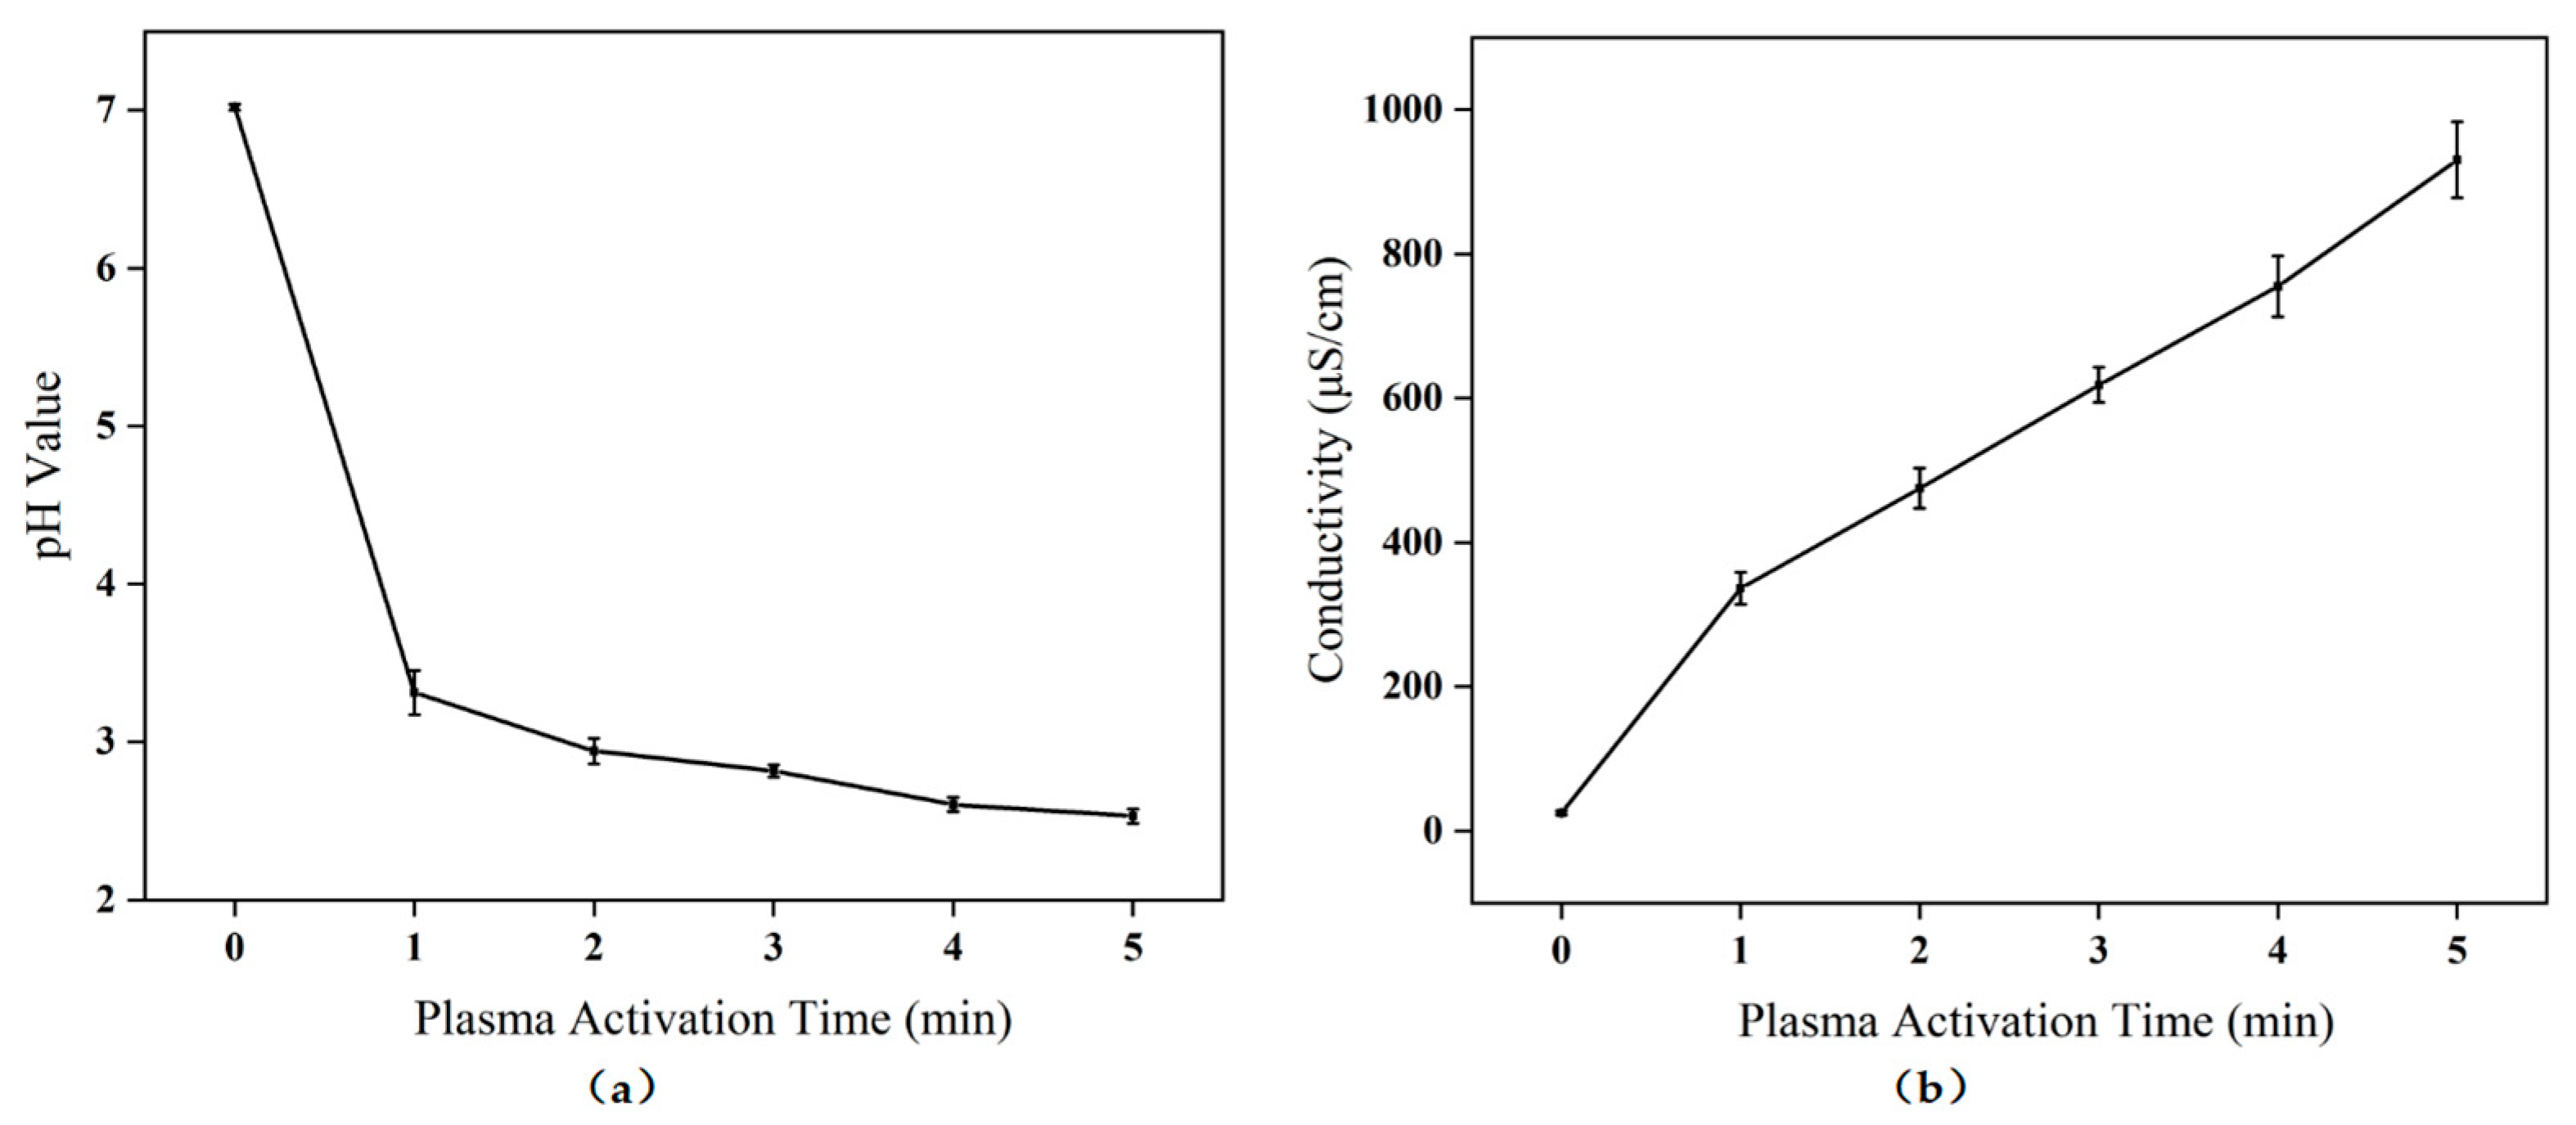
Figure 2.
(a) NO2− concentration; (b) NO3− concentration; (c) H2O2 concentration and (d) O2− concentration in PAW with the plasma activation time increase. Different letters (a–e) mean significant differences here.
Figure 2.
(a) NO2− concentration; (b) NO3− concentration; (c) H2O2 concentration and (d) O2− concentration in PAW with the plasma activation time increase. Different letters (a–e) mean significant differences here.

Figure 3.
(a) Schematic diagram of the experimental arrangement for strawberry quality change assessment. (b) Effects of different PAW treatments on strawberry appearance.
Figure 3.
(a) Schematic diagram of the experimental arrangement for strawberry quality change assessment. (b) Effects of different PAW treatments on strawberry appearance.

Figure 4.
Heatmap combined with the dendrogram of cluster analysis based on the quality of strawberries.
Figure 4.
Heatmap combined with the dendrogram of cluster analysis based on the quality of strawberries.
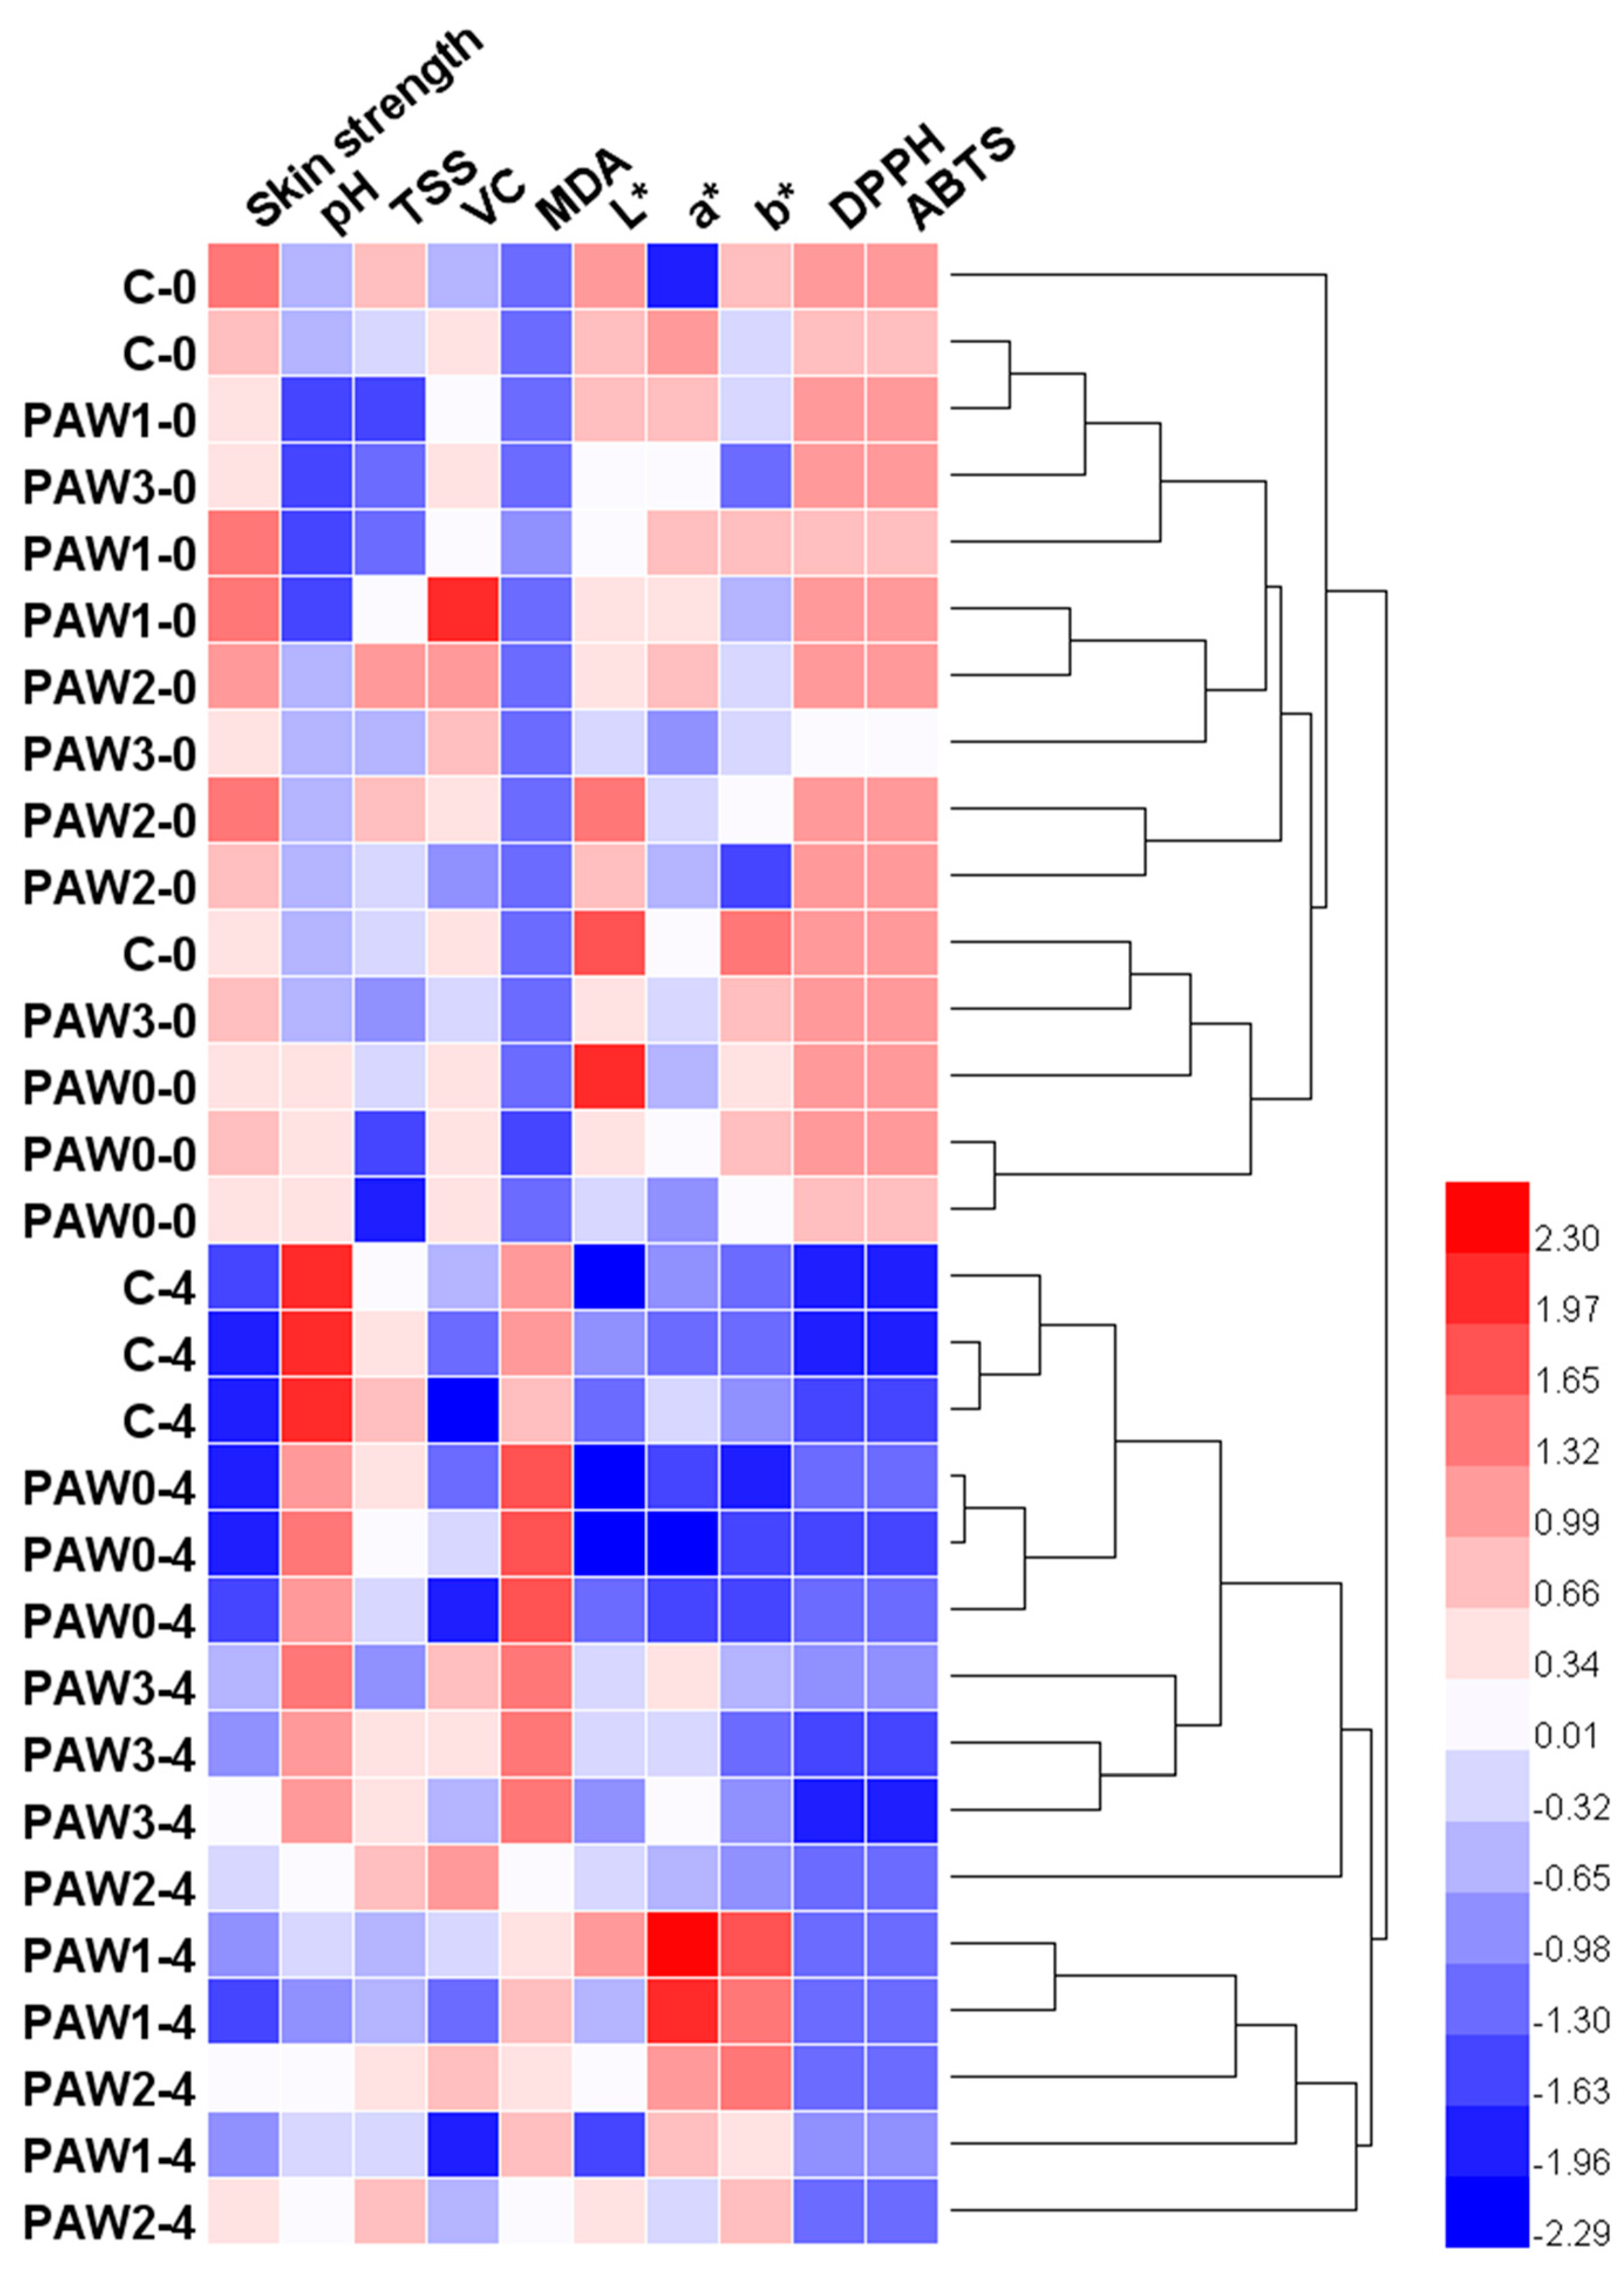
Figure 5.
Principal component analysis (PCA) of the strawberry quality, comparing fresh strawberries, strawberries after PAW treatment (0 d), and strawberries after storage (4 d). (a) Loading variable plot of PCA. (b) Comprehensive PCA score plot comparing fresh strawberries to strawberries after 0 and 4 days when subjected to various treatments. Individual PCA score plots of no-treatment control (c), PAW 0 (d), PAW 1 (e), PAW 2 (f), and PAW 3 (g) for evaluation of the general quality changes of strawberries during storage, comparing quality after 0 and 4 days.
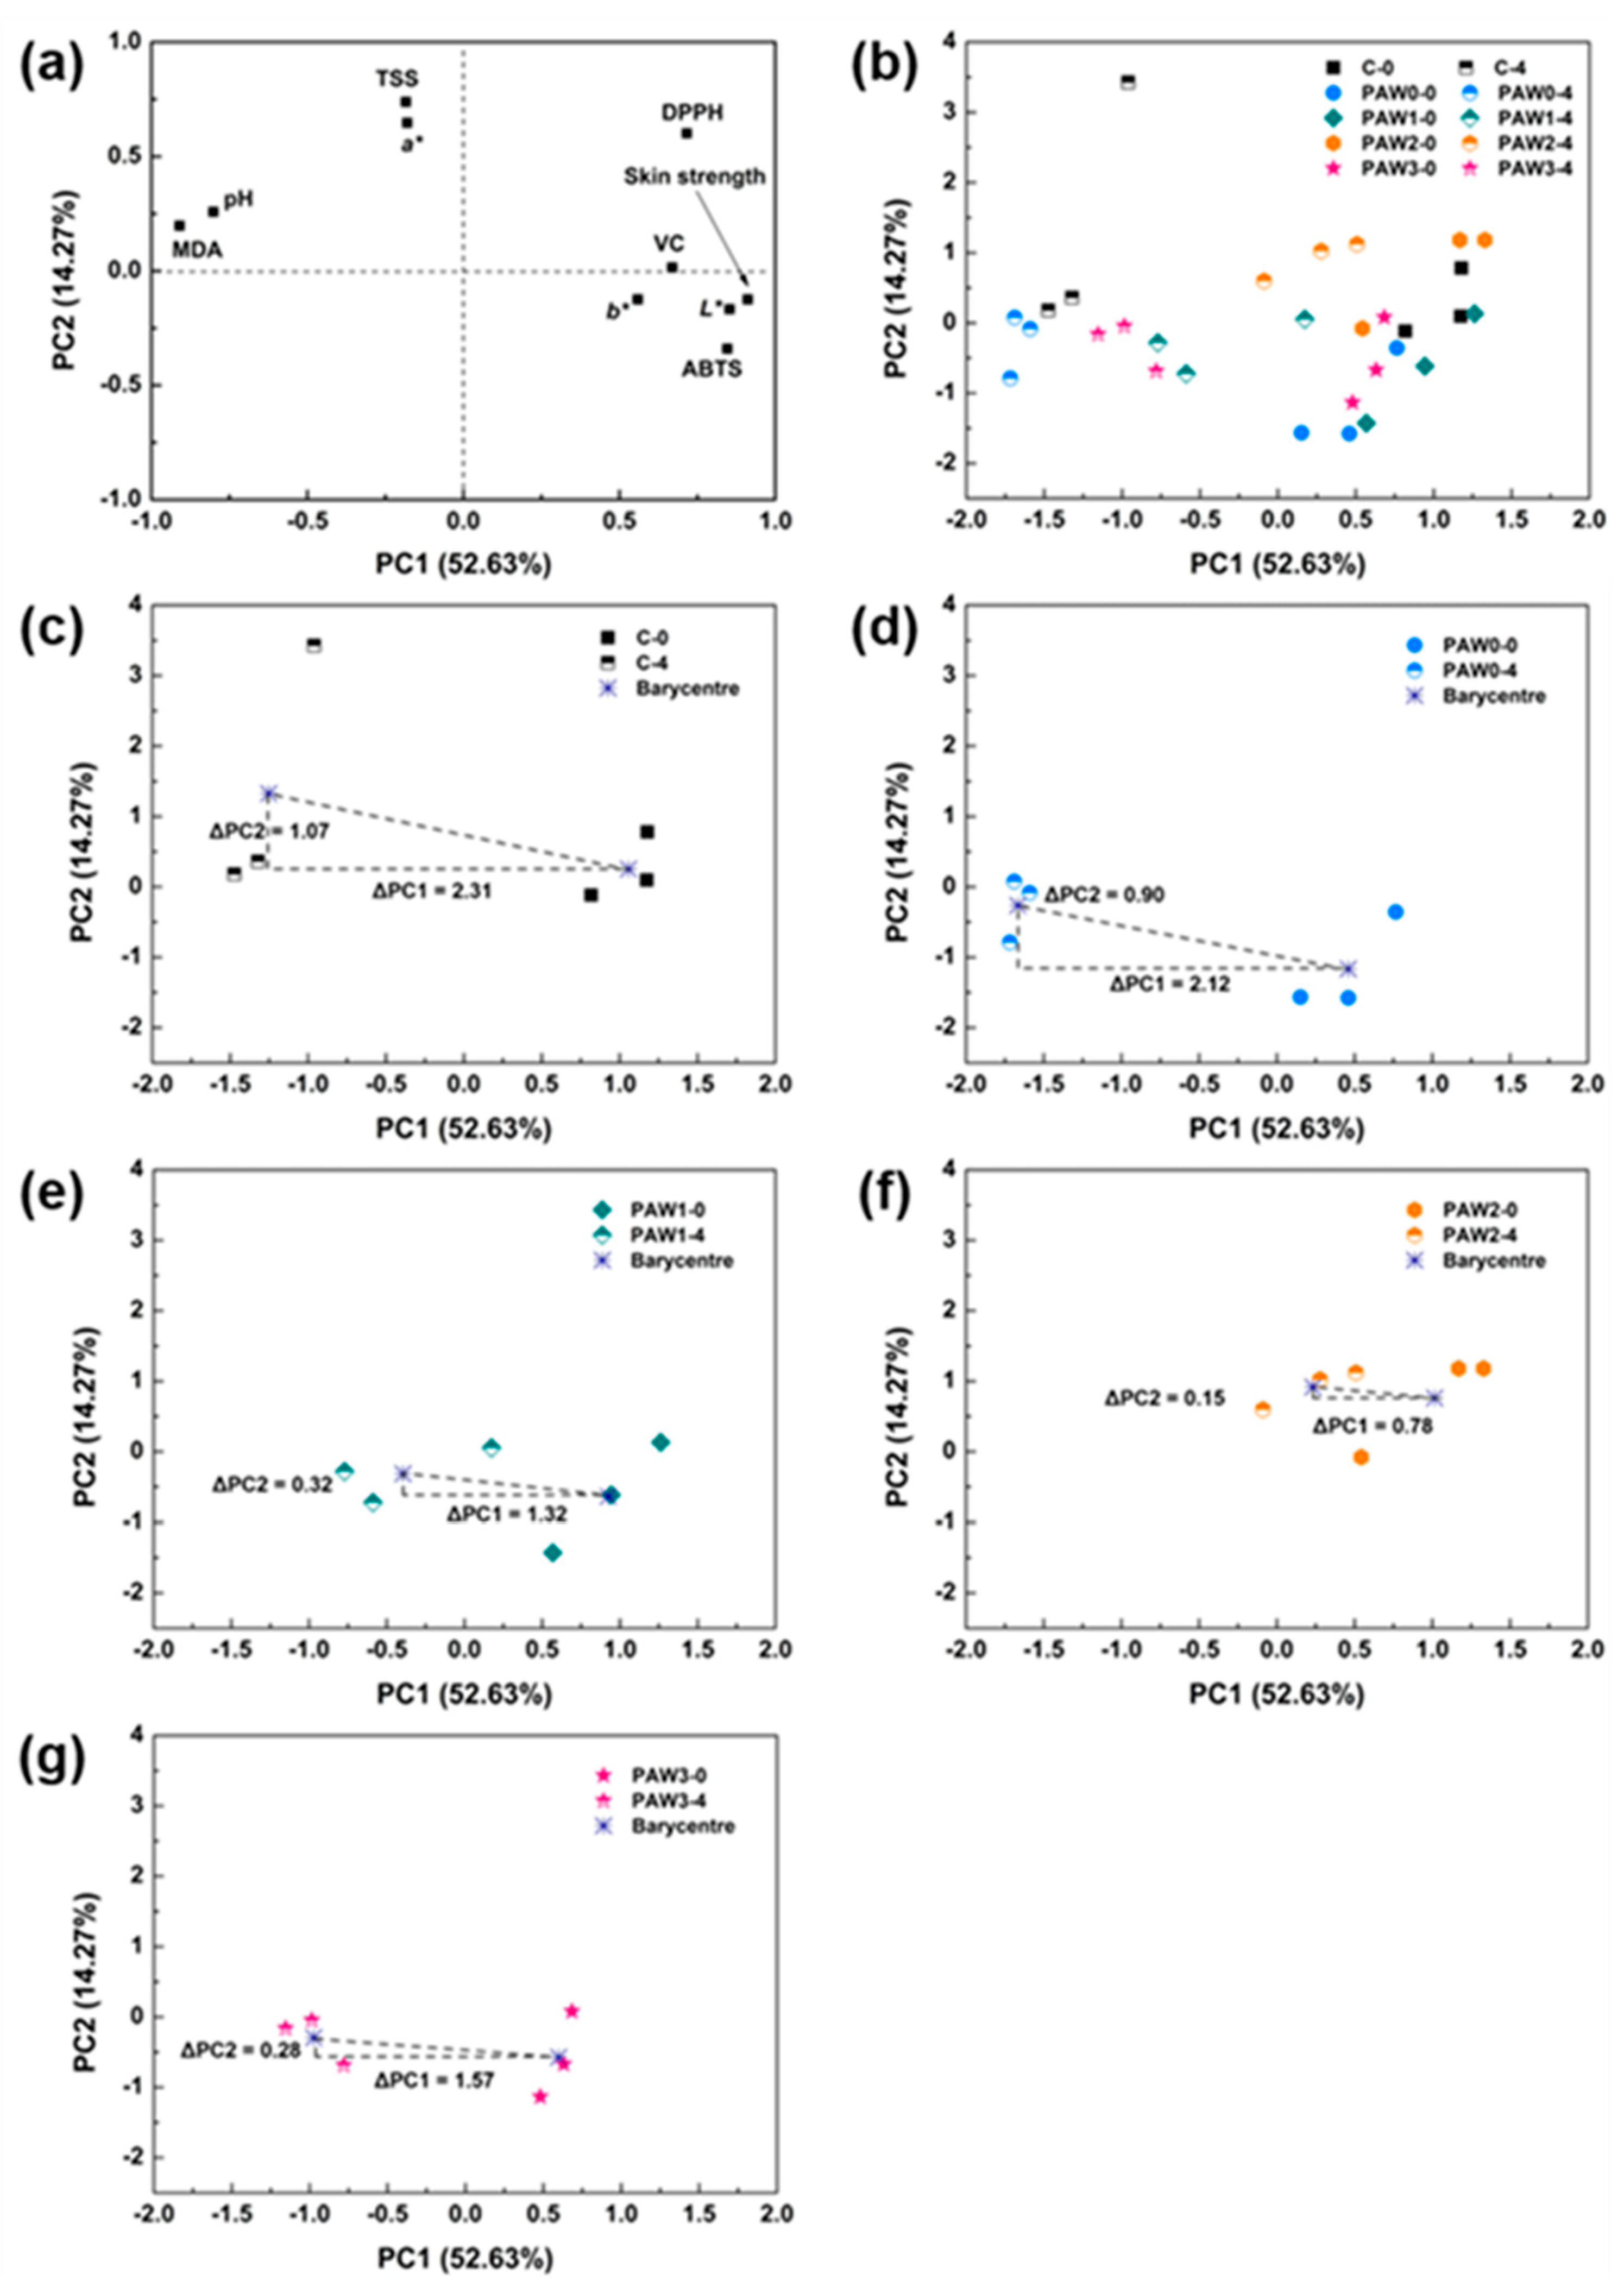
Figure 6.
(a) Schematic diagram of experimental set-up for PAW generation; (b) chemical processes induced by DBD atmospheric cold plasma in gas–liquid interface; (c) typical discharge voltage and current waveforms.
Figure 6.
(a) Schematic diagram of experimental set-up for PAW generation; (b) chemical processes induced by DBD atmospheric cold plasma in gas–liquid interface; (c) typical discharge voltage and current waveforms.

Table 1.
Sensory quality changes of the strawberry in different treatment groups during storage.
| Treatments | Storage Time (Day) | Firmness (N) | pH | Color Parameters | |||
|---|---|---|---|---|---|---|---|
| L* | a* | b* | ΔE* | ||||
| C | 0 | 74.8 ± 7.10 a | 3.64 ± 0 b | 50.5 ± 1.97 a | 26.0 ± 2.14 a | 17.3 ± 2.22 a | - |
| 4 | 28.8 ± 1.33 c | 3.82 ± 0.01 a | 43.3 ± 2.04 ab | 26.1 ± 0.91 b | 13.4 ± 0.69 b | 9.56 ± 1.46 ab | |
| PAW 0 | 0 | 68.9 ± 5.55 a | 3.71 ± 0 a | 50.0 ± 2.52 ab | 27.9 ± 2.25 a | 17.4 ± 2.53 a | 5.82 ± 1.92 a |
| 4 | 27.3 ± 2.40 c | 3.76 ± 0.01 b | 41.3 ± 1.58 b | 23.7 ± 0.71 c | 11.5 ± 0.77 b | 11.8 ± 1.65 a | |
| PAW 1 | 0 | 77.9 ± 10.95 a | 3.58 ± 0 c | 46.8 ± 2.54 c | 27.2 ± 1.64 a | 15.7 ± 2.94 a | 6.89 ± 2.33 a |
| 4 | 37.5 ± 6.81 b | 3.65 ± 0.03 d | 46.0 ± 3.49 a | 31.0 ± 1.91 a | 20.3 ± 2.20 a | 9.62 ± 0.3 ab | |
| PAW 2 | 0 | 77.3 ± 3.35 a | 3.65 ± 0 b | 48.2 ± 1.74 abc | 26.9 ± 1.29 a | 15.3 ± 1.69 a | 5.89 ± 1.18 a |
| 4 | 60.4 ± 5.16 b | 3.68 ± 0.01 c | 47.2 ± 0.81 a | 27.5 ± 1.72 b | 17.7 ± 3.88 b | 6.21 ± 1.87 c | |
| PAW 3 | 0 | 68.8 ± 4.16 a | 3.63 ± 0.03 b | 47.3 ± 0.9 bc | 26.9 ± 1.23 a | 16.0 ± 2.78 a | 6.00 ± 1.82 a |
| 4 | 49.8 ± 9.01 b | 3.76 ± 0.01 b | 45.9 ± 1.09 a | 27.5 ± 0.82 b | 13.8 ± 0.78 a | 8.08 ± 0.65 bc | |
Note: Values with different letters within the same column are significantly different in each group (p < 0.05).
Table 2.
Nutritional quality changes of strawberries in different treatment groups during storage.
| Treatments | Storage Time (Day) | TSS (°Brix) | VC (mg/L) | DPPH Radical Scavenging Activity (%) | Antioxidant Activity (mmol/L) | MDA Content (mmol/g) |
|---|---|---|---|---|---|---|
| C | 0 | 10.2 ± 0.55 ab | 113.3 ± 12.5 a | 97.1 ± 1.04 a | 1.31 ± 0.02 a | 6.45 ± 0.09 a |
| 4 | 10.5 ± 0.20 a | 113.3 ± 35.9 ab | 95.0 ± 2.53 ab | 0.61 ± 0.08 b | 8.58 ± 0.21 c | |
| PAW 0 | 0 | 9.00 ± 0.75 b | 120.3 ± 8.0 a | 93.6 ± 1.22 b | 1.31 ± 0.02 a | 6.41 ± 0.18 a |
| 4 | 10.2 ± 0.45 a | 89.6 ± 16.17 a | 92.2 ± 0.62 b | 0.71 ± 0.03 ab | 9.53 ± 0.10 a | |
| PAW 1 | 0 | 9.48 ± 0.97 ab | 127.3 ± 24.0 a | 95.8 ± 1.49 a | 1.31 ± 0.03 a | 6.53 ± 0.24 a |
| 4 | 9.63 ± 0.15 b | 90.8 ± 16.7 ab | 94.9 ± 1.78 ab | 0.77 ± 0.03 a | 8.32 ± 0.13 c | |
| PAW 2 | 0 | 10.5 ± 0.56 a | 107.3 ± 24.1 a | 98.0 ± 1.48 a | 1.31 ± 0.01 a | 6.47 ± 0.14 a |
| 4 | 10.6 ± 0.21 a | 119.0 ± 18.2 b | 97.1 ± 2.00 a | 0.75 ± 0.03 ab | 7.93 ± 0.11 d | |
| PAW 3 | 0 | 9.10 ± 0.34 b | 117.0 ± 10.1 a | 95.6 ± 2.13 ab | 1.26 ± 0.12 a | 6.41 ± 0.05 a |
| 4 | 10.5 ± 0.12 a | 113.0 ± 13.5 ab | 91.8 ± 0.71 b | 0.66 ± 0.11 ab | 9.07 ± 0.07 b |
Note: values with different letters within the same column are significantly different in each group (p < 0.05).
Table 3.
Total variance explained in PCA.
| Component | Initial Eigenvalues | ||
|---|---|---|---|
| Eigenvalue | % of Variance | Cumulative (%) | |
| 1 | 5.263 | 52.631 | 52.631 |
| 2 | 1.427 | 14.272 | 66.903 |
| 3 | 0.996 | 9.963 | 76.866 |
| 4 | 0.895 | 8.951 | 85.817 |
| 5 | 0.571 | 5.709 | 91.526 |
| 6 | 0.407 | 4.065 | 95.591 |
| 7 | 0.158 | 1.581 | 97.172 |
| 8 | 0.138 | 1.377 | 98.549 |
| 9 | 0.098 | 0.980 | 99.528 |
| 10 | 0.047 | 0.472 | 100.000 |
Disclaimer/Publisher’s Note: The statements, opinions and data contained in all publications are solely those of the individual author(s) and contributor(s) and not of MDPI and/or the editor(s). MDPI and/or the editor(s) disclaim responsibility for any injury to people or property resulting from any ideas, methods, instructions or products referred to in the content. |
© 2023 by the authors. Licensee MDPI, Basel, Switzerland. This article is an open access article distributed under the terms and conditions of the Creative Commons Attribution (CC BY) license (https://creativecommons.org/licenses/by/4.0/).
Share and Cite
MDPI and ACS Style
Yang, X.; Zhang, C.; Li, Q.; Cheng, J.-H. Physicochemical Properties of Plasma-Activated Water and Its Control Effects on the Quality of Strawberries. Molecules 2023, 28, 2677. https://doi.org/10.3390/molecules28062677
AMA Style
Yang X, Zhang C, Li Q, Cheng J-H. Physicochemical Properties of Plasma-Activated Water and Its Control Effects on the Quality of Strawberries. Molecules. 2023; 28(6):2677. https://doi.org/10.3390/molecules28062677
Chicago/Turabian StyleYang, Xiao, Can Zhang, Qunfang Li, and Jun-Hu Cheng. 2023. "Physicochemical Properties of Plasma-Activated Water and Its Control Effects on the Quality of Strawberries" Molecules 28, no. 6: 2677. https://doi.org/10.3390/molecules28062677