

Naphthoquinone Derivatives from Angustimassarina populi CF-097565 Display Anti-Tumour Activity in 3D Cultures of Breast Cancer Cells
 ,
,  , ,
, ,  , ,
, ,  and
and
Abstract
: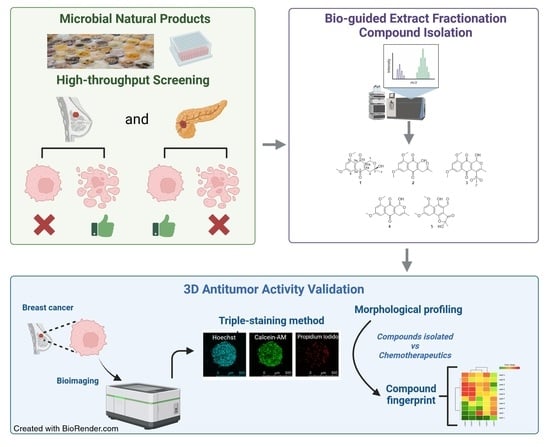
1. Introduction
2. Results
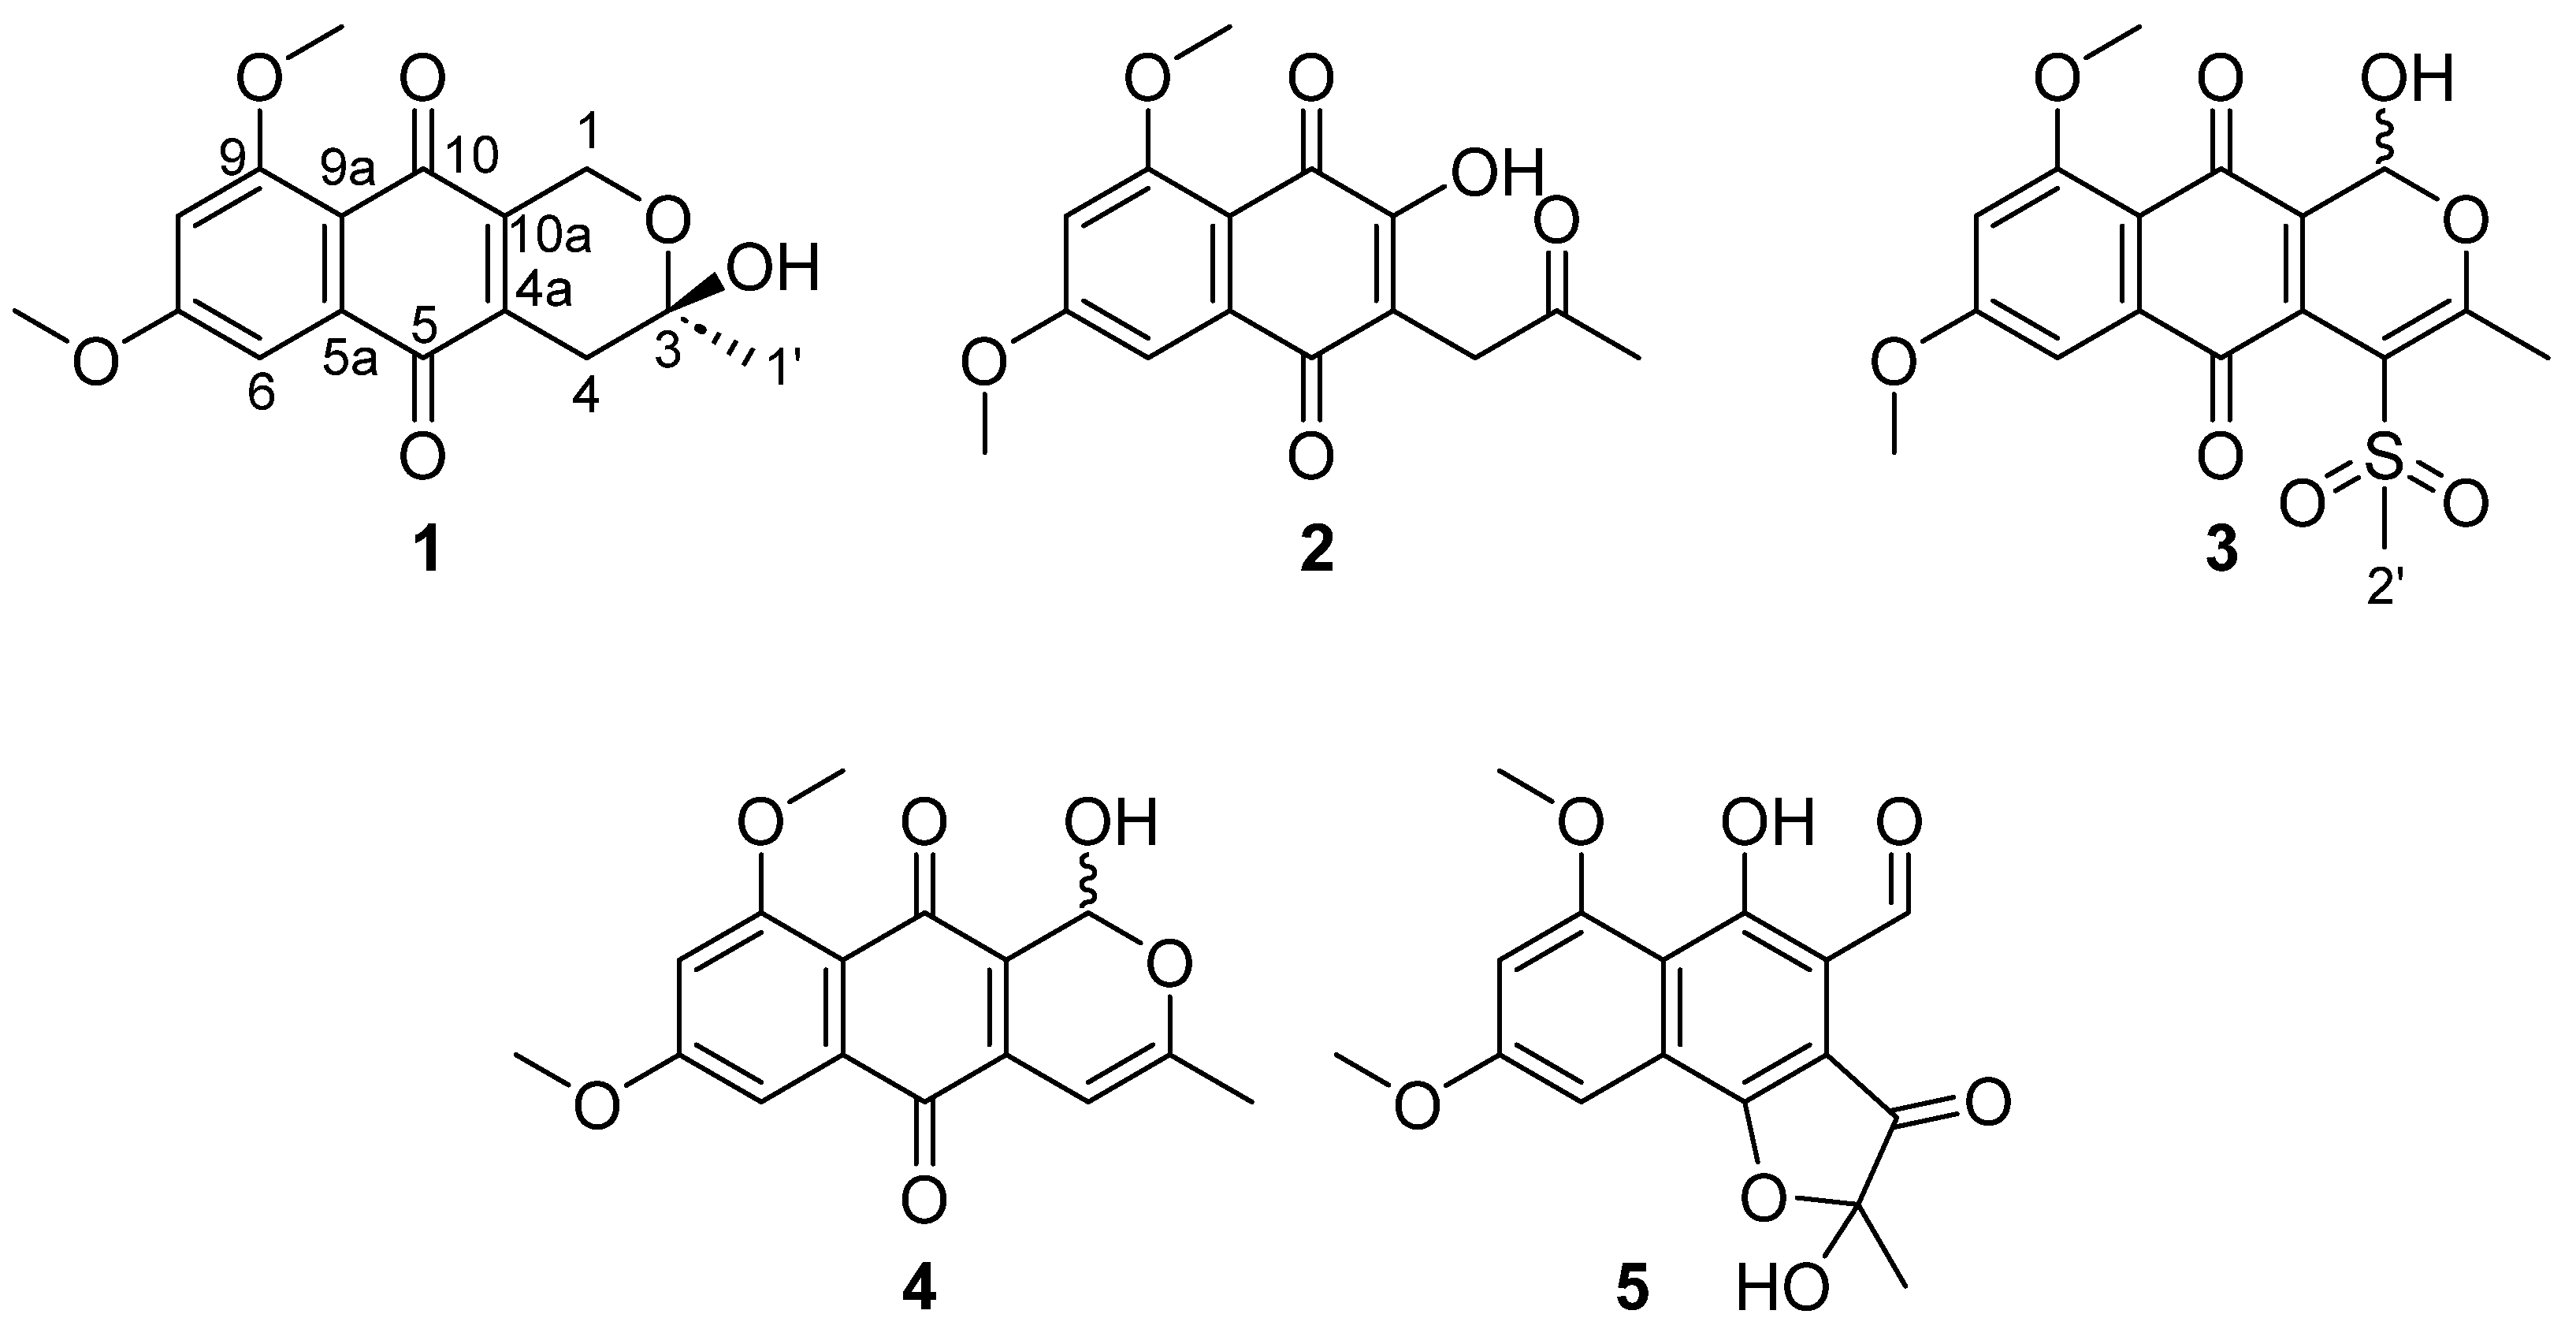
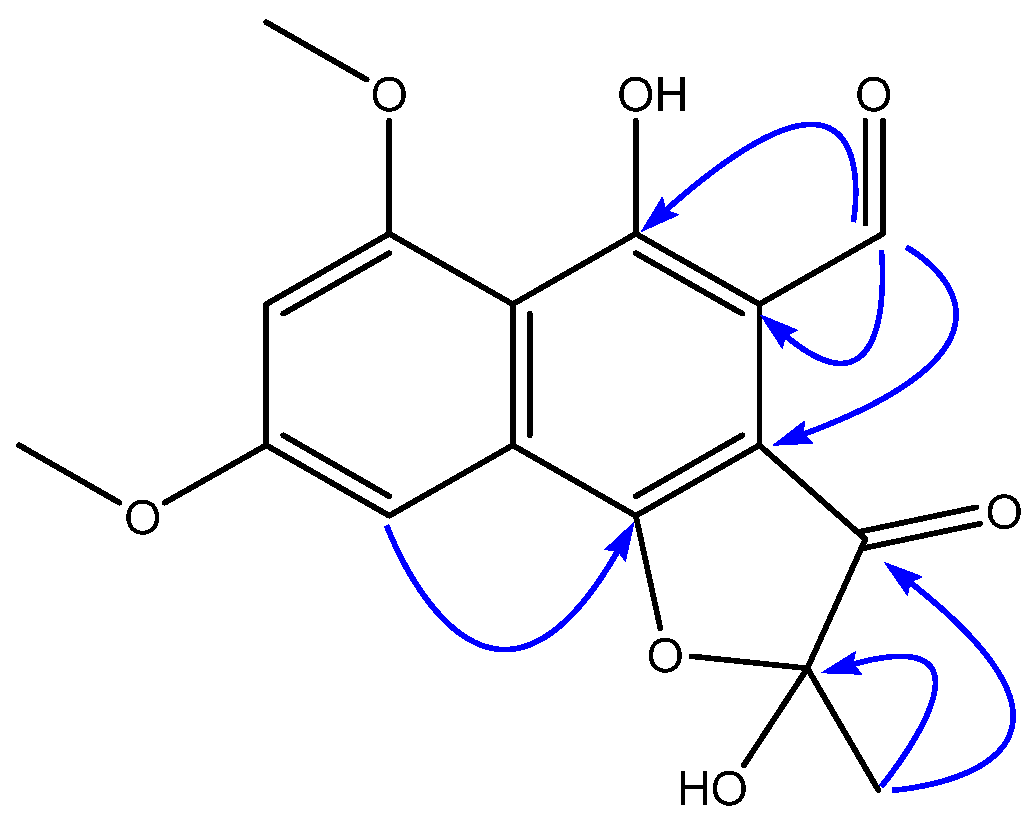
2.1. Structural Elucidation of New Natural Naphthoquinone Derivatives
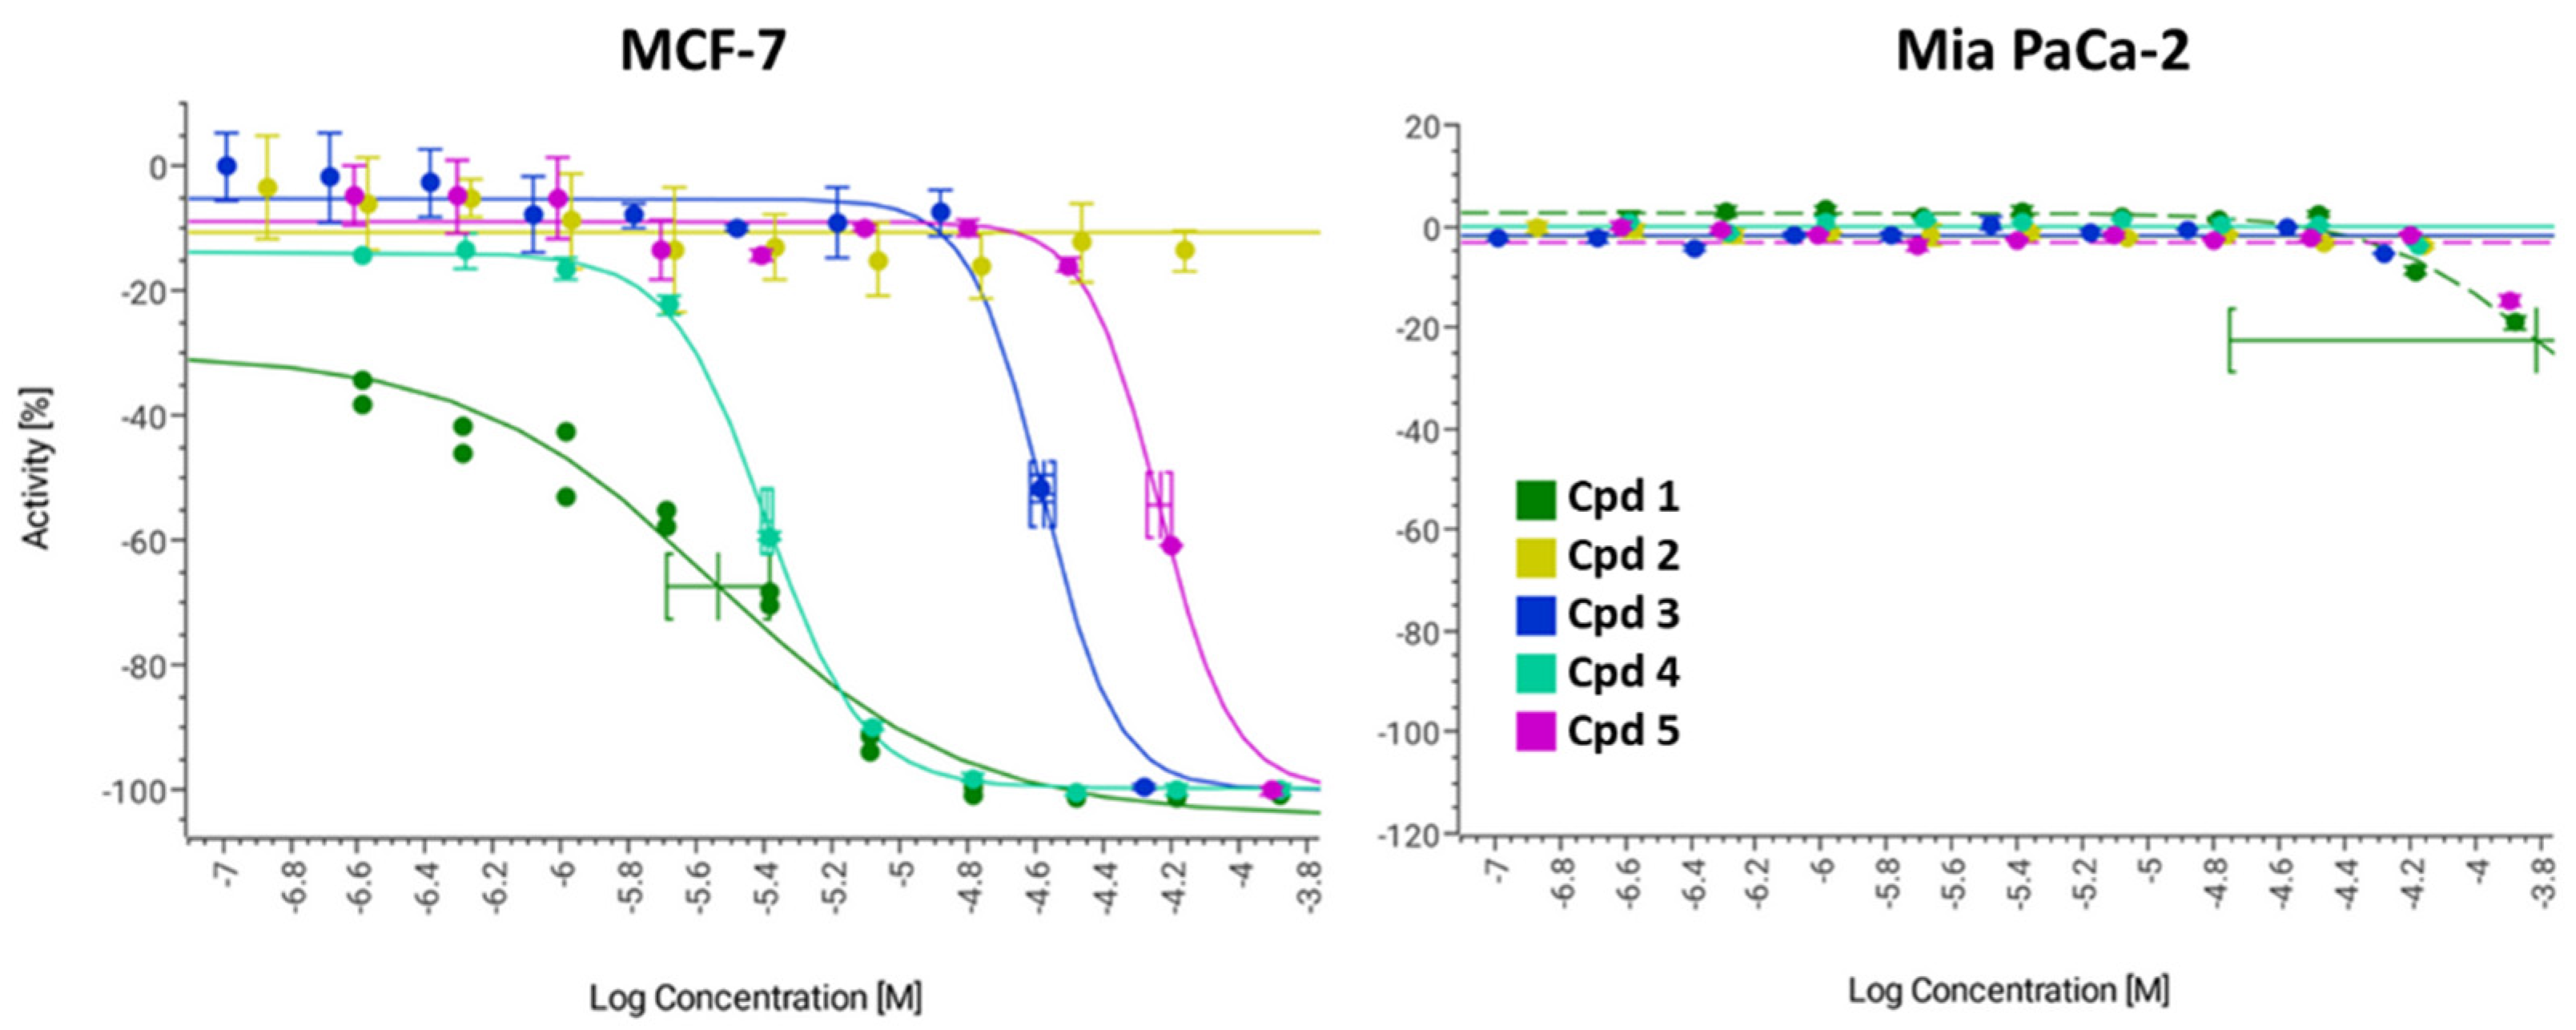
2.2. In Vitro Effectiveness of the Naphthoquinone Derivatives against 2D Breast Cancer Cells
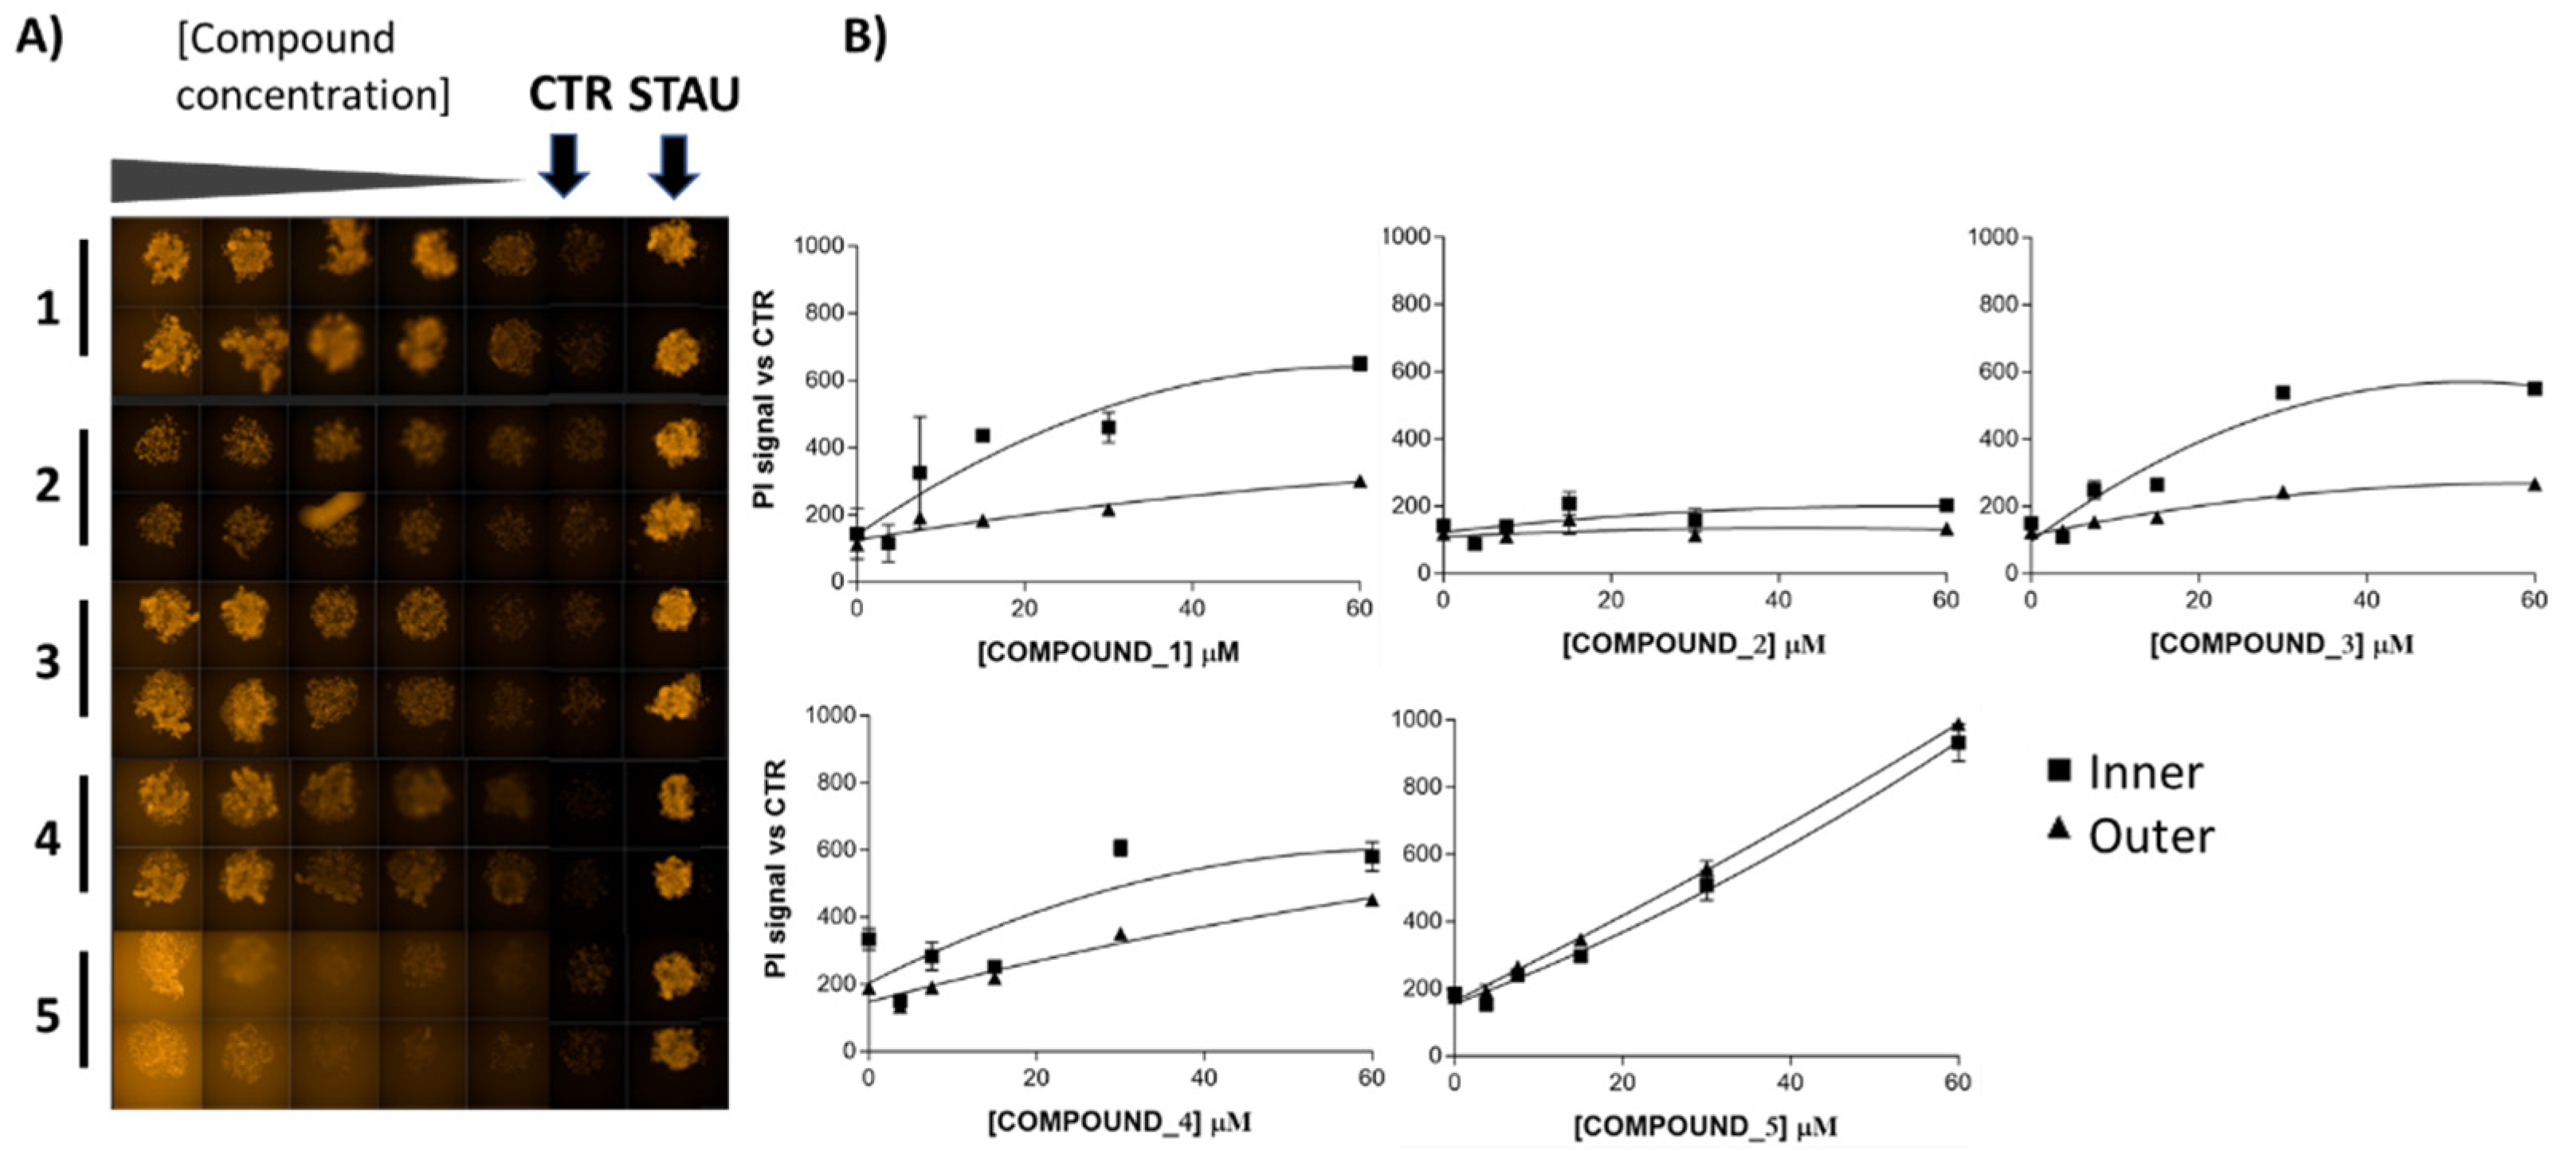
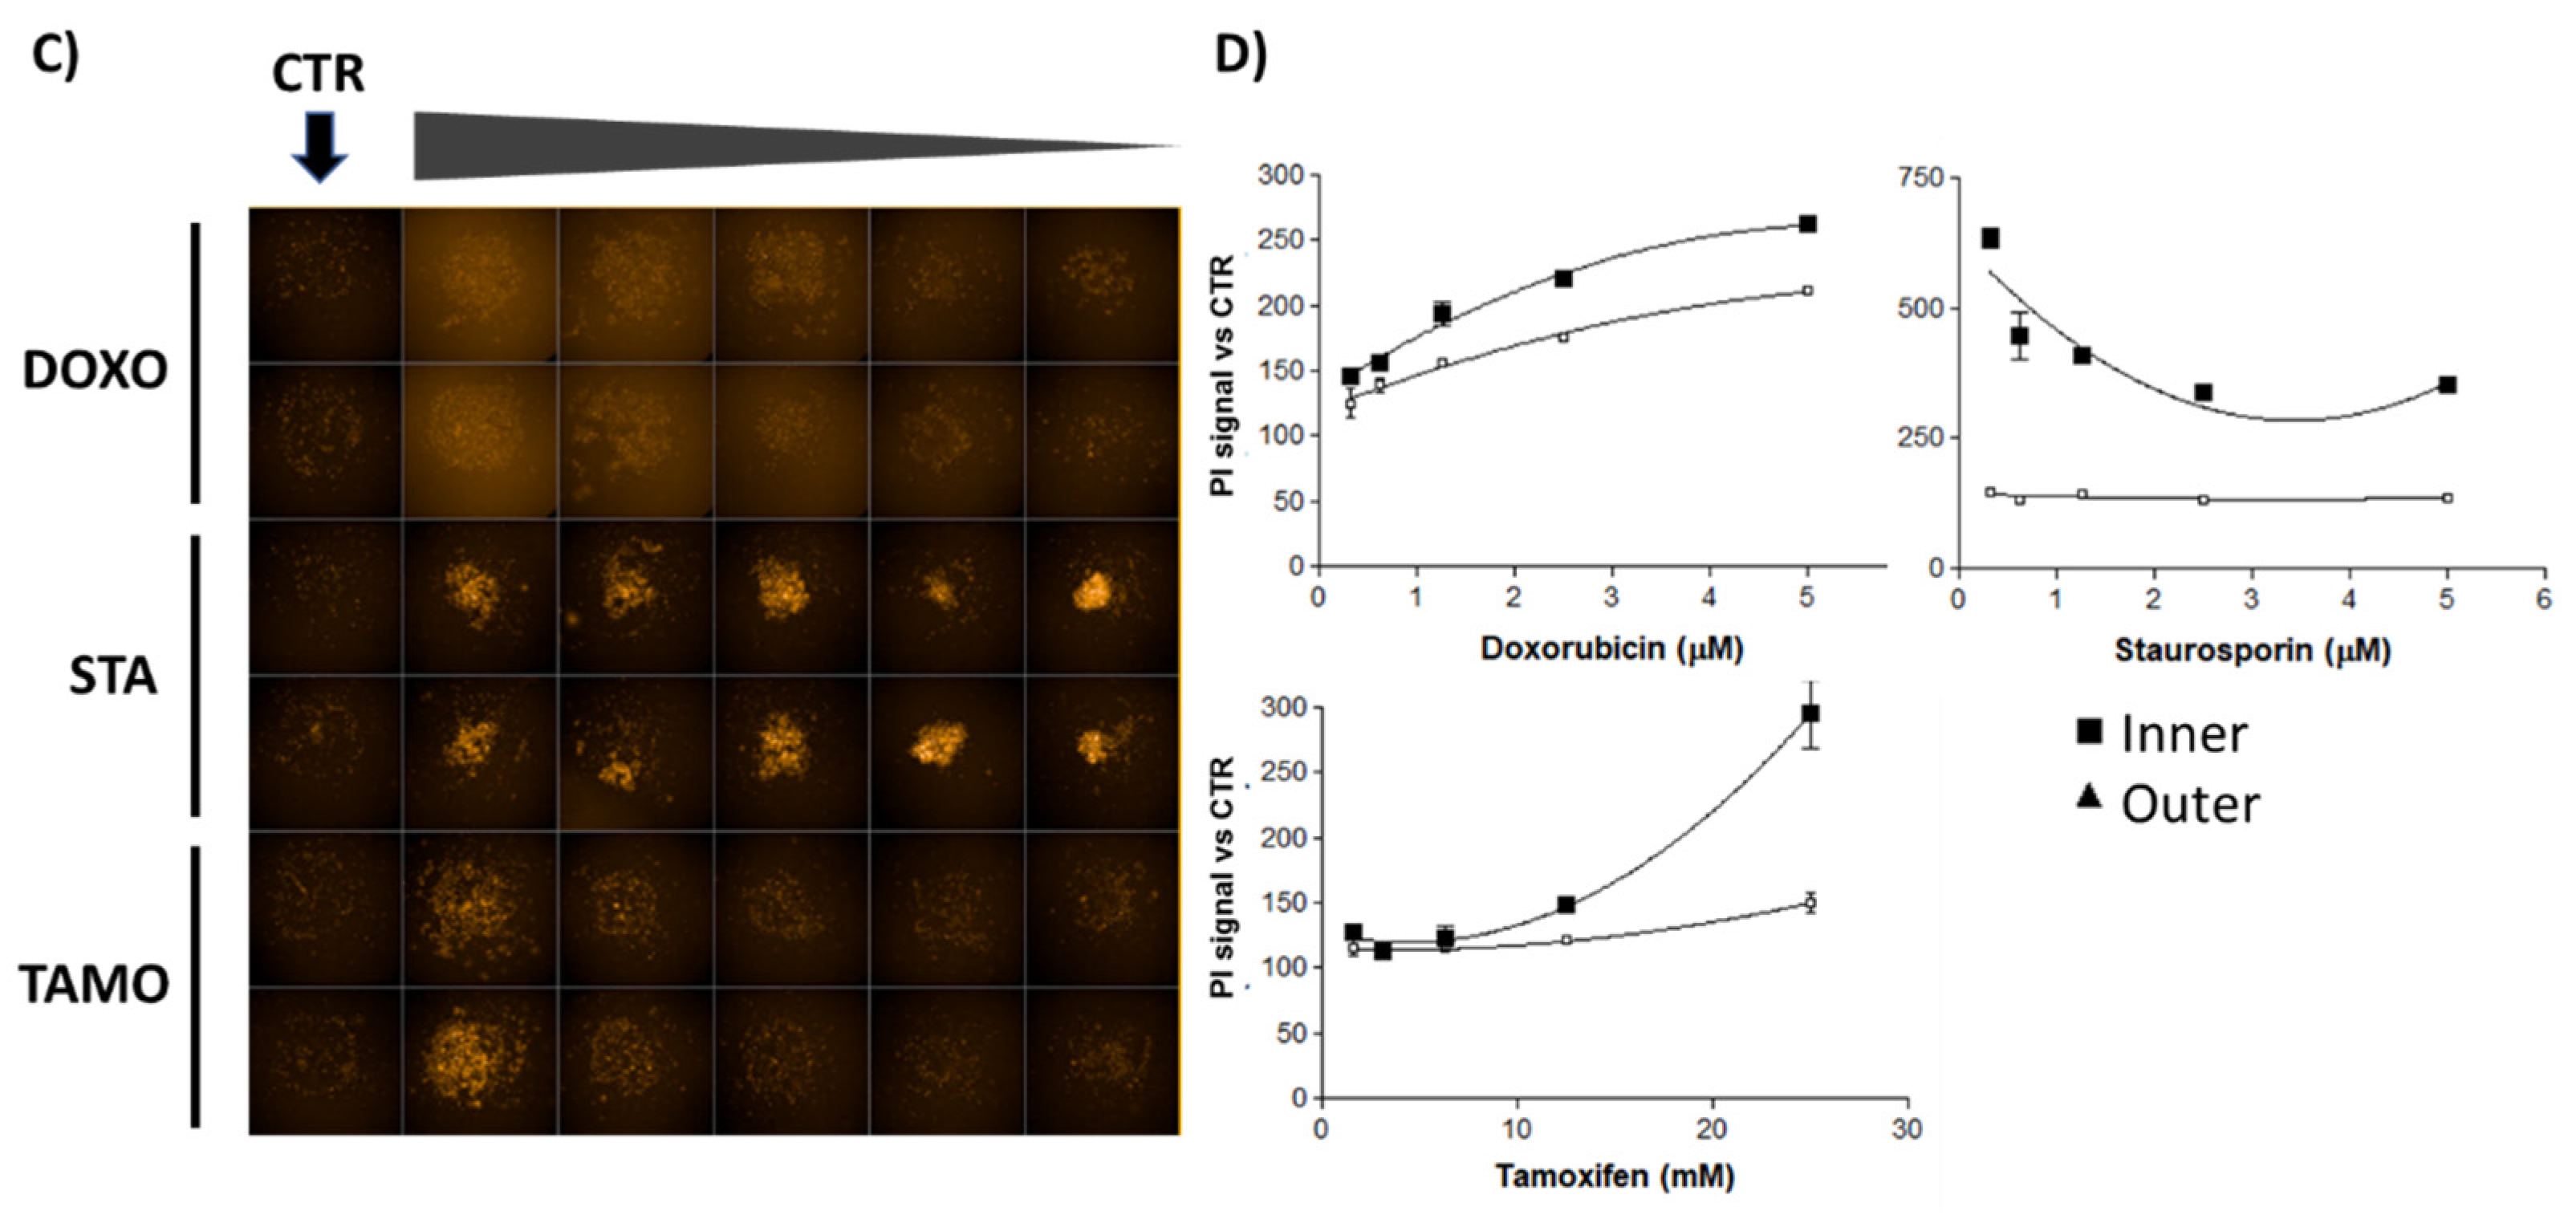
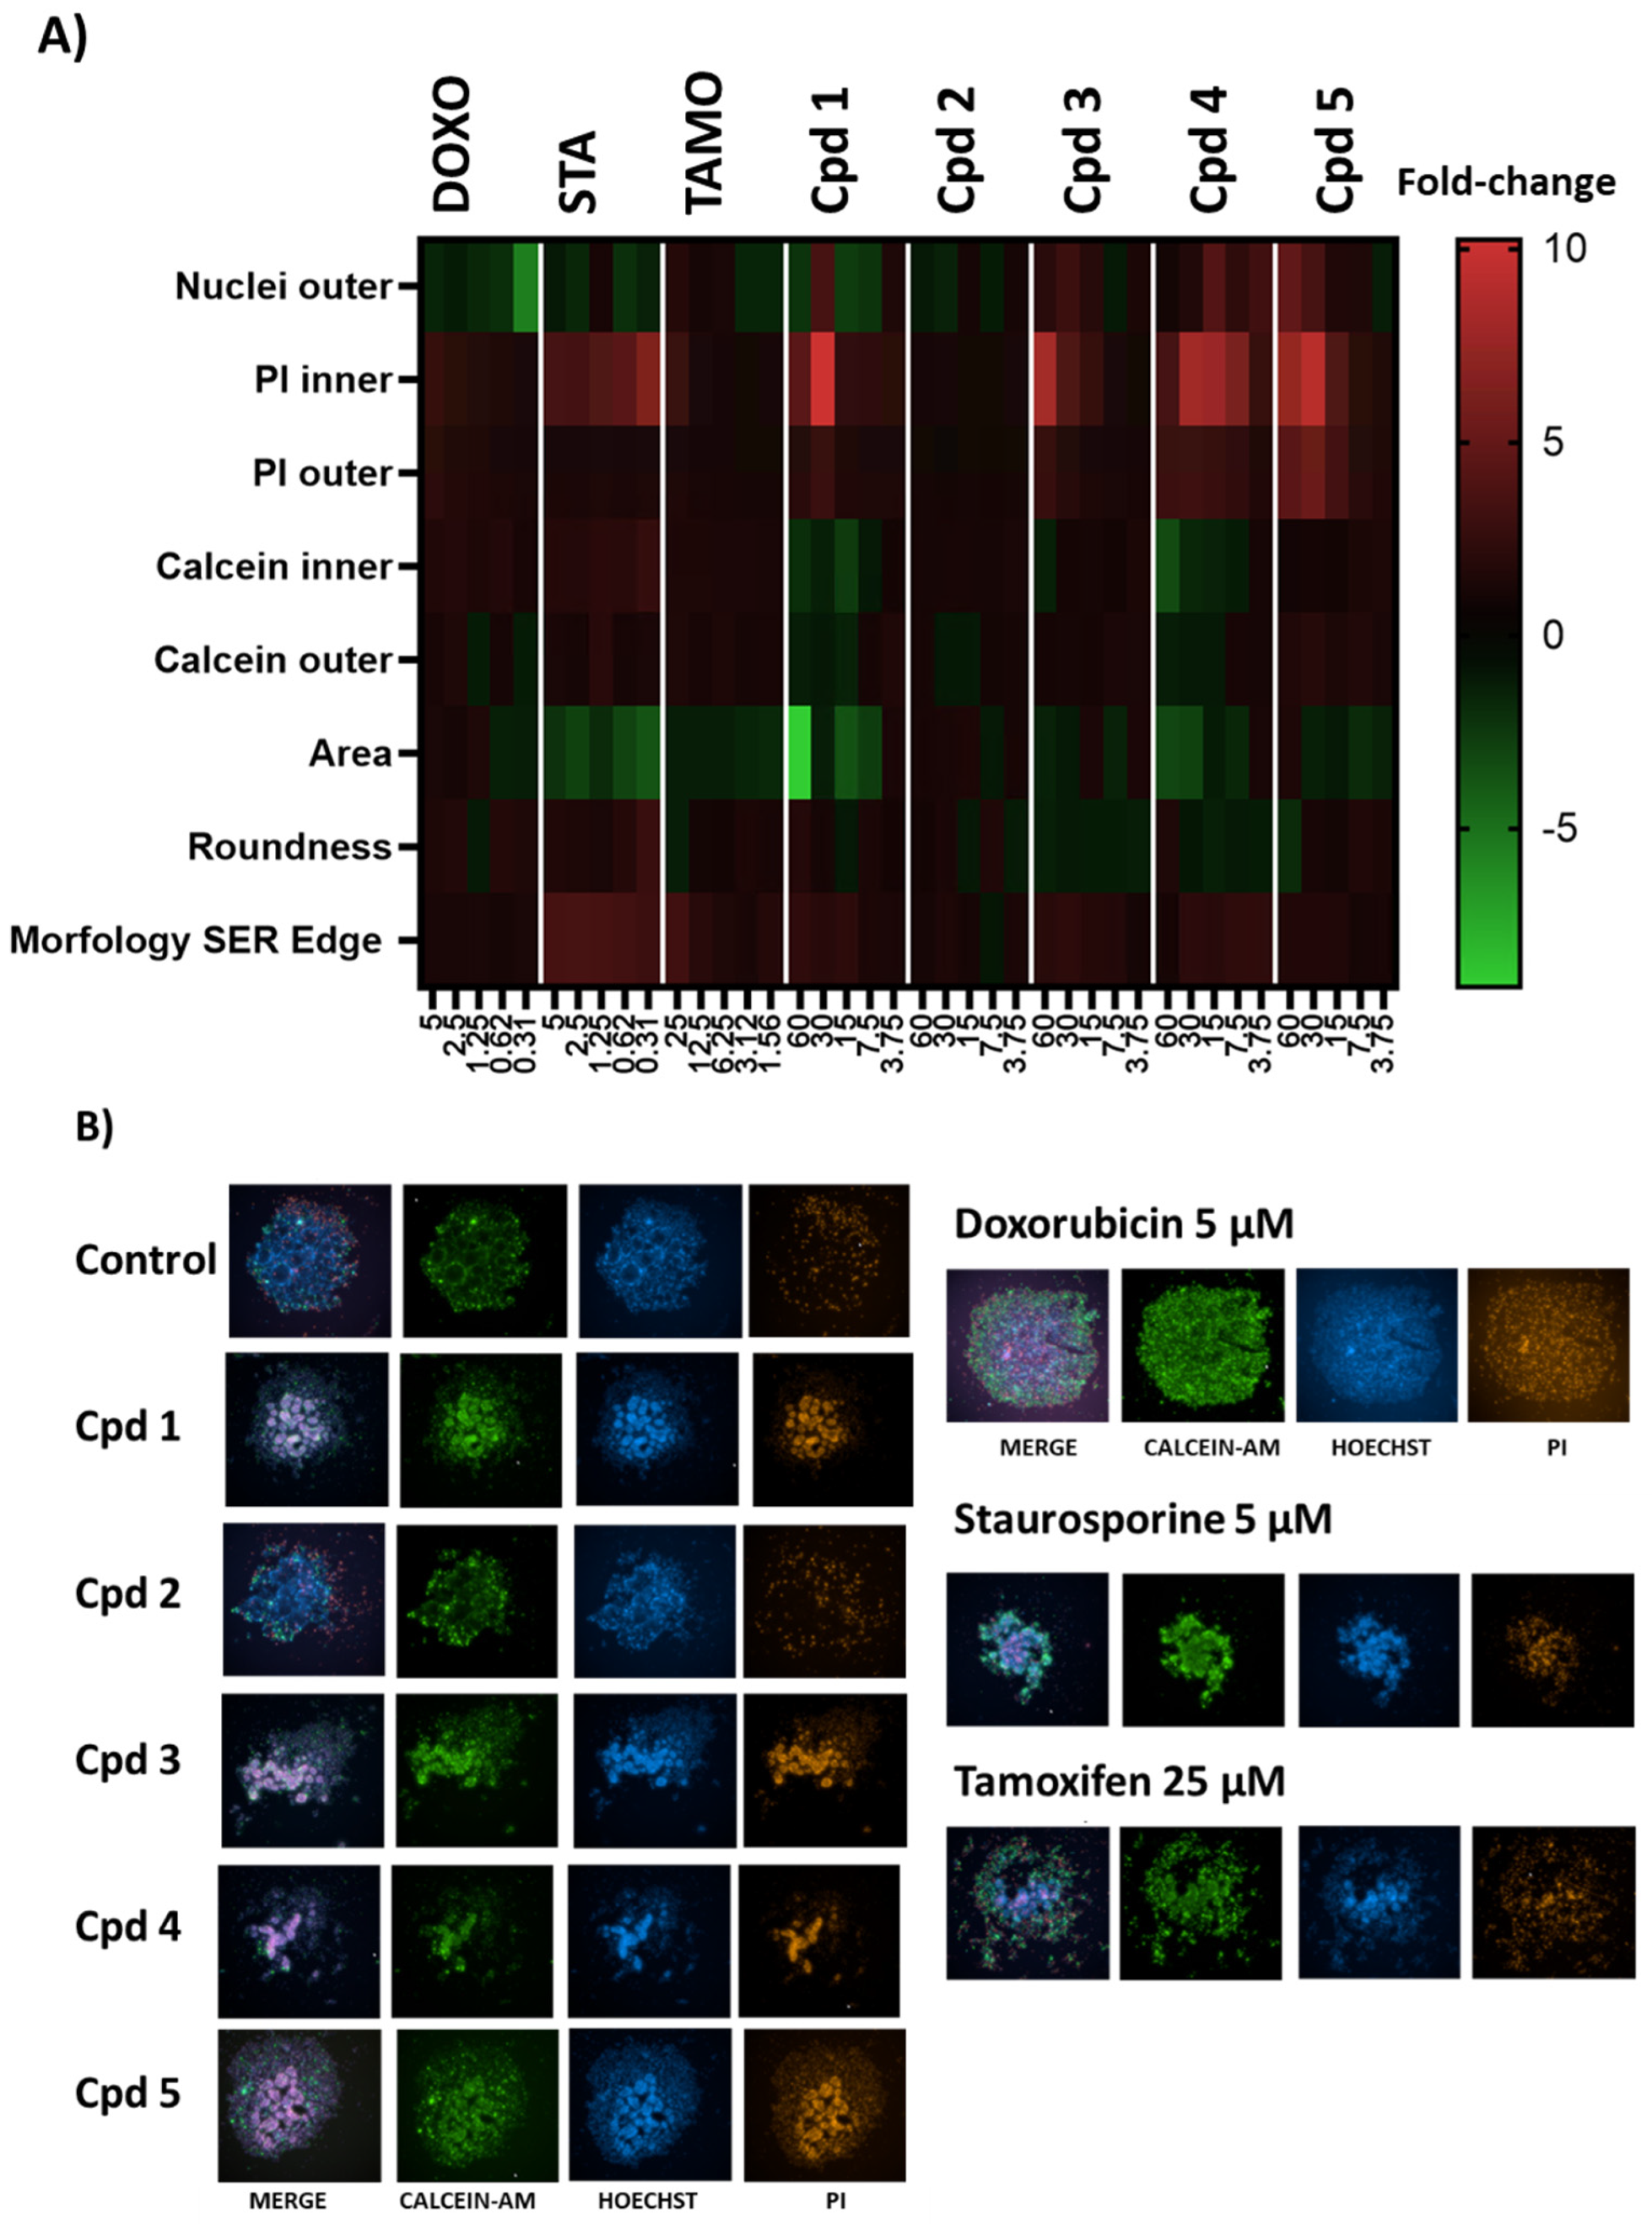
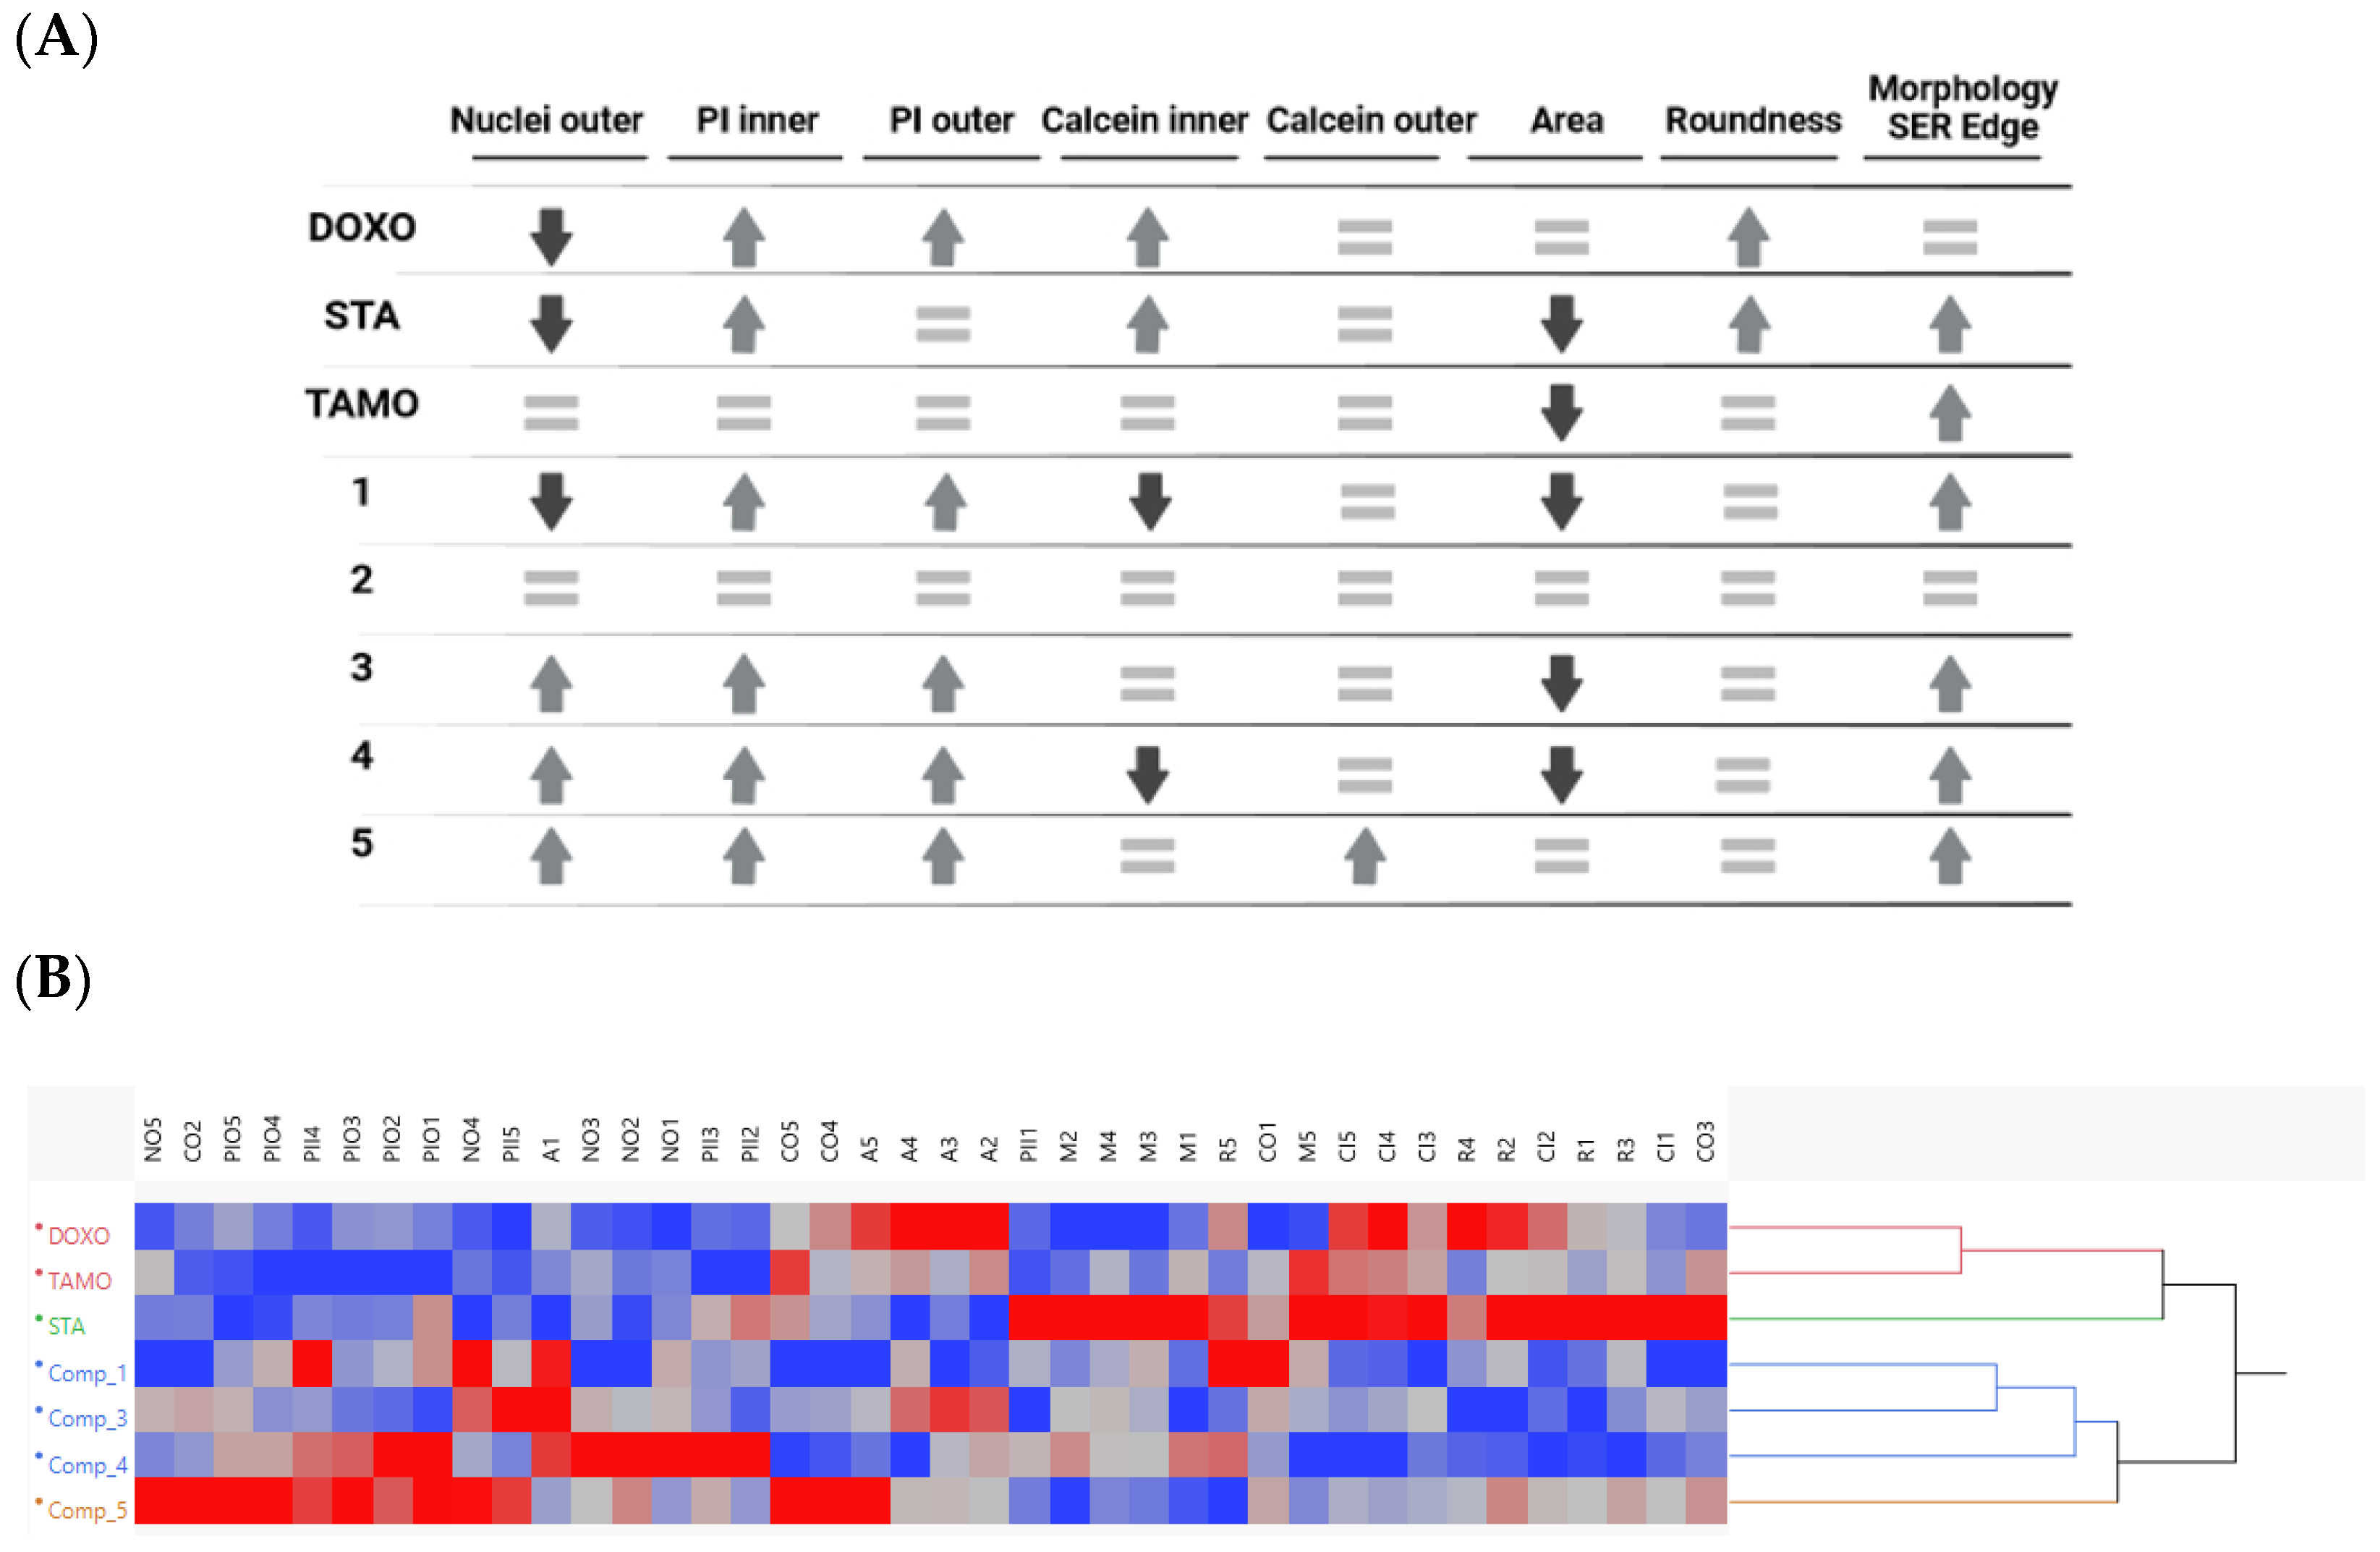
2.3. In Vitro Effects on 3D Breast Cancer Cells
3. Discussion
4. Materials and Methods
4.1. Cell Culture Lines and Reagents
4.2. Strain Isolation and Identification
4.3. Large-Scale Fermentation of Angustimassarina populi CF-097565
4.4. Chemical Instrumentation
4.5. Bioassay-Guided Isolation of Naphthoquinone Derivatives
4.6. 2D Culture Cytotoxicity Assay: MTT Test
4.7. Spheroid Formation and High Content Imaging
5. Conclusions
Supplementary Materials
Author Contributions
Funding
Institutional Review Board Statement
Informed Consent Statement
Data Availability Statement
Acknowledgments
Conflicts of Interest
References
- Breast Cancer: Statistics. Available online: https://www.cancer.net/cancer-types/breast-cancer/statistics (accessed on 20 November 2023).
- Arnold, M.; Morgan, E.; Rumgay, H.; Mafra, A.; Singh, D.; Laversanne, M.; Vignat, J.; Gralow, J.R.; Cardoso, F.; Siesling, S.; et al. Current and Future Burden of Breast Cancer: Global Statistics for 2020 and 2040. Breast 2022, 66, 15–23. [Google Scholar] [CrossRef]
- Noor, F.; Noor, A.; Ishaq, A.R.; Farzeen, I.; Saleem, M.H.; Ghaffar, K.; Aslam, M.F.; Aslam, S.; Chen, J.-T. Recent Advances in Diagnostic and Therapeutic Approaches for Breast Cancer: A Comprehensive Review. Curr. Pharm. Des. 2021, 27, 2344–2365. [Google Scholar] [CrossRef] [PubMed]
- Gonzalez-Angulo, A.M.; Morales-Vasquez, F.; Hortobagyi, G.N. Overview of Resistance to Systemic Therapy in Patients with Breast Cancer. In Breast Cancer Chemosensitivity; Springer: New York, NY, USA, 2007; pp. 1–22. [Google Scholar]
- Giddings, L.-A.; Newman, D.J. Microbial Natural Products: Molecular Blueprints for Antitumor Drugs. J. Ind. Microbiol. Biotechnol. 2013, 40, 1181–1210. [Google Scholar] [CrossRef] [PubMed]
- Katz, L.; Baltz, R.H. Natural Product Discovery: Past, Present, and Future. J. Ind. Microbiol. Biotechnol. 2016, 43, 155–176. [Google Scholar] [CrossRef]
- Chen, H.; Yang, J.; Yang, Y.; Zhang, J.; Xu, Y.; Lu, X. The Natural Products and Extracts: Anti-Triple-Negative Breast Cancer In Vitro. Chem. Biodivers. 2021, 18, e2001047. [Google Scholar] [CrossRef]
- Yamamoto, S.; Maeda, N.; Nagashima, Y.; Kubo, H.; Sato, Y.; Matsui, H.; Inoue, Y.; Shindo, Y.; Kanekiyo, S.; Sakamoto, K.; et al. A Phase II, Multicenter, Single-Arm Study of Tri-Weekly Low-Dose Nanoparticle Albumin-Bound Paclitaxel Chemotherapy for Patients with Metastatic or Recurrent Breast Cancer. Breast Cancer 2017, 24, 783–789. [Google Scholar] [CrossRef]
- Xu, B.; Sun, T.; Wang, S.; Lin, Y. Metronomic Therapy in Advanced Breast Cancer and NSCLC: Vinorelbine as a Paradigm of Recent Progress. Expert Rev. Anticancer Ther. 2021, 21, 71–79. [Google Scholar] [CrossRef]
- Abu Samaan, T.M.; Samec, M.; Liskova, A.; Kubatka, P.; Büsselberg, D. Paclitaxel’s Mechanistic and Clinical Effects on Breast Cancer. Biomolecules 2019, 9, 789. [Google Scholar] [CrossRef] [PubMed]
- Shafei, A.; El-Bakly, W.; Sobhy, A.; Wagdy, O.; Reda, A.; Aboelenin, O.; Marzouk, A.; El Habak, K.; Mostafa, R.; Ali, M.A.; et al. A Review on the Efficacy and Toxicity of Different Doxorubicin Nanoparticles for Targeted Therapy in Metastatic Breast Cancer. Biomed. Pharmacother. 2017, 95, 1209–1218. [Google Scholar] [CrossRef] [PubMed]
- Thambugala, K.M.; Hyde, K.D.; Tanaka, K.; Tian, Q.; Wanasinghe, D.N.; Ariyawansa, H.A.; Jayasiri, S.C.; Boonmee, S.; Camporesi, E.; Hashimoto, A.; et al. Towards a Natural Classification and Backbone Tree for Lophiostomataceae, Floricolaceae, and Amorosiaceae fam. nov. Fungal Divers. 2015, 74, 199–266. [Google Scholar] [CrossRef]
- Nguyen, M.-P.; Lehosmaa, K.; Martz, F.; Koskimäki, J.J.; Pirttilä, A.M.; Häggman, H. Host Species Shape the Community Structure of Culturable Endophytes in Fruits of Wild Berry Species (Vaccinium myrtillus L., Empetrum nigrum L. and Vaccinium vitis-Idaea L.). FEMS Microbiol. Ecol. 2021, 97, fiab097. [Google Scholar] [CrossRef]
- Kolařík, M.; Vrublevskaya, M.; Kajzrová, S.; Kulišová, M.; Kolouchová, I.J. Taxonomic Analysis Reveals Host Preference of Rare Fungi in Endophytes of Vitis vinifera from the Czech Republic. Folia Microbiol. 2023, 68, 961–975. [Google Scholar] [CrossRef]
- de Silva, N.; Hyde, K.; Lumyong, S.; Phillips, A.; Bhat, D.; Maharachchikumbura, S.; Thambugala, K.; Tennakoon, D.; Suwannarach, N.; Karunarathna, S. Morphology, Phylogeny, Host Association and Geography of Fungi Associated with Plants of Annonaceae, Apocynaceae and Magnoliaceae. Mycosphere 2022, 13, 955–1076. [Google Scholar] [CrossRef]
- Nicoletti, R.; Zimowska, B. Endophytic Fungi of Hazelnut (Corylus avellana). Plant Prot. Sci. 2023, 59, 107–123. [Google Scholar] [CrossRef]
- Nagarajan, R.; Narshimhachari, N.; Kadkol, M.V.; Gopalkrishnan, K.S. Structure of Herbarin. J. Antibiot. 1971, 24, 249–252. [Google Scholar] [CrossRef] [PubMed]
- Paranagama, P.A.; Wijeratne, E.M.K.; Burns, A.M.; Marron, M.T.; Gunatilaka, M.K.; Arnold, A.E.; Gunatilaka, A.A.L. Heptaketides from Corynespora Sp. Inhabiting the Cavern Beard Lichen, Usnea cavernosa: First Report of Metabolites of an Endolichenic Fungus. J. Nat. Prod. 2007, 70, 1700–1705. [Google Scholar] [CrossRef] [PubMed]
- Van Wagoner, R.M.; Mantle, P.G.; Wright, J.L.C. Biosynthesis of Scorpinone, a 2-Azaanthraquinone from Amorosia littoralis, a Fungus from Marine Sediment. J. Nat. Prod. 2008, 71, 426–430. [Google Scholar] [CrossRef] [PubMed]
- Coombe, R.; Lowe, H.; Watson, T. Fungal Metabolites. I. Chromone and Naphthoquinone Metabolites from a Cylindrocarpon Species. Aust. J. Chem. 1972, 25, 875. [Google Scholar] [CrossRef]
- Coombe, R. Fungal Metabolites. III. The Synthesis of a Derivative of a 1,4-Naphthoquinone Fungal Pigment. Aust. J. Chem. 1974, 27, 1327. [Google Scholar] [CrossRef]
- Opatz, T.; Kolshorn, H.; Thines, E.; Anke, H. Ascomycones A−C, Heptaketide Metabolites from an Unidentified Ascomycete. J. Nat. Prod. 2008, 71, 1973–1976. [Google Scholar] [CrossRef]
- Prinsep, M.R.; Blunt, J.W.; Munro, M.H.G. New Cytotoxic β-Carboline Alkaloids from the Marine Bryozoan, Cribricellina cribraria. J. Nat. Prod. 1991, 54, 1068–1076. [Google Scholar] [CrossRef] [PubMed]
- Fischbach, C.; Chen, R.; Matsumoto, T.; Schmelzle, T.; Brugge, J.S.; Polverini, P.J.; Mooney, D.J. Engineering Tumors with 3D Scaffolds. Nat. Methods 2007, 4, 855–860. [Google Scholar] [CrossRef]
- Nath, S.; Devi, G.R. Three-Dimensional Culture Systems in Cancer Research: Focus on Tumor Spheroid Model. Pharmacol. Ther. 2016, 163, 94–108. [Google Scholar] [CrossRef] [PubMed]
- Imamura, Y.; Mukohara, T.; Shimono, Y.; Funakoshi, Y.; Chayahara, N.; Toyoda, M.; Kiyota, N.; Takao, S.; Kono, S.; Nakatsura, T.; et al. Comparison of 2D- and 3D-Culture Models as Drug-Testing Platforms in Breast Cancer. Oncol. Rep. 2015, 33, 1837–1843. [Google Scholar] [CrossRef] [PubMed]
- Pinto, B.; Henriques, A.C.; Silva, P.M.A.; Bousbaa, H. Three-Dimensional Spheroids as In Vitro Preclinical Models for Cancer Research. Pharmaceutics 2020, 12, 1186. [Google Scholar] [CrossRef]
- Sirenko, O.; Mitlo, T.; Hesley, J.; Luke, S.; Owens, W.; Cromwell, E.F. High-Content Assays for Characterizing the Viability and Morphology of 3D Cancer Spheroid Cultures. Assay Drug Dev. Technol. 2015, 13, 402–414. [Google Scholar] [CrossRef] [PubMed]
- Zhuang, P.; Chiang, Y.-H.; Fernanda, M.S.; He, M. Using Spheroids as Building Blocks Towards 3D Bioprinting of Tumor Microenvironment. Int. J. Bioprint. 2021, 7, 444. [Google Scholar] [CrossRef]
- Liao, W.; Yang, W.; Xu, J.; Yan, Z.; Pan, M.; Xu, X.; Zhou, S.; Zhu, Y.; Lan, J.; Zeng, M.; et al. Therapeutic Potential of CUDC-907 (Fimepinostat) for Hepatocarcinoma Treatment Revealed by Tumor Spheroids-Based Drug Screening. Front. Pharmacol. 2021, 12, 658197. [Google Scholar] [CrossRef]
- Bickle, M. The Beautiful Cell: High-Content Screening in Drug Discovery. Anal. Bioanal. Chem. 2010, 398, 219–226. [Google Scholar] [CrossRef]
- Cautain, B.; de Pedro, N.; Murillo Garzón, V.; Muñoz de Escalona, M.; González Menéndez, V.; Tormo, J.R.; Martin, J.; El Aouad, N.; Reyes, F.; Asensio, F.; et al. High-Content Screening of Natural Products Reveals Novel Nuclear Export Inhibitors. J. Biomol. Screen. 2014, 19, 57–65. [Google Scholar] [CrossRef]
- Sebak, M.; Molham, F.; Greco, C.; Tammam, M.A.; Sobeh, M.; El-Demerdash, A. Chemical Diversity, Medicinal Potentialities, Biosynthesis, and Pharmacokinetics of Anthraquinones and Their Congeners Derived from Marine Fungi: A Comprehensive Update. RSC Adv. 2022, 12, 24887–24921. [Google Scholar] [CrossRef] [PubMed]
- Tammam, M.A.; Sebak, M.; Greco, C.; Kijjoa, A.; El-Demerdash, A. Chemical Diversity, Biological Activities and Biosynthesis of Fungal Naphthoquinones and Their Derivatives: A Comprehensive Update. J. Mol. Struct. 2022, 1268, 133711. [Google Scholar] [CrossRef]
- Dang Thi, T.A.; Vu Thi, T.H.; Thi Phuong, H.; Ha Nguyen, T.; Pham The, C.; Vu Duc, C.; Depetter, Y.; Van Nguyen, T.; D’hooghe, M. Synthesis and Anticancer Properties of New (Dihydro)Pyranonaphthoquinones and Their Epoxy Analogs. Bioorg. Med. Chem. Lett. 2015, 25, 3355–3358. [Google Scholar] [CrossRef] [PubMed]
- Osman, M.E.; El-Beih, A.A.; Khatab, O.-K.H.; Moghannem, S.A.M.; Abdullah, N.H. Production of Herbarin and Dehydroherbarin by Endophytic Chaetosphaeronema Sp. (KY321184) Isolated from Nepeta Septemcrenata and Evaluation of Their Bioactivities. S. Afr. J. Bot. 2018, 117, 174–183. [Google Scholar] [CrossRef]
- Bray, M.-A.; Singh, S.; Han, H.; Davis, C.T.; Borgeson, B.; Hartland, C.; Kost-Alimova, M.; Gustafsdottir, S.M.; Gibson, C.C.; Carpenter, A.E. Cell Painting, a High-Content Image-Based Assay for Morphological Profiling Using Multiplexed Fluorescent Dyes. Nat. Protoc. 2016, 11, 1757–1774. [Google Scholar] [CrossRef] [PubMed]
- Lee, M.H.; Lapidus, R.G.; Ferraris, D.; Emadi, A. Analysis of the Mechanisms of Action of Naphthoquinone-Based Anti-Acute Myeloid Leukemia Chemotherapeutics. Molecules 2019, 24, 3121. [Google Scholar] [CrossRef] [PubMed]
- Gottlieb, J.; Linehan, J.; Murray, K.S. Advances in Chemoablation in Upper Tract Urothelial Carcinoma: Overview of Indications and Treatment Patterns. Transl. Androl. Urol. 2023, 12, 1449–1455. [Google Scholar] [CrossRef] [PubMed]
- González-Menéndez, V.; Crespo, G.; de Pedro, N.; Diaz, C.; Martín, J.; Serrano, R.; Mackenzie, T.A.; Justicia, C.; González-Tejero, M.R.; Casares, M.; et al. Fungal Endophytes from Arid Areas of Andalusia: High Potential Sources for Antifungal and Antitumoral Agents. Sci. Rep. 2018, 8, 9729. [Google Scholar] [CrossRef]
- Gonzalez-Menendez, V.; Martin, J.; Siles, J.A.; Gonzalez-Tejero, M.R.; Reyes, F.; Platas, G.; Tormo, J.R.; Genilloud, O. Biodiversity and Chemotaxonomy of Preussia Isolates from the Iberian Peninsula. Mycol. Prog. 2017, 16, 713–728. [Google Scholar] [CrossRef]
- Blaxter, M.; Mann, J.; Chapman, T.; Thomas, F.; Whitton, C.; Floyd, R.; Abebe, E. Defining Operational Taxonomic Units Using DNA Barcode Data. Philos. Trans. R. Soc. B Biol. Sci. 2005, 360, 1935–1943. [Google Scholar] [CrossRef]
- Hofstetter, V.; Buyck, B.; Eyssartier, G.; Schnee, S.; Gindro, K. The Unbearable Lightness of Sequenced-Based Identification. Fungal Divers. 2019, 96, 243–284. [Google Scholar] [CrossRef]
- Pérez-Victoria, I.; Martín, J.; Reyes, F. Combined LC/UV/MS and NMR Strategies for the Dereplication of Marine Natural Products. Planta Med. 2016, 82, 857–871. [Google Scholar] [CrossRef] [PubMed]
- Guo, Y.; Ghidinelli, S.; de la Cruz, M.; Mackenzie, T.A.; Ramos, M.C.; Sánchez, P.; Vicente, F.; Genilloud, O.; Larsen, T.O. Oxepinamides L and M, Two New Oxepine-Pyrimidinone-Ketopiperazine Type Nonribosomal Peptides from Aspergillus californicus. Nat. Prod. Res. 2022, 36, 2043–2048. [Google Scholar] [CrossRef] [PubMed]
- Mackenzie, T.A.; Tormo, J.R.; Cautain, B.; Martínez, G.; Sánchez, I.; Genilloud, O.; Vicente, F.; Ramos, M.C. Acoustic Droplet Ejection Facilitates Cell-Based High-Throughput Screenings Using Natural Products. SLAS Technol. 2023, in press. [CrossRef]
- Wenzel, C.; Riefke, B.; Gründemann, S.; Krebs, A.; Christian, S.; Prinz, F.; Osterland, M.; Golfier, S.; Räse, S.; Ansari, N.; et al. 3D High-Content Screening for the Identification of Compounds That Target Cells in Dormant Tumor Spheroid Regions. Exp. Cell Res. 2014, 323, 131–143. [Google Scholar] [CrossRef]

| 2 | 3 | 4 | 5 | |||||
|---|---|---|---|---|---|---|---|---|
| Position | δH, mult, J | δC | δH, mult, J | δC | δH, mult, J | δC | δH, mult, J | δC |
| 1 | - | - | 6.39, d, 6.0 | 88.3 | 6.32, s | 87.8 | 10.45, s | 192.0 |
| 1-OH | - | 8.23, d, 6.4 | 7.50, brs | - | ||||
| 3 | 204.4 | 169.8 | 159.8 | 105.7 | ||||
| 4 | 3.51, s | 37.7 | 115.5 | 5.93, s | 92.3 | 198.9 | ||
| 4a | 115.0 | 133.7 | 123.9 | 106.6 | ||||
| 5 | 183.3 | 183.0 | 183.0 | 163.9 | ||||
| 5a | 135.9 | 136.4 | 134.8 | 129.1 | ||||
| 6 | 7.10, d, 1.7 | 104.5 | 7.02, d, 2.3 | 104.0 | 7.09, d, 2.3 | 103.8 | 7.10, brs | 95.7 |
| 7 | 165.1 | 164.6 | 163.8 | 162.0 | ||||
| 8 | 6.90, d, 1.7 | 102.6 | 6.98, d, 2.3 | 104.2 | 6.93, d, 2.3 | 104.5 | 6.99, brs | 103.7 |
| 9 | 162.2 | 161.4 | 161.4 | 163.5 | ||||
| 9a | 111.3 | 112.7 | 113.6 | 113.2 | ||||
| 10 | 177.3 | 178.4 | 179.7 | 160.9 | ||||
| 10a | 157.1 | 129.1 | 132.7 | 109.0 | ||||
| 1′ | 2.15, s | 29.6 | 2.39, s | 21.2 | 2.06, s | 20.5 | 1.57, s | 22.2 |
| 2′ | - | - | 3.56, s | 44.6 | - | - | - | - |
| 7-Ome | 3.93, s | 56.1 | 3.96, s | 56.2 | 3.92, s | 55.9 | 3.95, s | 56.3 |
| 9-Ome | 3.93, s | 56.6 | 3.91, s | 56.5 | 3.88, s | 56.4 | 3.98, s | 56.8 |
| Compound | MCF-7 (ED50 µM) | MIA PaCa-2 (ED50 µM) |
|---|---|---|
| 1 | 2.9 [2.0–4.1] 1 | >131 |
| 2 | >69 | >69 |
| 3 | 26.4 [24.3–28.7] 1 | >52 |
| 4 | 4.0 [3.9–4.2] 1 | >132 |
| 5 | 58.2 [53.7–63.1] 1 | >126 |
Disclaimer/Publisher’s Note: The statements, opinions and data contained in all publications are solely those of the individual author(s) and contributor(s) and not of MDPI and/or the editor(s). MDPI and/or the editor(s) disclaim responsibility for any injury to people or property resulting from any ideas, methods, instructions or products referred to in the content. |
© 2024 by the authors. Licensee MDPI, Basel, Switzerland. This article is an open access article distributed under the terms and conditions of the Creative Commons Attribution (CC BY) license (https://creativecommons.org/licenses/by/4.0/).
Share and Cite
Mackenzie, T.A.; Reyes, F.; Martínez, M.; González-Menéndez, V.; Sánchez, I.; Genilloud, O.; Tormo, J.R.; Ramos, M.C. Naphthoquinone Derivatives from Angustimassarina populi CF-097565 Display Anti-Tumour Activity in 3D Cultures of Breast Cancer Cells. Molecules 2024, 29, 425. https://doi.org/10.3390/molecules29020425
Mackenzie TA, Reyes F, Martínez M, González-Menéndez V, Sánchez I, Genilloud O, Tormo JR, Ramos MC. Naphthoquinone Derivatives from Angustimassarina populi CF-097565 Display Anti-Tumour Activity in 3D Cultures of Breast Cancer Cells. Molecules. 2024; 29(2):425. https://doi.org/10.3390/molecules29020425
Chicago/Turabian StyleMackenzie, Thomas A., Fernando Reyes, Marta Martínez, Víctor González-Menéndez, Isabel Sánchez, Olga Genilloud, José R. Tormo, and María C. Ramos. 2024. "Naphthoquinone Derivatives from Angustimassarina populi CF-097565 Display Anti-Tumour Activity in 3D Cultures of Breast Cancer Cells" Molecules 29, no. 2: 425. https://doi.org/10.3390/molecules29020425