
HPLC and LC–MS/MS-Based Quantitative Characterization of Related Substances Associated with Sotalol Hydrochloride

Abstract
:1. Introduction
2. Results and Discussion
2.1. HPLC Methodological Standardization and Validation
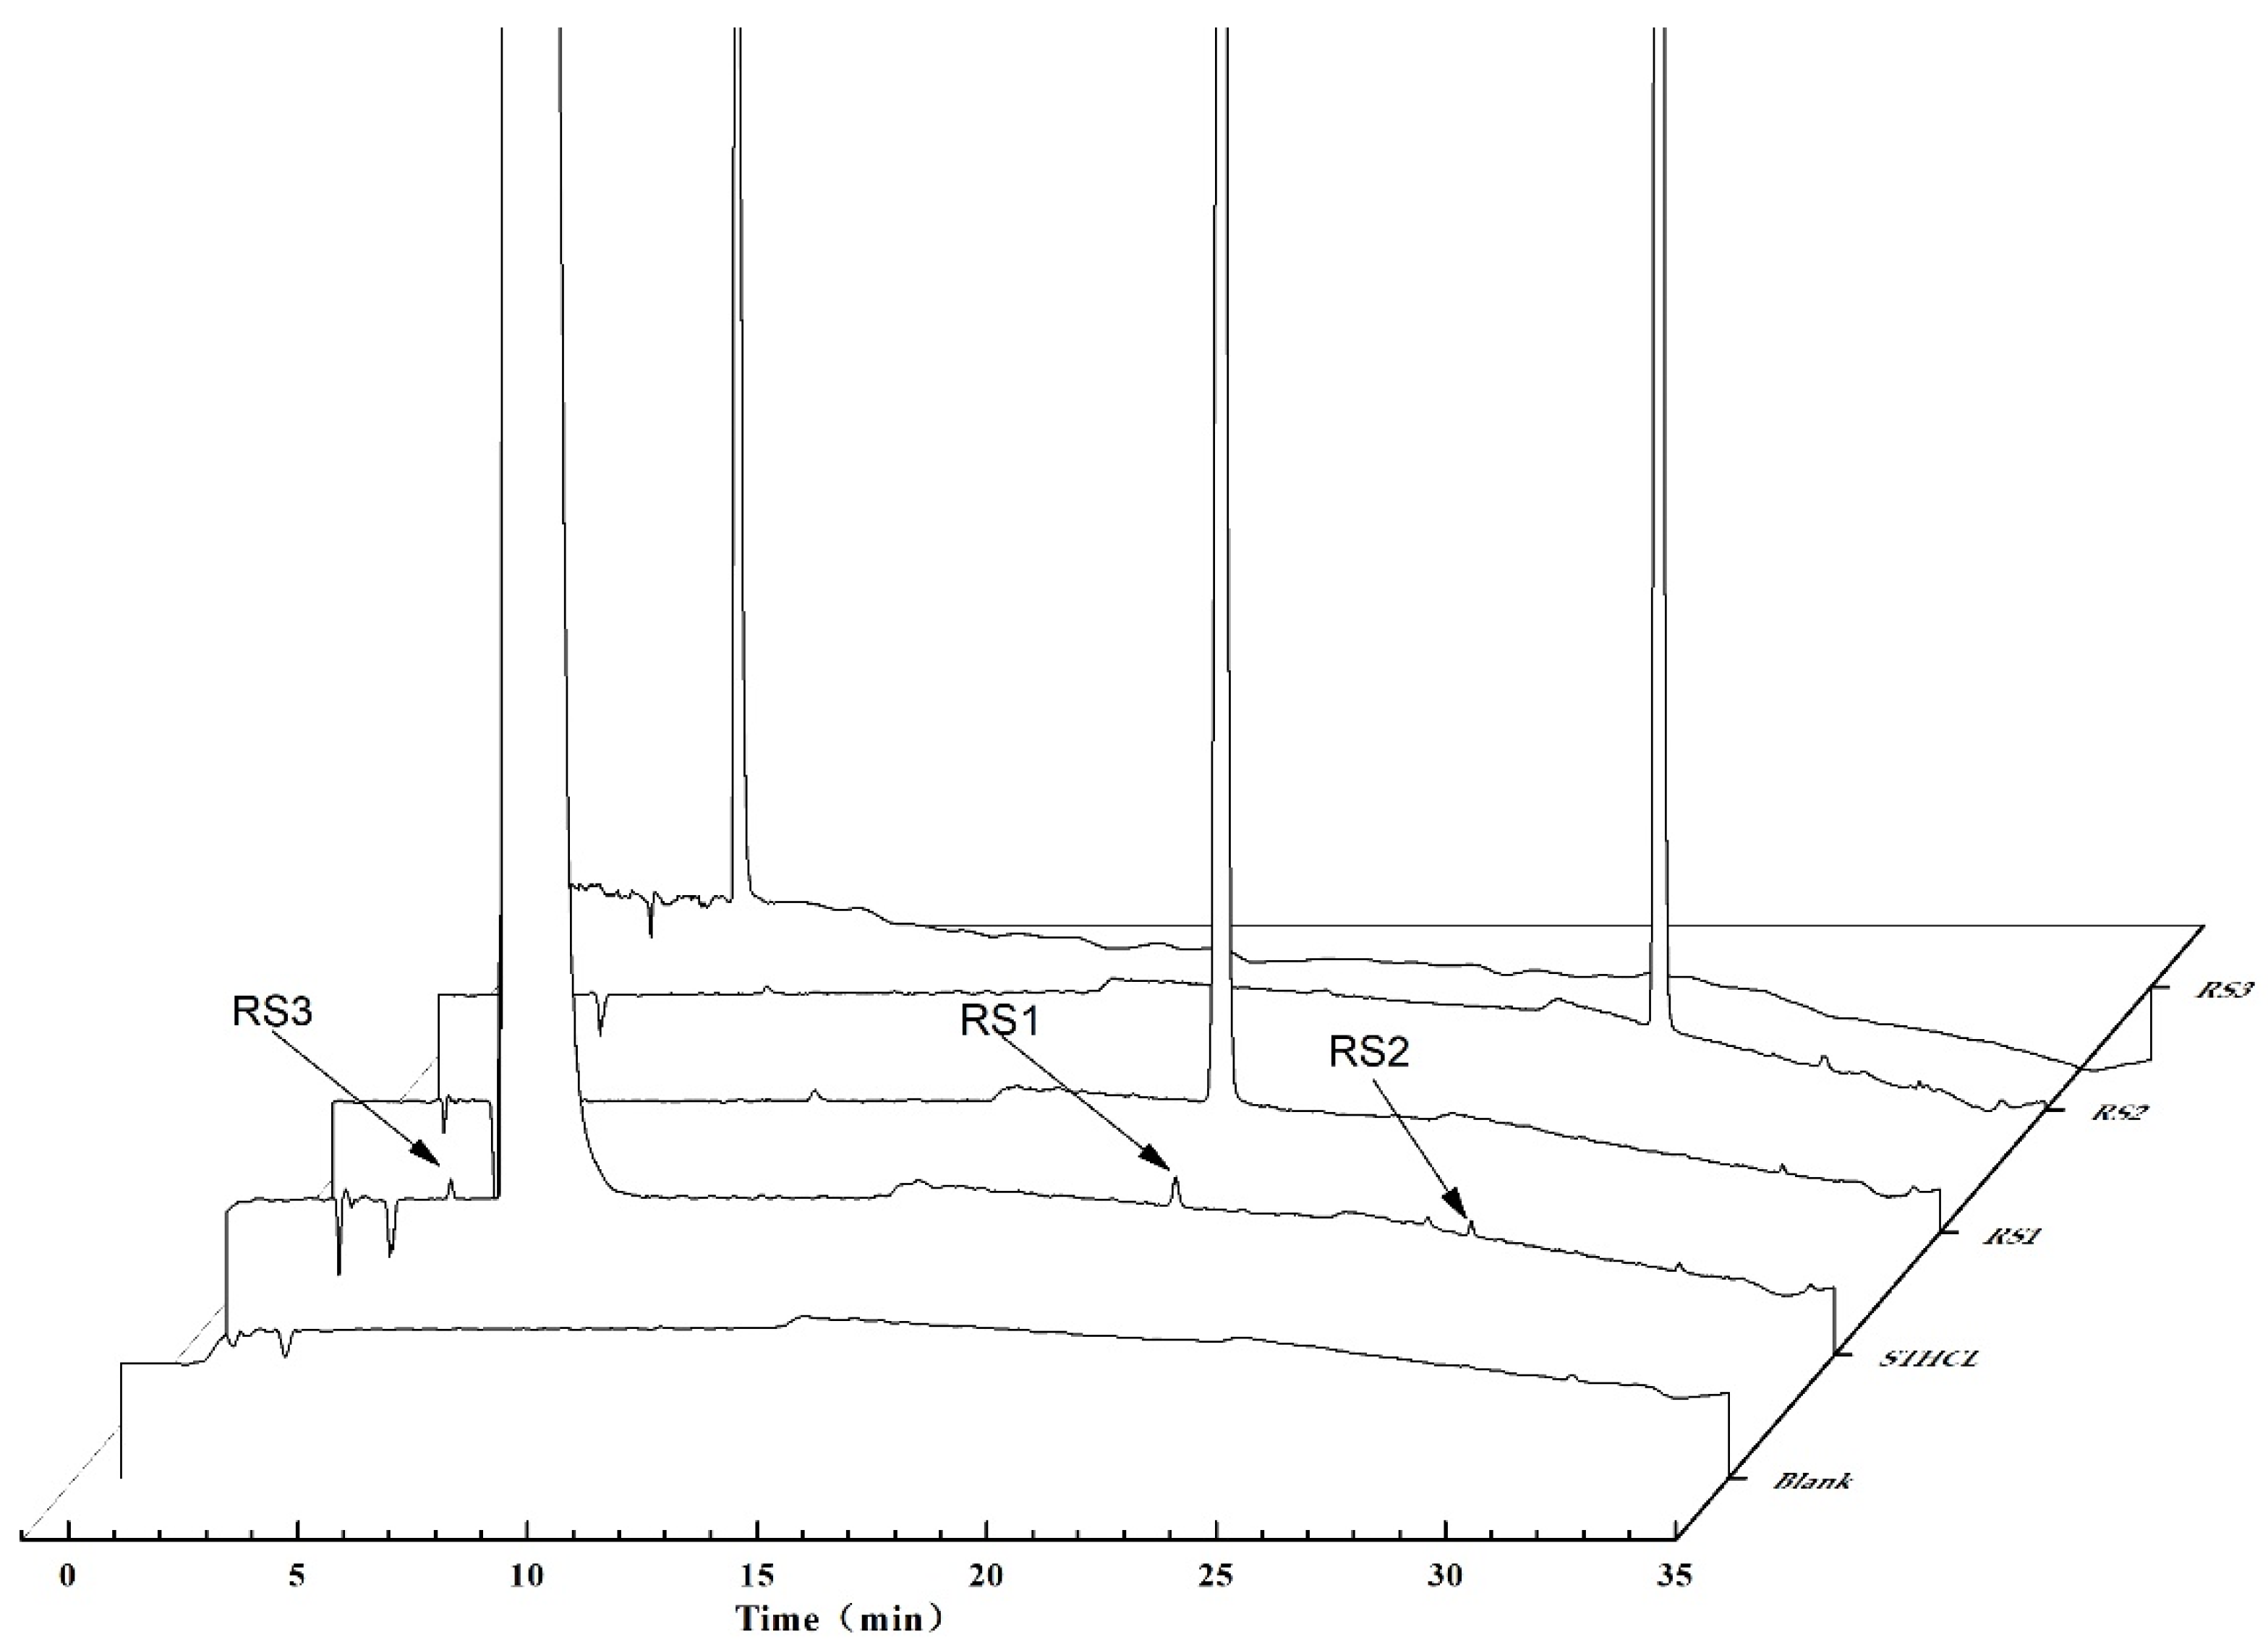
2.1.1. Specificity
2.1.2. Linearity
2.1.3. LOD and LOQ Testing
2.1.4. Accuracy and Precision
2.1.5. STHCl Solution Stability
2.1.6. Robustness
2.2. Commercial Sample Analyses
2.3. LC–MS and NMR Characterization of STHCl-Associated RSs
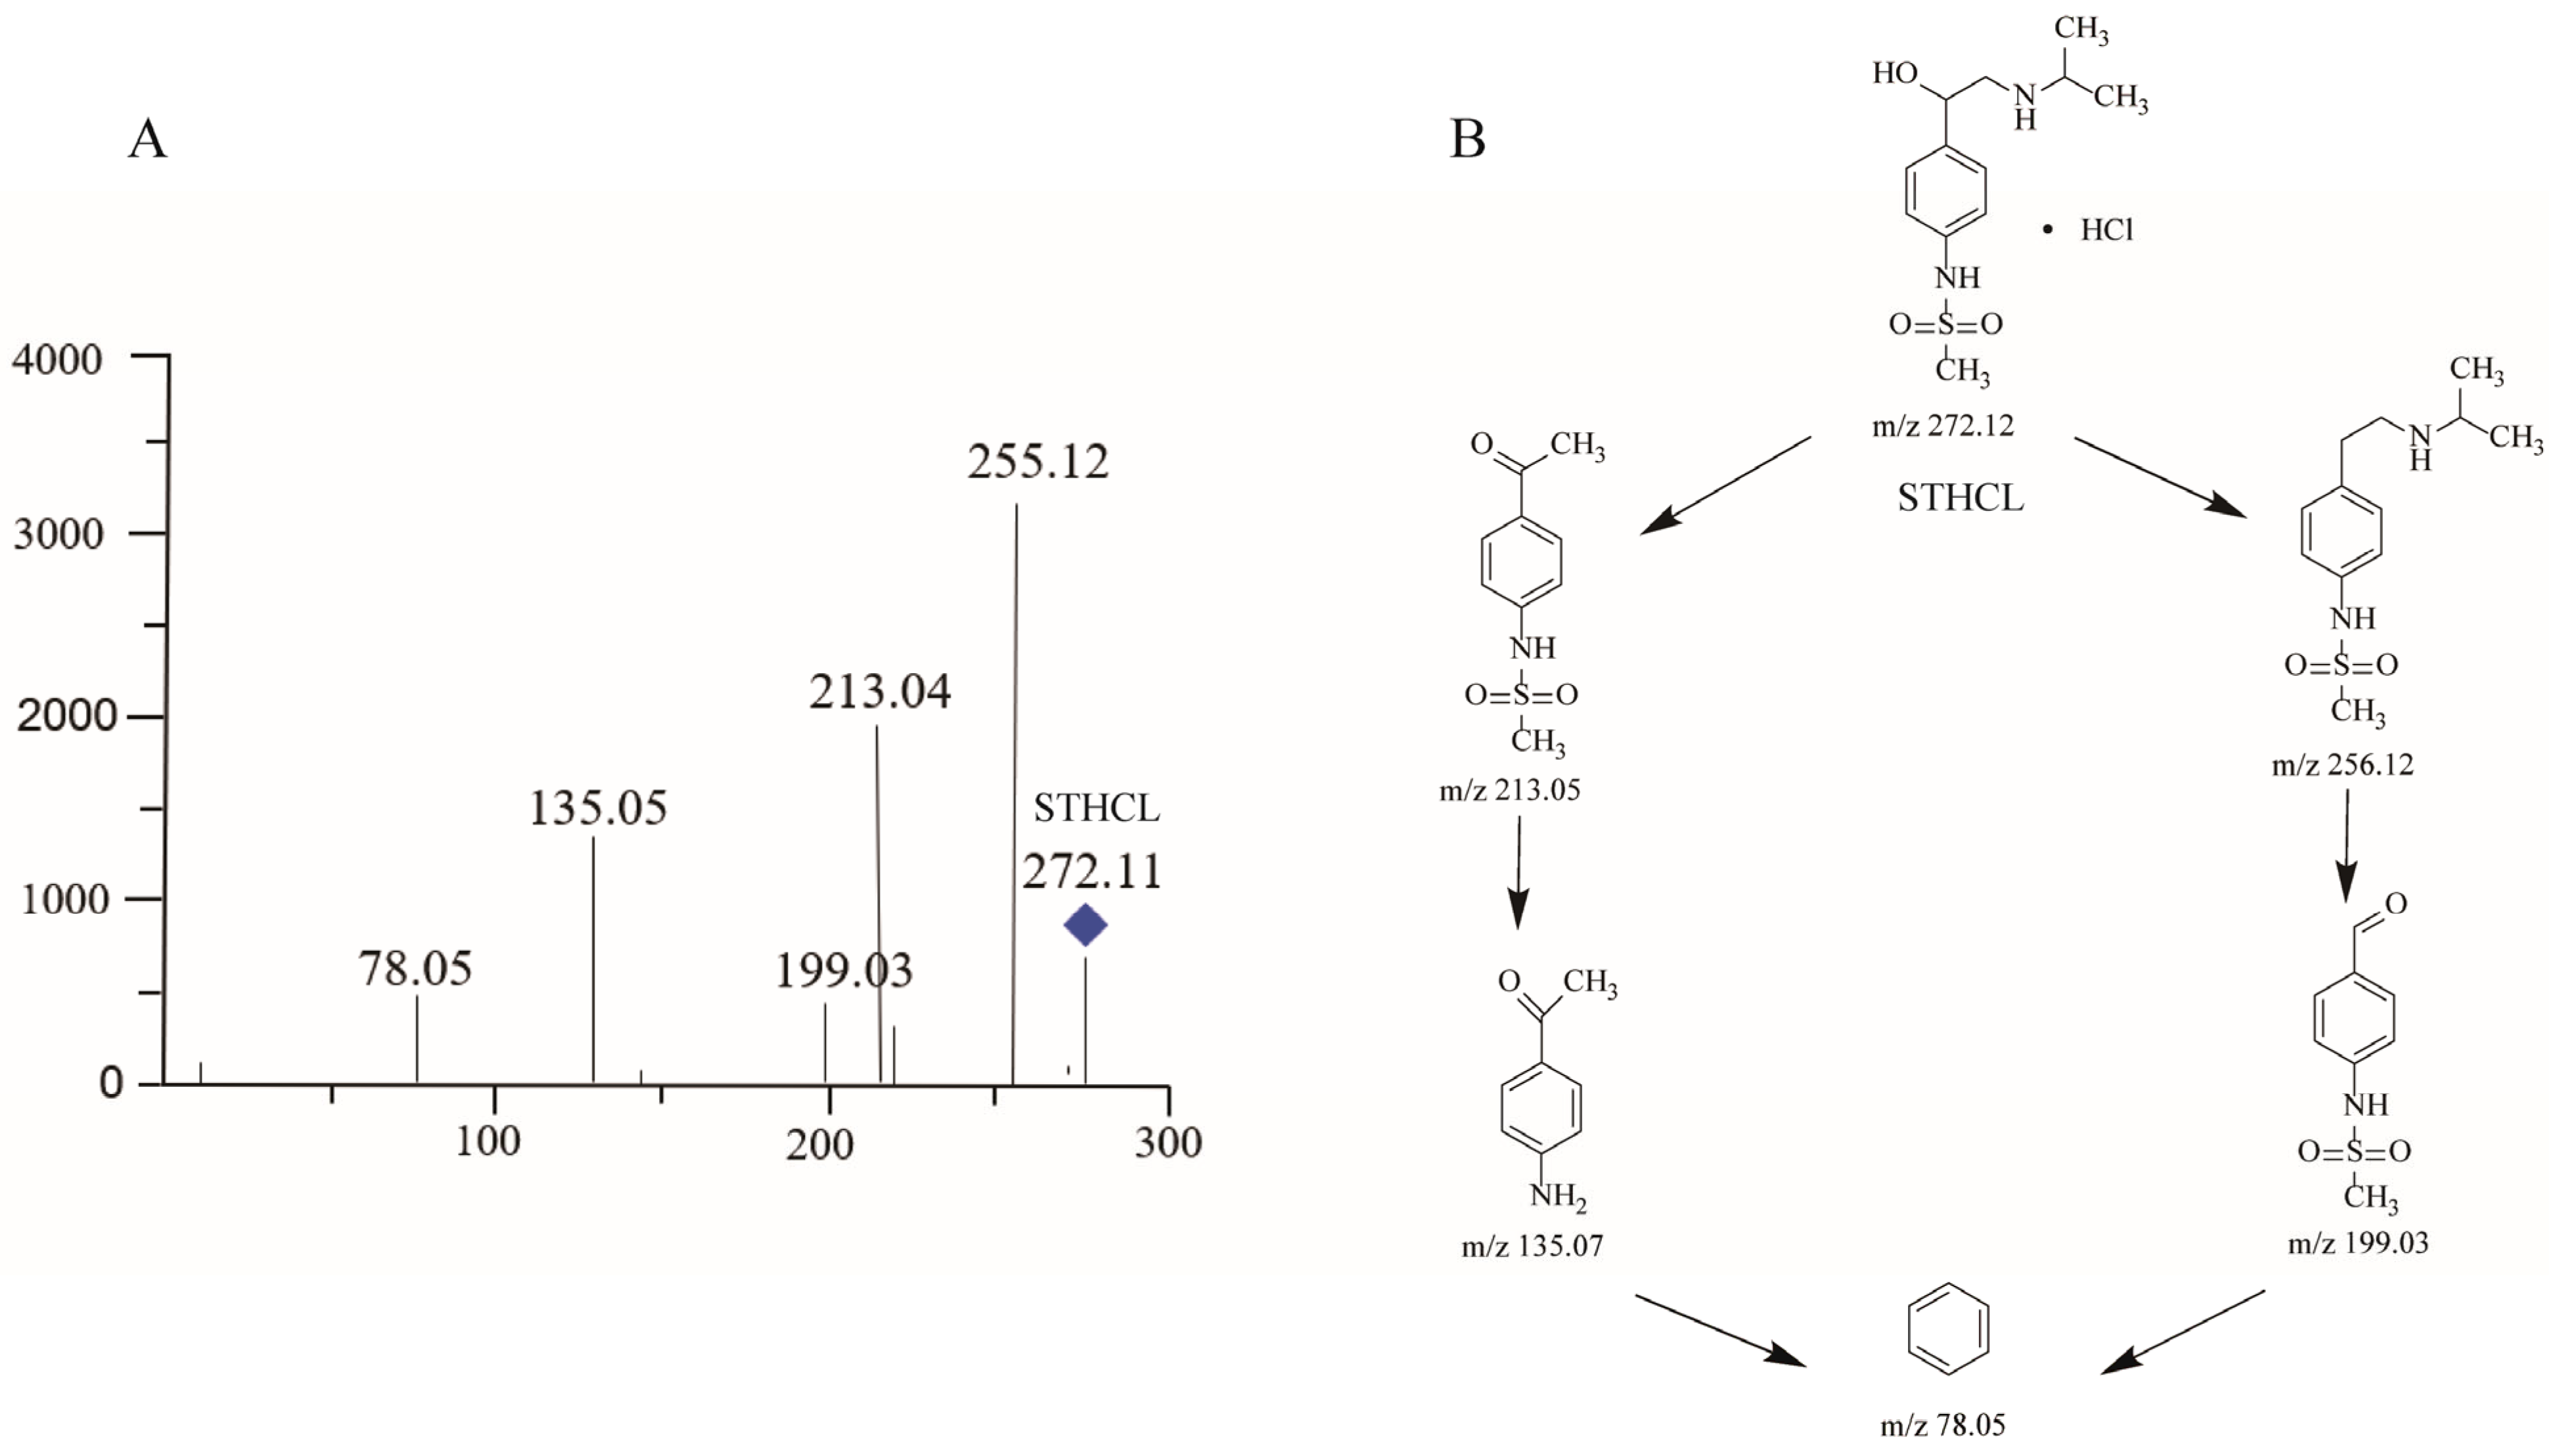
2.3.1. STHCl
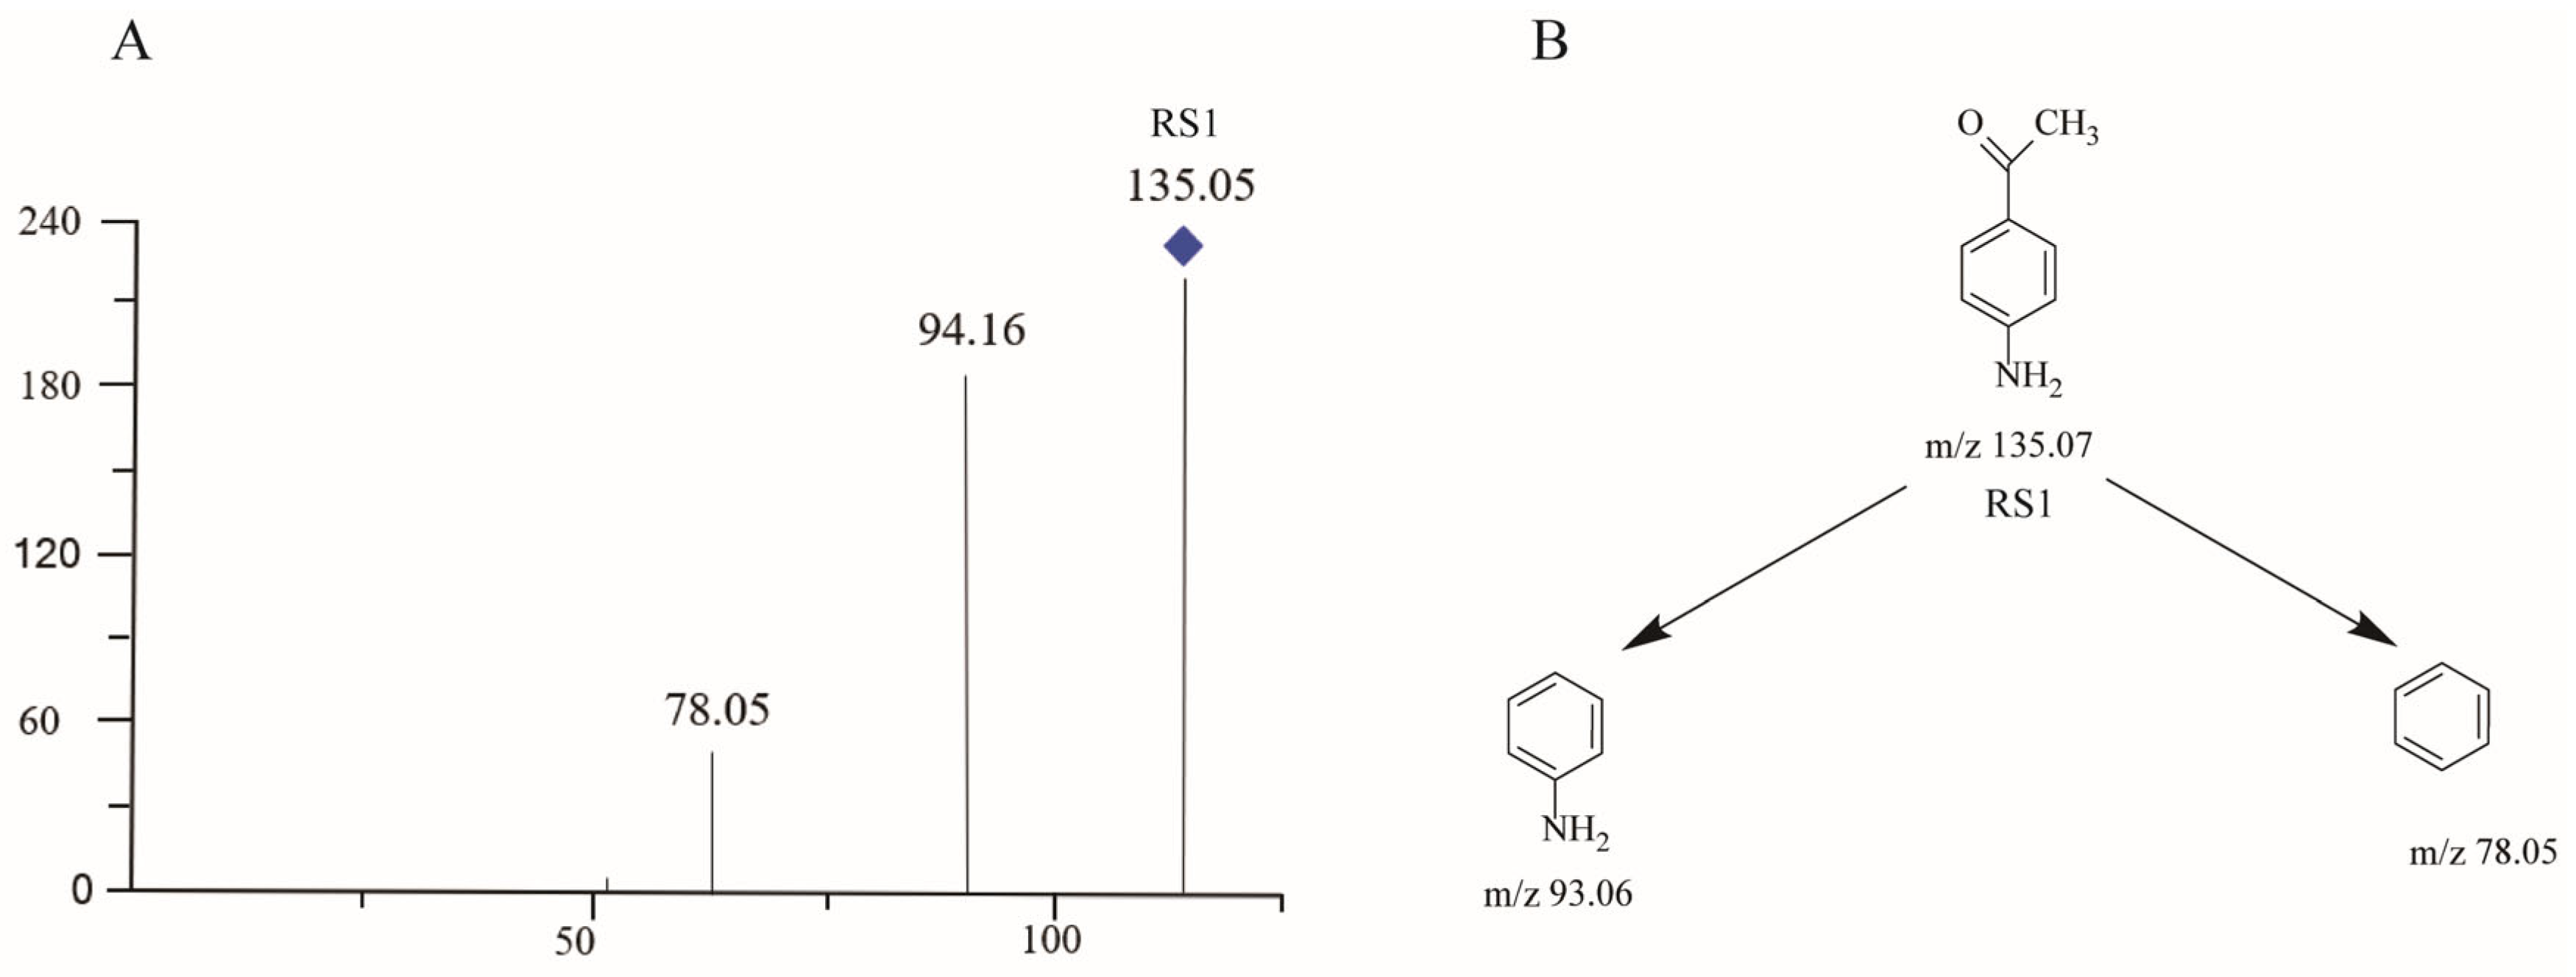
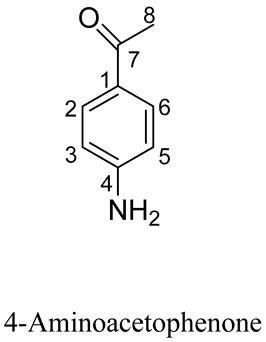
2.3.2. RS1
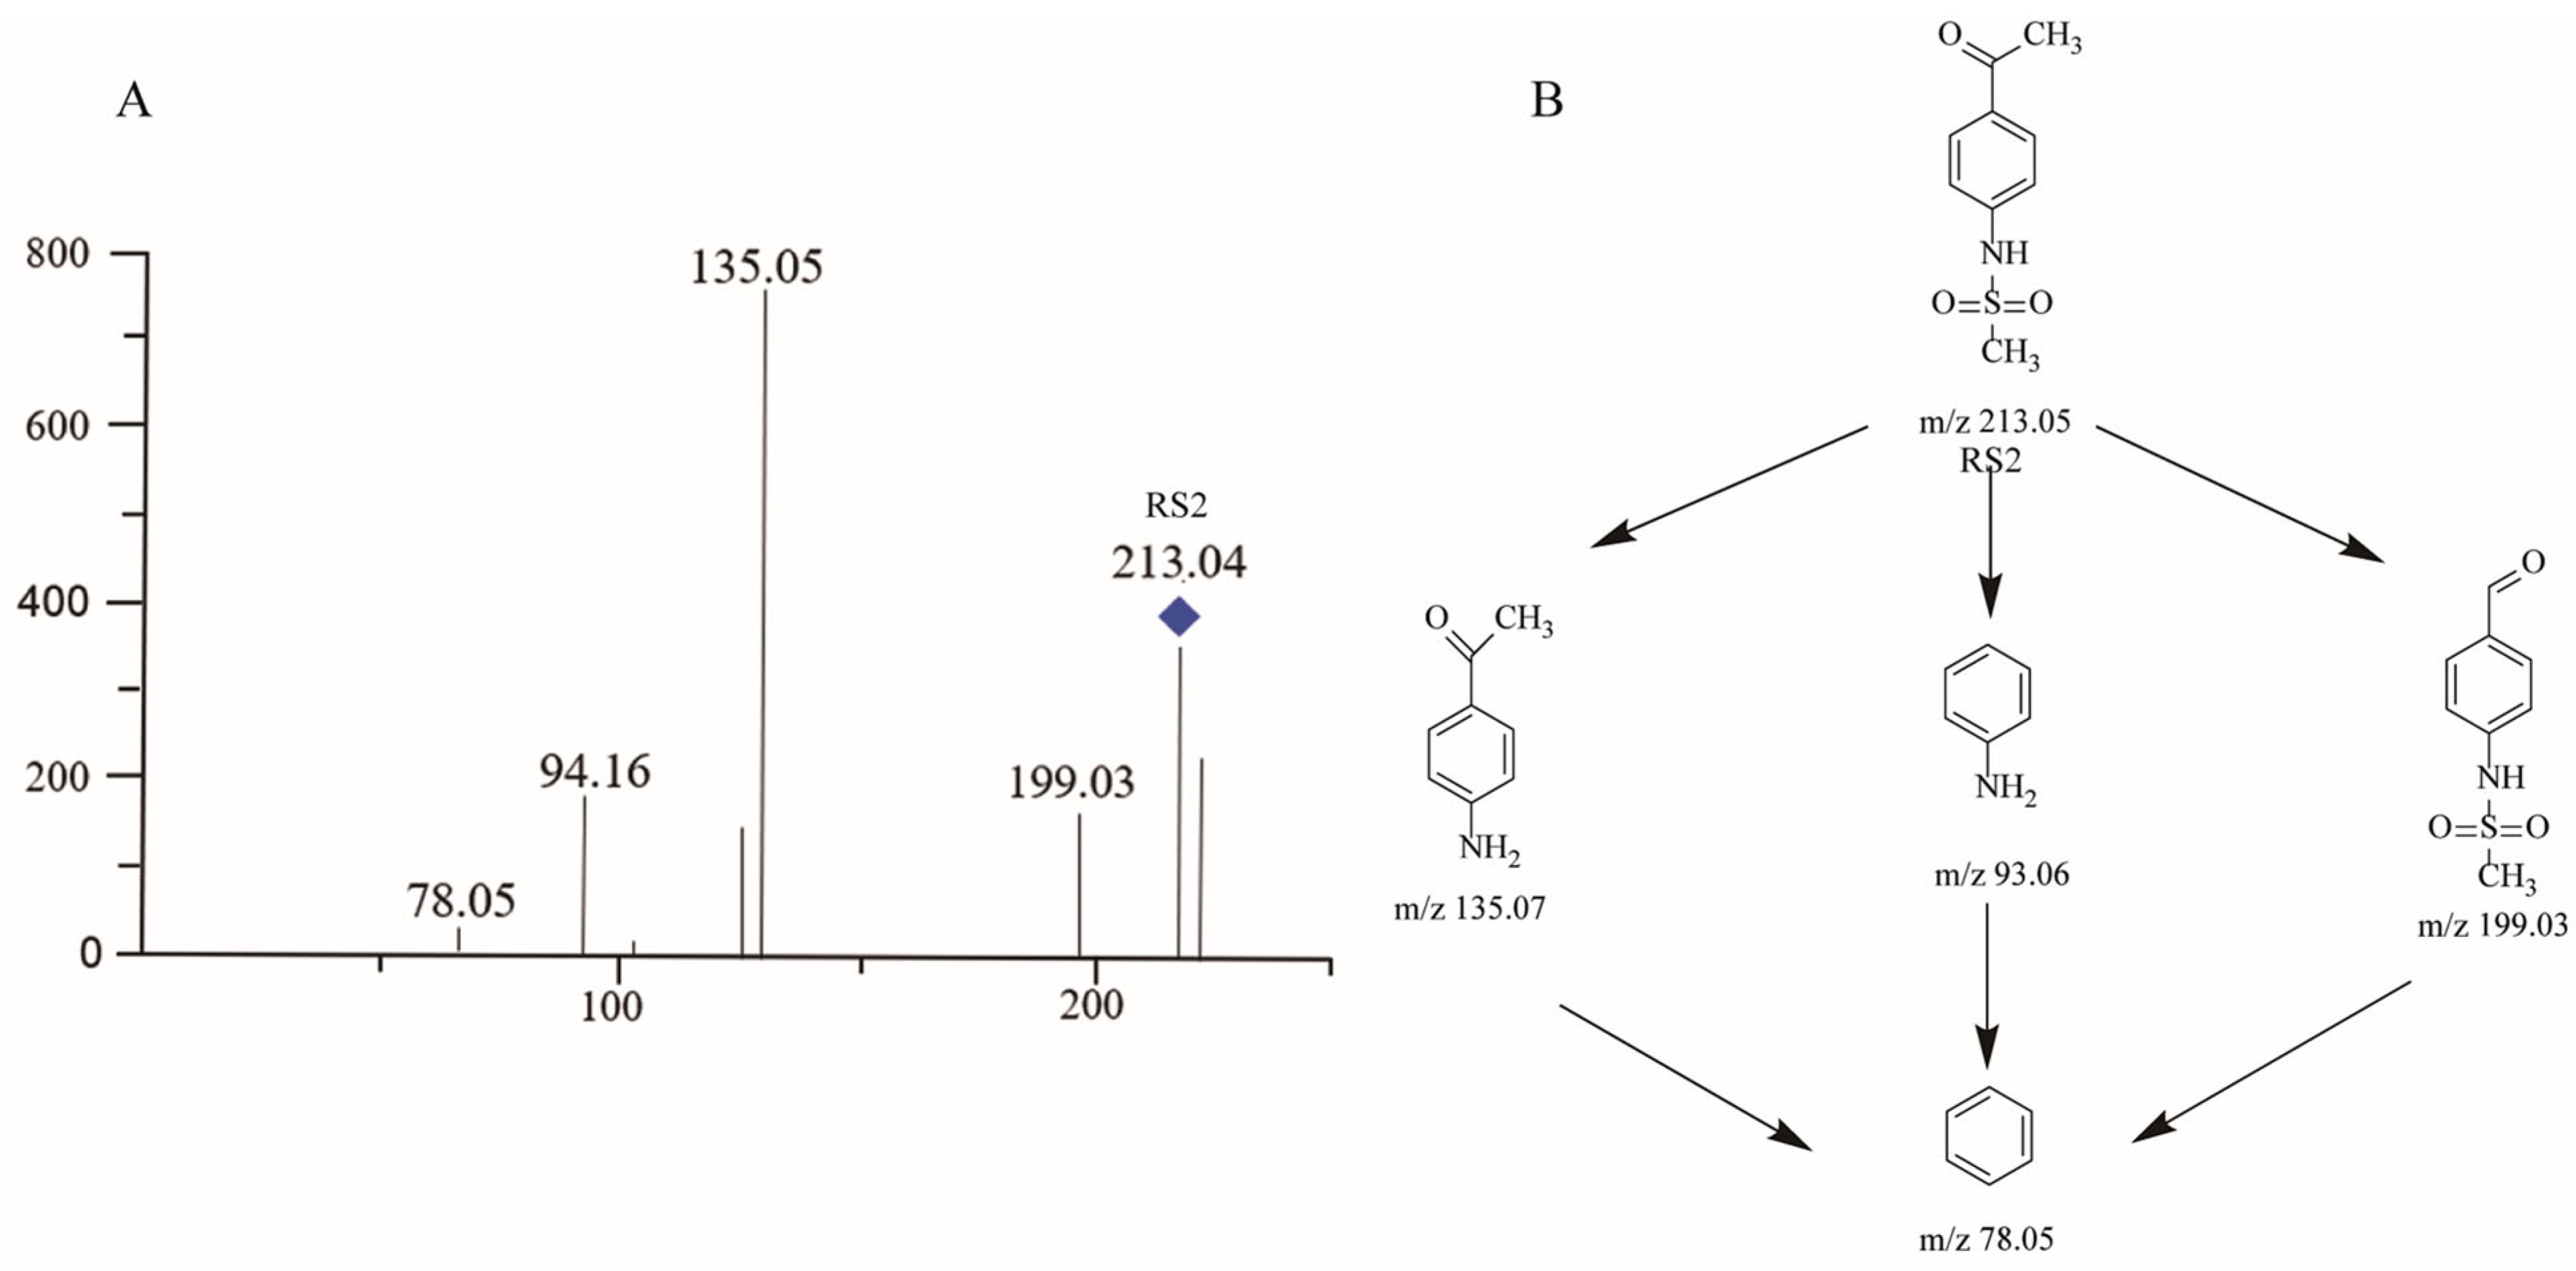
2.3.3. RS2
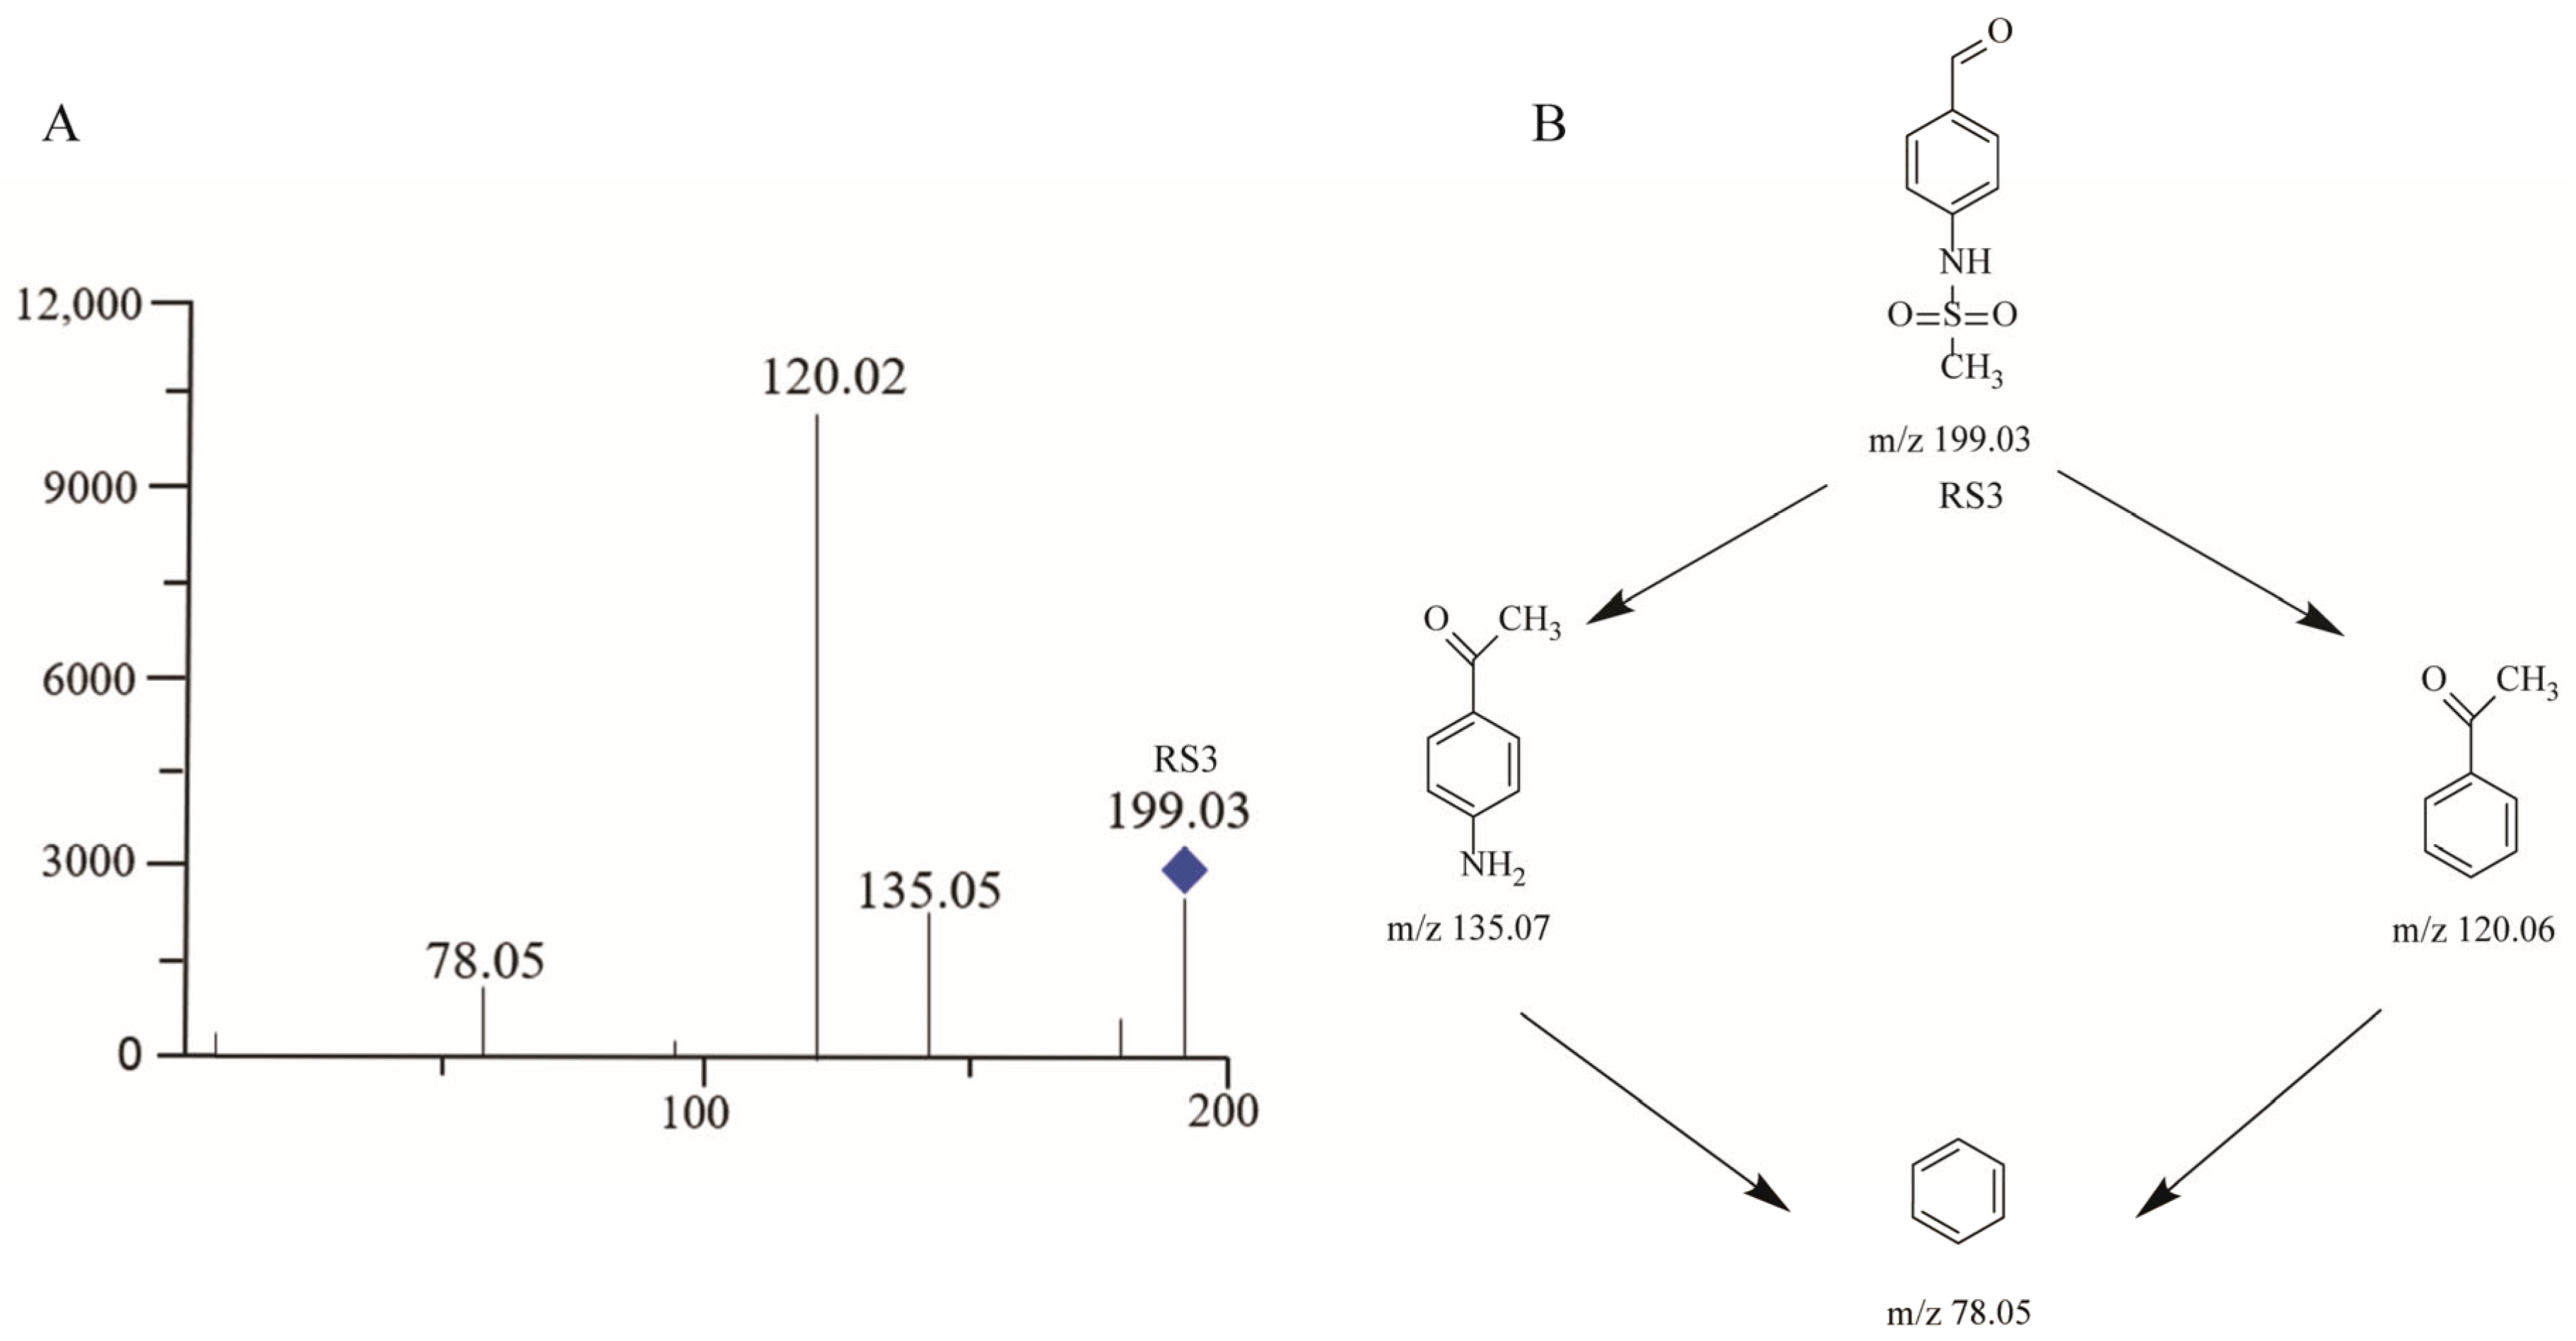
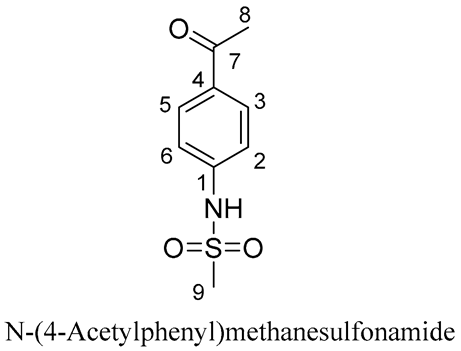
2.3.4. RS3
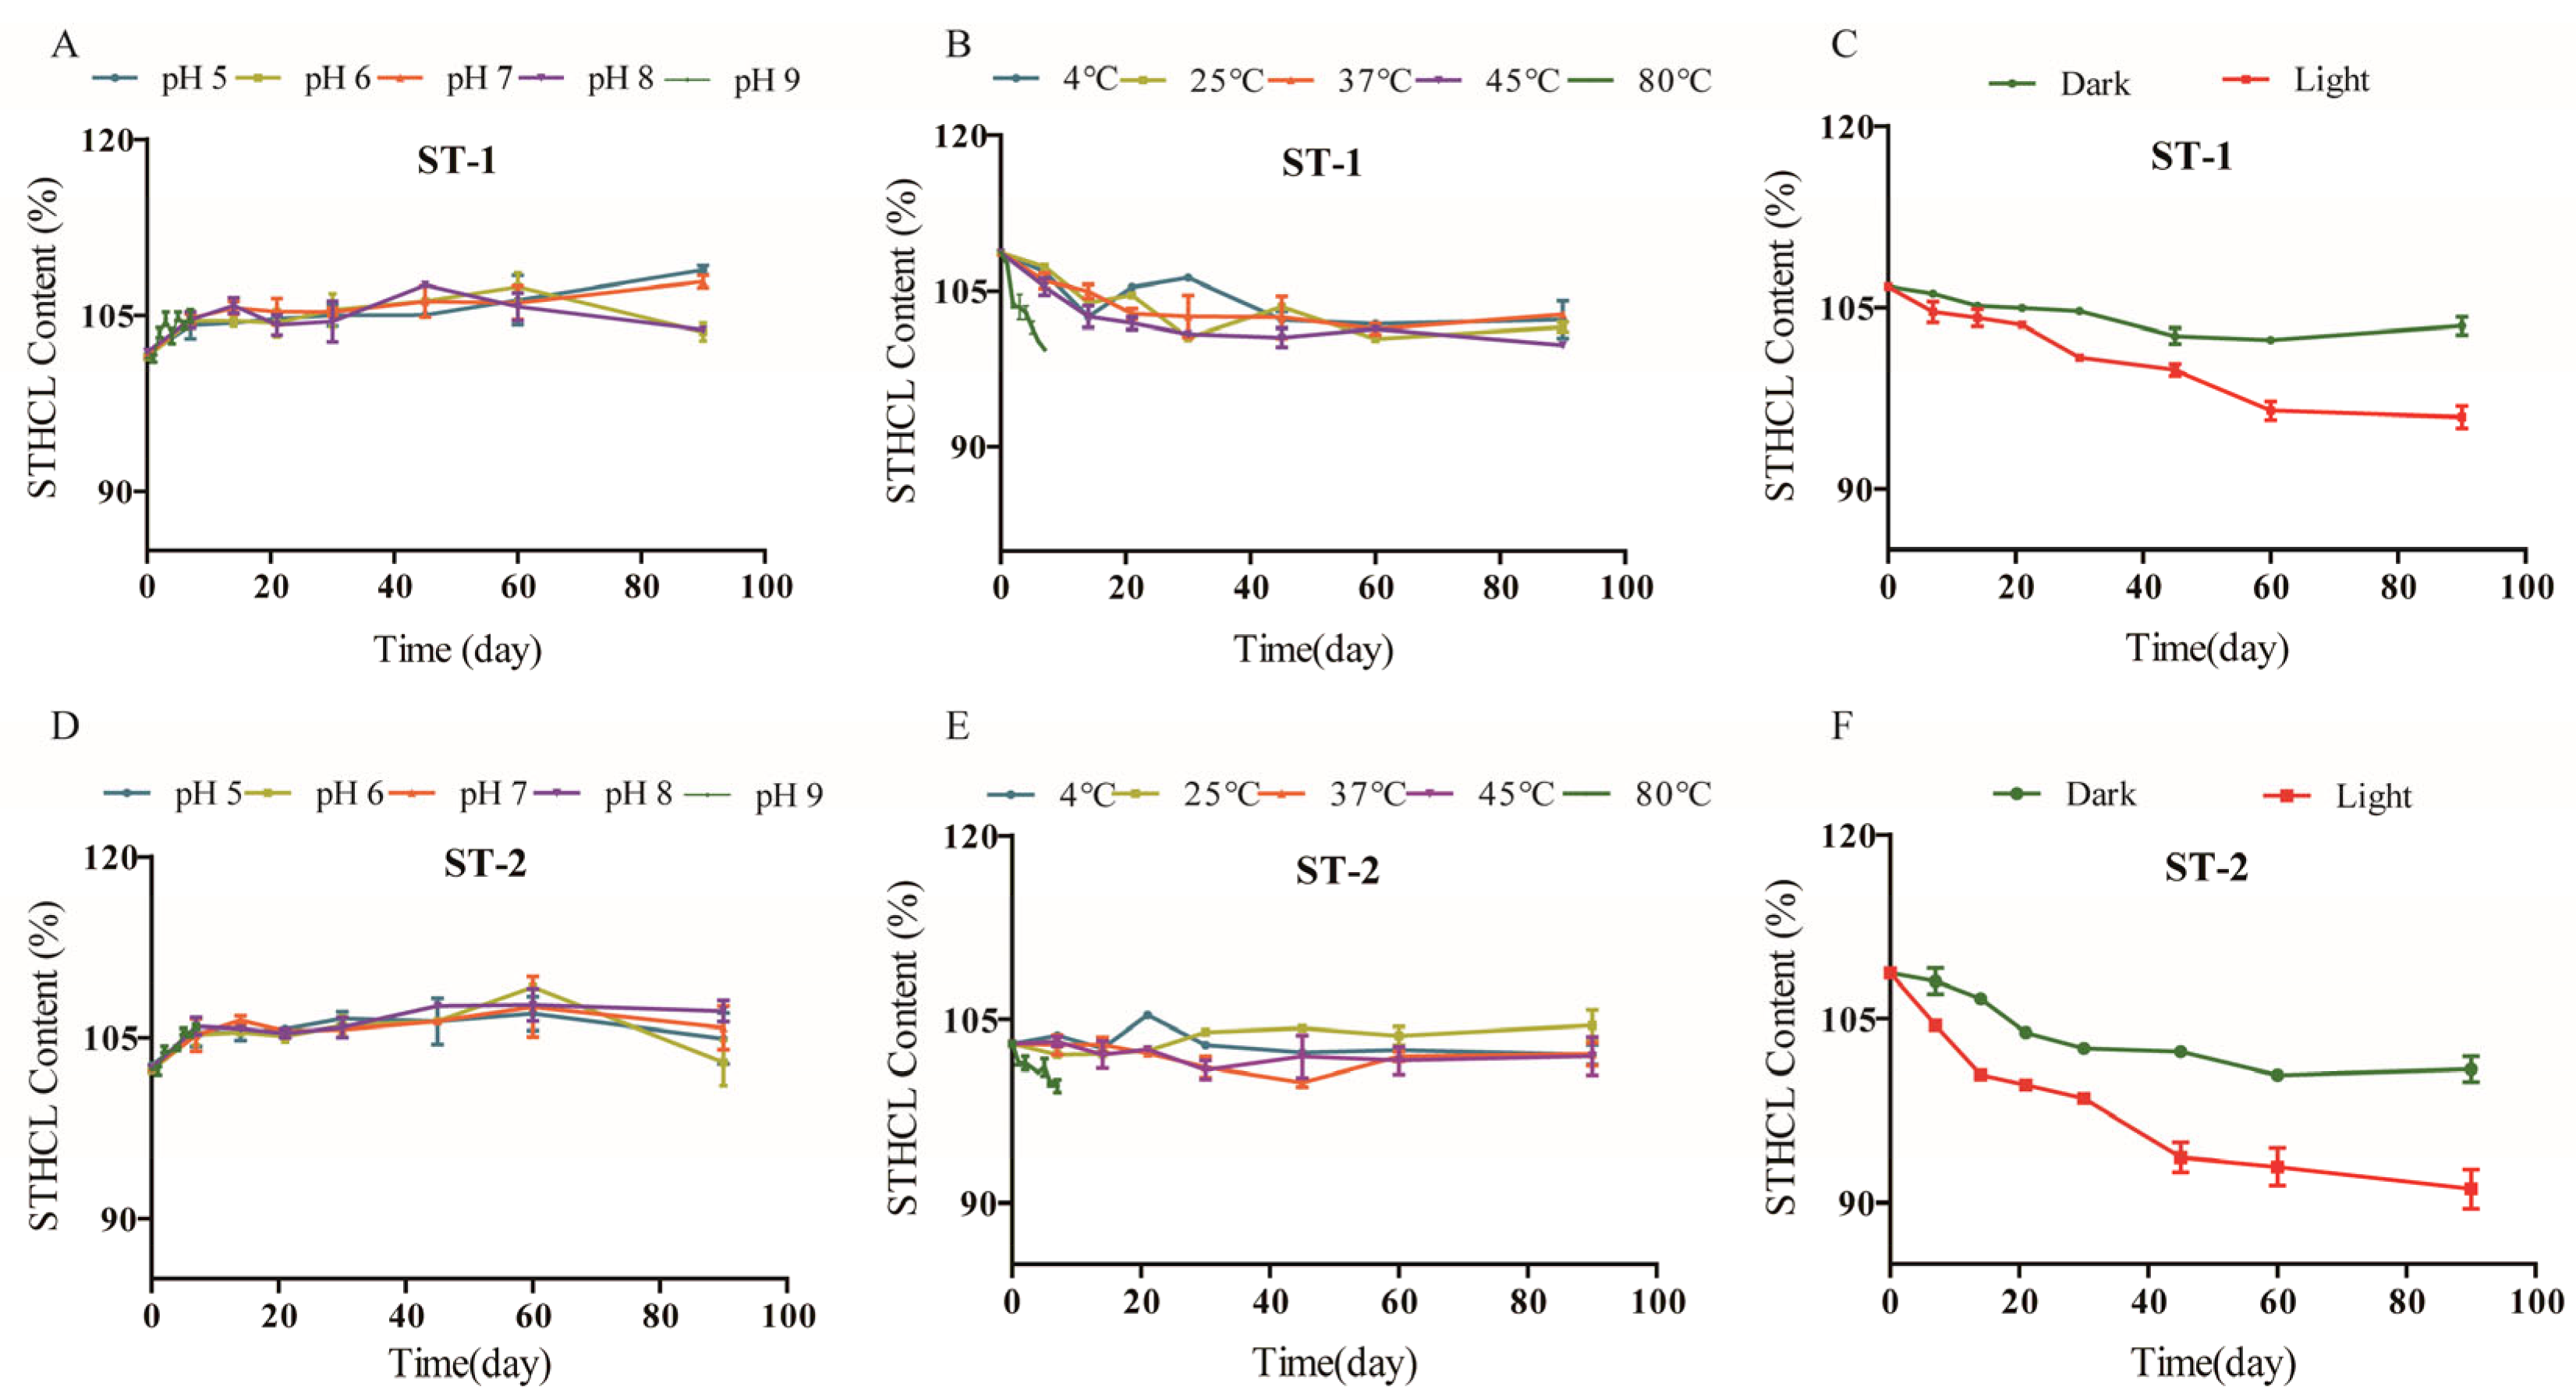
2.4. Forced Degradation and Long-Term Storage Analyses
2.5. Cytotoxicity and Acute Toxicity Analyses
3. Experimental Methods
3.1. Chemicals and Reagents
3.2. HPLC
3.2.1. Sample and Standard Preparation
3.2.2. Methodological Validation
Specificity
Sensitivity
Linearity and Range
Accuracy and Precision
Stability
Robustness
3.3. LC–MS/MS
3.4. Isolation and Identification
3.5. Forced Degradation and Long-Term Studies
3.6. Cytotoxicity Assays
3.7. Acute Toxicity Assays
3.8. Statistical Analysis
4. Conclusions
Supplementary Materials
Author Contributions
Funding
Institutional Review Board Statement
Informed Consent Statement
Data Availability Statement
Acknowledgments
Conflicts of Interest
References
- Mubarik, A.; Kerndt, C.C.; Cassagnol, M. Sotalol. In StatPearls; StatPearls Publishing: Treasure Island, FL, USA, 2023. [Google Scholar]
- National Institute of Child Health and Human Development. Drugs and Lactation Database (LactMed®); National Institute of Child Health and Human Development: Bethesda, MD, USA, 2006. [Google Scholar]
- Rochelson, E.; Gutierrez, M.; Valdés, S.O.; Lemming, K.; Howard, T.S.; Pham, T.D.N.; Miyake, C.Y.; Asadourian, V.; Patel, R.; Kim, J.J. Safety and Efficacy of Intravenous Sotalol Following Congenital Heart Surgery. JACC Clin. Electrophysiol. 2024, 10, 135–136. [Google Scholar] [CrossRef]
- Samanta, R.; Thiagalingam, A.; Turner, C.; Lakkireddy, D.J.; Kovoor, P. The Use of Intravenous Sotalol in Cardiac Arrhythmias. Heart Lung Circ. 2018, 27, 1318–1326. [Google Scholar] [CrossRef]
- Marcus, F.I. Risks of initiating therapy with sotalol for treatment of atrial fibrillation. J. Am. Coll. Cardiol. 1998, 32, 177–180. [Google Scholar] [PubMed]
- Singh, B.N.; Deedwania, P.; Nademanee, K.; Ward, A.; Sorkin, E.M. Soalol. Drugs 1987, 34, 311–349. [Google Scholar] [CrossRef]
- Augustin, N.; Alvarez, C.; Kluger, J. The Arrhythmogenicity of Sotalol and its Role in Heart Failure: A Literature Review. J. Cardiovasc. Pharmacol. 2023, 82, 86–92. [Google Scholar] [CrossRef]
- Läer, S.; Neumann, J.; Scholz, H.; Uebeler, P.; Zimmermann, N. Determination of sotalol in human cardiac tissue by high-performance liquid chromatography. J. Chromatogr. B Biomed. Appl. 1996, 681, 291–298. [Google Scholar] [CrossRef]
- Nappi, J.M.; McCollam, P.L. Sotalol: A breakthrough antiarrhythmic? Ann. Pharmacother. 1993, 27, 1359–1368. [Google Scholar] [CrossRef] [PubMed]
- Boutagy, J.; Shenfield, G.M. Simplified procedure for the determination of sotalol in plasma by high-performance liquid chromatography. J. Chromatogr. 1991, 565, 523–528. [Google Scholar] [CrossRef] [PubMed]
- Bartek, M.J.; Vekshteyn, M.; Boarman, M.P.; Gallo, D.G. Liquid chromatographic determination of sotalol in plasma and urine employing solid-phase extraction and fluorescence detection. J. Chromatogr. 1987, 421, 309–318. [Google Scholar] [CrossRef]
- Marlés-Torres, A.; López-García, R.; Bessa-Jambrina, S.; Galán-Rodríguez, C. Ultra-high-speed liquid chromatography combined with mass spectrometry detection analytical methods for the determination of nitrosamine drug substance-related impurities. J. Sep. Sci. 2023, 46, e2300125. [Google Scholar] [CrossRef]
- Feng, Z.; Yu, S.; Liu, W.; Yang, L.; Liu, Y.; Zhai, S.; Wang, F.; Zhang, X. A simple and sensitive LC-MS/MS method for the determination of sotalol in rat plasma. Biomed. Chromatogr. 2015, 29, 1167–1172. [Google Scholar] [CrossRef] [PubMed]
- Li, S.; Liu, G.; Jia, J.; Liu, Y.; Pan, C.; Yu, C.; Cai, Y.; Ren, J. Simultaneous determination of ten antiarrhythic drugs and a metabolite in human plasma by liquid chromatography--tandem mass spectrometry. J. Chromatogr. B Anal. Technol. Biomed. Life Sci. 2007, 847, 174–181. [Google Scholar] [CrossRef] [PubMed]
- Tomková, J.; Ondra, P.; Kocianová, E.; Václavík, J. Fast and sensitive analysis of beta blockers by ultra-high-performance liquid chromatography coupled with ultra-high-resolution TOF mass spectrometry. Biomed. Chromatogr. 2017, 31, e3911. [Google Scholar] [CrossRef] [PubMed]
- Alsehli, M.; Aljuhani, A.; Ihmaid, S.K.; El-Messery, S.M.; Othman, D.I.A.; El-Sayed, A.A.A.; Ahmed, H.E.A.; Rezki, N.; Aouad, M.R. Design and Synthesis of Benzene Homologues Tethered with 1,2,4-Triazole and 1,3,4-Thiadiazole Motifs Revealing Dual MCF-7/HepG2 Cytotoxic Activity with Prominent Selectivity via Histone Demethylase LSD1 Inhibitory Effect. Int. J. Mol. Sci. 2022, 23, 8796. [Google Scholar] [CrossRef] [PubMed]
- Godoy, A.A.; Oliveira, Á.C.; Silva, J.G.M.; Azevedo, C.C.J.; Domingues, I.; Nogueira, A.J.A.; Kummrow, F. Single and mixture toxicity of four pharmaceuticals of environmental concern to aquatic organisms, including a behavioral assessment. Chemosphere 2019, 235, 373–382. [Google Scholar] [CrossRef] [PubMed]
- Lu, Y.; He, Y.; Wang, X.; Wang, H.; Qiu, Q.; Wu, B.; Wu, X. Screening, characterization, and determination of suspected additives bimatoprost and latanoprost in cosmetics using NMR and LC-MS methods. Anal. Bioanal. Chem. 2023, 415, 3549–3558. [Google Scholar] [CrossRef] [PubMed]
- Brahmbhatt, H.; Molnar, M.; Pavić, V.; Rastija, V. Synthesis, Characterization, Antibacterial and Antioxidant Potency of NSubstituted-2-Sulfanylidene-1,3-Thiazolidin-4-one Derivatives and QSAR Study. Med. Chem. 2019, 15, 840–849. [Google Scholar] [CrossRef] [PubMed]
- Yang, Y.; Lian, Y.; Zhong, P.; Wang, D.; Di, B.; Li, B. Characterization and quantitative analysis of related substances in Coenzyme A by HPLC and LC-MS/MS. J. Pharm. Biomed. Anal. 2018, 150, 220–232. [Google Scholar] [CrossRef]
- Wei, H.; Liu, X.; Wang, A.; Zhang, L.; Qiao, B.; Yang, X.; Huang, Y.; Miao, S.; Liu, J.; Zhang, T. FeOx-supported platinum single-atom and pseudo-single-atom catalysts for chemoselective hydrogenation of functionalized nitroarenes. Nat. Commun. 2014, 5, 5634. [Google Scholar] [CrossRef]
- Rosen, B.R.; Ruble, J.C.; Beauchamp, T.J.; Navarro, A. Mild Pd-catalyzed N-arylation of methanesulfonamide and related nucleophiles: Avoiding potentially genotoxic reagents and byproducts. Org. Lett. 2011, 13, 2564–2567. [Google Scholar] [CrossRef]
- Bellur Atici, E.; Ağtaş, Ç.; Yazar, Y.; Rıdvanoğlu, N. Synthesis and characterization of oxitropium bromide related substances and novel stability indicating HPLC methods. J. Pharm. Biomed. Anal. 2020, 183, 113145. [Google Scholar] [CrossRef] [PubMed]
- Bouhifd, M.; Bories, G.; Casado, J.; Coecke, S.; Norlén, H.; Parissis, N.; Rodrigues, R.M.; Whelan, M.P. Automation of an in vitro cytotoxicity assay used to estimate starting doses in acute oral systemic toxicity tests. Food Chem. Toxicol. 2012, 50, 2084–2096. [Google Scholar] [CrossRef] [PubMed]
- Xu, X.; Xu, H.; Shang, Y.; Zhu, R.; Hong, X.; Song, Z.; Yang, Z. Development of the general chapters of the Chinese Pharmacopoeia 2020 edition: A review. J. Pharm. Anal. 2021, 11, 398–404. [Google Scholar] [CrossRef] [PubMed]
- Jain, D.; Basniwal, P.K. Forced degradation and impurity profiling: Recent trends in analytical perspectives. J. Pharm. Biomed. Anal. 2013, 86, 11–35. [Google Scholar] [CrossRef] [PubMed]
- ICH Q2 (R1) (2005). Validation of Analytical Procedures: Text and Methodology. In Proceedings of the International Conference on Harmonization, Orlando, FL, USA, 27 October 1994; pp. 1–17. Available online: https://database.ich.org/sites/default/files/Q2%28R1%29%20Guideline.pdf (accessed on 18 November 2021).
- Adhikari, R.P.; Mohamed Sheik Tharik, A.; Meyyanathan, S.N. Mini Review on Forced Degradation Studies on Anti-Epileptic Drugs and Beyond. J. Chromatogr. Sci. 2023, 61, 585–604. [Google Scholar] [CrossRef] [PubMed]
- Mehta, L.; Naved, T.; Grover, P.; Bhardwaj, M.; Mukherjee, D. LC and LC-MS/MS studies for identification and characterization of new degradation products of ibrutinib and elucidation of their degradation pathway. J. Pharm. Biomed. Anal. 2021, 194, 113768. [Google Scholar] [CrossRef]
- Zhou, F.; Zhao, Y.; Li, M.; Xu, T.; Zhang, L.; Lu, B.; Wu, X.; Ge, Z. Degradation of phenylethanoid glycosides in Osmanthus fragrans Lour. flowers and its effect on anti-hypoxia activity. Sci. Rep. 2017, 7, 10068. [Google Scholar] [CrossRef]
- Kiełbasiński, K.; Peszek, W.; Grabarek, B.O.; Boroń, D.; Wierzbik-Strońska, M.; Oplawski, M. Effect of Salinomycin on Expression Pattern of Genes Associated with Apoptosis in Endometrial Cancer Cell Line. Curr. Pharm. Biotechnol. 2020, 21, 1269–1277. [Google Scholar] [CrossRef]
- Ghasemi, M.; Turnbull, T.; Sebastian, S.; Kempson, I. The MTT Assay: Utility, Limitations, Pitfalls, and Interpretation in Bulk and Single-Cell Analysis. Int. J. Mol. Sci. 2021, 22, 12827. [Google Scholar] [CrossRef]
- Ghasemi, M.; Liang, S.; Luu, Q.M.; Kempson, I. The MTT Assay: A Method for Error Minimization and Interpretation in Measuring Cytotoxicity and Estimating Cell Viability. Methods Mol. Biol. 2023, 2644, 15–33. [Google Scholar]
- Nozhat, Z.; Khalaji, M.S.; Hedayati, M.; Kia, S.K. Different Methods for Cell Viability and Proliferation Assay: Essential Tools in Pharmaceutical Studies. Anticancer Agents Med. Chem. 2022, 22, 703–712. [Google Scholar] [CrossRef] [PubMed]
- Zhao, Q.; Yang, Z.S.; Cao, S.J.; Chang, Y.F.; Cao, Y.Q.; Li, J.B.; Yao, Z.X.; Wen, Y.P.; Huang, X.B.; Wu, R.; et al. Acute oral toxicity test and assessment of combined toxicity of cadmium and aflatoxin B1 in kunming mice. Food Chem. Toxicol. 2019, 131, 110577. [Google Scholar] [CrossRef] [PubMed]
- Wu, Y.; Qiang, Y.; Zhang, G.; Zhou, M. Acute toxicity and micronucleus test of conotoxin lt14a in mice. Basic Clin. Pharmacol. Toxicol. 2021, 129, 52–60. [Google Scholar] [CrossRef] [PubMed]


| Samples | STHCL (A) | RS1 (A) | RS2 (A) | RS3 (A) | Resolution between STHCl Peak and Nearest Peak | Mass Balance (%) | Peak Purity of STHCl |
|---|---|---|---|---|---|---|---|
| Control | 2.37 × 10⁷ | 1.5 × 10⁵ | 9.15 × 10⁴ | 1.03 × 10⁵ | 27.86 | 99.9979 | 0.966 |
| Acidic hydrolysis | 2.36 × 10⁷ | 1.3 × 10⁵ | 2.26 × 10⁴ | 1.24 × 10⁵ | 24.73 | 99.2996 | 0.959 |
| Alkaline hydrolysis | 2.35 × 10⁷ | 1.26 × 10⁵ | 8.98 × 10⁴ | 1.16 × 10⁵ | 29.95 | 99.1133 | 0.989 |
| Thermal degradation | 2.44 × 10⁷ | 1.12 × 10⁵ | 1.16 × 10⁴ | 1.12 × 10⁵ | 18.96 | 102.4562 | 0.99 |
| Oxidation degradation | 2.31 × 10⁷ | 8.55 × 10⁵ | 9.54 × 10⁴ | 1.13 × 10⁵ | 29.78 | 100.4924 | 0.971 |
| Light degradation | 2.26 × 10⁷ | 4.05 × 10⁵ | 7.14 × 10⁵ | 1.33 × 10⁵ | 28.02 | 99.1973 | 0.981 |
| Analyte | Calibration Equation | Concentration Range | Correlation Coefficient (r2) |
|---|---|---|---|
| STHCl | y = 10.553x + 1.9967 | 0.5~100 μg/mL | r = 0.9999 |
| RS1 | y = 26.443x + 65.468 | r = 0.9994 | |
| RS2 | y = 2.8121x − 0.0571 | r = 1.0000 | |
| RS3 | y = 1.7131x + 1.7042 | r = 0.9999 |
| Compound | LOD | LOQ | S/N | |
|---|---|---|---|---|
| μg/mL | μg/mL | LOD Limit: ≥3 | LOQ Limit: ≥10 | |
| STHCL | 0.0625 | 0.1875 | 10 | 15 |
| RS1 | 0.103 | 0.309 | 8 | 15 |
| RS2 | 0.0823 | 0.248 | 6 | 14 |
| RS3 | 0.0854 | 0.256 | 7 | 16 |
| Compound | C (μg/mL) | Accuracy | Interday Precision (n = 5) | Intraday Precision (n = 5) | |||
|---|---|---|---|---|---|---|---|
| Precision | Precision | ||||||
| Recovery Rate (%) | RSD (%) | A | RSD (%) | A | RSD (%) | ||
| STHCL | 10 | 104.23 ± 3.28 | 3.15 | 101.075 ± 0.05 | 0.05 | 101.11 ± 0.59 | 2.26 |
| 50 | 106.32 ± 1.85 | 1.74 | 529.328 ± 4.08 | 0.77 | 529.53 ± 10.43 | 1.97 | |
| 100 | 108.23 ± 3.98 | 3.68 | 1069.49 ± 24.06 | 2.25 | 1069.54 ± 13.58 | 1.27 | |
| RS1 | 10 | 105.17 ± 4.53 | 4.31 | 254.1 ± 9.10 | 3.58 | 254.39 ± 3.21 | 1.26 |
| 50 | 116 ± 2.84 | 2.45 | 1320.13 ± 6.07 | 0.46 | 1321.87 ± 9.12 | 0.69 | |
| 100 | 104.33 ± 3.67 | 3.52 | 2652.95 ± 8.49 | 0.32 | 2653.12 ± 12.73 | 0.48 | |
| RS2 | 10 | 115.17 ± 4.38 | 3.8 | 289.34 ± 3.65 | 1.26 | 289.28 ± 5.61 | 1.94 |
| 50 | 107.5 ± 2.74 | 2.55 | 1404.11 ± 9.69 | 0.69 | 1403.88 ± 11.88 | 0.92 | |
| 100 | 105.6 ± 4.34 | 4.11 | 2821.58 ± 13.54 | 0.48 | 2822.8 ± 9.32 | 0.33 | |
| RS3 | 10 | 102 ± 1.67 | 1.64 | 169.08 ± 2.77 | 1.64 | 169.1 ± 5.79 | 1.85 |
| 50 | 112.5 ± 1.76 | 1.56 | 850.3 ± 8.69 | 1.35 | 850.5 ± 13.78 | 1.62 | |
| 100 | 104.33 ± 2.86 | 2.75 | 1701.05 ± 34.36 | 2.02 | 1700.85 ± 20.92 | 1.23 | |
| Compound | C (μg/mL) | Time (h) | RSD (%) | |||||
|---|---|---|---|---|---|---|---|---|
| 0 | 2 | 4 | 6 | 12 | 24 | |||
| STHCL | 10 | 103.25 | 102.73 | 101.47 | 100.99 | 103.46 | 100.49 | 1.22 |
| 50 | 528.42 | 527.51 | 534.25 | 533.33 | 521.57 | 525.61 | 0.90 | |
| 100 | 1054.2 | 1066.49 | 1069.97 | 1073.12 | 1079.05 | 1076.65 | 0.83 | |
| RS1 | 10 | 570.2 | 548.18 | 559.15 | 555.21 | 553.95 | 544.24 | 1.63 |
| 50 | 1322.39 | 1321.15 | 1343.95 | 1309.85 | 1315.31 | 1322.5 | 0.88 | |
| 100 | 2701.3 | 2688.95 | 2700.9 | 2765.9 | 2699.75 | 2679.4 | 1.13 | |
| RS2 | 10 | 569.2 | 534.18 | 565.15 | 553.21 | 554.95 | 544.24 | 2.35 |
| 50 | 1393.65 | 1400.75 | 1399.63 | 1398.85 | 1413.71 | 1413.97 | 0.60 | |
| 100 | 2798.95 | 2813.8 | 2822.5 | 2870.92 | 2813.1 | 2812.9 | 0.89 | |
| RS3 | 10 | 159.398 | 165.329 | 173.396 | 176.413 | 177.42 | 169.41 | 4.09 |
| 50 | 839.39 | 845.15 | 857.3 | 860.14 | 850.4 | 853.46 | 0.91 | |
| 100 | 1691.95 | 1700.45 | 1699.24 | 1688.37 | 1702.85 | 1719.63 | 0.64 | |
| Condition | tR (min) | RSD of Concentration (%) | |
|---|---|---|---|
| Detection wavelength (nm) | 233 | 6.01 | 0.37 |
| 228 | 6.07 | ||
| 223 | 6.73 | ||
| Column temperature (°C) | 32 | 5.97 | 1.21 |
| 30 | 6.134 | ||
| 28 | 9.01 | ||
| Flow rate (mL/min) | 1.2 | 5.04 | 0.76 |
| 1 | 6.35 | ||
| 0.8 | 9.21 | ||
| Instrument | Agilent 1260 | 6.34 | 4.21 |
| Shimadzu 2010 | 10.89 | ||
| Mobile Phase A (aqueous ammonium) | 4 mM | 8.13 | 0.56 |
| 5 mM | 6.88 | ||
| 6 mM | 5.21 | ||
| Sample | Content (μg/mL) | ||
|---|---|---|---|
| RS1 | RS2 | RS3 | |
| Sample A 101190607 | 1.532 | 0.861 | 0.36 |
| Sample B 101190608 | 1.424 | 0.798 | 0.31 |
| Sample C 101190609 | 1.591 | 0.823 | 0.33 |
| Sample D ZY190402 | 1.523 | 0.99 | 0.71 |
| Sample E ZY190501 | 1.493 | 0.901 | 0.98 |
| Sample F ZY190502 | 1.408 | 0.869 | 0.85 |
| Name of Related Substances | tR (min) | Observed Ion Mass (m/z) | Theoretical Ion Mass (m/z) | Proposed Molecular Formula [M + H]+\[M − H]− | Error (ppm) | Product Ions |
|---|---|---|---|---|---|---|
| STHCl | 6.074 | 273.1268 | 273.1267 | C12H20N2O3S | −0.37 | 255.12, 213.04, 199.03, 135.05, 78.05 |
| RS1 | 19.351 | 136.0759 | 136.0757 | C8H9NO | −1.47 | 135.05, 94.16, 78.05 |
| RS2 | 26.846 | 212.0386 | 212.0387 | C9H11NO3S | 0.47 | 199.03, 135.05, 94.16, 78.05 |
| RS3 | 5.921 | 199.0231 | 199.0230 | C8H9NO3S | −0.50 | 135.05, 120.02, 78.05 |
 |  | |||
|---|---|---|---|---|
| Position | δ ppm (CD3OD, 500 MHZ) | δ ppm (CD3OD, 500 MHZ) | ||
| 1H | 13C (DEPT) | 1H | 13C(DEPT) | |
| 1 | - | 126.8 (C) | - | 144.6 (C) |
| 2, 6 | 7.74–7.77 (m, 2H) | 132.1 (CH) | 7.30–7.33 (m, 2H) | 118.9 (CH) |
| 3, 5 | 6.62–6.65 (m, 2H) | 114.1 (CH) | 7.97–8.00 (m, 2H) | 131.3 (CH) |
| 4 | - | 155.4 (C) | - | 133.5 (C) |
| 7 | - | 199.2 (C) | - | 199.9 (C) |
| 8 | 2.47 (s, 3H) | 25.8 (CH3) | 2.57 (s, 3H) | 26.4 (CH3) |
| 9 | - | - | 3.06 (s, 3H) | 39.8 (CH3) |
| -NHn | 4.59 (s, 1H) | - | 4.59 (s, 1H) | - |
| Name | Hepa | HepG-2 | CT26.wt | HT-29 |
|---|---|---|---|---|
| RS1 | 144.33 | 237.67 | 47.44 | 64.81 |
| RS2 | 197.7 | 612.03 | 456.16 | 371.38 |
| RS3 | 207.75 | 808.75 | 224.14 | 241.92 |
Disclaimer/Publisher’s Note: The statements, opinions and data contained in all publications are solely those of the individual author(s) and contributor(s) and not of MDPI and/or the editor(s). MDPI and/or the editor(s) disclaim responsibility for any injury to people or property resulting from any ideas, methods, instructions or products referred to in the content. |
© 2024 by the authors. Licensee MDPI, Basel, Switzerland. This article is an open access article distributed under the terms and conditions of the Creative Commons Attribution (CC BY) license (https://creativecommons.org/licenses/by/4.0/).
Share and Cite
Zhu, P.; Shen, X.; Wang, X.; Liu, X.; Zhang, Y.; Wang, K.; Gao, W.; Wang, X.; Yuan, W. HPLC and LC–MS/MS-Based Quantitative Characterization of Related Substances Associated with Sotalol Hydrochloride. Molecules 2024, 29, 588. https://doi.org/10.3390/molecules29030588
Zhu P, Shen X, Wang X, Liu X, Zhang Y, Wang K, Gao W, Wang X, Yuan W. HPLC and LC–MS/MS-Based Quantitative Characterization of Related Substances Associated with Sotalol Hydrochloride. Molecules. 2024; 29(3):588. https://doi.org/10.3390/molecules29030588
Chicago/Turabian StyleZhu, Pengyan, Xiaojing Shen, Xinting Wang, Xinlan Liu, Yingshuang Zhang, Ke Wang, Wenfen Gao, Xuanjun Wang, and Wenjuan Yuan. 2024. "HPLC and LC–MS/MS-Based Quantitative Characterization of Related Substances Associated with Sotalol Hydrochloride" Molecules 29, no. 3: 588. https://doi.org/10.3390/molecules29030588