Article

Study on the Compositional Analysis, Extraction Process, and Hemostatic and Anti-Inflammatory Activities of Cirsium japonicum Fisch. ex DC.Cirsium setosum (Willd.) MB Extracts

1
College of Pharmacy, Jiamusi University, Jiamusi 154000, China
2
School of Functional Food and Wine, Shenyang Pharmaceutical University, Shenyang 110016, China
*
Authors to whom correspondence should be addressed.
Molecules 2024, 29(9), 1918; https://doi.org/10.3390/molecules29091918
Submission received: 20 March 2024 / Revised: 17 April 2024 / Accepted: 21 April 2024 / Published: 23 April 2024
(This article belongs to the Special Issue Natural Products: Chemical Composition and Pharmacological Activity)

Abstract

:
Cirsium japonicum Fisch. ex DC. (CF) and Cirsium setosum (Willd.) MB (CS) are commonly used clinically to stop bleeding and eliminate carbuncles. Still, CF is mainly used for treating inflammation, while CS favors hemostasis. Therefore, the present study used UHPLC-MS to analyze the main chemical constituents in CF-CS extract. We optimized the extraction process using single-factor experiments and response surface methodology. Afterward, the hemostatic and anti-inflammatory effects of CF-CS extract were investigated by determining the clotting time in vitro, the bleeding time of rabbit trauma, and the induction of rabbit inflammation using xylene and lipopolysaccharide. The study of hemostatic and anti-inflammatory effects showed that the CF-CS, CF, and CS extract groups could significantly shorten the coagulation time and bleeding time of rabbits compared with the blank group (p < 0.01); compared with the model group, it could dramatically inhibit xylene-induced ear swelling in rabbits and the content of TNF-α, IL-6, and IL-1β in the serum of rabbits (p < 0.01). The results showed that combined CF and CS synergistically increased efficacy. CF-CS solved the problem of the single hemostatic and anti-inflammatory efficacy of a single drug, which provided a new idea for the research and development of natural hemostatic and anti-inflammatory medicines.

1. Introduction

Cirsium japonicum Fisch. ex DC. (CF) and Cirsium setosum (Willd.) MB. (CS), wild, perennial herbs of the family Asteraceae, are widely distributed in China and Europe [1]. As traditional Chinese medicine, they have a long history of thousands of years and have been recorded in the monographs of the Materia Medica throughout the ages. These herbs are used in whole form as medicine, which can be used to treat blood in urine, vomiting blood, leakage, blood in stool, and bleeding from trauma and are commonly used in folk medicine to treat inflammatory diseases [2,3]. According to “Liu Shangyi’s Commonly Used Drug Pairs in Clinical Analysis and Application”, CF and CS are commonly used clinically to cool blood, stop bleeding, dissipate blood stasis, remove toxins, and eliminate carbuncles. Their combined use can play a complementary role in promoting the therapeutic effect [4]. CF and CS are plants that have integrated medicine, food, and health care functions and have significant potential for development and utilization.
So far, more than 100 compounds have been isolated from these two medicinal plants, mainly including flavonoids, terpenoids, phenylpropanoids, alkaloids, and other chemical components. Flavonoids are among the main active ingredients in CF and CS [2,3]. Some studies have shown that CF and CS have a variety of biological activities such as hemostatic, anti-inflammatory, antioxidant, anticancer, antimicrobial, antiviral, antidiabetic, and hepatoprotective activity [5,6]. A large number of studies have shown that flavonoids can produce hemostatic effects by reducing capillary permeability and promoting vascular wall contraction, and they can also exert stronger anti-inflammatory effects by reducing the release of cytokines and inflammatory mediators [7,8]. Medicinal plants have attracted increasing attention from researchers around the world because of their wide range of action, low toxicity, and few side effects.
However, fewer studies have been reported on CF and CS. Therefore, the main chemical constituents, extraction process, hemostatic and anti-inflammatory activities of CF and CS were preliminarily studied in this study. This study provides an experimental reference for the further study of CF and CS.

2. Results and Discussion

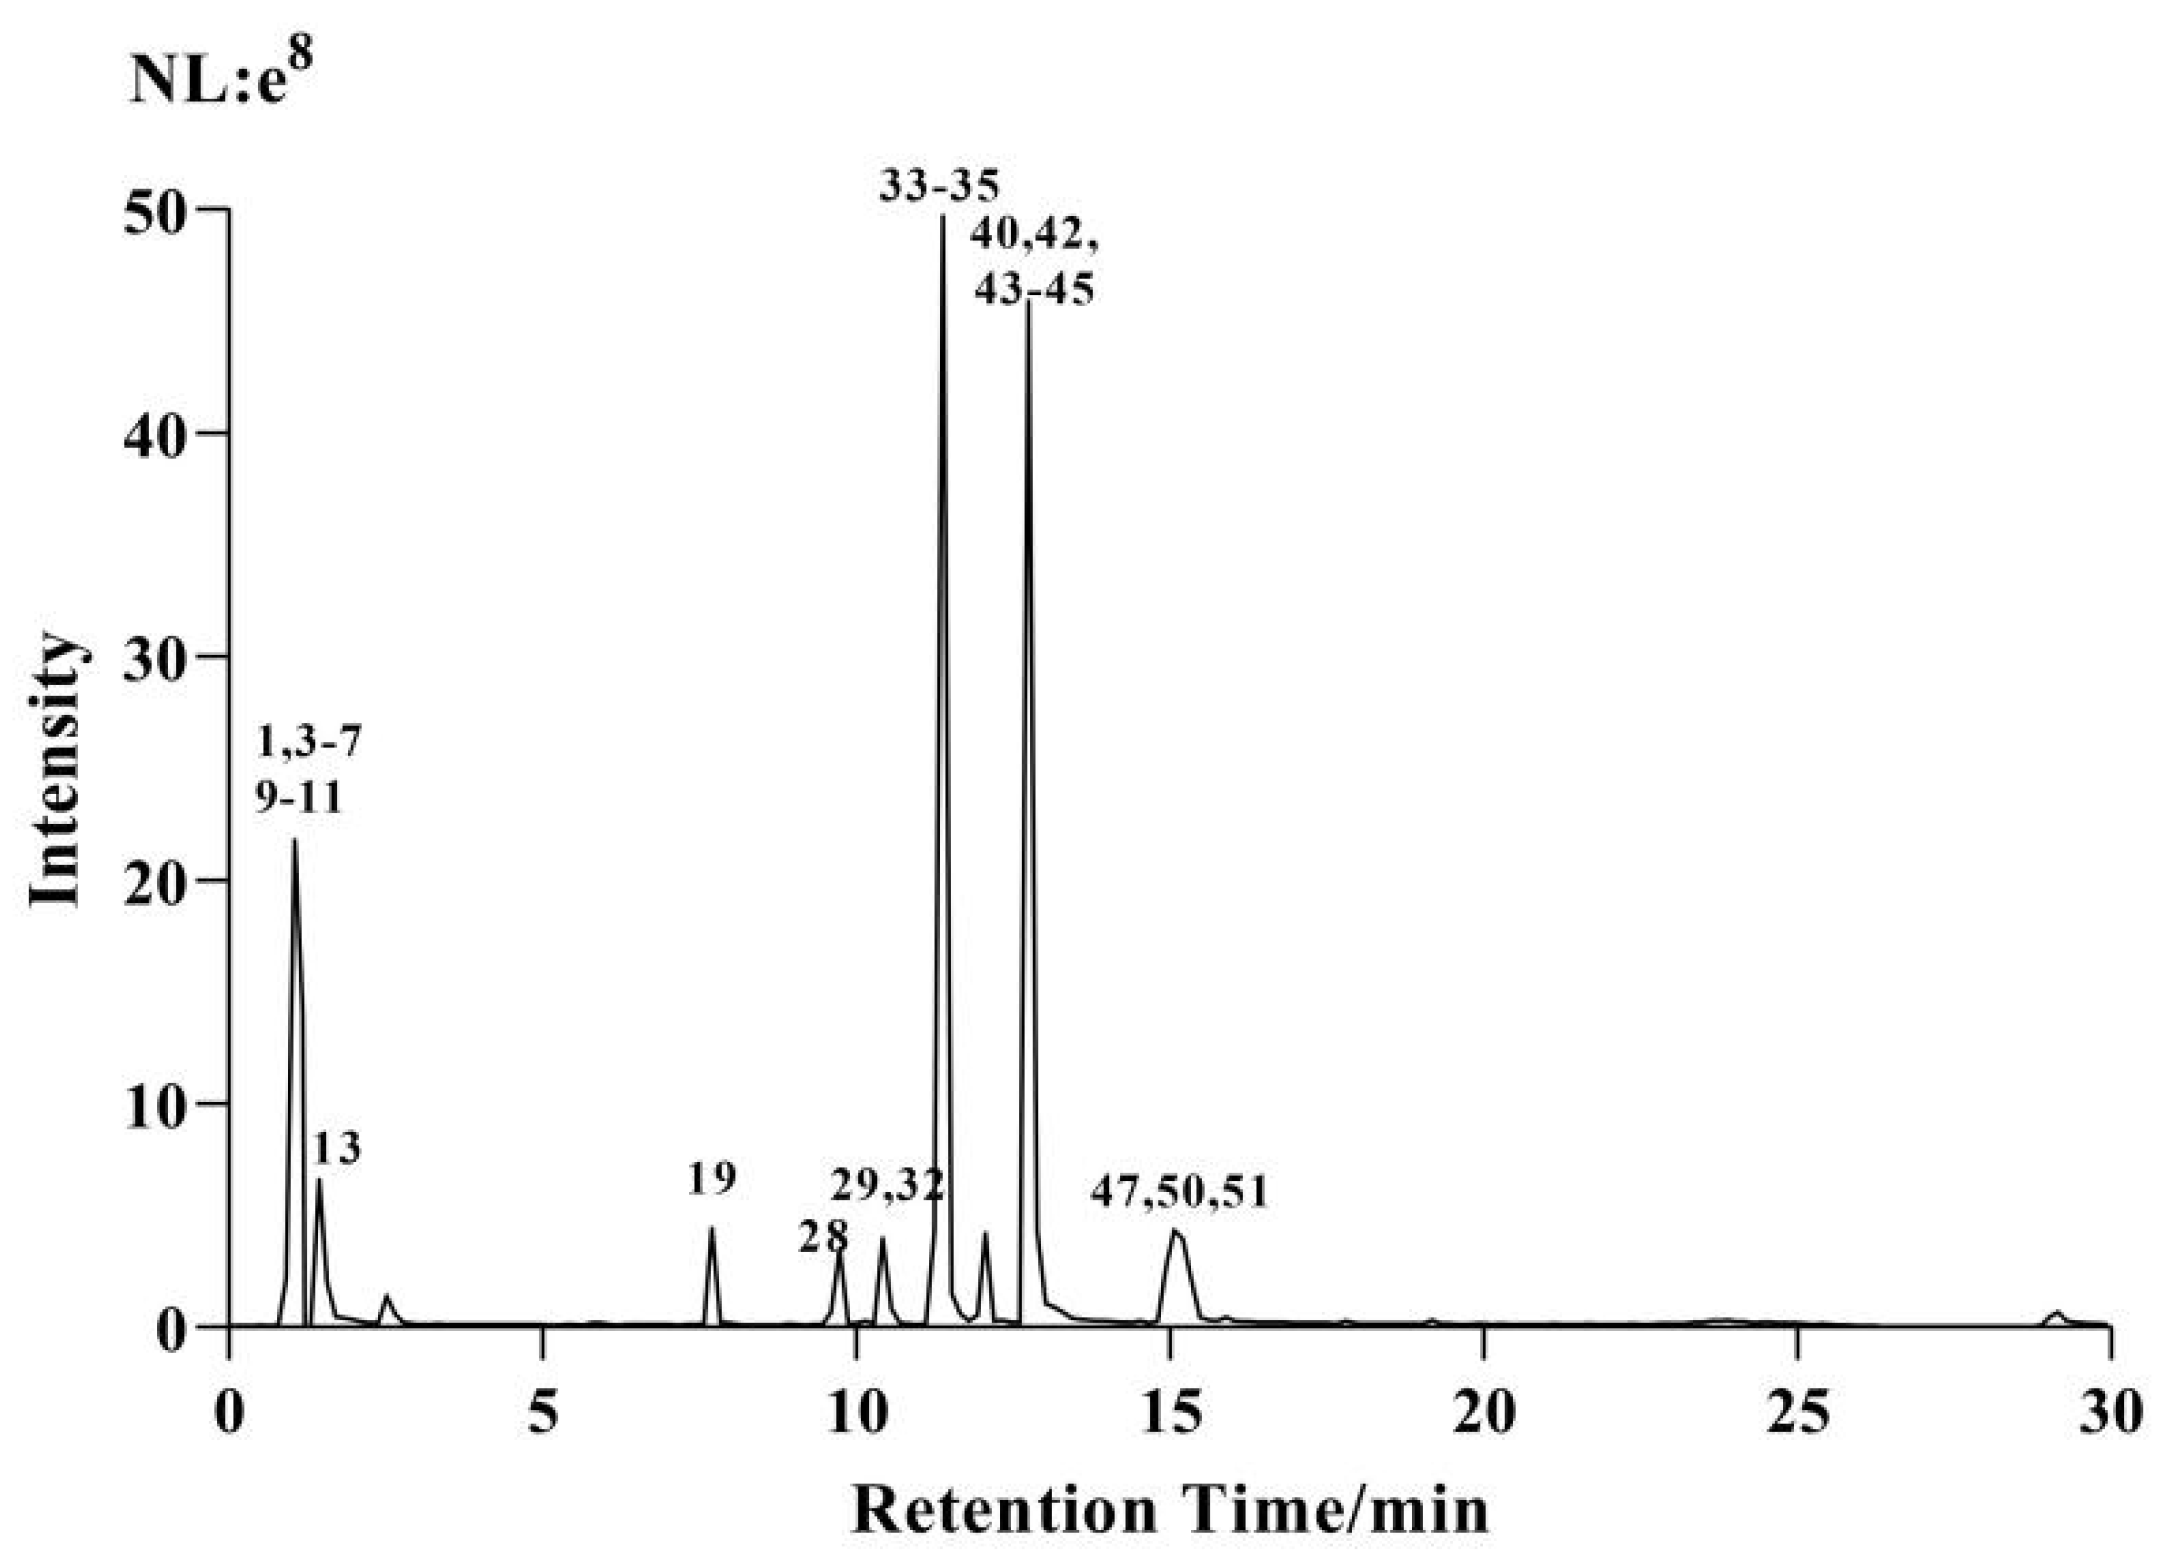
2.1. Chemical Composition Analysis of CF-CS

UHPLC-HRMS/MS technology combined with Compound Discoverer 3.2TM; Mass Frontier7.0TM software; and mzVault, ChemSpider, and mzCloud databases were used to analyze the chemical constituents of CF-CS ethanol extract. The identification results were as shown in Table 1, and 51 main active ingredients were preliminarily identified, including 4 amino acids, 8 organic acids, 22 flavonoids, 7 phenylpropanoids, 4 alkaloids, 1 phenol, 1 terpenoid, 1 anthraquinone and 3 other compounds.
In the positive and negative ion scanning mode, the extracted ion chromatogram of the extract is shown in Figure 1 and Figure 2. The mass spectrometry information of 26 active ingredients was screened in the positive ion scanning mode, and 25 compounds were screened in the negative ion scanning mode.

2.2. The results of the Single-Factor Experiments

As can be seen in Figure 3, the extraction of linarin from CF-CS increased with ethanol concentration (A). The highest extraction rate of linarin was achieved when the ethanol concentration was 70%, after which it started to decrease. The reason for this phenomenon may be that the polarity of 70% ethanol and buddleoside is relatively close. According to the principle of “similar compatibility”, the extraction rate is the highest at this time. However, with the increase in ethanol concentration, more organic solutes were dissolved, which led to a decrease in the extraction rate of buddleoside. Therefore, 50, 70, and 90% are used as the three levels of the Box–Behnken design.
The extraction rate of linarin gradually increased with the gradual increase in reflux time (B), reaching a maximum at an extraction time of 120 min. The reason may be that with the increase in time, buddleoside is continuously dissolved, and the maximum solubility is reached at about 120 min. As the reflux time continued to increase, some of the linarin was destroyed or oxidized, resulting in a gradual decrease in the extraction rate. Therefore, 90, 120, and 150 min were used as the three levels of the Box–Behnken design.
The extraction rate of linarin peaked when the solvent-to-sample ratio (C) was 40:1 (mL·g−1). This phenomenon may be due to the low solvent-to-sample ratio, the large viscosity of the overall system, and the poor fluidity of the medicinal materials in the solvent. The two failed to fully contact and the reaction was incomplete. Increasing the solvent-to-sample ratio, excessive solvent may consume energy, the energy absorbed by medicinal materials is reduced, and the extraction rate of buddleoside is also reduced. Therefore, 30:1, 40:1, and 50:1 mL·g−1 were used as the three levels of the Box–Behnken design.

2.3. Response Surface Experiment Results and Analysis

2.3.1. The Results of the Response Surface Experiments

Based on the results of the single-factor experiments, a three-factor, the three-level analytical test was carried out to investigate the effects of ethanol volume fraction (A), reflux time (B), and solvent-to-sample ratio (C) on the extraction rate (Y) of linarin, using the principle of the Box–Behnken design, and the results are shown in Table 2.

2.3.2. Model Fitting and Statistical Analysis

Multivariate regression was used to fit the above test results to obtain a quadratic polynomial regression equation, Y = 0.2657 + 0.0138A − 0.0188B − 0.0035C − 0.0014AB − 0.0075AC − 0.0082BC − 0.0594A2 − 0.0407B2 − 0.0093C2, which was subjected to a significant test and ANOVA, and the results are shown in Table 3.
As can be seen from Table 3, the regression model p < 0.0001 indicates that the quadratic regression equation model is significant; the misfit term p = 0.4583 > 0.05 suggests that the regression equation has a good fit; R2 = 0.9968 demonstrates that the model can adequately fit the experimental data; R2Adj = 0.9926 indicates that the observed values correlate well with the predicted values; and the C.V.% = 1.71 suggests that the screening process of the model is accurate and reliable. The analysis of the variance of this model shows that among all the acting factors, the effect of the primary term C on the extraction rate of linarin was significant (p < 0.05). The impact of the preceding terms A and B; the interaction terms AC and BC; and the secondary terms A2, B2, and C2 were highly significant (p < 0.01). From the F-values in the table, it can be seen that the order of the effect of the factors on the extraction rate of linarin is reflux time (B) > ethanol concentration (A) > solvent-to-sample ratio (C).

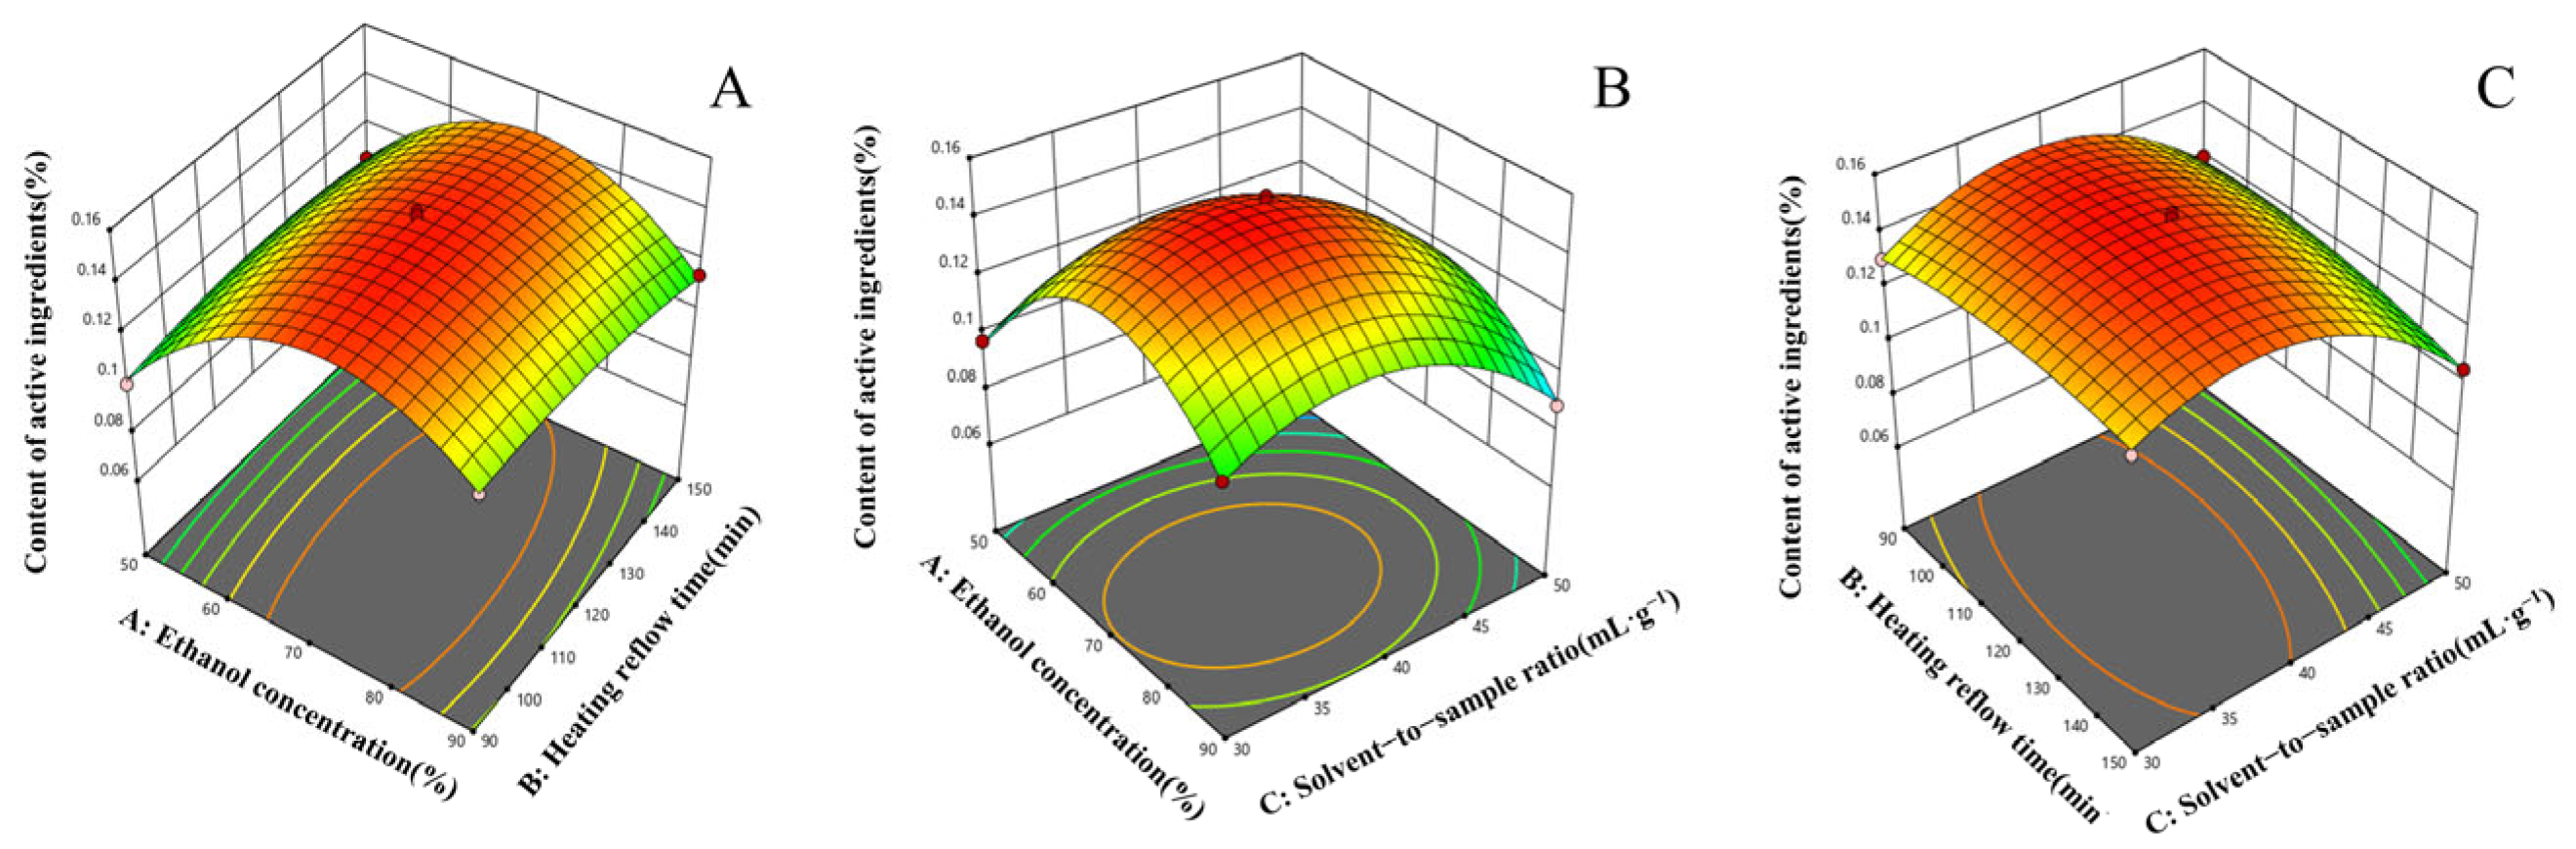
2.3.3. Graphical Interpretation and Optimization of Procedure

The response surface plots of the quadratic regression equation were obtained by using the software. Figure 4 depicts the response surface plots of the effect of the interaction between any two variables on the extraction rate of linarin. In the response surface plot, the steeper the surface plot, the more obvious the interaction between the variables. The interaction term (BC) had the most significant effect on the extraction rate of linarin, followed by (AC), and the interaction term (AB) was not significant, which was consistent with the analysis of variance in Table 3. The optimal extraction process was obtained as follows: ethanol concentration of 72.5651%, reflux time of 113.451 min, liquid-feed ratio of 38.5326:1 mL·g−1, and predicted content of 0.268891%. The optimized data were 70% ethanol concentration, 120 min reflux time, and 40:1 mL·g−1 for the convenience of the experiment. Three validation experiments were carried out to verify the correctness of the above scheme and the stability of the results, and the average linarin content was 0.2697%. The obtained experimental data were similar to the theoretical values, and the above results showed that the preferred extraction process of CF-CS was reasonable and feasible.

2.4. Validation Results of the Quantitative Method of Linarin

The range of linearity was established by injecting six different concentrations obtained by the dilution of a standard of linarin. Analytical curves for linarin were obtained considering the correlation between the peak area and the respective concentration of the standard. The standard curve equation obtained by the least squares method was y = 0.0340C − 0.2898, R2 = 0.9992, and the linear range was 21.60~129.60 μg·mL−1. As can be seen from the results, the linearity was satisfactory in all cases with correlation coefficients (R2 > 0.999). R values for the calibration curves higher than 0.99 verified that the linearity was adequate for the intended purpose.
Good precision, as revealed in the relative standard deviations (RSDs) for the peak area of linarin was 1.21%.
For the stability test, the RSD of the peak area of linarin was 1.33%, indicating that the standard solution was stable for 24 h at ambient temperature.
The repeatability of the method was tested by the determination of a sample of CF-CS. The RSD for the contents of linarin was 1.43%.
The recovery test was conducted to evaluate the accuracy of this method. The recovery test of solution was obtained by adding a known amount of linarin standard solution to the six sample solutions. As shown in Table 4, the recovery rates for linarin were within the range of 98.2% and 102.5%. The RSD for the recovery rate was 1.64%.

2.5. Results of Linarin Content Determination

According to the results in Table 5, the average content of linarin in the alcoholic extract of CF-CS was 2.92 mg·g−1 with an RSD% of 1.43%, which is an accurate and reliable result. At the same time, the contents of linarin in CF, CS, and CF-CS were also compared, and the results showed that the contents of the three were similar.

2.6. Results of Coagulation and Hemostasis Tests

2.6.1. Results of In Vitro Coagulation Tests

The results are shown in Figure 5. Compared with the blank group, the positive control group, CF-CS, CF, and CS could significantly shorten the coagulation time (p < 0.01), indicating that the experimental results were statistically significant. The results showed that CF-CS, CF, and CS had the effect of promoting blood coagulation.

2.6.2. Results of Experiments on Traumatic Hemorrhage in Rabbits

Figure 6 displays the results. In comparison to the control group, the positive control group, CF-CS, and CS were shown to considerably reduce the bleeding time (p < 0.01), whereas CF was found to greatly reduce the bleeding time (p < 0.05). The experimental results demonstrate that CF-CS, CF, and CS have a distinct hemostatic effect.

2.7. Results of Anti-Inflammatory Experiments

2.7.1. Experimental Results of Xylene-Induced Ear Swelling in Rabbits

Figure 7 displays the results. In comparison to the model group, the positive control group, CF-CS, CF, and CS were able to considerably decrease the degree of swelling in rabbit ears (p < 0.01), indicating a statistically significant result. The findings demonstrated that CF-CS, CF, and CS were successful in suppressing xylene-induced edema in rabbit ears.
Rabbit ear tissue sections were observed under a light microscope, as shown in Figure 8. Compared with the blank group, the thickening of the spinous layer in the model group, the destruction of the ear cartilage and subcutaneous connective tissue, the widening of the gap, and a large number of infiltration of inflammatory cells dominated by neutrophils could be seen in the surrounding area, which indicated that the modeling was successful; compared with the model group, the administration of the group could alleviate the extent of the thickening of the spinous layer, the degree of destruction of the ear cartilage and the subcutaneous connective tissue, and the infiltration of inflammatory cells. The results showed that all the administered groups had a protective effect and some anti-inflammatory effect on the ear tissues of rabbits with xylene-induced ear swelling.

2.7.2. Results of the LPS-Induced Inflammation Experiment in Rabbits In Vivo

To assess the suppressive impact of CF-CS, CF, and CS on inflammation in rabbits, ELISA was employed to measure the levels of TNF-α, IL-6, and IL-1β inflammatory cytokines in the rabbits’ serum. The findings from Figure 9 demonstrate that the levels of inflammatory factors TNF-α, IL-6, and IL-1β in the serum of rabbits in the model group were considerably elevated (p < 0.01) compared to the blank group. This provides evidence of successful inflammatory modeling in rabbits. The levels of TNF-α, IL-6, and IL-1β were significantly reduced (p < 0.01) in both the negative control group and the administration group compared to the model group. This suggests that the experimental results were statistically significant. Every administration group has the ability to efficiently suppress the levels of TNF-α, IL-6, and IL-1β in the serum of rabbits, thereby inhibiting the inflammatory response generated by LPS in rabbits.

2.8. Signal Pathway Analysis of CF and CS

The primary hemostatic and anti-inflammatory components of CF and CS were identified as linarin, acacetin, quercetin, pectolinarin, and pectolinarigenin by the use of network pharmacology and component identification. The AKT1, JUN, FOS, CASP3, IL6, MAPK1, and NFKBIA main targets are responsible for the hemostatic and anti-inflammatory actions exerted by these components [29,30,31,32]. Molecular docking technology was employed to align the active components with the target molecules. The results of molecular docking demonstrated that the binding energies between the crucial active components and the core target proteins were below −5 kJ·moL−1. This suggests that the active components and target molecules can form stable and effective interactions, thereby confirming the validity of the mechanism analysis. The molecular mechanism behind the hemostatic and anti-inflammatory effects of CF and CS may be associated with the IL-17 signaling pathway, TNF signaling pathway, and AGE-RAGE signaling pathway in the context of diabetic problems. The IL-17 signaling pathway is a well-known mechanism involved in the inflammatory response. It plays a special role in regulating the expression of IL-6 during the transcription of inflammatory genes. Additionally, it induces the production of chemokines and facilitates the adhesion, migration, and invasion of inflammatory cytokines. It has a significant impact on multiple inflammatory conditions. Research has demonstrated that by controlling the IL-17 signaling pathway, it is possible to decrease the concentration of inflammatory substances in the bloodstream, rectify the irregularity in the duration of bleeding, enhance the quantity of platelets, and promote their ability to clump together, thus achieving the process of blood clotting. The TNF signaling pathway is the primary inflammatory route activated by TNF-α. Macrophages release a protein that is composed of tiny molecules. They are cytokines that are part of the acute phase response and have a role in the overall inflammatory response throughout the body. The pro-inflammatory effects of TNF and IL-6 are strongly associated with angiogenesis. These substances exert their effects on the cells that line blood vessels, causing harm to these cells or disrupting their function. This can result in problems with blood flow, injury to the blood vessels, and the formation of blood clots. These effects can lead to the blockage of blood flow in tumor tissues, as well as bleeding, oxygen deprivation, and tissue death. They have the ability to block this pathway and function as hemostatic agents. The activation of the AGE-RAGE signaling pathway is associated with neuronal damage, inflammatory response, oxidative stress, and other related factors. Research has demonstrated that traditional Chinese medicine has the ability to hinder the inflammatory channels that are triggered by the AGE-RAGE signaling cascade, therefore exerting an anti-inflammatory effect.

3. Materials and Methods

3.1. Instruments, Reagents, and Drugs

A Dionex Ultimate 3000 RSLC ultra-high-performance liquid chromatograph, a Hypersil GOLD aQ column (100 × 2.1 mm, 1.9 μm), a Thermo Scientific Q Exactive Series mass spectrometer, a HESI-II ion source, methanol (chromatographically pure), formic acid (chromatographically pure), and acetonitrile (chromatographically pure) were purchased from Thermo Fisher Scientific (Shanghai, China). A Synergy-HT multifunctional enzyme labeler was purchased from Bio-TEK (Shanghai, China). Ethanol (analytically pure) and xylene (analytically pure) were purchased from Tianjin Komeo Chemical Reagent Co. (Tianjin, China). Linarin (MUST-22051011) was purchased from Chengdu Manster Biotechnology Co. (Chengdu, China). Lipopolysaccharide (LPS) was purchased from Dalian Meilun Biotechnology Co. (Dalian, China). Relevant inflammatory factor kits (TNF-α, IL-6, and IL-1β) were purchased from Wuhan Doctor Bioengineering Co. (Wuhan, China). Vanguard Red Ointment and Dexamethasone Hydrochloride were purchased from Golden Sky Heart Pharmacy (Jiamusi, China). CF and CS were purchased from Nanjing Tongrentang (Jiamusi, China), and identified by Prof. Zong Ximing, School of Pharmacy, Jiamusi University, as the whole herb of Cirsium japonicum Fisch. ex DC. and Cirsium setosum (Willd.) MB. of Cirsium japonicum, family Asteraceae.

3.2. Samples and Processing

The CF and CS herbs were dried in the shade to remove residual moisture. The samples were pulverized with a high-speed pulverizer and sieved with 65 mesh. The samples were placed under cool and dry conditions at 20 °C, sealed, and stored away from light.

3.3. Preparation of Test Solution

The CF powder and CS powder were weighed to 10.0 g and placed in a round-bottomed flask, and 70% ethanol was added to 800 mL, immersed for 30 min, then heated and refluxed for extraction and cooled. The abovementioned solution was centrifuged (3000 r·min−1) for 15 min, then the upper layer of the clarified liquid was aspirated. The supernatant was filtered through a 0.22 μm membrane, and the renewed filtrate was taken as the test solution.

3.4. UHPLC-MS Detection Conditions

3.4.1. Chromatographic Conditions

The chromatographic conditions were as follows: aqueous formic acid (0.1%, v/v) and acetonitrile formic acid (0.1%, v/v) were used as mobile phases A and B, respectively. The elution gradient program was as follows: 0–2 min, 5% B; 2–22 min, 5–100% B; 22–26 min, 100% B; 26–27 min, 100–5% B; 27–32 min, 5% B. The flow rate was 0.3 mL·min−1, and the injection volume was 10 μL.

3.4.2. Mass Spectrometry Conditions

The parameters of the high-resolution mass spectrometry were set as follows: sheath gas pressure of 40 psi; auxiliary gas pressure of 20 psi; purge gas pressure of 10 psi; capillary voltage of 3 kV; and ion transfer tube temperature of 320 °C. The AUG gas heating temperature was 350 °C; the collision gas was nitrogen; the normalized collision energies were 20, 40, and 60 eV; and the RF lens amplitude field strength (s-lens) was 60. Combined with selecting a complete primary MS scan, it automatically triggers the secondary MS scan mode (full MS-DD MS2). The resolutions of the primary and secondary high-resolution mass spectrometers were 70,000 FWHM and 17,500 FWHM, respectively; the ion scanning range was m/z 50–1500; the cycle counting was 3; the isolation window was 1.5 m/z; and the dynamic exclusion time was 5 s.

3.5. Analysis of Chemical Constituents in CF-CS Extracts

Ultra-high-performance liquid chromatography–tandem mass spectrometry analysis uses positive and negative ion modes to scan for data simultaneously. Based on the precise mass-to-charge ratio of the fragmented ions, the primary high-resolution mass spectrometry data information (MS1) and secondary high-resolution mass spectrometry data information (MS2) were analyzed and processed by utilizing the Compound Discoverer 3.2™, Mass Frontier 7.0™ software and the mzCloud database, mzVault database, and ChemSpider database.

3.6. Experimental Design of the Extraction Process

3.6.1. Single-Factor Experiments

The ethanol concentration (A) (0%, 10%, 30%, 50%, 70%, 90%, 100%) was examined at a solvent-to-sample ratio of 20 mL·g−1 and a reflux time of 120 min. The reflux time (B) (30, 60, 90, 120, 150, 180, 210 min) was examined at a solvent-to-sample ratio of 20 mL·g−1 and ethanol concentration of 70%. The solvent-to-sample ratio (C) (10, 20, 30, 40, 50, 60, 70 mL·g−1) at 70% ethanol concentration and 120 min reflux time was used to determine the effect of each factor on the extraction rate of linarin in CF-CS.

3.6.2. Box–Behnken Design Optimization

Based on the results of the single-factor experiments, the Box–Behnken design optimization was designed. Linarin extraction rate (Y) was used as the response value and ethanol volume fraction (A), reflux time (B), and liquid/feed ratio (C) as the response factors to design a 3-factor, 3-level Box–Behnken design optimization to optimize the extraction process of CF-CS using Design Expert 12 software. The factors and levels of response surface methodology are shown in Table 6.

3.7. Validation of Quantitative Method for Linarin

According to the guidelines for analytical method validation in Pharmacopeia of People’s Republic of China (volume IV) (version 2020), the linearity regression curves for linarin were obtained by plotting the peak areas (y) against the concentrations (x) of linarin standard solution. The precision of the method was evaluated by the same standard solution six times with successive injections. The stability test was performed by analyzing the same sample solution at 0, 2, 4, 6, 8, 12, 18, and 24 h. The repeatability was determined by preparing six sample solutions independently and calculating the RSD of the contents. The recovery test was conducted to evaluate the accuracy of this method. The recovery test of a solution was performed by adding a known amount of linarin standard solution to the six sample solutions and calculating the recovery rate and the RSD.

3.8. Determination of Linarin Content

The test solution described in Section 3.7 and was taken and analyzed using the UHPLC-MS method under the detection conditions in Section 3.4.

3.9. Study on the Role of Coagulation and Hemostasis

3.9.1. In Vitro Coagulation Assay in Rabbits

For each assay, 70% ethanol was taken as a blank control and Yunnan Baiyao extract as a positive control. CF extract, CS extract, and 1 mL of CF-CS extract were placed in a 5 mL test tube, and three drops of disodium citrate were added. After blood was taken from the vein at the edge of the ear of rabbits, 1 mL was added to the abovementioned test tubes, and then 25 μL of 0.2 mol·L−1 CaCl2 was added and mixed well. The process was timed, and the test tubes were tilted every 30 s until the blood clotted and no longer flowed. The timer was then stopped, the coagulation time was recorded, and the measurement was repeated six times.

3.9.2. Bleeding Test of the Marginal Artery of the Ear in Rabbits

Rabbits were anesthetized with 10% chloral hydrate (2 mL·kg−1, intravenously). The dorsal side of the rabbit ear was debrided, tapped so that the ear veins were engorged, and then disinfected with 75% alcohol wipes. Then, a bleeding wound was created by making a 1 cm transverse cut with a scalpel blade in the central part of the outer side of the ear, including at least the arteries and veins (in the proximal third of the streets in the rabbit’s ear). The bleeding wound was first allowed to sit for 5 s to ensure normal bleeding. Then, the same quality of hemostatic material (Yunnan Baiyao, CF-CS) was pressed onto the bleeding wound, and after 10 s of pressure, the pressure was stopped. The clock was started, during which time the outflow of blood from the surface was gently absorbed with a filter paper until there was no more blood that the filter paper could drink. The time of hemostasis was recorded, and the measurement was repeated 6 times.

3.9.3. Data Processing

SPSS was used to process the data, and an independent samples t-test was performed for coagulation time and bleeding time. p < 0.05 was considered as a statistically significant difference, and p < 0.01 was regarded as a highly statistically significant difference.

3.10. Study of Anti-Inflammatory Effects

3.10.1. Xylene-Induced Ear Swelling Experiment in Rabbits

Thirty-six rabbits were selected and randomly divided into six groups: the blank group, the model group, the positive control group (0.500 g·kg−1 of Jingwanhong ointment), the CF-CS group (equivalent to the amount of raw CF-CS 1.802 g·kg−1), the CF group, and the CS group (the dosage administered was the same as in the CF-CS group). In the model group, only modeling was carried out without drug administration. Each group was coated with the corresponding drugs on the anterior and posterior surfaces of the rabbit’s right ear once/d for 7 consecutive days, and 100 μL of xylene was applied uniformly on the inner and outer surfaces of the auricle of the rabbit’s right ear 1 h after the last administration, except for the blank control group, and the left ear was the control. After 30 min, the rabbits were euthanized, both ears were cut off, and after overlapping the ears and aligning the edges of the ears, the ear pieces were punched off with a 6 mm diameter perforator and weighed sequentially. The degree of ear swelling was calculated according to Formula (1a) and the rate of ear swelling according to Formula (1b). The weighed ear pieces were quickly placed in 4% paraformaldehyde for fixation, then histopathological sections were made, and the histopathological sections were observed under a light microscope.
Degree   of   swelling   m g = right   earpiecequality left   earpiecequality
Swelling   inhibition   rate % = mean   ear   swelling   in   the   model   group mean   ear   swelling   in   the   administered   group mean   ear   swelling   in   the   model   group × 100 %

3.10.2. LPS-Induced Inflammation in Rabbits

The grouping of experimental animals was the same as in Section 3.10.1, and the model group involved only modeling without drug administration. The blank and model groups were gavaged with sodium carboxymethylcellulose, 20 mL at a time; the positive control group was gavaged with dexamethasone 5 mg·kg−1, 20 mL at a time; the CF-CS group (equivalent to the raw CF-CS dose of 1.802 g·kg−1) was gavaged with the alcoholic extract of CF-CS, 0.35 g·kg−1, 20 mL at a time; and the CF and CS groups were administered the same amount as the CF-CS group. The gavage was performed continuously for 7 d, once a day. After 1 h of drug administration on day 7, the remaining groups, except the blank group, were subjected to intraperitoneal injection of 1 mL of LPS at a concentration of 200 μg·kg−1 to induce an inflammatory model in rabbits. Blood was collected after 3 h to detect changes in TNF-α, IL-6, and IL-1β serum levels.

3.10.3. Data Processing

SPSS was used to process the data, and an independent samples t-test was performed for TNF-α, IL-6, and IL-1β levels in serum. Statistically significant differences were defined as follows: p < 0.05 was considered significant, and p < 0.01 was considered highly significant.

4. Conclusions

This study aimed to evaluate the primary chemical components, extraction procedure, as well as the hemostatic and anti-inflammatory properties of the alcoholic extract of CF-CS. The primary active components of CF-CS extract were initially discovered using UHPLC-MS, in conjunction with mzVault, ChemSpider, and mzCloud databases, as well as the relevant literature. A total of 51 active constituents were detected, comprising 4 amino acids, 8 organic acids, 22 flavonoids, 7 phenylpropanoids, 4 alkaloids, 1 phenol, 1 terpenoid, 1 anthraquinone, and 3 other chemicals. Subsequently, the extraction rate of linarin, a constituent of the index, was evaluated. The extraction procedure of CF-CS alcohol extract was optimized using single-factor experiments and the response surface method. The ideal extraction parameters were determined to be as follows: an ethanol concentration of 70%, a reflux period of 120 min, and a liquid-to-feed ratio of 40:1 mL·g−1. Under these conditions, the linarin exhibited the greatest extraction rate of 0.2697%. Based on these criteria, the average linarin concentration was determined to be 2.93 mg·g−1. Furthermore, CF-CS extract demonstrated a notable ability to decrease clotting time and bleeding time in rabbits. It effectively mitigated xylene-induced ear swelling and reduced histopathological damage. Additionally, it exhibited inhibitory effects on the serum levels of inflammatory cytokines TNF-α, IL-6, and IL-1β in rabbits, thereby reducing the expression of inflammatory factors and improving the LPS-induced inflammatory response in rabbits. These findings suggest that they have the capacity to promote blood clotting and reduce inflammation.

Author Contributions

Conceptualization and funding acquisition: C.S.; Participated in research design: S.Z., B.C. and J.G.; Conducted experiments: F.K. and Z.F.; Performed data analysis: F.K. and Z.F.; Wrote or contributed to the writing of the manuscript: F.K. and C.S. All authors have read and agreed to the published version of the manuscript.

Funding

The authors gratefully acknowledge the financial support from North Medicine and Functional Food Characteristic Subject Project in Heilongjiang Province (No. HLJTSXK-2022-03).

Institutional Review Board Statement

Not applicable.

Informed Consent Statement

Not applicable.

Data Availability Statement

All data generated or analyzed during this study are included in this published article.

Conflicts of Interest

The authors declare no conflicts of interest.

References

  1. Chinese Pharmacopoeia Commission. Pharmacopoeia of the People’s Republic of China (One Part); China Medical Science Press: Beijing, China, 2020; Volume 50–51, pp. 26–27. [Google Scholar]
  2. Zhang, X.; Liao, M.; Cheng, X.; Liang, C.; Diao, X.; Zhang, L. Ultrahigh-performance liquid chromatography coupled with triple quadrupole and time-of-flight mass spectrometry for the screening and identification of the main flavonoids and their metabolites in rats after oral administration of Cirsium japonicum DC. extract. Rapid Commun. Mass Spectrom. 2018, 32, 1451–1461. [Google Scholar] [PubMed]
  3. Wang, H.C.; Bao, Y.R.; Wang, S.; Li, T.J.; Meng, X.S. Simultaneous determination of eight bioactive components of Cirsium setosum flavonoids in rat plasma using triple quadrupole LC/MS and its application to a pharmacokinetic study. Biomed. Chromatogr. 2019, 33, e4632. [Google Scholar] [CrossRef] [PubMed]
  4. Tang, D.X. Clinical Research of National Medical Masters: Identification and Clinical Application of Liu Shangyi’s Commonly Used Drug Pairs; Science Press: Beijing, China, 2016; p. 62. [Google Scholar]
  5. Ye, Y.; Chen, Z.; Wu, Y.; Gao, M.; Zhu, A.; Kuai, X.; Luo, D.; Chen, Y.; Li, K. Purification Process and In Vitro and In Vivo Bioactivity Evaluation of Pectolinarin and Linarin from Cirsium japonicum. Molecules 2022, 27, 8695. [Google Scholar] [CrossRef] [PubMed]
  6. Lin, P.C.; Ji, L.L.; Zhong, X.J.; Li, J.J.; Wang, X.; Shang, X.Y.; Lin, S. Taraxastane-type triterpenoids from the medicinal and edible plant Cirsium setosum. Chin. J. Nat. Med. 2019, 17, 22–26. [Google Scholar] [CrossRef] [PubMed]
  7. Mu, K.; Liu, Y.; Liu, G.; Ran, F.; Zhou, L.; Wu, Y.; Peng, L.; Shao, M.; Li, C.; Zhang, Y. A review of hemostatic chemical components and their mechanisms in traditional Chinese medicine and ethnic medicine. J. Ethnopharmacol. 2023, 307, 116200. [Google Scholar] [CrossRef] [PubMed]
  8. Shao, Y.; Hong, R.; Li, B.; Wang, A.; Chen, Y.; Wang, Y.; Mo, F.; Liu, M.; Tian, C. Extraction technology, components analysis and anti-inflammatory activity in vitro of total flavonoids extract from Artemisia anomala S. Moore. Fitoterapia 2023, 170, 105630. [Google Scholar] [CrossRef]
  9. Xiao, G.L.; Jiang, J.Y.; Cheng, P.Y.; Zhang, J.N.; Tang, R.Y.; Li, D.M.; Li, Y.X. Analysis of Chemical Constituents in the Leaves of Pluchea lndica (L.) Less. by UPLC-O-TOF-MS/MS. J. Instrum. Anal. 2023, 42, 1424–1433. [Google Scholar]
  10. Jiang, Q.Y.; Li, C.C.; Chen, H.L.; Huang, Z.F.; Zhao, W.; Liang, Y.; Pan, H.F.; Zhuo, Y. Qualitative and Quantitative Analysis of Chemical Constituents in Liu Junzitang by UPLC-O-TOF-MS/MS and UPLC-UV. Chin. J. Exp. Tradit. Med. Form. 2023, 1–14. [Google Scholar]
  11. Gou, X.L.; Ding, Y.; Lu, Y.T.; Yi, H.; Xie, Y.C.; Zeng, Y.J.; Fan, G. Chemical Composition Analysis of Tibetan Medicine Sabinae strobilus Based on UPLC-Q-Exacutive Orbitrap MS Technology. J. Chengdu Univ. Tradit. Chin. Med. 2023, 46, 22–30. [Google Scholar]
  12. Ma, D.Y.; Gao, X.Y.; Peng, L.F.; Wu, S.F.; Wang, Q.T.; Hao, Z.H. Composition Analvsis of Seed of Areca catechu L. in Deep Processing Based on UHPLC-QE-Orbitrap-Ms Technology. Acta Vet. Zootech. Sinica. 2023, 54, 5275–5292. [Google Scholar]
  13. Wang, L.L.; Li, Y.C.; Ma, Z.; Yang, C.L. Rapid analysis of chemical constituents of Bidens by ultra-performance liquid chromatography-quadrupole/exactive orbitrap mass spectrometer. Chem. Ana. Meterage 2023, 32, 11–17. [Google Scholar]
  14. Tao, X.; Zhang, J.X.; Hu, Q.; Sun, J.; Dong, Y.; Ding, J.G.; Yu, H.; Shen, Y.Y.; Mao, X.H.; Ji, S. Simultaneously quantitative analysis of 35 components in gualoupi injection using hydrophilic interaction liquid chromatography tandem mass spectrometry. Acta Pharm. Sin. 2023, 58, 1293–1300. [Google Scholar]
  15. Hong, L.L.; Zhao, Y.; Chen, W.D.; Yang, C.Y.; Li, G.Z.; Wang, H.S.; Cheng, X.Y. Tentative exploration of pharmacodynamic substances: Pharmacological effects, chemical compositions, and multi-components pharmacokinetic characteristics of ESZWD in CHF-HKYd rats. Front. Cardiovasc. Med. 2022, 9, 913661. [Google Scholar] [CrossRef] [PubMed]
  16. Li, Y.; Yang, H.; Liao, H.; Fan, H.; Liang, C.; Deng, L.; Jin, S. Simultaneous determination of ten biogenic amines in a thymopolypeptides injection using ultra-performance liquid chromatography coupled with electrospray ionization tandem quadrupole mass spectrometry. J. Chromatogr. B Analyt Technol. Biomed. Life Sci. 2013, 929, 33–39. [Google Scholar] [CrossRef] [PubMed]
  17. Meng, Y.; Zhao, Y.J.; Xue, Z.P.; Wang, N.; Bai, J.Q.; Wang, X.P. Analysis of chemical constituents in Rhamnus erythroxylum Pallas by HPLC-Q-TOF-MS. Cent. South Pharm. 2024, 22, 78–85. [Google Scholar]
  18. Lv, W.S.; Wei, C.J.; Pan, X.J.; Yang, W.H.; He, M.Y.; Chen, X.D.; Sun, D.M.; Wei, M.; Li, Z.Y. Variations of Chemical Components in lnula japonica by UPLC-MS/MS before and after Honey-frying. J. China Pharm. 2021, 32, 2478–2484. [Google Scholar]
  19. Xie, Y.; Ye, K.W.; Li, B.; Hou, X.T. Analysis of chemical constituents in Kanglao Capsule by UHPLC-Q-TOF-MS/MS. Chin. Tradit. Patent Med. 2023, pp. 1–9. Available online: http://kns.cnki.net/kcms/detail/31.1368.R.20231024.1512.004.html (accessed on 19 March 2024).
  20. Li, Y.S. Study on chemical composition and extraction technology of Xinhui tangerine peel. FOSU 2022. [Google Scholar]
  21. Zhao, Y.M.; Zhang, L.X.; Yang, S.Y.; Wang, Z.K.; Li, C.Y.; Shu, Y.C. Characterization of chemical constituents from traditional Chinese medicine Schizonepetae Spica based on UHPIC-Q-TOF-MS/MS technique. China J. Chin. Mater. Med. 2024, 49, 420–430. [Google Scholar]
  22. Chen, X.; Zhang, X.R.; Mu, L.T.; Ren, H.X.; Zhang, Y.; Wang, L.H.; Sun, C.H. Characterization of chemical constituents and identification of absorbed prototypes components in rat serum of Scutellaria baicalensis by UHPLC-Q-Orbitrap-MS. Chin. Tradit. Herb. Durg. 2023, 54, 2722–2732. [Google Scholar]
  23. Su, K.X.; Zhao, Y.H. Bioactivity Evaluation and UPLC-MS Analysis of Different Solvent Extracts from Flat-European Hazelnut By-products. Food Sci. 2023, pp. 1–15. Available online: http://kns.cnki.net/kcms/detail/11.2206.TS.20230530.0925.014.html (accessed on 19 March 2024).
  24. Min, S.; Liu, R.; Wang, Y.; Wang, D.Y.; Wang, S. Determination of capsaicin in edible oils by ultra performance liquid chromatography-tandem mass spectrometry. J. Food Saf. Qual. 2021, 12, 5707–5712. [Google Scholar]
  25. Jing, L.J.; Xiao, W.K.; Gan, Y.X.; Meng, X.L.; Chen, X.R.; Zheng, S.C. Study on the chemical constituents of Prepared Chuanwu-White Paeonia lactiflora pairs based on UPLC-Q-Orbitrap HRMS technique. Chin. Med. Mat. 2023, 4, 911–918. [Google Scholar]
  26. Ma, B.J.; Xiao, Y.; Chen, Z.D.; Shu, R.G.; Li, T.; Jiang, L.; Xu, G.L.; Zhang, Q.Y. Analysis of Chemical Constituents in Percolate the Extract of Cyclocarya paliurus Tender Leaves by UHPLC-Q-TOF-MS/MS. Sci. Technol. Food Ind. 2023, 44, 281–291. [Google Scholar]
  27. Zhang, J.W.; Liu, W.; Shen, Q.; Li, L. Analysis of Chemical Components and Tissue Distribution of Lujiao Formula Based on UPLC-Q-Orbitrap-MS. Chin. J. Exp. Tradit. Med. Form. 2024, 30, 148–156. [Google Scholar]
  28. Li, J.F.; Zhao, L.J.; Zhang, J.Q.; Wang, J.Y.; Zhang, Y.; Wang, Y.L.; Yin, H.Q.; Han, R.; Yang, Z.; Song, L.L.; et al. Analysis of in vivo and in vitro components of Dachaihu Decoction by UPLC-QTOF/MS. Chin. Tradit. Patent Med. 2023, 45, 2124–2130. [Google Scholar]
  29. Park, J.Y.; Jo, S.G.; Lee, H.N.; Choi, J.H.; Lee, Y.J.; Kim, Y.M.; Cho, J.Y.; Lee, S.K.; Park, J.H. Tendril extract of Cucurbita moschata suppresses NLRP3 inflammasome activation in murine macrophages and human trophoblast cells. Int. J. Med. Sci. 2020, 7, 1006–1014. [Google Scholar] [CrossRef] [PubMed]
  30. Mohany, M.; Ahmed, M.M.; Al-Rejaie, S.S. Molecular Mechanistic Pathways Targeted by Natural Antioxidants in the Prevention and Treatment of Chronic Kidney Disease. Antioxidants 2021, 11, 15. [Google Scholar] [CrossRef] [PubMed]
  31. Shan, S.N.; Xie, M.Y.; Wang, L.; Wei, M.L.; Liu, X.Q.; Cheng, W.X. ldentification and quality study of Cirsium japonicum and itsadulterants by FT-IR. Cent. South Pharm. 2022, 20, 2076–2081. [Google Scholar]
  32. Xie, M.Y.; Zhang, Z.; Huang, Y.; Zhang, Z.P.; Hu, Y.; Cheng, X.R. Study on HPLC Characteristic Chromatogram and Chemical Pattern Recognition of Different Medicinal Parts of Cirsium japonicum. J. China Pharm. 2020, 31, 820–825. [Google Scholar]
Figure 1. UHPLC–ESI–Q–Orbitrap base peak chromatogram (BPC) obtained in positive ion modes of CF–CS extract.
Molecules 29 01918 g001
Figure 2. UHPLC–ESI–Q–Orbitrap base peak chromatogram (BPC) obtained in negative ion mode of CF–CS extract.
Molecules 29 01918 g002
Figure 3. Effect of ethanol concentration ((A), %), reflux time ((B), min), and solvent-to-sample ratio ((C), mL·g−1) on the extraction rate of linarin.
Molecules 29 01918 g003
Figure 4. Response surface diagram of the effects of different factors on the yield of linarin. The variables of the two changes are ethanol concentration and reflux time (A); ethanol concentration and solvent−to−sample ratio (B); reflux time and solvent-to-sample ratio (C).
Molecules 29 01918 g004
Figure 5. Effect of groups on clotting time in rabbits (x ± s, n = 6). Note: For each administration group compared to the blank control group, ** p < 0.01.
Molecules 29 01918 g005
Figure 6. Effect of groups on bleeding time in rabbits. Note: For each administration group compared to the blank control group, * p < 0.05, ** p < 0.01.
Molecules 29 01918 g006
Figure 7. Effect of swelling in each administration group versus model control group. Note: For each administration group compared to the model control group, ** p < 0.01.
Molecules 29 01918 g007
Figure 8. Histopathological observations of the ears of rabbits with swollen ears in each group (HE, ×200). Note: Thickening of the stratum spinosum (black arrow), disruption of the ear cartilage and subcutaneous connective tissue, widening of the interstitial space (red arrow), and infiltration of inflammatory cells (blue arrow).
Molecules 29 01918 g008
Figure 9. (A) The effect of the administered group on the serum level of TNF−α in rabbits; (B) the effect of the administered group on the serum level of IL−6 in rabbits; (C) the effect of the administered group on the serum level of IL−1β in rabbits. Note: Compared with the model control group in each administration group, ** p < 0.01; compared with the blank group, ## p < 0.01.
Molecules 29 01918 g009
Table 1. Preliminary results of chemical constituents in the alcoholic extract of CF–CS.
No.tR
(min)
Compound[M+H]+
(m/z)
[M−H]
(m/z)
FormulaError (ppm)MS2/m/zCompound ClassReference
10.91DL-Arginine175.11871 C6H15O2N4−1.383130.09734amino acids[9]
20.98D-(-)-Quinic acid 191.0553C7H11O61.494173.04468, 155.03383, 137.02299, 127.03873organic acids[9]
31.05Guanine152.05647 C5H6ON5−1.423135.02994, 110.03501alkaloids[10]
41.05DL-Stachydrine144.10178 C7H14O2N−0.869102.05520, 98.09674alkaloids[11]
51.05Trigonelline138.05487 C7H8O2N−0.616121.06477, 110.06025, 94.06547alkaloids[12]
61.05D-(+)-Proline116.07080 C5H10O2N1.67998.06027, 70.06575amino acids[13]
71.05Betaine118.08638 C5H12O2N1.057100.07584, 72.08136alkaloids[9]
81.10Malic acid 133.01288C4H5O5−2.02871.01218, 115.00221organic acids[9]
91.174-Guanidinobutyric acid146.09221 C5H12O2N3−1.322128.08156, 86.06042, 69.09171organic acids[14]
101.17Salsolinol180.10158 C10H14O2N−1.806163.07486, 151.07474, 137.05939others[15]
111.17L-Phenylalanine166.08600 C9H12O2N−1.536121.06471, 119.04895, 103.05429amino acids[9]
121.36L-Pyroglutamic acid 128.03394C5H6O3N−2.18482.02816amino acids[12]
131.43Tyramine138.09119 C8H12ON−1.09121.06479, 103.05445, 93.07022others[16]
144.35Gentisic acid 153.01811C7H5O4−0.818109.02798, 91.01743organic acids[17]
154.35Protocatechuic acid 153.01811C7H5O4−0.818109.02798, 91.02014organic acids[9]
166.81Protocatechualdehyde 137.02312C7H5O3−1.464119.01241, 123.00711phenols[12]
176.81Salicylic acid 137.02312C7H5O3−1.829119.01241, 109.02798organic acids[12]
187.63Neochlorogenic acid 353.08817C16H17O94.139191.05528, 173.04469, 161.02319phenylpropanoids[9]
197.7Chlorogenic acid355.10144 C16H19O9−2.587179.05412, 191.05495, 173.04431, 161.02290, 135.04384phenylpropanoids[9]
208.03Daphnetin 177.01843C9H5O41.101121.02822, 133.02815,phenylpropanoids[18]
218.03Bergenin 327.07251C14H15O91.085312.03429, 234.02808, 192.02785phenylpropanoids[19]
228.30Caffeic acid 179.03409C9H7O41.144135.04379, 117.03312, 107.04871organic acids[9]
239.123-O-Famprofazone 367.10391C17H19O94.226193.05006, 173.04462, 191.05490organic acids[9]
249.39Rutin 609.14691C27H29O163.117301.03467, 285.04059, 271.02509, 227.03450, 151.00270flavonoids[9]
259.39Kaempferol-7-O-neohesperidoside 593.15295C27H29O152.962577.97946, 285.04056flavonoids[20]
269.53Hyperoside 463.08871C21H19O123.472316.02271, 301.03601, 287.02005, 271.02515flavonoids[9]
279.66Luteolin-7-O-glucoside 447.09402C21H19O114.098285.04047, 151.00221, 133.02782flavonoids[21]
289.74Scutellarin463.08572 C21H19O12−2.985287.05402, 269.04480, 153.01784, 135.04370flavonoids[22]
2910.42Apigenin 7-O-glucuronide447.09125 C21H19O11−2.097269.05927, 187.03818, 153.01785, 119.04910flavonoids[21]
3010.494,5-Dicaffeoylquinic acid 515.12006C25H23O123.218353.08817, 191.05525, 179.03404, 173.04459, 135.04379phenylpropanoids[9]
3110.493,5-Dicaffeoylquinic acid 515.11981C25H23O120.603353.08817, 179.03404, 173.04459phenylpropanoids[9]
3210.566-O-Methylscutellarin477.10190 C22H21O12−1.787299.06982, 284.04636, 272.11987, 186.01543, 168.00481, 137.05907, 121.02834flavonoids[22]
3311.37Pectolinarin623.19562 C29H35O15−2.289477.13788, 315.08527, 300.06201flavonoids[2]
3411.37Linarin593.18604 C28H33O14−0.745447.12650, 285.07465, 270.05136, 242.05632, 153.01770flavonoids[2]
3511.79Isorhamnetin317.06442 C16H13O7−3.656168.00479, 153.01802flavonoids[17]
3611.79Fisetin287.05423 C15H11O6−2.733269.04388, 165.04852, 157.05414, 153.01796, 135.04391flavonoids[23]
3711.85Nepetin 315.05148C16H11O74.923300.02765, 243.02972, 228.04236, 201.01862, 188.04700, 165.98959, 136.98665flavonoids[17]
3811.85Luteolin 285.04065C15H9O64.51241.05040, 171.05032, 153.02318, 135.02812flavonoids[17]
3911.85Quercetin 301.03561C15H9O74.421201.03961, 153.00240, 137.03880, 121.02810flavonoids[23]
4012.06Dihydrocapsaicin308.22092 C18H30O3N−3.57290.21048, 262.21564, 184.13004, 137.07539, 122.05996others[24]
4112.54Corchorifatty acid F 327.21802C18H31O54.338309.12856, 291.19626terpenes[25]
4212.68Tricin329.06696 C17H13O74.196313.04358, 300.01981, 272.02499, 161.02321flavonoids[26]
4312.74Hispidulin301.06982 C16H13O6−2.805286.04633, 168.00494, 153.99683, 119.01024, 107.02839flavonoids[17]
4412.74Apigenin271.05939 C15H11O5−2.619243.06456, 229.04869, 197.05914, 163.03847, 153.01791flavonoids[2]
4512.74Genistein271.05936 C15H11O5−2.73253.04716, 225.05359, 197.05914, 137.02843, 153.01791flavonoids[27]
4612.81Diosmetin 299.05624C16H11O64.098284.03287, 164.01042, 136.98671flavonoids[2]
4714.93Physcion285.07495 C16H13O5−2.806257.07962, 242.05663, 213.05420, 153.01784anthraquinones[28]
4815.00Glycitein 283.06137C16H11O54.487240.04251, 223.03918, 211.03937flavonoids[17]
4915.00Acacetin 283.06137C16H11O54.487268.03796, 240.04251, 151.00246flavonoids[2]
5015.20Pectolinarigenin315.08514 C17H15O6−3.728300.06189, 257.04364, 154.99695, 135.04384flavonoids[2]
5115.34Scopoletin193.04913 C10H9O4−2.099178.02556, 133.02820, 105.03364phenylpropanoids[17]
Table 2. Design and results of the response surface experiment.
No.Ethanol
Concentration (A)/%
Heating Reflow Time (B)/minSolvent-to-Sample Ratio (C)/mL·g−1Extraction Rate/%
1−10−10.1771
210−10.2214
3−1010.1878
41010.2020
5−1−100.1716
61−100.2005
7−1100.1336
81100.1568
90−1−10.2295
100−110.2362
1101−10.2117
120110.1855
130000.2698
140000.2651
150000.2600
160000.2668
170000.2668
Table 3. Response surface experiment variance analysis table.
SourceSum of SquaresdfMean SquareF-Valuep-ValueSignificant
Model0.028890.0032239.71<0.0001significant
A0.001510.0015114.40<0.0001
B0.002810.0028210.99<0.0001
C0.000110.00017.440.0295
AB8.122 × 10−618.122 × 10 −60.60770.4612
AC0.000210.000216.950.0045
BC0.000310.000320.250.0028
A20.014810.01481110.12<0.0001
B20.007010.0070522.16<0.0001
C20.000410.000427.030.0013
Residual0.000170.0000
Lack of Fit0.000030.00001.060.4583not significant
Pure Error0.000140.0000
Cor Total0.028916
R20.9968
Adjusted R20.9926
Predicted R20.9742
Adeq Precision46.8088
Table 4. The recovery test results of linarin.
CompoundOriginal (µg)Added (µg)Found (µg)Recovery Yield (%)RSD (%)
Linarin100.3307101.0880201.030899.61.64
97.2304200.8688102.5
98.4671200.2837100.7
100.7545200.048798.2
97.7450200.0459101.2
97.1247200.6140102.4
Table 5. Results of linarin content determination.
CompoundNo.Content (mg·g−1)Average Content (mg·g−1)RSD%
Linarin12.982.921.43
22.92
32.88
42.91
52.87
62.95
Table 6. Factors and levels table of response surface methodology.
LevelEthanol
Concentration (A)/%
Heating Reflow Time (B)/minSolvent-to-Sample Ratio (C)/mL·g−1
−1509030
07012040
19015050
Disclaimer/Publisher’s Note: The statements, opinions and data contained in all publications are solely those of the individual author(s) and contributor(s) and not of MDPI and/or the editor(s). MDPI and/or the editor(s) disclaim responsibility for any injury to people or property resulting from any ideas, methods, instructions or products referred to in the content.

