Composition of Typical Tea Tree Oil
A sample of commercial tea tree oil was analyzed by GC to establish a “benchmark” composition for the target monoterpenes. The eight monoterpenes of interest, which comprise approximately 87% of the tea tree oil, are listed in
Table 1, together with their characteristic relative retention times and the percentage contribution of each component to the total 8 monoterpenes.
Table 1.
Retention times and composition of the target monoterpenes.
Table 1.
Retention times and composition of the target monoterpenes.
| Monoterpenes | Retention Times (min) | % Composition |
|---|
| α-Pinene | 6.594 | 3.10 |
| α-Terpinene | 9.309 | 9.60 |
| para-Cymene | 9.666 | 3.30 |
| 1,8-Cineole | 9.978 | 13.4 |
| γ-Terpinene | 10.843 | 20.6 |
| Terpinolene | 11.901 | 4.80 |
| Terpinen-4-ol | 15.890 | 40.6 |
| α-Terpineol | 16.484 | 4.50 |
Five sample types were used, namely whole dried leaves, crushed dried leaves, whole fresh leaves, crushed fresh leaves, and rehydrated whole dried leaves. Composition of the oil, as reflected in the alteration of ratios between oil components was also assessed. For the purpose of this work, the term “complete extraction” was defined as obtaining at least 95% of target analytes in the first extraction step, bearing in mind that extractions were not expected to be fully efficient.
(A) Model Matrix
(1) Commercial Tea Tree Oil on Filter Paper
Samples of the same commercial tea tree oil were placed on filter paper (a simple matrix) and extracted separately at different scCO
2 densities (0.25, 0.40 and 0.60 g/mL) using a chamber temperature (CT) of 40°C. For each density, three successive extractions were performed to assess whether the target components had been extracted completely. Results are shown in
Figure 1.
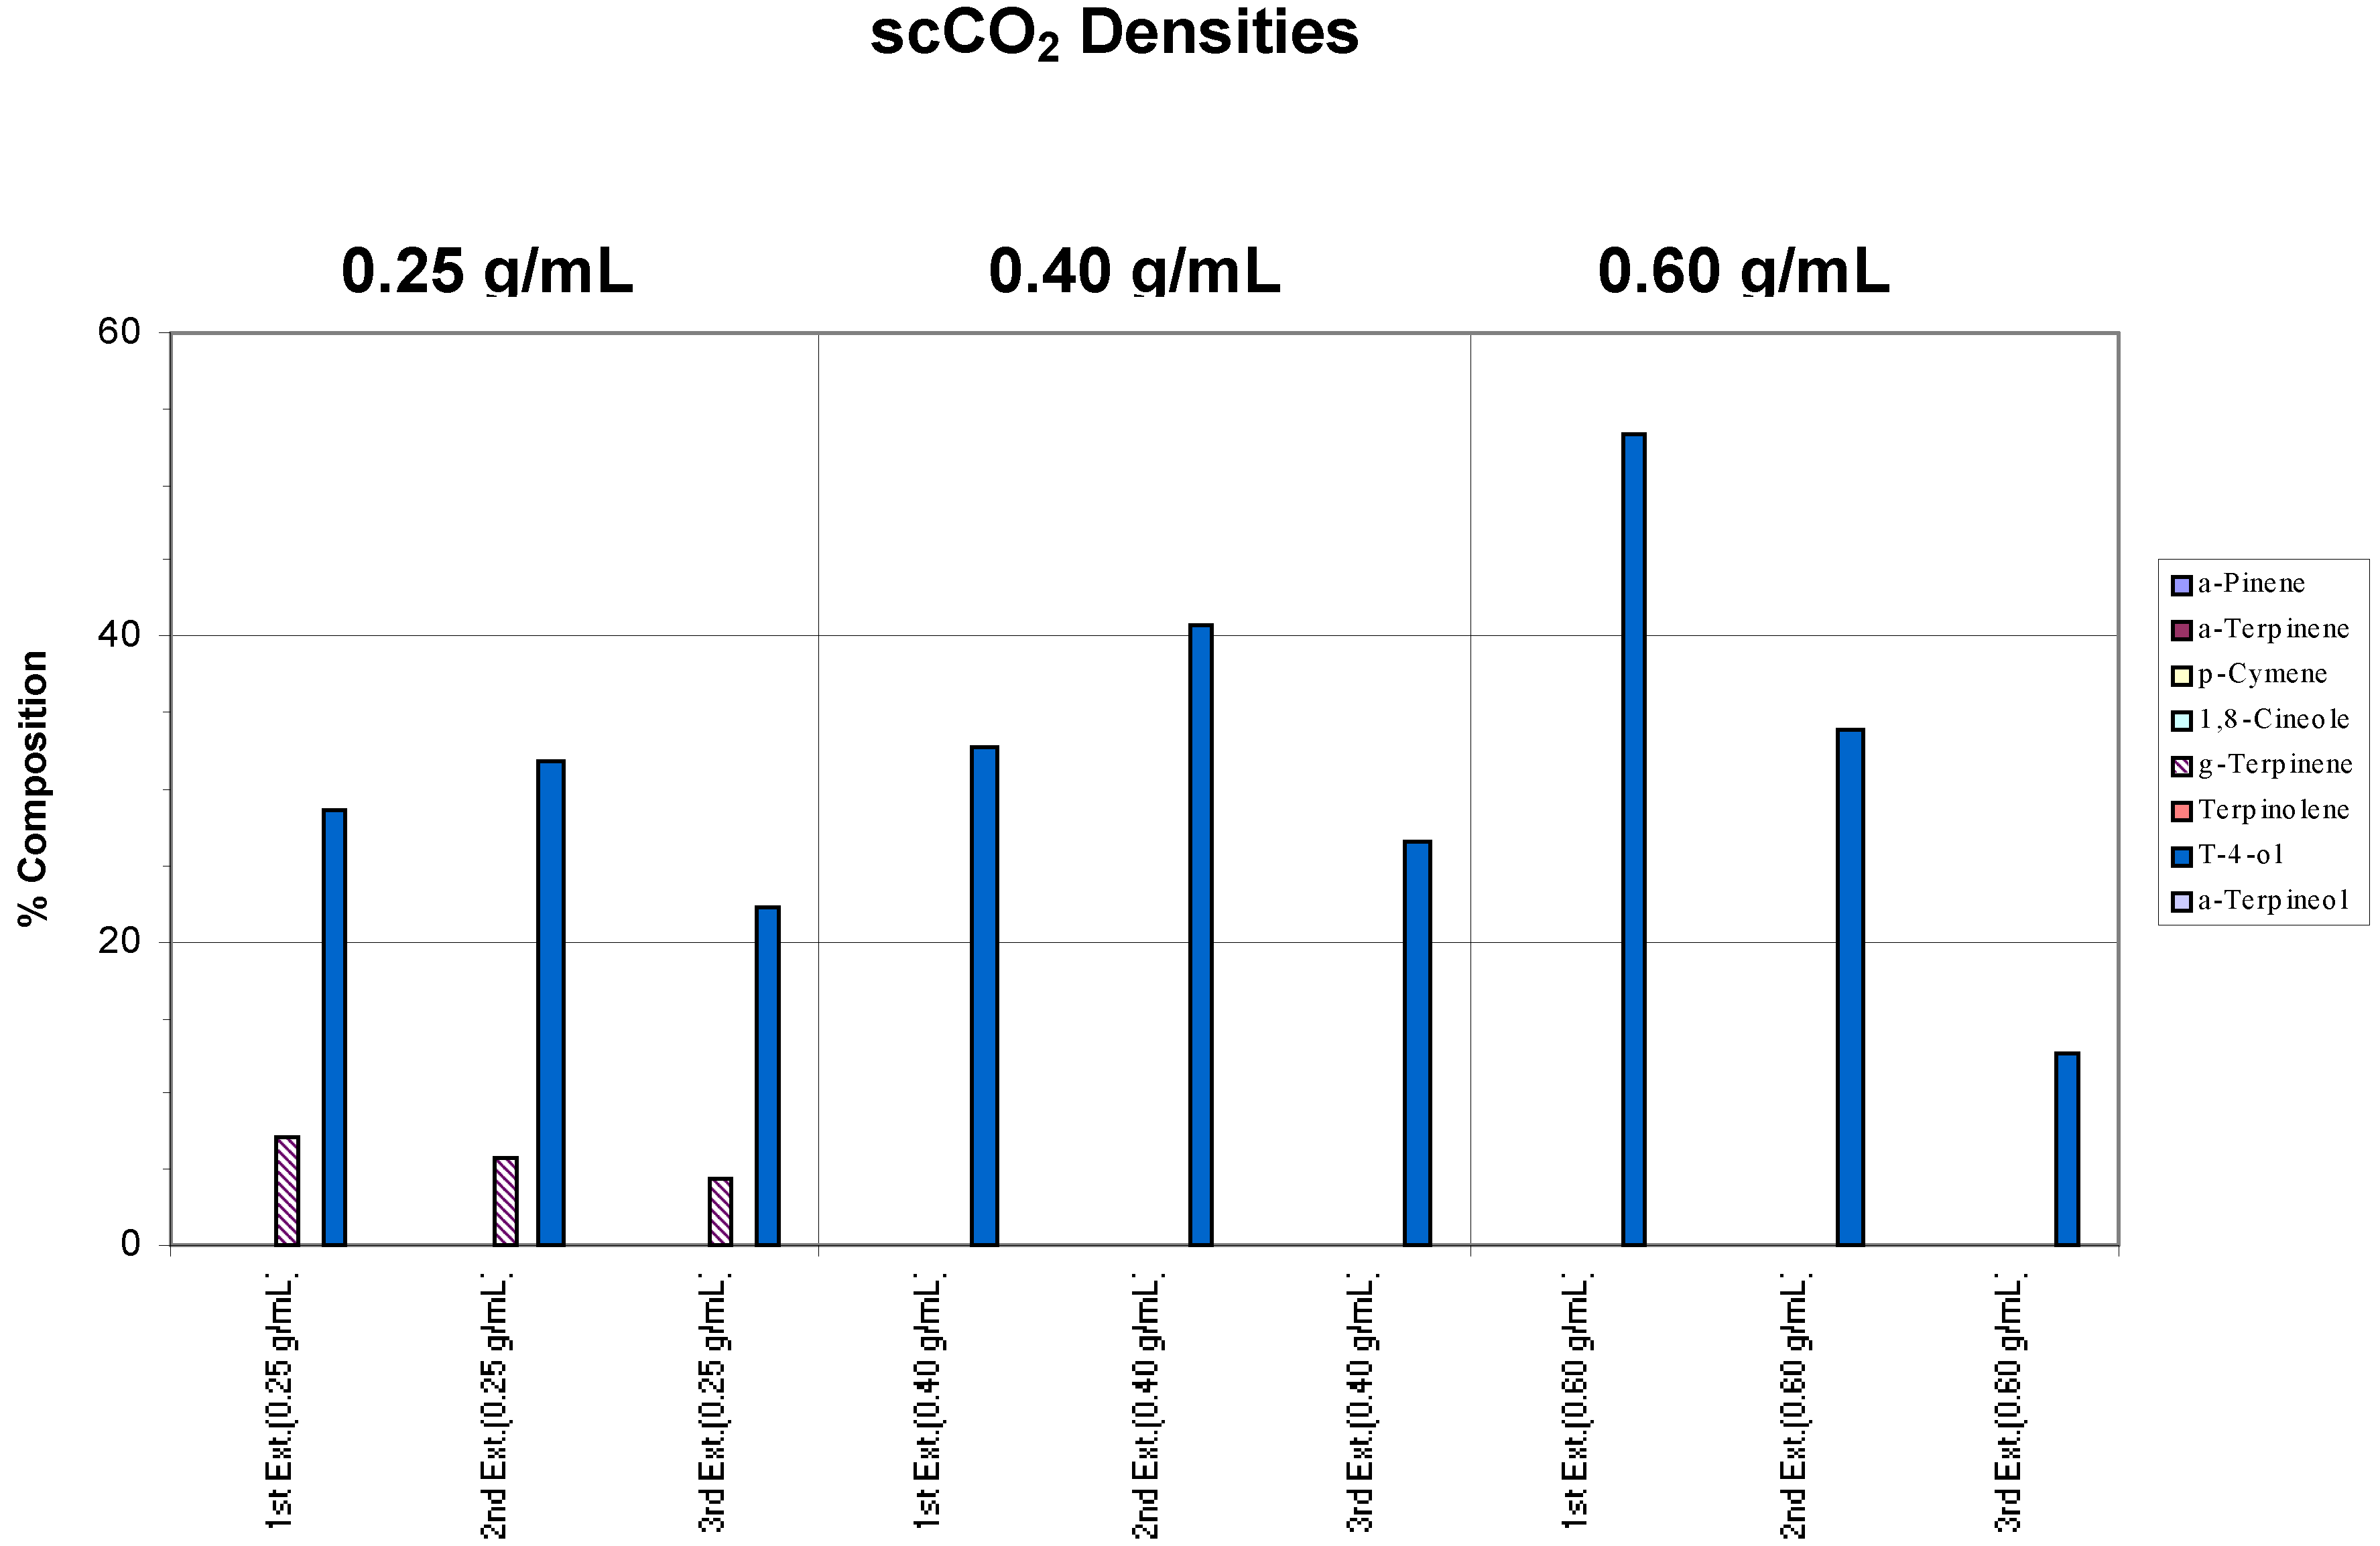
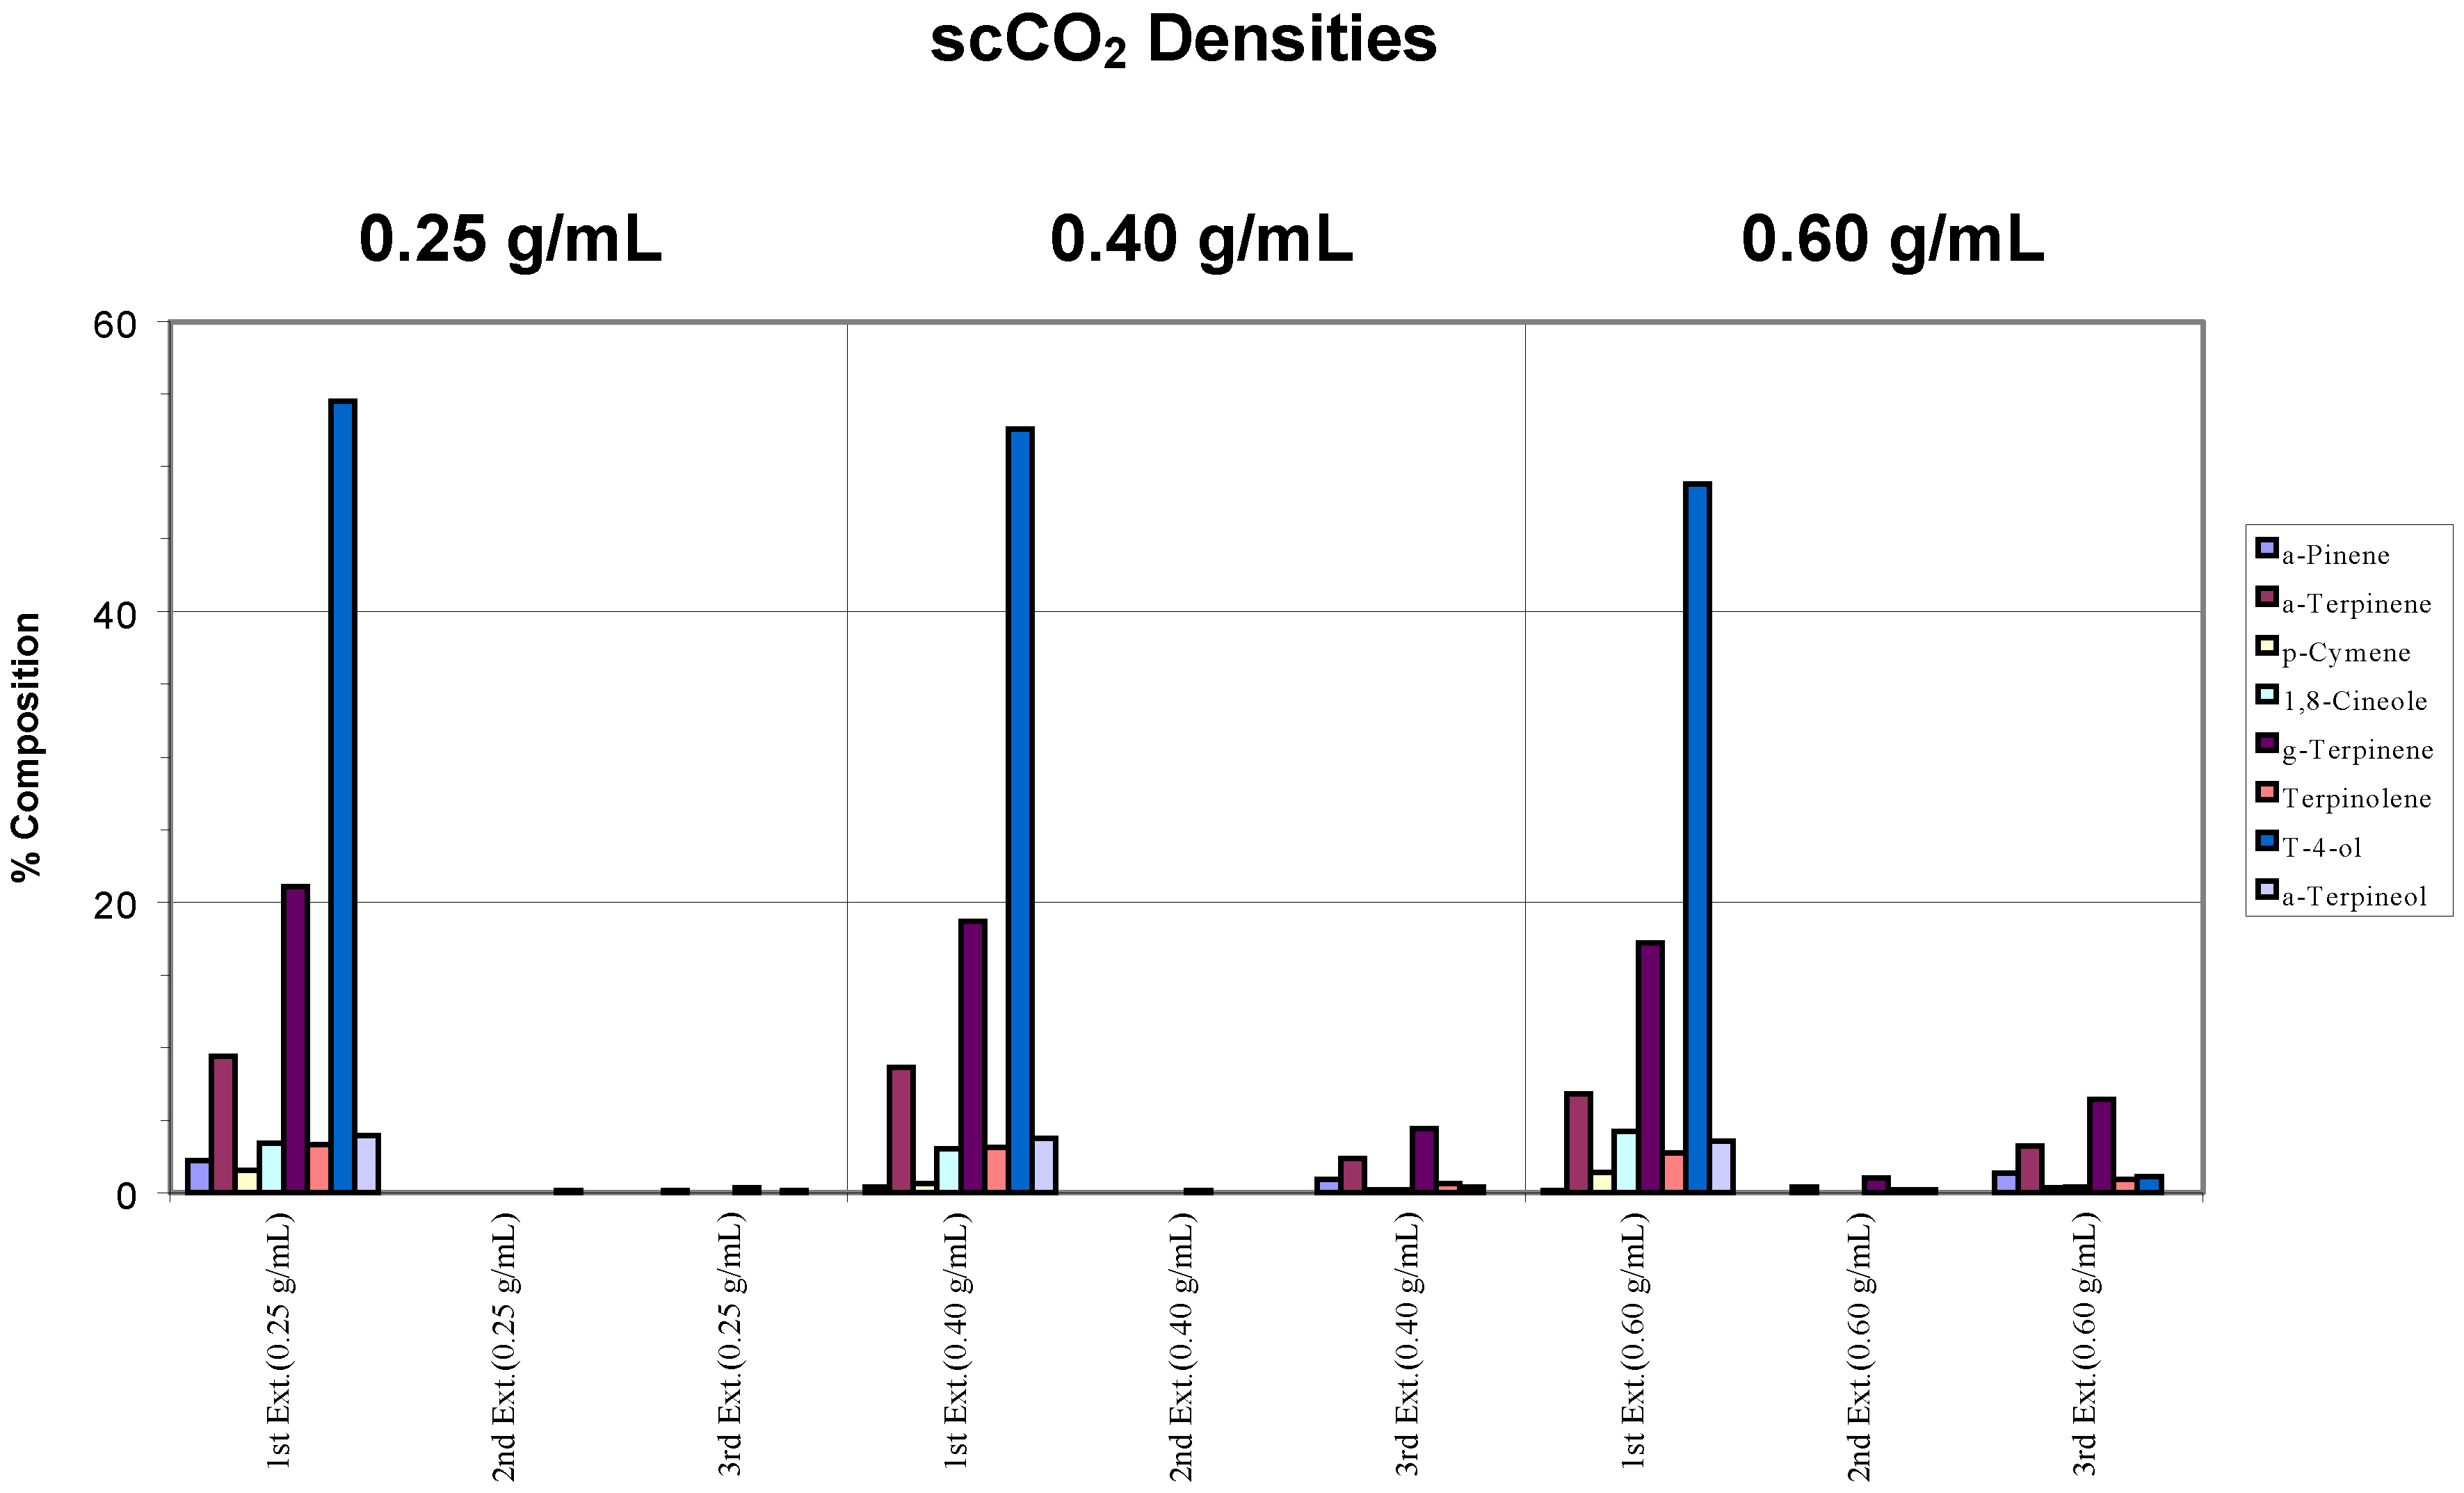
Figure 1.
Effects of different conditions on the extraction of commercial tea tree oil from a simple matrix. The chamber temperature was set at 40°C. Note in the chart legend that “g-Terpinene” was used to denote γ-Terpinene, “a-Pinene” represented α-Pinene and “t-4-ol” was used in place of Terpinen-4-ol, and so on. “Ext.” has been used to denote extraction. These naming conventions will be adhered to in subsequent charts.
Compared to the “benchmark” (pure commercial tea tree oil),
Figure 1 shows that 95% of the target analytes appeared in the extract from the first extraction step. As defined above, this indicated that extraction was complete after one extraction cycle at all the scCO
2 densities employed. The ratios between each component were also generally maintained, hence, there was no specific component selectivity observed in the extractions. However, a decreasing concentration of α-pinene was observed as the density of the supercritical fluid was increased such that at 0.60 g/mL scCO
2 density, this component was no longer found. This loss may be attributed to the inability of the trap to retain this, the most volatile of the terpenes, during the passage of the large volume of CO
2 gas generated by decompression of high density scCO
2.
(B) Real Sample Matrices
(1) Whole Fresh Leaves
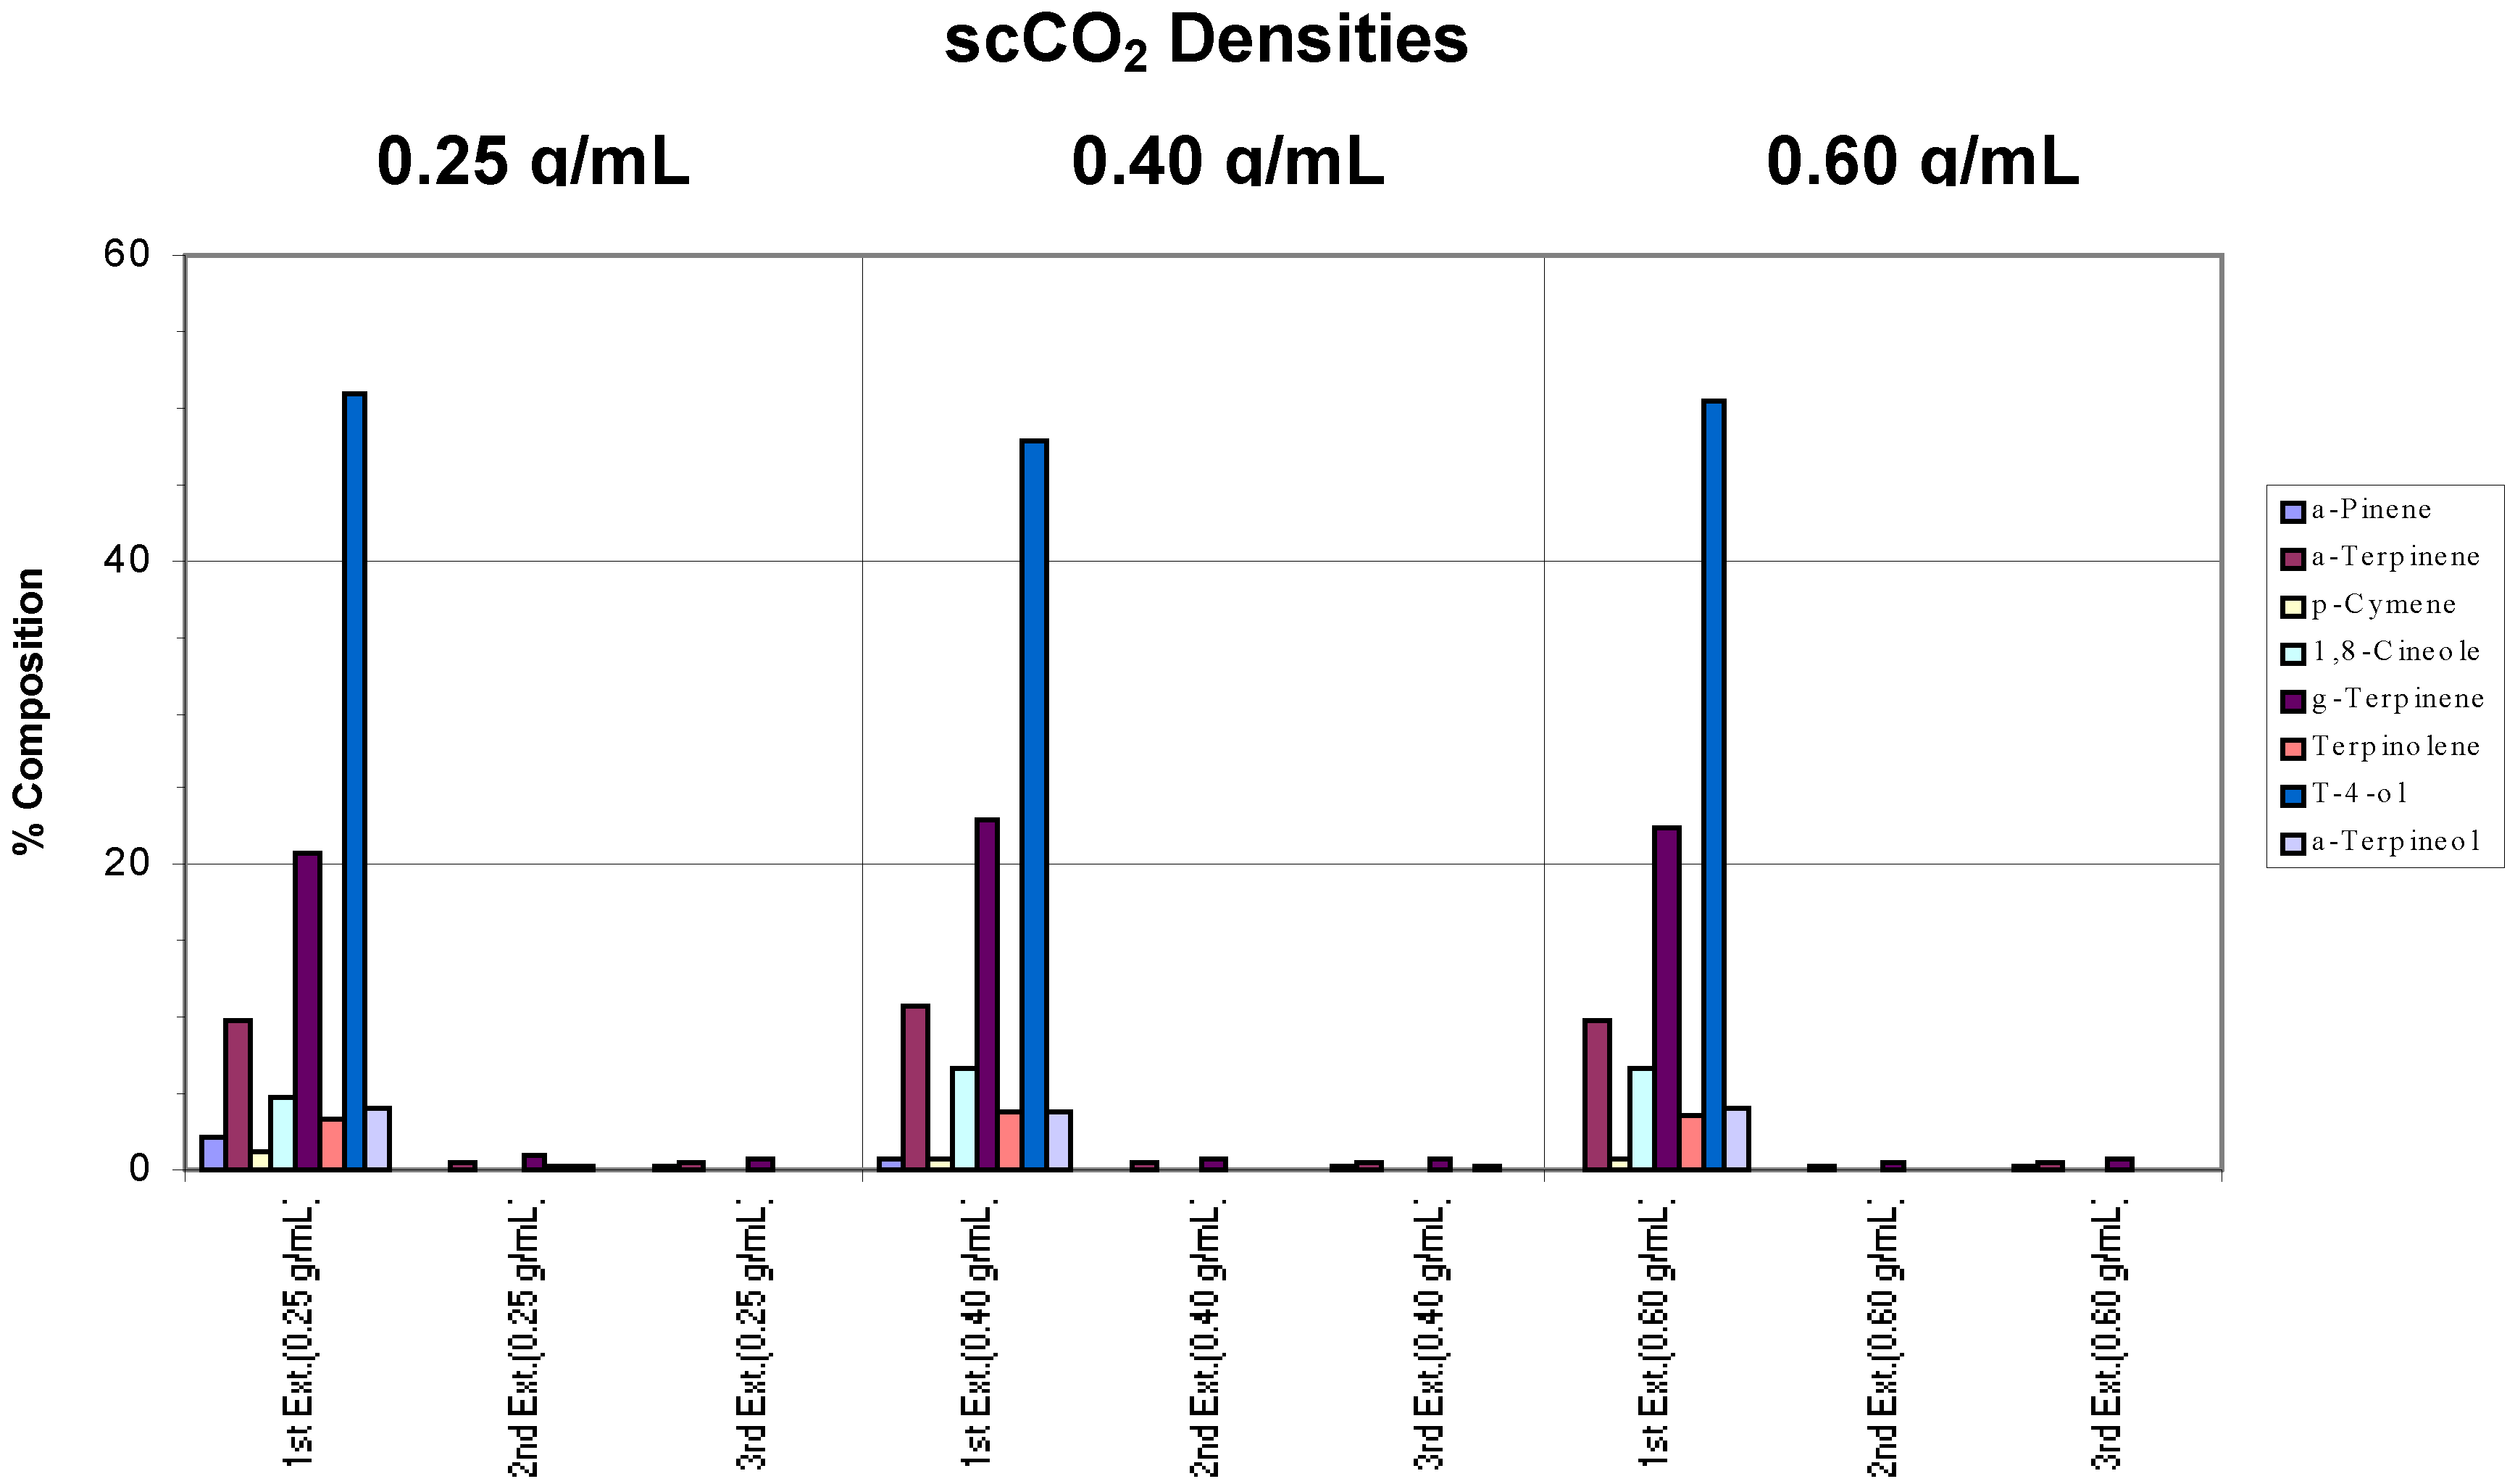
Whole fresh leaves were extracted using a chamber temperature of 40°C and incomplete extractions were observed across all densities (
Figure 2a). At a density of 0.25 g/mL, only terpinen-4-ol and some γ-terpinene were extracted. However, selective extraction towards terpinen-4-ol was evident, particularly at higher densities (0.40 and 0.60 g/mL) where no γ-terpinene was extracted, possibly due to the slight change in polarity of the scCO
2. It can also be seen that, generally, more terpinen-4-ol was extracted as the supercritical fluid density was increased.
Figure 2a.
Extraction of whole fresh leaves at densities of 0.25, 0.40 and 0.60 g/mL and a chamber temperature of 40°C.
Figure 2a.
Extraction of whole fresh leaves at densities of 0.25, 0.40 and 0.60 g/mL and a chamber temperature of 40°C.
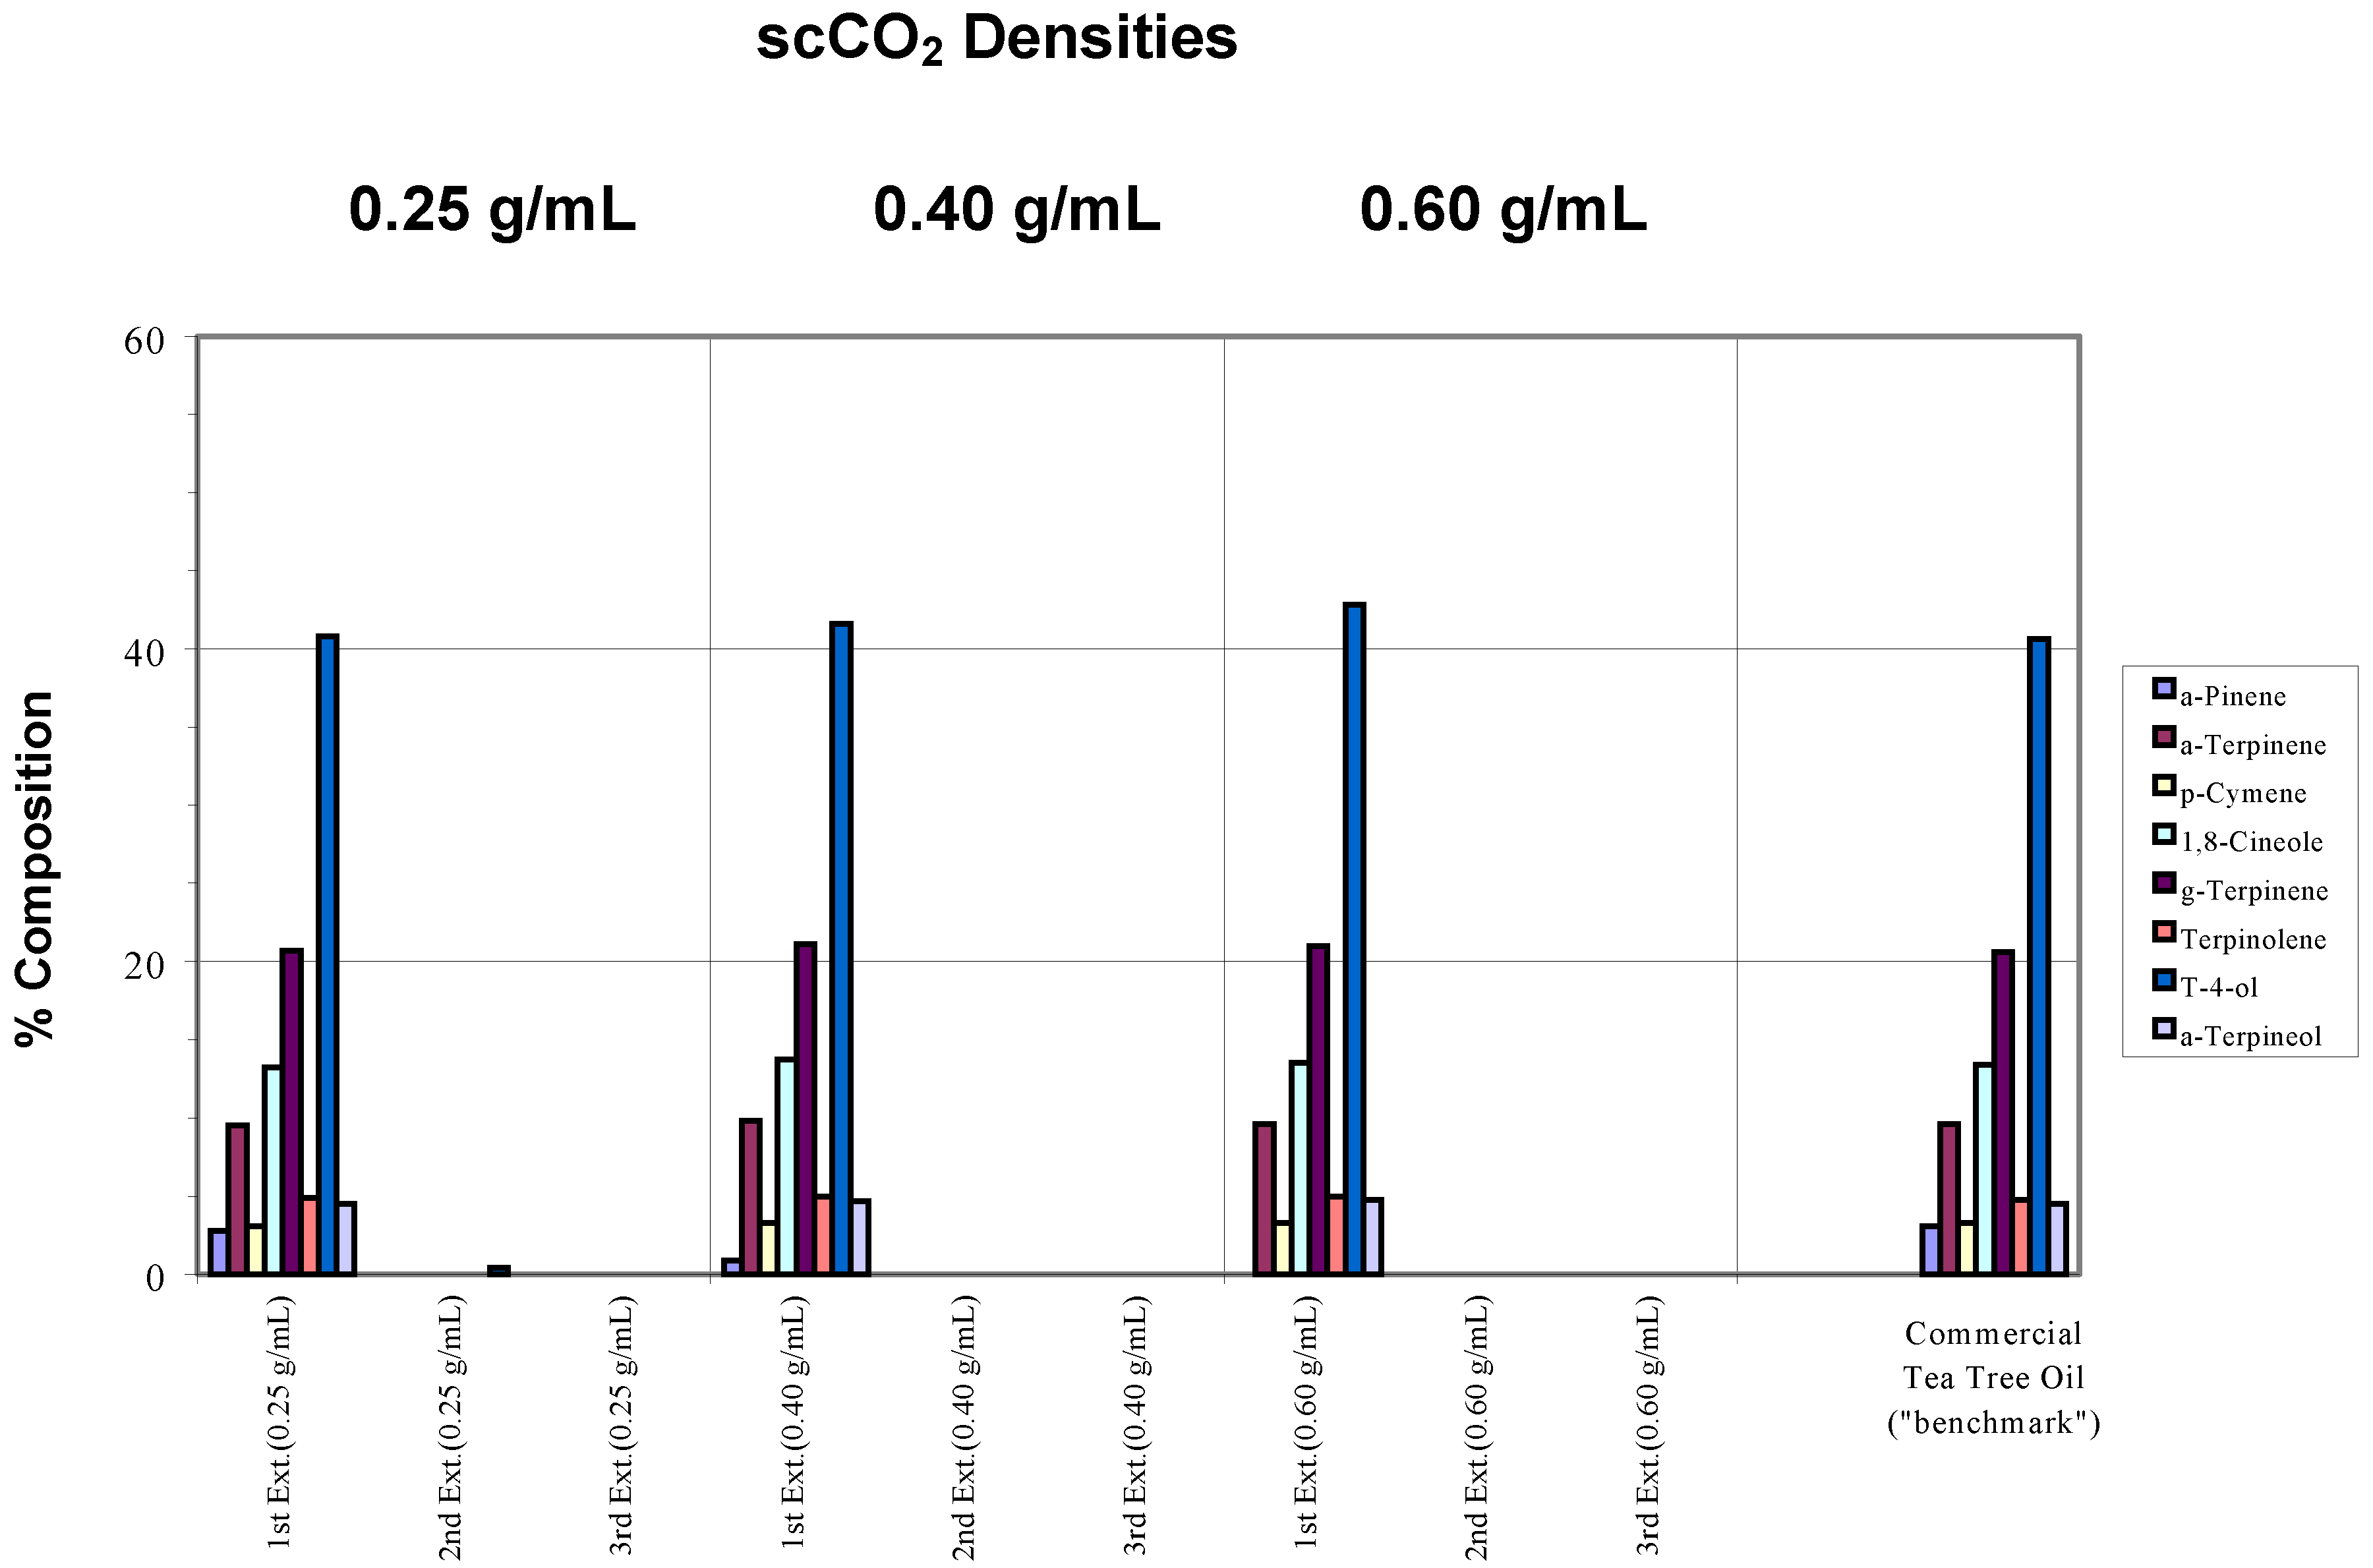
Complete extraction, according to our definition, occurred for densities of 0.25 and 0.40 g/mL when a chamber temperature of 80°C was applied (
Figure 2b). However, for the sample that was extracted at a density of 0.60 g/mL, incomplete extraction, according to our definition, was observed owing to carry-over related to the higher scCO
2 density used. The gradual disappearance of α-pinene in relation to the trap’s deficiency with increasing scCO
2 density was again evident.
Figure 2b.
Recovery of target analytes from whole fresh leaves using a chamber temperature of 80°C.
Figure 2b.
Recovery of target analytes from whole fresh leaves using a chamber temperature of 80°C.
Compared to the second extraction step, a slight increase in the concentration of components at the third extraction step was noted for the 0.40 and 0.60 g/mL scCO2 densities. This can be attributed to sample carry-over and appears to be a consequence of the final depressurization and line purging sequence automatically initiated by the instrument. This was consistently observed for higher scCO2 density extractions.
(i) Chamber Temperature of 110°C
The results for whole fresh leaves subjected to extraction at a chamber temperature of 110°C are given in
Table 2 and
Figure 2c.
Table 2.
Data for whole fresh leaves extracted at a chamber temperature of 110°C.
Table 2.
Data for whole fresh leaves extracted at a chamber temperature of 110°C.
Whole Fresh Leaves
Chamber Temperature = 110°C |
|---|
| % Composition |
| scCO2 Densities | α-Pinene | α-Terpinene | p-Cymene | 1,8-Cineole | γ-Terpinene | Terpinolene | T-4-ol | α-Terpineol |
| 1st Ext.(0.25 g/mL) | 2.2 | 9.4 | 1.5 | 3.4 | 21.1 | 3.3 | 54.5 | 3.9 |
| 2nd Ext.(0.25 g/mL) | 0.0 | 0.0 | 0.0 | 0.0 | 0.0 | 0.0 | 0.1 | 0.0 |
| 3rd Ext.(0.25 g/mL) | 0.0 | 0.1 | 0.0 | 0.0 | 0.3 | 0.0 | 0.1 | 0.0 |
| 1st Ext.(0.40 g/mL) | 0.4 | 8.6 | 0.6 | 3.0 | 18.7 | 3.1 | 52.6 | 3.7 |
| 2nd Ext.(0.40 g/mL) | 0.0 | 0.0 | 0.0 | 0.0 | 0.1 | 0.0 | 0.0 | 0.0 |
| 3rd Ext.(0.40 g/mL) | 0.9 | 2.3 | 0.2 | 0.2 | 4.4 | 0.6 | 0.4 | 0.0 |
| 1st Ext.(0.60 g/mL) | 0.1 | 6.8 | 1.4 | 4.2 | 17.2 | 2.7 | 48.8 | 3.5 |
| 2nd Ext.(0.60 g/mL) | 0.0 | 0.4 | 0.0 | 0.0 | 1.0 | 0.2 | 0.2 | 0.0 |
| 3rd Ext.(0.60 g/mL) | 1.3 | 3.2 | 0.3 | 0.4 | 6.4 | 0.9 | 1.1 | 0.0 |
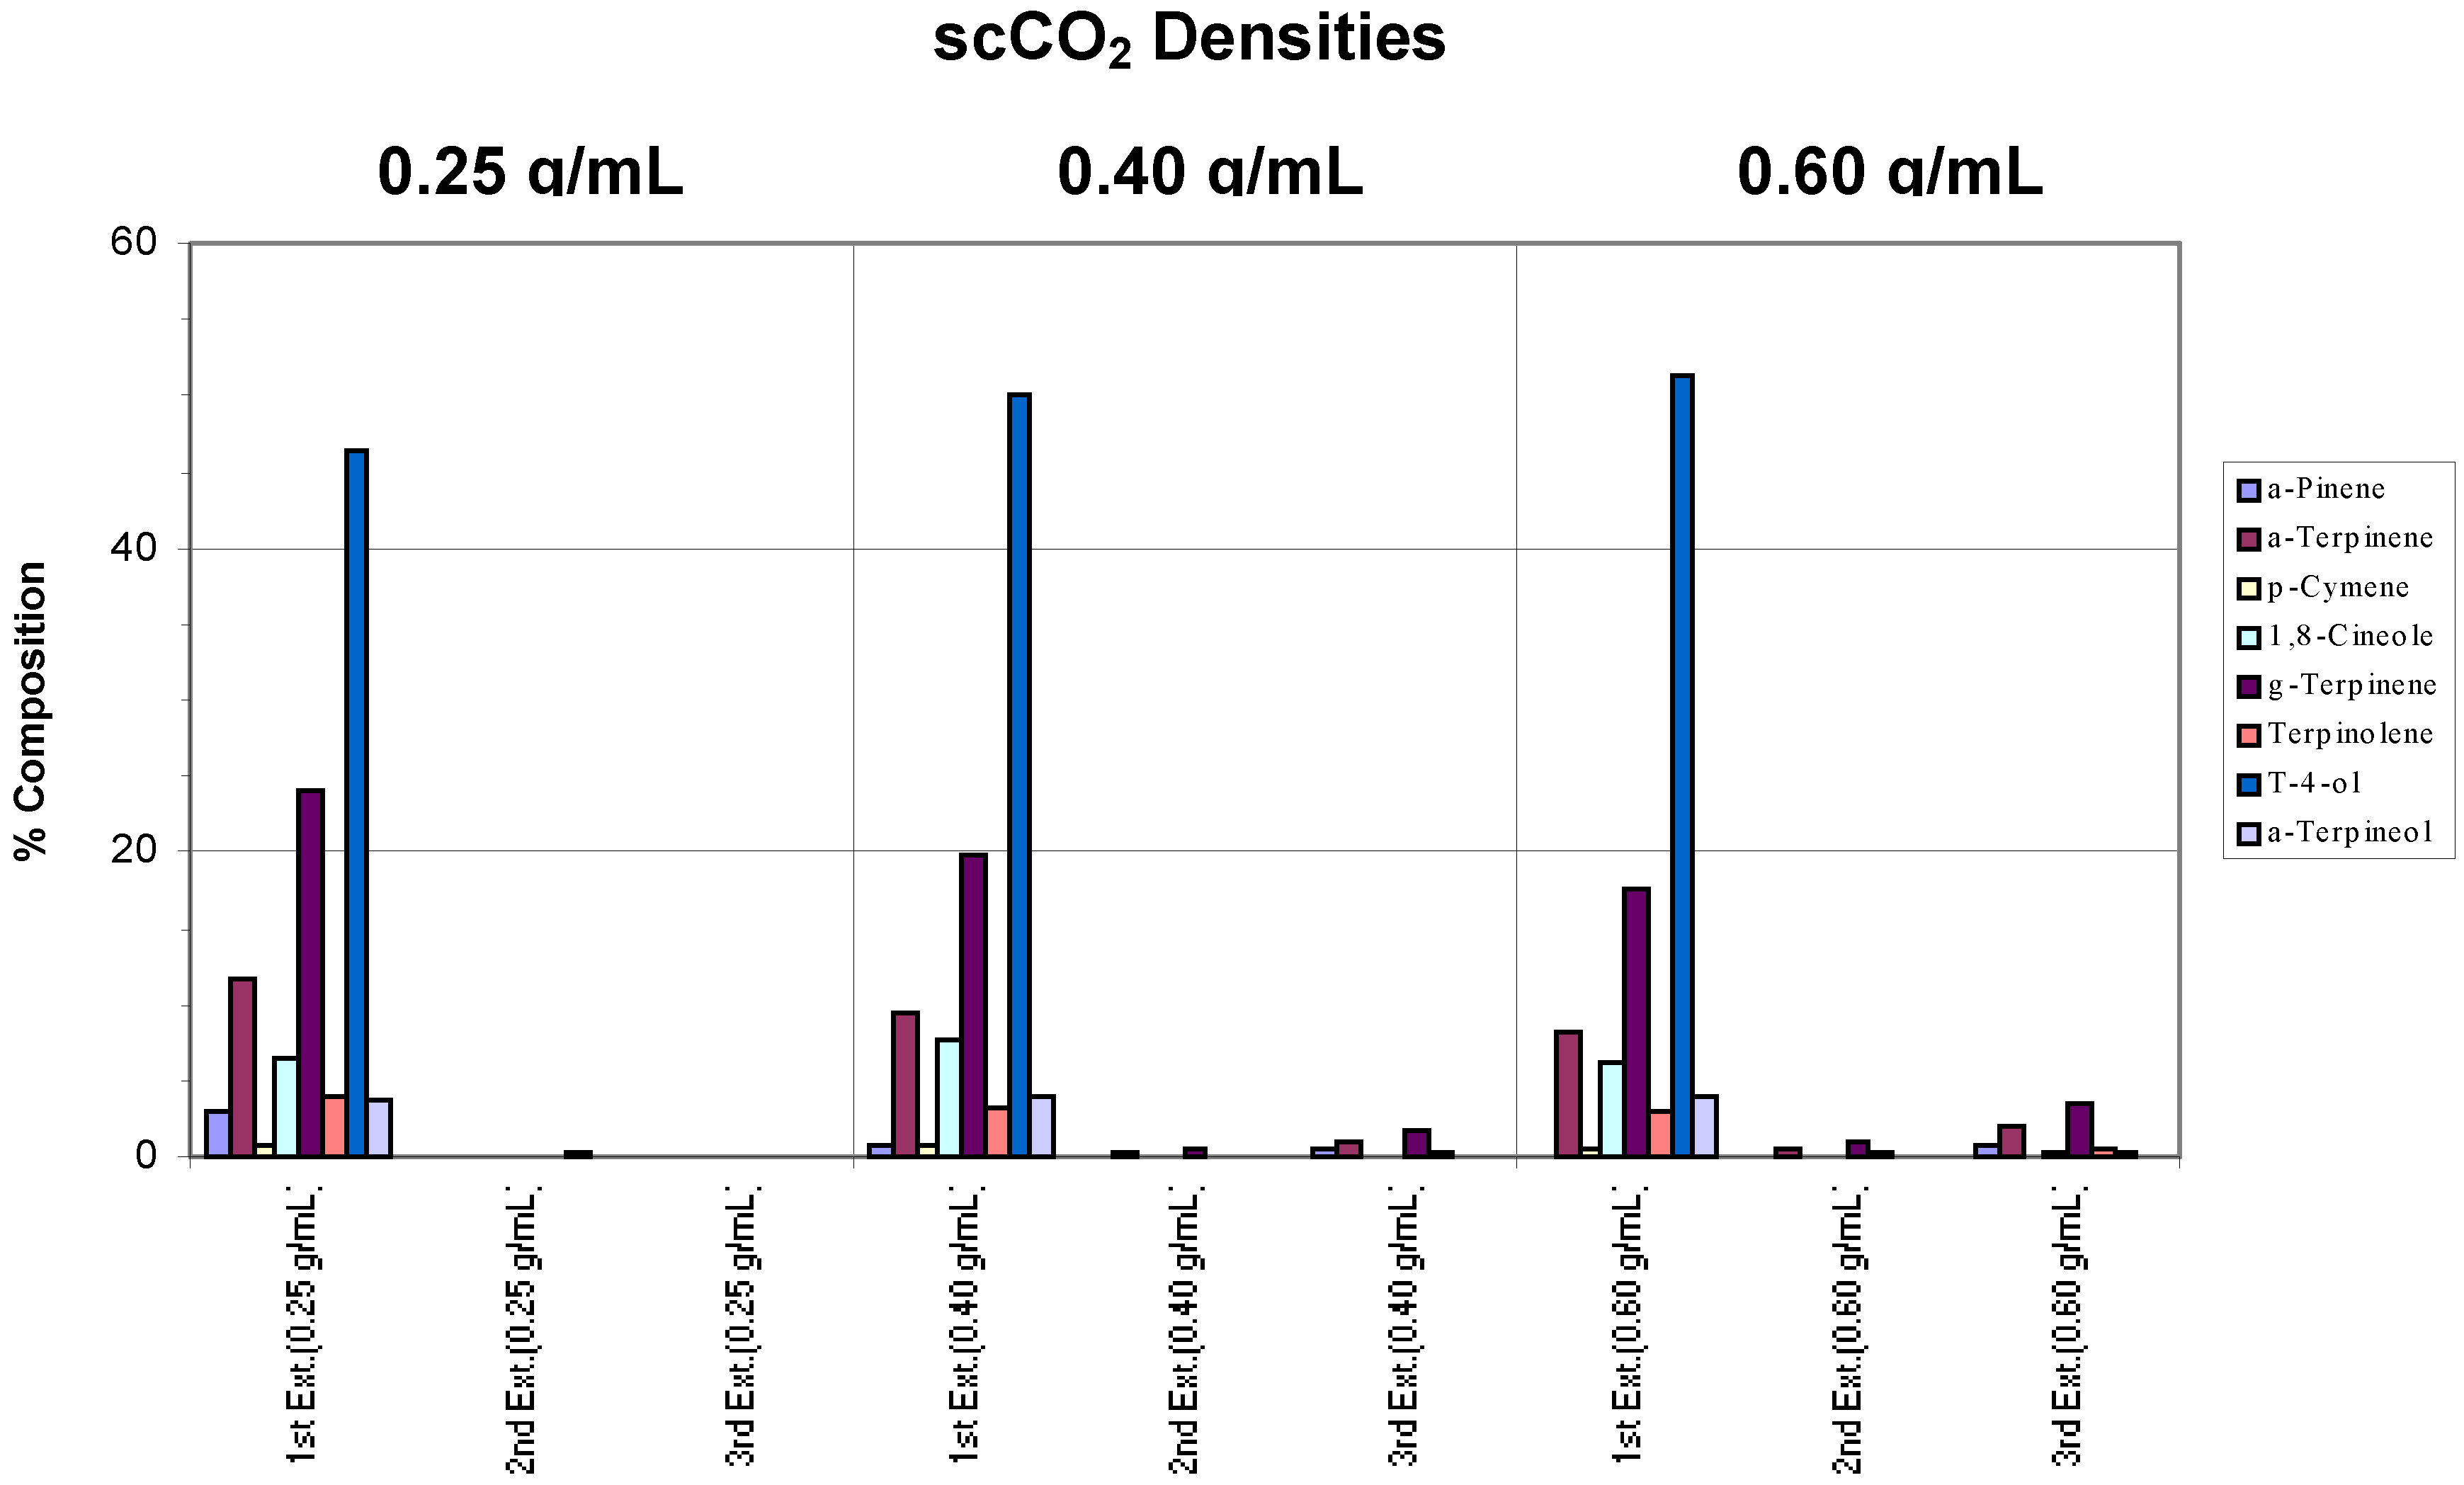
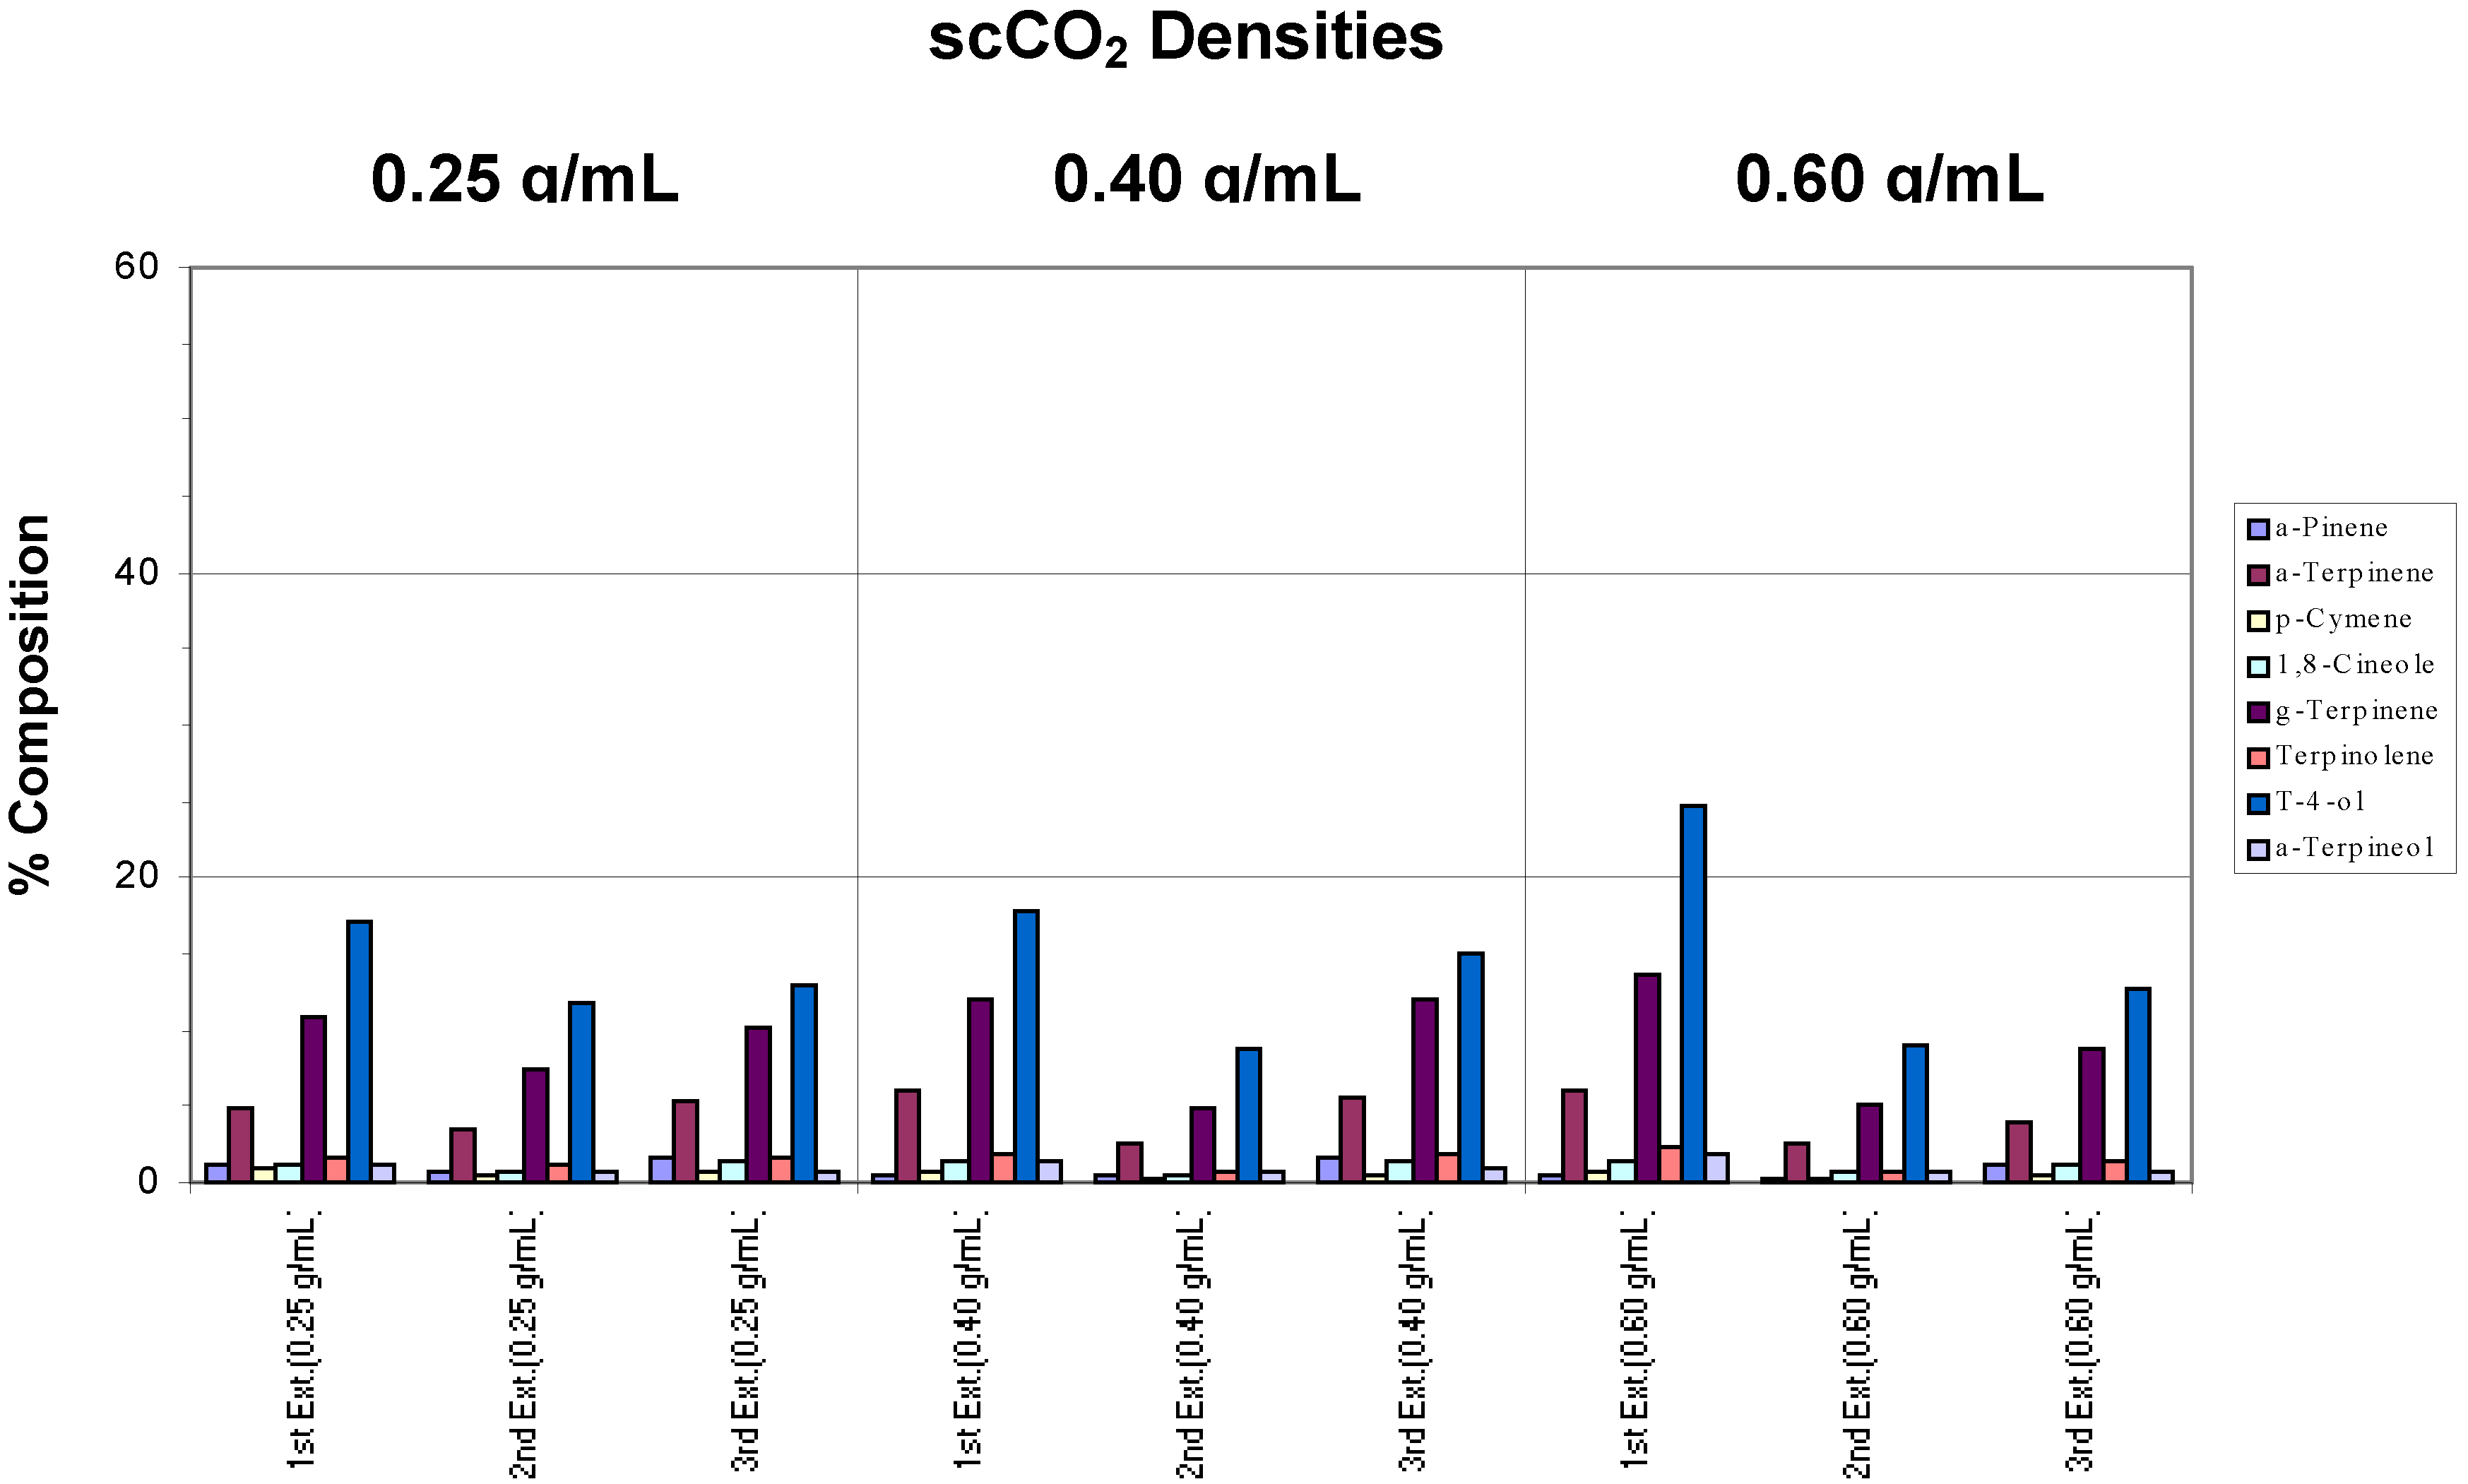
Figure 2c.
Recovery of target analytes from whole fresh leaves using a chamber temperature of 110°C.
Figure 2c.
Recovery of target analytes from whole fresh leaves using a chamber temperature of 110°C.
If the sum total of each analyte for the three extractions at 0.4 and 0.6 g/mL were compared to that of the 0.25 g/mL extractions, very little difference was noted. Therefore, in terms of efficiency, which includes the ability to trap, all three extraction densities yielded similar results. However, sample carry-over, as observed above, was apparent for the 0.4 and 0.6 g/mL extractions. In addition, the gradual disappearance of α-pinene was again observed. For these reasons, 0.4 and 0.6 g/mL extraction densities were not considered optimal. To yield better extraction efficiencies under these conditions, a larger capacity trap is required. Without such a trap, a scCO2 density of 0.25 g/mL proved to be the most efficient at this chamber temperature, in accordance with the project’s definition, for this particular instrument. This chamber temperature also possesses the added feature of the micro-steam distillation effect and the presumed role of the moisture or steam to act as a modifier in enhancing the extraction process.
The established optimum extraction condition was subsequently applied to a different batch of leaf material to determine if similar results could be achieved. Comparison with the above experiment showed similar results. Therefore, the optimum extraction condition was considered to yield reproducible results when applied to whole fresh leaves.
The fact that the optimum extraction conditions were able to reproducibly achieve complete extraction when applied to whole fresh leaves does not necessarily mean that all the target analytes have been removed from the sample matrix. More analytes may be extracted when harsher conditions were applied. To assess this possibility, a sample was extracted twice using the optimum conditions, and then the scCO2 density was immediately increased from 0.25 g/mL to 0.60 g/mL for two further extractions.
It was found that (data not shown) no significant additional amounts of terpenes were extracted and that the optimum conditions resulted in almost complete extraction and recovery of the target analytes from whole fresh leaves.
(2) Whole Dried Leaves
Whole dried leaves remain the preferred working matrix from an analyst’s point of view, particularly when a large population of samples needs to be analyzed. Therefore, the most convenient option is to collect the samples, air dry and then store them in an open and/or relatively dry location pending extraction. Whole dried leaves were extracted at scCO
2 densities of 0.25, 0.40 and 0.60 g/mL and at chamber temperatures of 40°C, 80°C and 110°C. Incomplete extractions were observed in all cases, with significant concentrations of components still detected even after the third extraction step for all densities and chamber temperatures employed. For the experiment involving a chamber temperature of 110°C, a graphical representation of the results is provided in
Figure 3.
Figure 3.
Recovery of target analytes from whole dried leaves using a chamber temperature of 110°C.
Figure 3.
Recovery of target analytes from whole dried leaves using a chamber temperature of 110°C.
(3) Rehydrated Whole Dried Leaves
Rehydrated whole dried leaf samples were used to determine the role of water in the extraction process. Complete extraction was achieved with the rehydrated sample when the optimum extraction condition was applied (
Figure 4). The oil composition was also very similar to that obtained from the original whole fresh leaves extraction (
Figure 2c). The few components that appeared in the second and third extraction steps for the rehydrated sample were relatively low in concentration, again, reflecting the sample carry-over characteristic of the instrument.
Figure 4.
Recovery of target analytes from rehydrated whole dried leaves employing the optimum extraction conditions.
Figure 4.
Recovery of target analytes from rehydrated whole dried leaves employing the optimum extraction conditions.
(4) Crushed Dried Leaves
Crushed samples were also investigated. As observed in whole dried leaves, incomplete extractions occurred under all chamber temperatures and densities combinations (data not shown).
(5) Crushed Fresh Leaves
The extraction of crushed fresh leaves was investigated to see if the sample preparation could influence extraction conditions. The results showed that the conditions established for whole fresh leaves also gave the best results with crushed fresh leaves, i.e. crushing did not influence extraction efficiency in this case (
Figure 5).
Figure 5.
Recovery of target analytes from crushed fresh leaves using a chamber temperature of 110°C.
Figure 5.
Recovery of target analytes from crushed fresh leaves using a chamber temperature of 110°C.

