Introduction
Sulfated polymannuroguluronate SPMG-911, a novel sulfated polysaccharide rich in 1-4 linked β-D-mannuronate, prepared by sulfate modification of an alginate extract from brown algae, possesses a certain 1,4-linked β-D-mannuronate to α-L-guluronate ratio and an average molecular weight of 10KD. Our previous work has demonstrated a significant inhibition of the replication of HIV and SIV by SPMG-911 both in vitro and in vivo.
The acidic oligosaccharide sugar chain compound AOSC-971, a novel marine-derived acidic oligosaccharide, was extracted from brown algae Echlonia Kurome Okam by enzymatic depolymerization. With an average molecular weight at 1300 Da., its primary sequence is rich in β-D-mannurinic acid linked by 1-4 bonds endowing the structure with a negative charge.
This study was related to a safety assessment of SPMG-911 and AOSC-971, as well as the prediction of interdrug interactions associated with them by investigating their influences on CYP 1A2 and CYP 2E1 enzymes, especially their sex-based differences, through comparison of pharmacokinetics data of caffeine and chlorzoxazone, which are the special “cocktail” probe drugs for CYP 1A2 and CYP 2E1, respectively [
1,
2].
Results
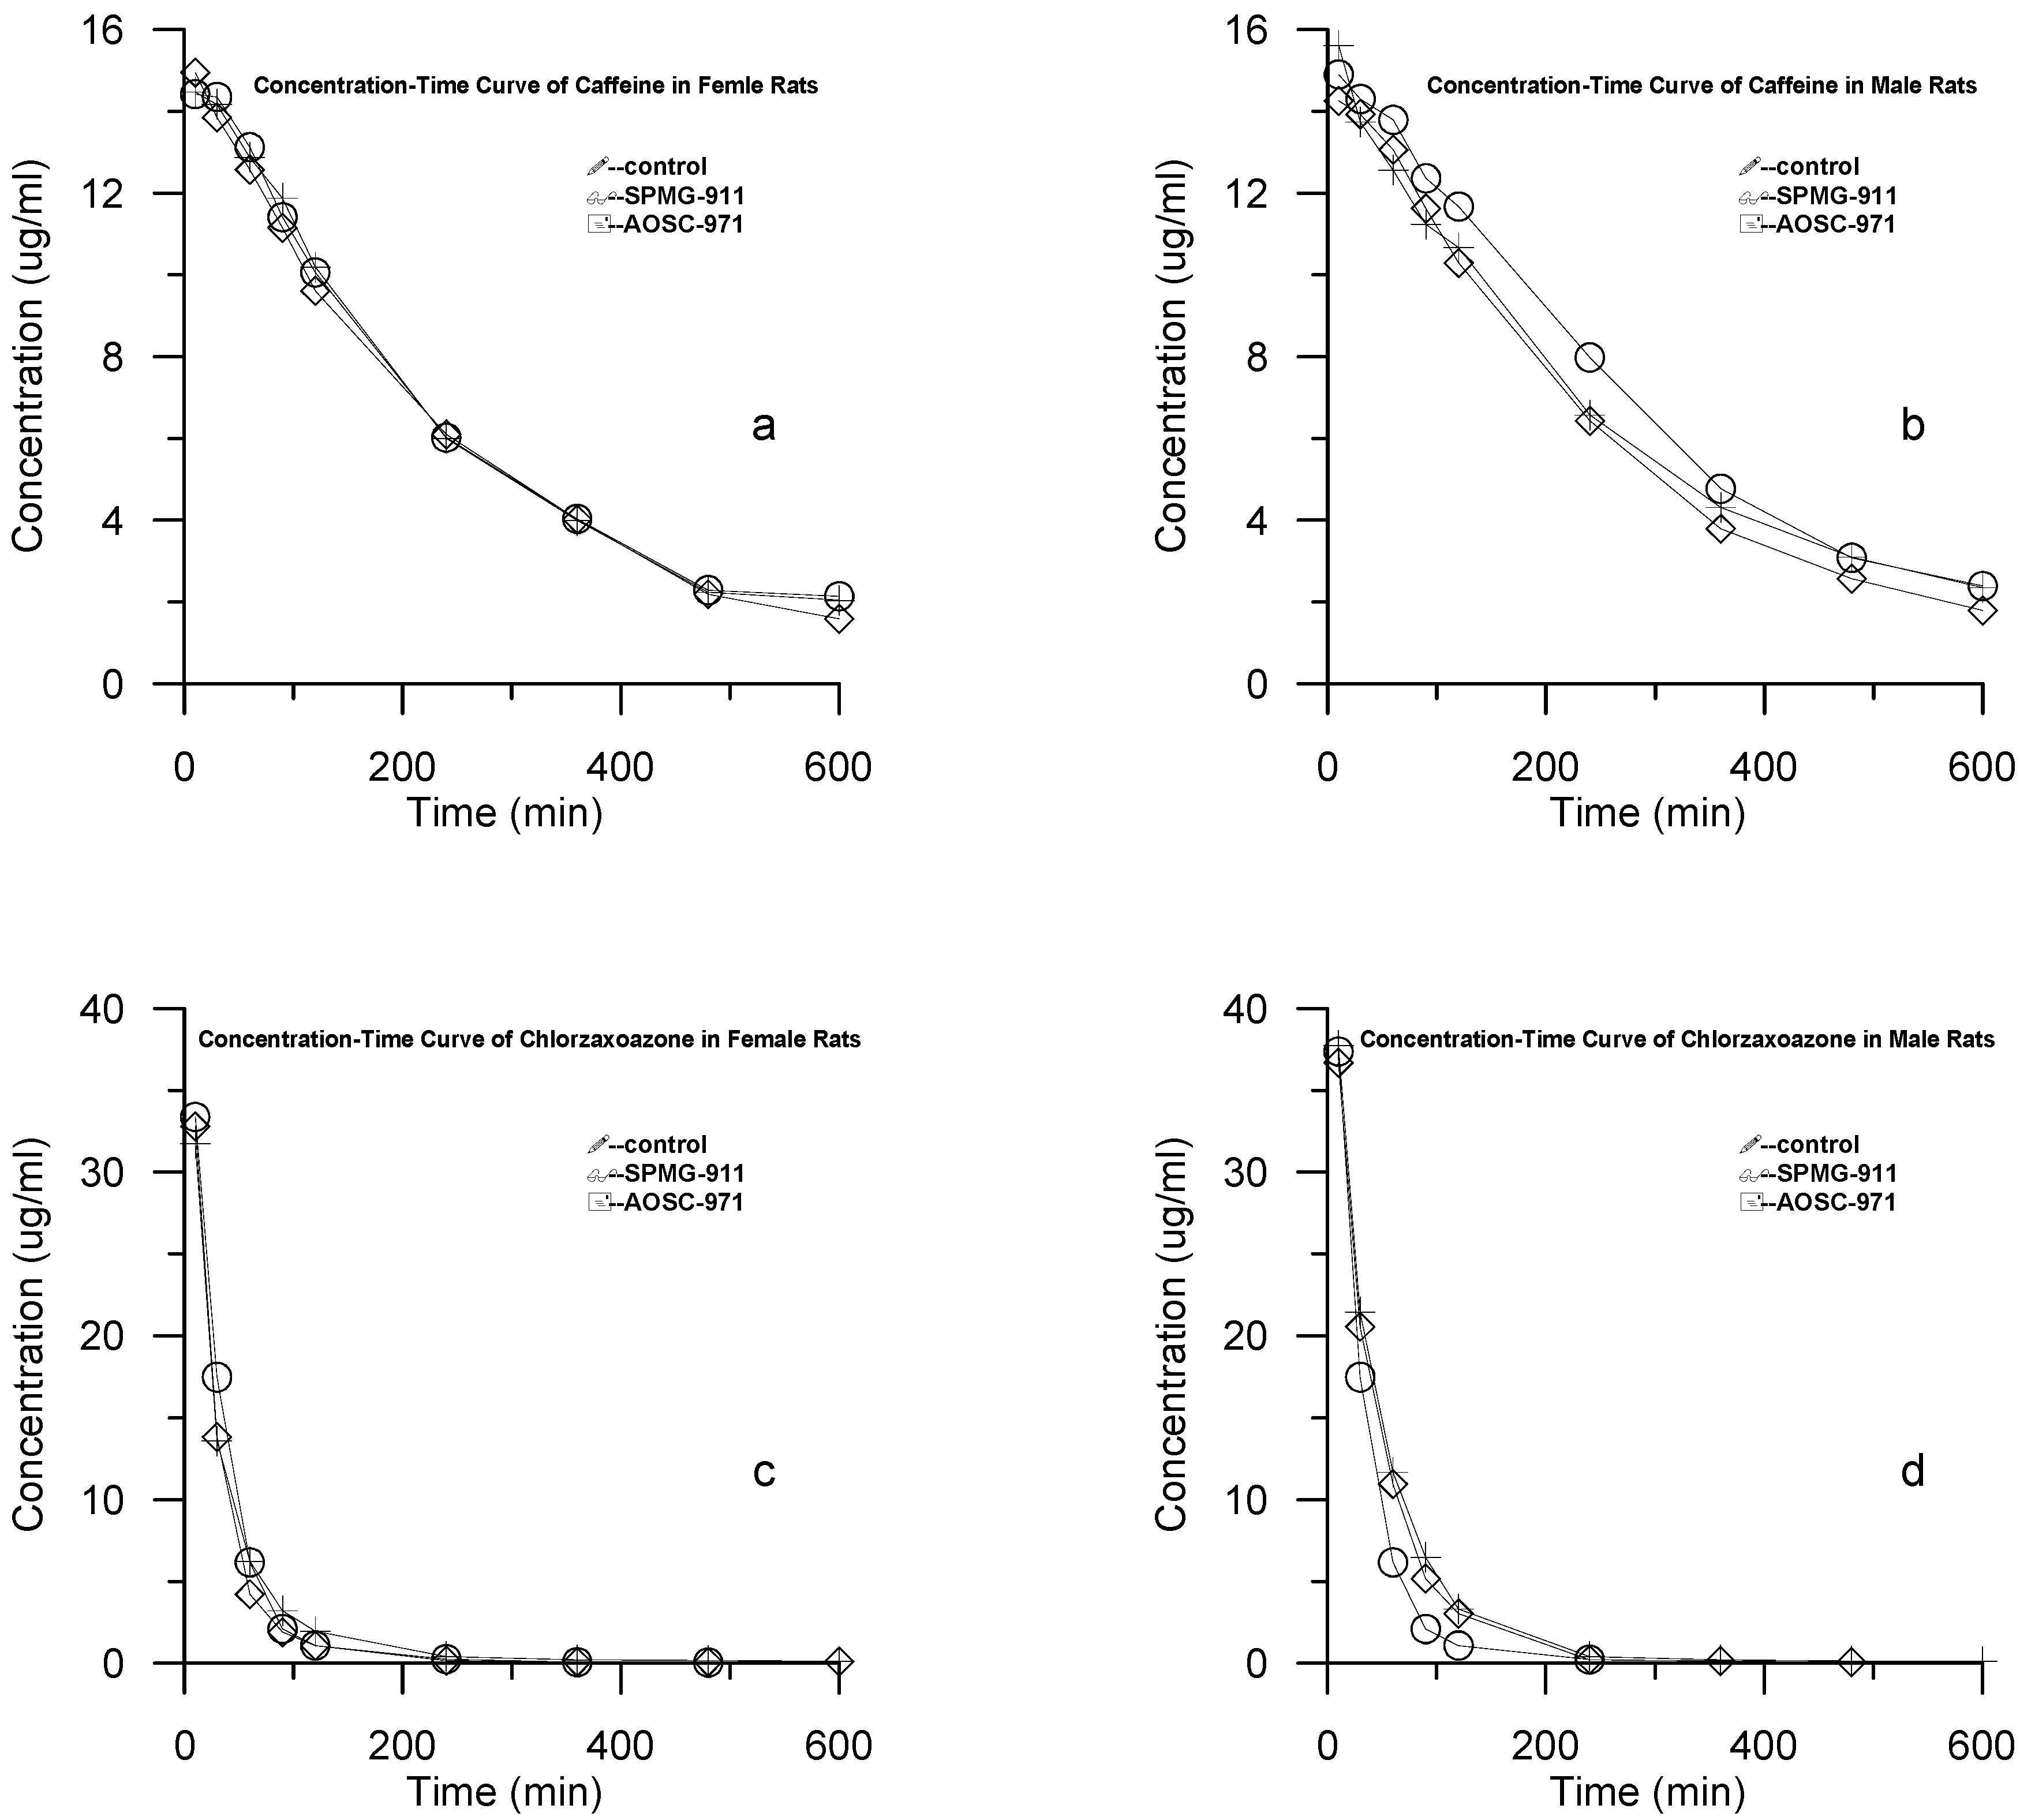
Concentration-time curves of the two probe drugs
Rats in each group were injected with the caffeine and chlorzoxazone probe drugs and the concentrations of the samples were determined using the methodology described in the Experimental section. Results are shown in
Figures 1a-d.
Figure 1.
Concentration-Time Curves of: a) caffeine in female rats; b) caffeine in male rats; c) chlorzoxazone in female rats; d) chlorzoxazone in male rats.
Figure 1.
Concentration-Time Curves of: a) caffeine in female rats; b) caffeine in male rats; c) chlorzoxazone in female rats; d) chlorzoxazone in male rats.
Pharmacokinetic data of the two probe drugs
The caffeine and chlorzoxazone concentrations were least squares fitted with different models using the 3P87 software. With the weights being 1/C/C, the caffeine and chlorzoxazone results were found to agree with the single and double compartment model, respectively. The pharmacokinetics data of caffeine and chlorzoxazone are given in
Table 1 and
Table 2, respectively. The results showed that there were obvious differences of T1/2 and K
10 between AOSC-971 and the control group (P<0.05), while no significant differences were found between SPMG-911 and the corresponding control group (P>0.05).
Table 1.
Pharmacokinetic Data of Caffeine (x ± s, n = 5).
Table 1.
Pharmacokinetic Data of Caffeine (x ± s, n = 5).
| | T1/2(min)* | AUC(ug.min/mL)* | K |
| | female | P | male | P | female | P | male | P | female | P | male | P |
| Control | 168.68±66.69 | | 271.31±169.02 | | 3771.68±1163.06 | | 5734.01±2288.98 | | 0.004±0.002 | | 0.004±0.002 | |
| SPMG-911 | 193.97±91.68 | 0.63 | 165.31±50.04 | 0.30 | 4378.54±1447.58 | 0.49 | 3562.22±834.07 | 0.22 | 0.004±0.001 | 0.92 | 0.005±0.002 | 0.49 |
| AOSC -971 | 255.22±126.89 | 0.21 | 247.26±74.82 | 0.80 | 4954.75±2324.51 | 0.34 | 5240.00±1188.43 | 0.76 | 0.003±0.002 | 0.48 | 0.003±0.001 | 0.56 |
Table 2.
Pharmacokinetic Data of Chlorzoxazone (x ± s, n = 5).
Table 2.
Pharmacokinetic Data of Chlorzoxazone (x ± s, n = 5).
| | T1/2(min)* | AUC(ug.min/mL)* | K10 |
| | female | P | male | P | female | P | male | P | female | P | male | P |
| Control | 177.73±103.30 | | 271.82±174.86 | | 2051.42±1397.32 | | 1834.50±1837.4 | | 0.034±0.012 | | 0.025±0.014 | |
| SPMG-911 | 261.34±201.75 | 0.43 | 324.67±257.31 | 0.71 | 1170.77±309.46 | 0.28 | 1283.46±454.00 | 0.53 | 0.040±0.005 | 0.34 | 0.042±0.014 | 0.19 |
| AOSC -971 | 185.37±162.54 | 0.93 | 72.43±34.28 | 0.04 | 1060.49±377.66 | 0.25 | 1548.31±519.39 | 0.75 | 0.037±0.011 | 0.66 | 0.0429±0.0082 | 0.04 |
Discussion
Cytochrome P450 (CYP 450), a supergene family, consists of many isozymes which are involved in biotransformation of many drugs, exogenous substances and precarcinogens and it plays a very important role in drug metabolism.
CYP450 can be induced or inhibited by some drugs, the activities or toxicities of which therefore can be affected accordingly. In fact, both CYP 1A2 and CYP 2E1 play critical roles in the metabolism of drugs because of their wide distribution and high concentration in vivo. Studies of drugs’ effects on these two enzymes are very useful for drug safety evaluations, as well as the prediction of inter-drug interactions and the design of more suitable drug administration protocols.
In this study, SPMG-911 and AOSC-971 exhibited different effects on CYP 450 isomers. With regards to CYP 1A2, SPMG-911 and AOSC-971 showed no effects, as indicated particularly by the pharmacokinetic data of caffeine in the SPMG-911-treated and AOSC-971-treated groups, which displayed no obvious differences compared with the control group. As for CYP 2E1, SPMG-911 has no effect on it, while AOSC-971 shows a potent induction in the male rat. It is a known fact that the induction or inhibition on CYP 450 isomers by some drugs is highly structure dependent. Growing evidence has highlighted that the variations in molecular skeletons characterized by differences in spatial configuration, steric hindrance and even their physical and/or chemical properties, including hydropathicity or hydrophobicity, etc., likely play important roles in modulating enzyme activities [
3,
4,
5,
6,
7,
8]. Compared to AOSC-971, SPMG-911 contains different sugar sequences with different molecular weights and different modified residual groups. These differences, at least in part, help us understand the different action of SPMG-911 and AOSC-971 on the CYP 450 isomers. The results observed with AOSC-971 are consistent with the theory that CYP 2E1 is induced by many low molecular weight organic compounds [
9,
10]. Elucidation of the exact mechanism(s) of action, of course, will require further study.
Conclusions
In summary, our data demonstrated that the influence of AOSC-971 on CYP 450 subfamily enzymes is sex dependent. This sex-based difference should be carefully considered when these compounds are used in future experiments. Furthermore, the combined usage of AOSC-971 with some other drugs, particularly CYP 2E1 inducing drugs, should be carefully considered. As for SPMG-911, there appears to be no such limitation in its combined usage with other CPY450-inducing drugs.
Experimental
Reagents
The dry caffeine and chlorzoxazone powders used as the standards were obtained from The Second Chemical Reagent Factory (Shanghai, China) and the Medicine and Drug Industry Institute (Shandong, China), respectively. Antipyrine (the internal standard) was obtained from the KeMiOu Chemical Reagent Development Centre (Tianjin, China). Drug candidates SPMG-911 and AOSC-971 were purified by the Marine Drug and Food Institute of Ocean University of China (Qingdao, China). Methanol (LUDU Chemical Reagent Factory of Shanghai, China), acetonitrile (HII, USA) and ammonium hydroxide (First Chemical Reagent Factory of Tianjin, China) were all HPLC grade.
Administration [11]:
30 Wistar rats weighing 230±20 g, half male and half female, were supplied by the Drug Institute of Tianjin. All rats were housed in a room maintained at 23˚C and they were allowed access to food and water ad libitum. They were randomly divided into six groups with five rats in each group: I) male−SPMG, II) female−SPMG, III) male−AOSC, IV) female−AOSC, V) male−blank, and VI) female−blank. Rats in groups I & II, III & IV, V & VI, were given i.g SPMG-911 and AOSC-971 (both were dissolved with distilled water just before usage) and 0.9% NaCl every morning at a dosage of 85 mg/kg, 360 mg/kg, and 1 mL/kg, respectively. This administration was continued for 6 days before the probe drugs caffeine and chlorzoxazone were injected, each at a dosage of 10 mg/kg, into all rats on the morning of day 7.
Sample collection [11]:
Venous plasma samples (0.5 mL each time) were taken in every rat from the orbital sinus at 0, 10 min., 30 min., 1 h., 1.5 h., 2 h., 4 h., 6 h., 8 h., and 10 h. after the injection on day 7, then centrifuged at 3000 rpm for 5 minutes and the upper layer of the plasma was stored at −20˚C.
Sample preparation:
Samples (200μL) were pipetted precisely into a clean tube after thawing, then the internal standard (20 μL, 110 μg/mL) was added, followed by t-butyl methyl ether (5 mL). After shaking adequately a portion of the organic layer (3 mL) was transferred into another clean tube and evaporated to dryness under a stream of nitrogen. The nitrogen pressure was regulated appropriately to avoid any loss of the probe drugs. The residue was dissolved in methanol (120 μL), shaken and centrifuged at 6000 rpm for 1 minute before detection.
Chromatographic conditions:
A Waters HPLC instrument (Waters Company, USA) was used in these studies. The C18 column (Dikma Technologies Company, China) had a size of 150 × 4.6 mm with a particle size of 5.0 μm. The temperature of the column was set to 30°C. The mobile phase was 22:8:70 (v:v:v) methanol−acetonitrile−ammonium oxalate (20mmol/L) at a flow rate of 1mL/min. The volume ratio was changed to 40:15:45 after eight min. Each component of the mobile phase was first purified by suction-filtration, and then ultra-filtration for 10 minutes. The wavelength of the UV detector (Waters Company, USA) was set to 280 nm.
Assessment of the experimental methods
Selectivity
Figures 2a-c represent chromatograms obtained from blank serum, serum with probe drugs added
in vitro, and serum with probe drugs injected
in vivo, respectively, as described above. Caffeine, chlorzoxazone and the internal standard gave rapidly eluting, fully resolved and sharp symmetrical peaks on the chromatograms at retention times of 4.1 min., 6.8 min. and 14.9 min., respectively, both
in vitro and
in vivo. No endogenous interfering peaks were found in the blank serum. These results suggest that this method has a high selectivity in detecting the serum concentrations of caffeine and chlorzoxazone.
Figure 2.
Chromatograms of probe drugs in different circumstances. A) caffeine; B) antipyrine; C) chlorzoxazone
Figure 2.
Chromatograms of probe drugs in different circumstances. A) caffeine; B) antipyrine; C) chlorzoxazone
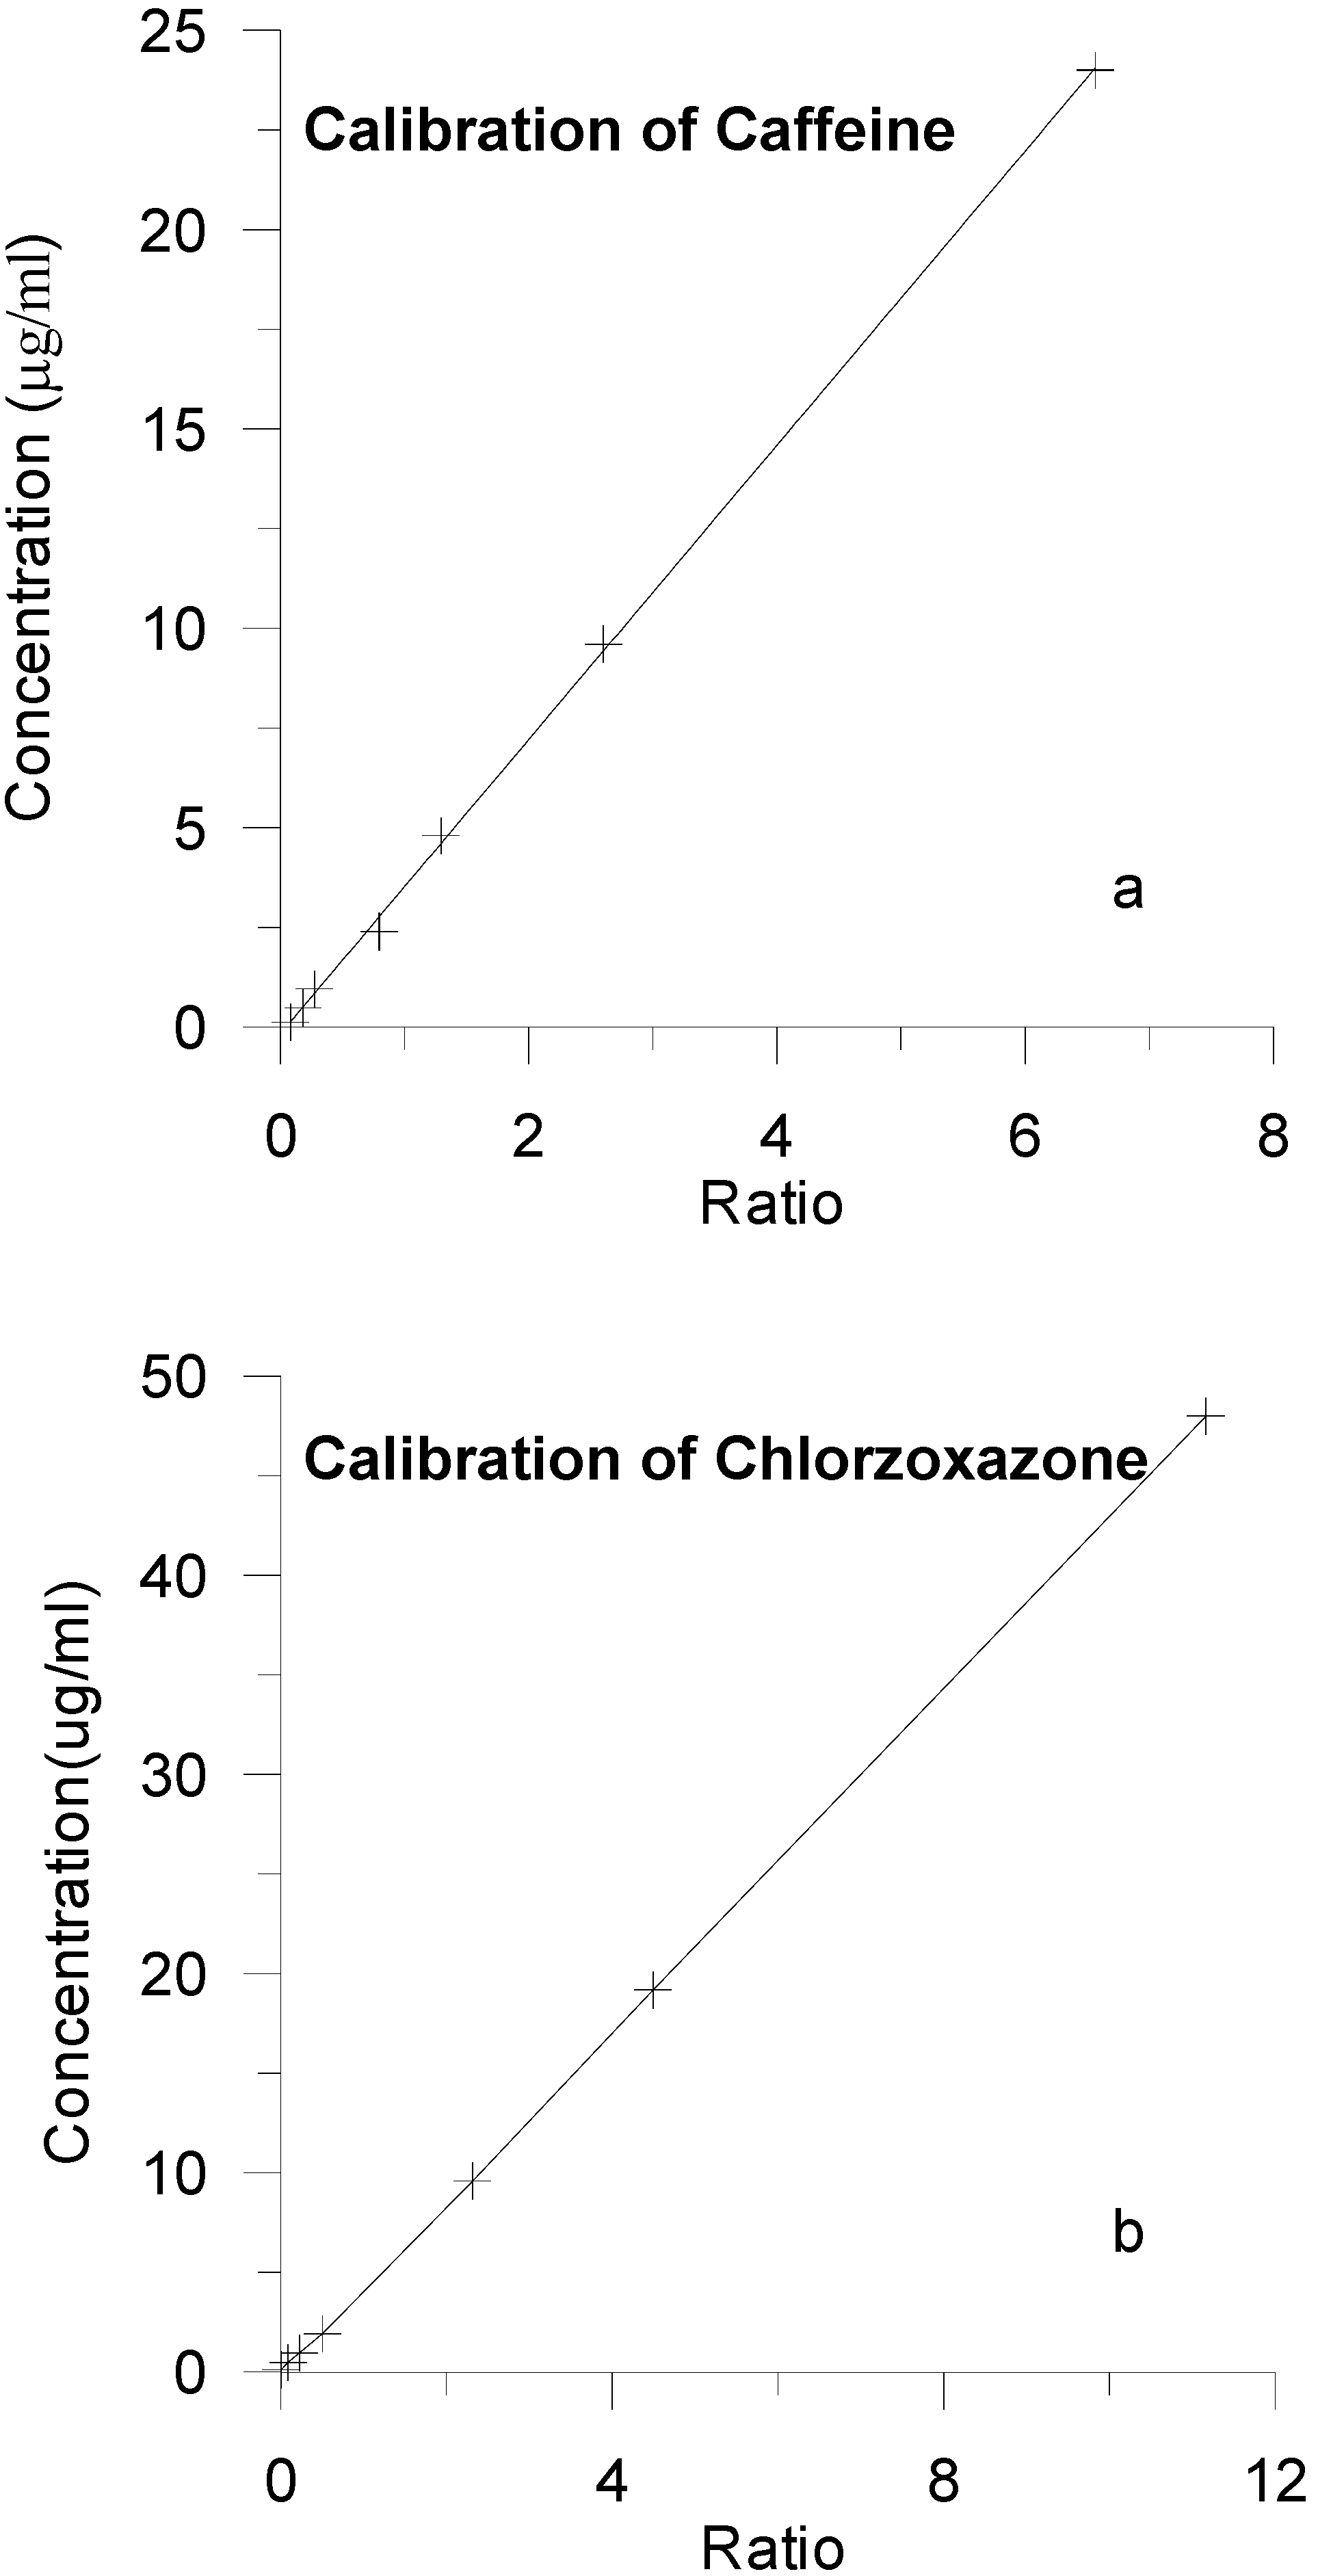
Calibration curves
Caffeine and chlorzoxazone were weighed precisely before dissolving and diluting to a 1 mg/mL solution with the HPLC grade methanol. Calibration solutions A−G were obtained by mixing different volumes of the caffeine and chlorzoxazone preparation solutions and 20 μL internal standard (110 μg/mL), then adding blank mice serum to the mark, so that the final caffeine concentrations were 0.12 (A), 0.48 (B), 0.96 (C), 2.4 (D), 4.8 (E), 9.6 (F) and 24 (G) μg·mL-1, respectively, and the chlorzoxazone concentrations were 0.12 (A), 0.48 (B), 0.96 (C), 1.92 (D), 9.6 (E), 19.2 (F) and 48 (G) μg·mL-1, respectively. The corresponding chromatograms were obtained following the procedures described above
Figure 3.
Calibration Curves for a) Caffeine b) Chlorzoxazone.
Figure 3.
Calibration Curves for a) Caffeine b) Chlorzoxazone.
Figure 3a and
Figure 3b show the calibration curves of caffeine and chlorzoxazone. The corresponding data, listed in
Table 3 and
Table 4, shows that both compounds display a good linear relationship within the abovementioned concentration ranges (the adopted minimum concentration is less than 1/20 of the maximum for both probe drugs). The respective calibration curve equations are:
Table 3.
Caffeine Calibration Curve Data.
Table 3.
Caffeine Calibration Curve Data.
| Concentration (μg·mL-1) | Ratio |
| 0.12 | 0.0820 |
| 0.48 | 0.1822 |
| 0.96 | 0.2752 |
| 2.4 | 0.7964 |
| 4.8 | 1.2941 |
| 9.6 | 2.6035 |
| 24 | 6.5665 |
Table 4.
Chlorzoxazone Calibration Curve Data.
Table 4.
Chlorzoxazone Calibration Curve Data.
| Concentration (μg·mL-1) | Ratio |
| 0.12 | 0.007406 |
| 0.48 | 0.08978 |
| 0.96 | 0.2274 |
| 1.92 | 0.5048 |
| 9.6 | 2.3189 |
| 19.2 | 4.4944 |
| 48 | 10.1617 |
Intraday and interday reproducibility
The results for caffeine are summarized in
Table 5. The RSD for the intraday reproducibility ranged from 3.3 to 7.7% while that of the interday reproducibility ranged from 0.4 to 8.3%. All deviations were within 10%.
Table 5.
Intraday and Interday Reproducibility of Caffeine (mean ±SD, n=3.)
Table 5.
Intraday and Interday Reproducibility of Caffeine (mean ±SD, n=3.)
Concentration
(μg·mL-1) | Intraday reproducibility | Interday reproducibility |
Concentration
(μg·mL-1) | RSD
(%) | Concentration
(μg·mL-1) | RSD
(%) |
| 0.12 | 0.13±0.01 | 7.7 | 0.12±0.01 | 8.3 |
| 4.8 | 4.61±0.15 | 3.3 | 4.53±0.25 | 5.5 |
| 24 | 24.06±1.50 | 6.2 | 22.34±0.08 | 0.4 |
The chlorzoxazone results are summarized in
Table 6. The RSD for the intraday reproducibility ranged from 0.8 to 7.8% while that of the interday reproducibility ranged from 1.8 to 4.3%. All deviations were also within 10%.
Table 6.
Intraday and Interday Reproducibility of Chlorzoxazone (mean±SD, n=3.)
Table 6.
Intraday and Interday Reproducibility of Chlorzoxazone (mean±SD, n=3.)
Concentration
(μg·mL-1) | Intra-day reproducibility | Inter-day reproducibility |
concentration
(μg·mL-1) | RSD
(%) | concentration
(μg·mL-1) | RSD
(%) |
| 0.12 | 0.12±0.001 | 0.8 | 0.113±0.002 | 1.8 |
| 9.6 | 9.43±0.31 | 3.3 | 9.29±0.40 | 4.3 |
| 48 | 41.69±3.24 | 7.8 | 44.52±1.21 | 2.7 |
Detection limits
The limit of detection of this method was defined at a signal-to-noise ratio of 3:1, so that of caffeine was 0.05 μg·mL-1 while for chlorzoxazone it was 0.1 μg·mL-1.


