Results and Discussion
The infrared spectral data of compounds
1 –16 as measured in trichloromethane are listed in
Table 1. All three characteristic structural fragments of
p-substituted
N-phenylsulfonylbenzamides, the C=O, SO
2 and N-H groups, are described by their stretching vibrational wavenumbers. The absorption bands of both the symmetric and asymmetric stretching vibrations of the SO
2 group are observed nearly in the same regions as the ν
s(SO
2) and ν
as(SO
2) bands for the recently reported substituted benzenesulfonamides [
11]. The absorption bands of ν (C=O) and ν (N-H) vibrations appear in the expected regions of the wavenumbers characteristic for
N-substituted benzamide derivatives [
12]. The calculated PM3 bond orders and Mulliken charges for all bonds and atoms on the three characteristic structural fragments of compounds
1-16 are given in the
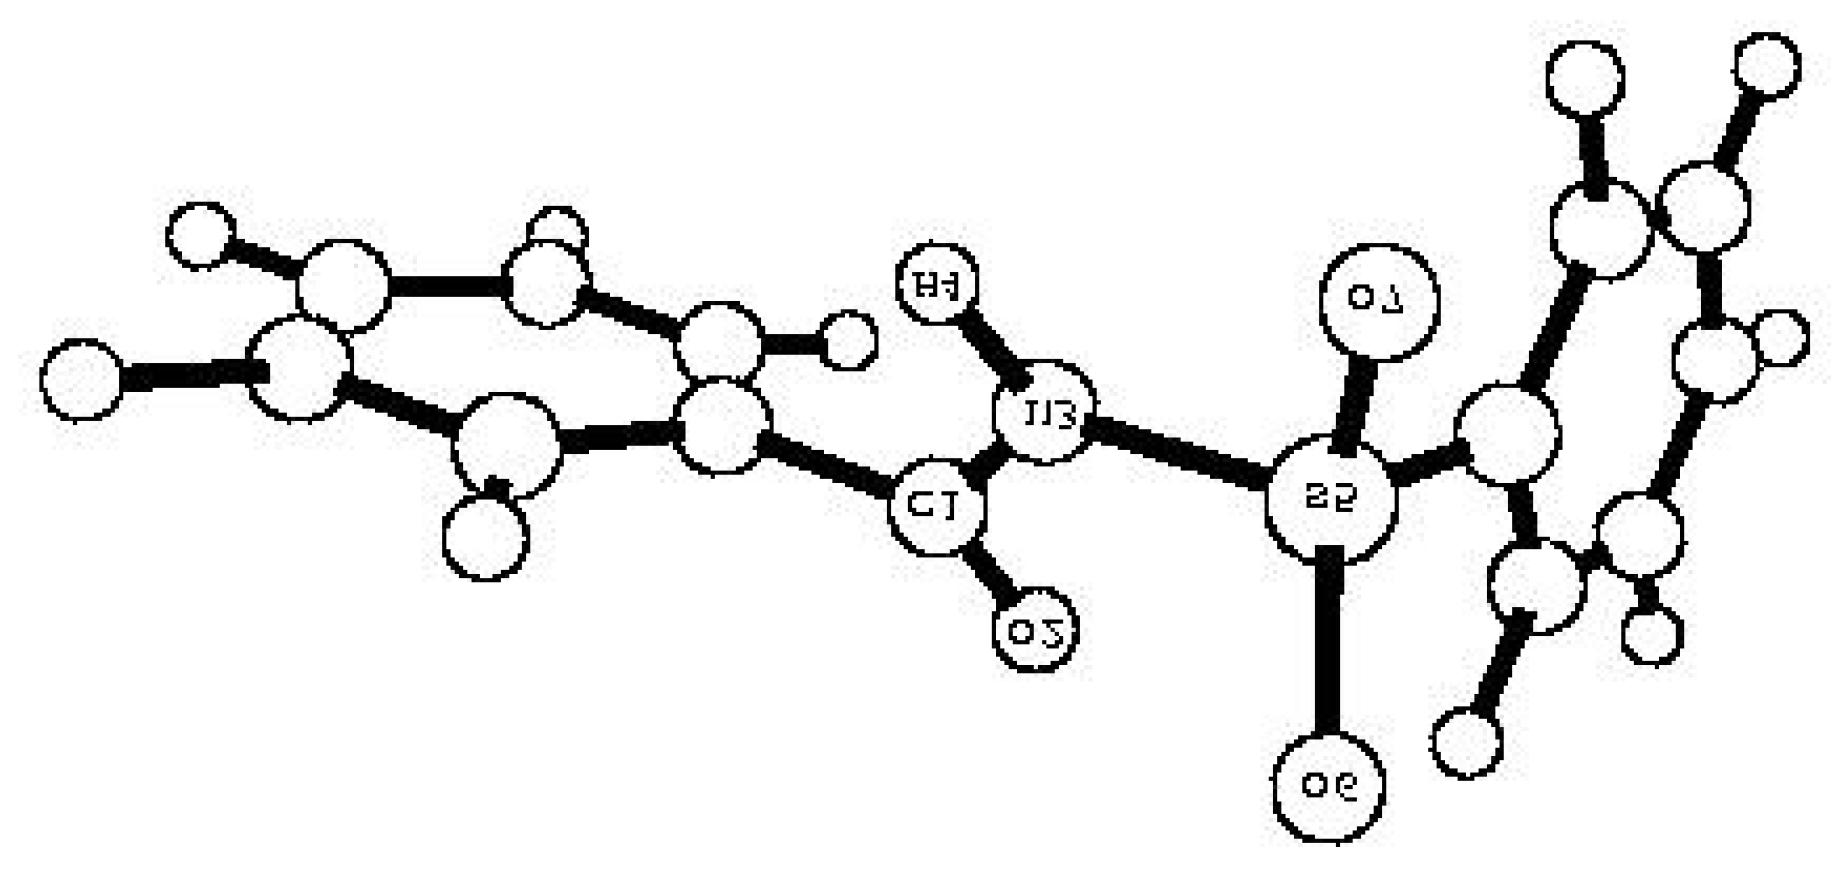
Table 2. The PM3 optimized structure of the unsubstituted parent compound
5 is shown in
Figure 1.
Table 1.
Characteristic infrared spectral data for substituted N-phenylsulfonylbenzamides 1 – 16 in trichloromethane
Table 1.
Characteristic infrared spectral data for substituted N-phenylsulfonylbenzamides 1 – 16 in trichloromethane
| Compound | | / cm-1 | |
| νs(SO2) | νas(SO2) | ν (C=O) | ν (N-H) |
| | | | |
| 1 | 1156.4 | 1344.4 | 1697.2 | -a |
| 2 | 1161.2 | 1346.0 | 1699.2 | -a |
| 3 | 1162.4 | 1350.4 | 1700.0 | 3278.4 |
| 4 | 1168.0 | 1350.8 | 1701.6 | 3280.0 |
| 5 | 1171.2 | 1351.5 | 1702.4 | 3279.2 |
| 6 | 1171.6 | 1353.6 | 1702.4 | 3281.6 |
| 7 | 1169.2 | 1354.0 | 1702.4 | 3273.6 |
| 8 | 1170.8 | 1354.4 | 1702.4 | 3274.0 |
| 9 | 1172.0 | 1357.6 | 1704.4 | -a |
| 10 | 1173.2 | 1357.8 | 1704.8 | -a |
| 11 | 1165.2 | 1345.6 | 1686.4 | 3288.2 |
| 12 | 1168.0 | 1347.6 | 1698.8 | 3281.6 |
| 13 | 1170.4 | 1348.8 | 1702.4 | 3280.0 |
| 14 | 1171.2 | 1349.6 | 1705.6 | 3276.8 |
| 15 | 1171.2 | 1350.4 | 1706.0 | 3273.5 |
| 16 | 1173.0 | 1352.8 | 1710.4 | 3267.2 |
Figure 1.
PM3 optimized structure of compound 5.
Figure 1.
PM3 optimized structure of compound 5.
Table 2.
Calculated PM3 Mulliken charges and bond orders for substituted N-phenyl-sulfonylbenzamides 1 – 16a
Table 2.
Calculated PM3 Mulliken charges and bond orders for substituted N-phenyl-sulfonylbenzamides 1 – 16a
| Comp. | qM(C1) | -qM(O2) | -qM(N3) | qM(H4) | qM(S5) | -qM(O6) | -qM(O7) | p(S5=O6) | p(S5=O7) | p(N3-H4) | p(C1=O2) |
| | | | | | | | | | | | |
| 1 | 0.421 | 0.385 | 0.635 | 0.197 | 2.400 | 0.819 | 0.841 | 1.2023 | 1.2298 | 0.9311 | 1.8024 |
| 2 | 0.421 | 0.385 | 0.636 | 0.197 | 2.400 | 0.818 | 0.841 | 1.2025 | 1.2303 | 0.9309 | 1.8020 |
| 3 | 0.422 | 0.387 | 0.637 | 0.198 | 2.402 | 0.819 | 0.839 | 1.2051 | 1.2307 | 0.9308 | 1.8009 |
| 4 | 0.421 | 0.385 | 0.638 | 0.198 | 2.397 | 0.817 | 0.839 | 1.2049 | 1.2320 | 0.9307 | 1.8035 |
| 5 | 0.422 | 0.384 | 0.639 | 0.199 | 2.396 | 0.817 | 0.838 | 1.2057 | 1.2325 | 0.9306 | 1.8043 |
| 6 | 0.423 | 0.386 | 0.640 | 0.200 | 2.402 | 0.815 | 0.837 | 1.2077 | 1.2348 | 0.9302 | 1.8037 |
| 7 | 0.423 | 0.385 | 0.640 | 0.199 | 2.399 | 0.815 | 0.837 | 1.2061 | 1.2342 | 0.9307 | 1.8039 |
| 8 | 0.422 | 0.385 | 0.639 | 0.199 | 2.399 | 0.815 | 0.837 | 1.2074 | 1.2345 | 0.9308 | 1.8045 |
| 9 | 0.425 | 0.384 | 0.644 | 0.202 | 2.402 | 0.813 | 0.835 | 1.2103 | 1.2370 | 0.9298 | 1.8067 |
| 10 | 0.427 | 0.383 | 0.648 | 0.204 | 2.403 | 0.811 | 0.832 | 1.214 | 1.2405 | 0.9293 | 1.8093 |
| 11 | 0.433 | 0.390 | 0.641 | 0.199 | 2.394 | 0.817 | 0.840 | 1.2038 | 1.2318 | 0.9345 | 1.7997 |
| 12 | 0.433 | 0.389 | 0.640 | 0.198 | 2.396 | 0.817 | 0.8390 | 1.2050 | 1.2318 | 0.9304 | 1.8000 |
| 13 | 0.425 | 0.386 | 0.641 | 0.199 | 2.397 | 0.816 | 0.839 | 1.2054 | 1.2327 | 0.9304 | 1.8037 |
| 14 | 0.423 | 0.383 | 0.637 | 0.197 | 2.399 | 0.815 | 0.837 | 1.2075 | 1.2346 | 0.9309 | 1.8036 |
| 15 | 0.421 | 0.383 | 0.637 | 0.198 | 2.398 | 0.816 | 0.837 | 1.2069 | 1.2341 | 0.9307 | 1.8037 |
| 16 | 0.416 | 0.377 | 0.636 | 0.197 | 2.402 | 0.815 | 0.836 | 1.2096 | 1.2359 | 0.9313 | 1.8070 |
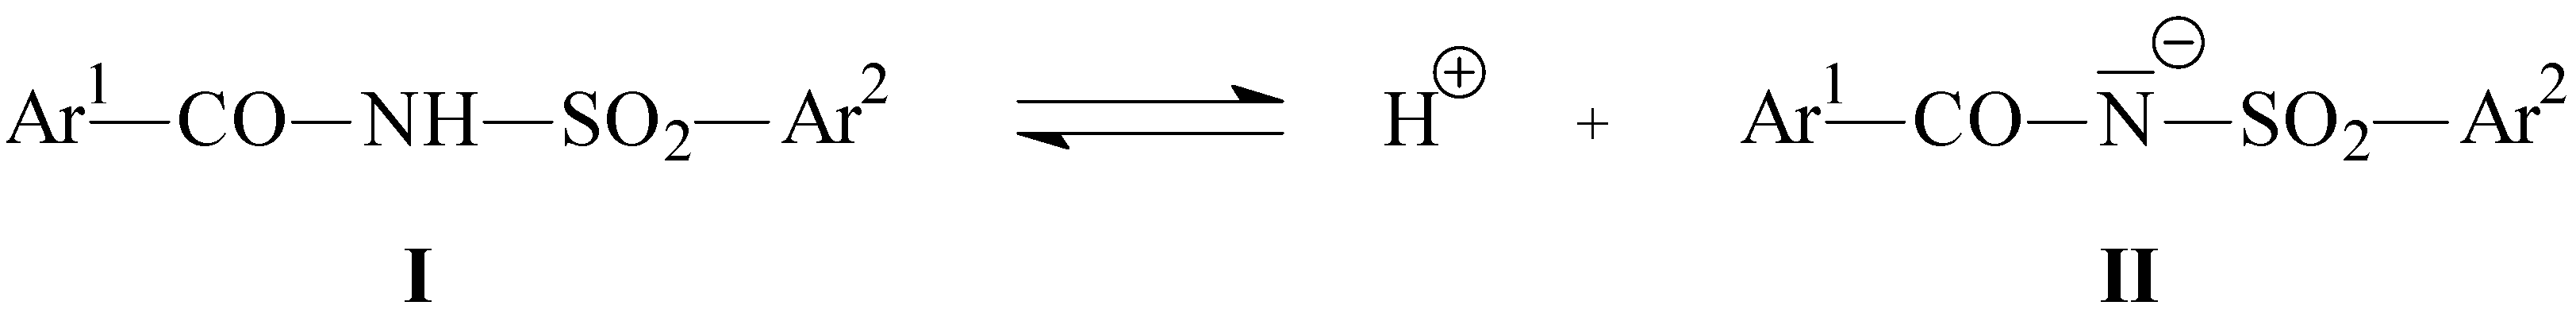
Table 2 and
Table 3 also shows the calculated PM3 charge densities for the hydrogen atom of the N-H group in the undissociated molecules and the heats of the formation for both the undissociated (
I) and dissociated (
II) molecules, which play a crucial role in the determination of the pK
HA values, used later in the correlations with spectral and theoretical data (see
Scheme 2).
Table 3.
Calculated PM3 heats of formation for substituted N-phenyl-sulfonylbenzamides 1 – 16
Table 3.
Calculated PM3 heats of formation for substituted N-phenyl-sulfonylbenzamides 1 – 16
| Compound | -ΔHf (I)a/kJ.mol-1 | -ΔHf (II)b/kJ.mol-1 |
| | | |
| 1 | 243.61 | 424.92 |
| 2 | 237.80 | 421.18 |
| 3 | 383.98 | 572.48 |
| 4 | 263.21 | 449.88 |
| 5 | 222.47 | 411.31 |
| 6 | 403.44 | 604.03 |
| 7 | 248.79 | 446.70 |
| 8 | 186.55 | 388.34 |
| 9 | 68.93 | 282.88 |
| 10 | 245.96 | 476.03 |
| 11 | 200.01 | 386.47 |
| 12 | 381.25 | 574.27 |
| 13 | 261.86 | 449.48 |
| 14 | 401.22 | 602.18 |
| 15 | 248.10 | 445.87 |
| 16 | 70.72 | 283.07 |
Fifty mono parameter (MP) correlations of the IR spectral data, theoretical data, substituent constants and the pK
HA values measured in five organic solvents (MeOH, CH
3CN, DMF, DMSO and Py; taken from our previous publications [
9,
10]) are compared in
Table 4.
In a few cases some points were omitted from the correlations as outliers, mainly for compounds containing extremely polar substituents in
p-position, as N(CH
3)
2, NH
2 and NO
2. For the two differently substituted series
A and
B in most cases also different correlation results were obtained. However, some correlations concerning bond orders and pK
HA values create significant common regression lines for both series
A and
B. This is in a good agreement with the previous conclusion, that due to the extensive delocalization of the negative charge in the conjugated base the overall transmission effects of the C=O and SO
2 groups on the transmission of substituent effects are roughly equal [
9]. In the case of the correlations of IR spectral data for the SO
2 group the most significant correlations are obtained using the arithmetic means (
ν(SO
2)) of the wavenumbers of both ν
s(SO
2) and ν
as(SO
2) vibrations. In the correlations of IR spectral data with substituent constants for the extensively conjugated C=O and SO
2 groups the best results are obtained when the electrophilic Brown-Okamato΄s σ
+ values are used. However, in the case of the N-H group which is cross-conjugated with the C=O and SO
2 groups the best results are obtained using original Hammett σ constants. Both series of substituent constants were taken from [
13].
Table 4.
Mono parameter correlations of IR spectral dataa, substituent constants, dissociation constants and theoretical parameters for substituted N-phenyl-sulfonylbenzamides 1 - 16
Table 4.
Mono parameter correlations of IR spectral dataa, substituent constants, dissociation constants and theoretical parameters for substituted N-phenyl-sulfonylbenzamides 1 - 16
| y = ρx + q |
| No.b | y | x | Series | nc | rd | se | Ff | ρ | q |
| | | | | | | | | | |
| 1 | ν(C=O) | σ+ | A | 10 | 0.992 | 0.31 | 493 | 2.86±0.13 | 1702.4 |
| 2 | | | B | 7 | 0.979 | 1.71 | 116 | 9.94±0.92 | 1704.7 |
| 3 | ν(SO2) | σ+ | A | 9g | 0.995 | 0.52 | 742 | 5.89±0.22 | 1261.0 |
| 4 | | | B | 7 | 0.991 | 0.35 | 287 | 3.24±0.19 | 1260.7 |
| 5 | ν(N-H) | σ | A | poor | correlation | | | |
| 6 | | | B | 7 | 0.989 | 1.05 | 231 | -14.19±0.93 | 3277.4 |
| 7 | ν(C=O) | p(C=O) | A | 8h | 0.967 | 0.42 | 85 | 590.45±64.00 | 637.0 |
| 8 | | | B | 6i | 0.883 | 2.09 | 14 | 1578.91±418.81 | -1143.6 |
| 9 | ν(SO2) | p(S=O) | A + B | 15g | 0.887 | 1.99 | 48 | 1253.49±180.70 | -269.7 |
| 10 | ν(N-H) | p(N-H) | A + B | 11j | 0.841 | 2.53 | 22 | -12558.56±2697.25 | 14965.1 |
| 11 | ν(C=O) | pKHA(MeOH) | A | 10 | 0.964 | 0.65 | 105 | -2.82±0.27 | 1724.8 |
| 12 | | | B | 6k | 0.966 | 2.12 | 55 | -12.72±1.71 | 1807.6 |
| 13 | ν(C=O) | pKHA(CH3CN) | A | 10 | 0.962 | 0.67 | 99 | -1.95±0.20 | 1735.7 |
| 14 | | | B | 6k | 0.968 | 2.03 | 60 | -8.62±1.11 | 1853.8 |
| 15 | ν(C=O) | pKHA(DMF) | A | 10 | 0.950 | 0.77 | 74 | -2.04±0.24 | 1718.5 |
| 16 | | | B | 6k | 0.970 | 1.98 | 64 | -9.85±1.23 | 1784.4 |
| 17 | ν(C=O) | pKHA(DMSO) | A | 10 | 0.923 | 0.95 | 46 | -1.42±0.21 | 1710.7 |
| 18 | | | B | 6k | 0.941 | 2.75 | 31 | -8.22±1.47 | 1755.6 |
| 19 | ν(C=O) | pKHA(Py) | A | 10 | 0.931 | 0.90 | 52 | -2.09±0.29 | 1711.9 |
| 20 | | | B | 6k | 0.956 | 2.38 | 43 | -9.13±1.40 | 1746.7 |
| 21 | ν(SO2) | pKHA(MeOH) | A | 10 | 0.962 | 1.43 | 99 | -5.97±0.60 | 1308.8 |
| 22 | | | B | 7 | 0.962 | 0.74 | 61 | -3.66±0.47 | 1290.1 |
| 23 | ν(SO2) | pKHA(CH3CN) | A | 10 | 0.958 | 1.49 | 90 | -4.12±0.43 | 1331.8 |
| 24 | | | B | 7 | 0.941 | 0.91 | 39 | -2.41±0.39 | 1302.2 |
| 25 | ν(SO2) | pKHA(DMF) | A | 10 | 0.954 | 1.56 | 82 | -4.35±0.48 | 1295.8 |
| 26 | | | B | 7 | 0.944 | 0.90 | 41 | -2.76±0.43 | 1282.8 |
| 27 | ν(SO2) | pKHA(DMSO) | A | 10 | 0.922 | 2.02 | 45 | -3.01±0.45 | 1278.9 |
| 28 | | | B | 7 | 0.956 | 0.80 | 53 | -2.40±0.33 | 1275.3 |
| 29 | ν(SO2) | pKHA(Py) | A | 10 | 0.957 | 1.52 | 86 | -4.55±0.49 | 1282.1 |
| 30 | | | B | 7 | 0.951 | 0.84 | 47 | -2.63±0.38 | 1272.6 |
| 31 | ν(N-H) | pKHA(MeOH) | A + B | 11l | 0.962 | 1.57 | 111 | 9.33±0.89 | 3200.5 |
| 32 | ν(N-H) | pKHA(CH3CN) | A + B | 11l | 0.976 | 1.26 | 179 | 6.43±0.48 | 3164.9 |
| 33 | ν(N-H) | pKHA(DMF) | A + B | 11l | 0.970 | 1.41 | 141 | 7.27±0.61 | 3217.1 |
| 34 | ν(N-H) | pKHA(DMSO) | A + B | 11l | 0.938 | 1.99 | 66 | 5.75±0.71 | 3240.6 |
| 35 | ν(N-H) | pKHA(Py) | A + B | 11l | 0.963 | 1.56 | 114 | 6.77±0.64 | 3244.8 |
| 36 | pKHA(MeOH) | ΔEm | A + B | 15m | 0.904 | 0.31 | 58 | 0.0631±0.0083 | 20.61 |
| 37 | pKHA(CH3CN) | ΔEm | A + B | 15n | 0.912 | 0.43 | 64 | 0.0914±0.0114 | 35.61 |
| 38 | pKHA(DMF) | ΔEm | A + B | 15n | 0.913 | 0.39 | 65 | 0.0852±0.0105 | 24.99 |
| 39 | pKHA(DMSO) | ΔEm | A + B | 15n | 0.878 | 0.61 | 44 | 0.1083±0.0169 | 27.64 |
| 40 | pKHA(Py) | ΔEm | A + B | 15n | 0.894 | 0.45 | 52 | 0.0868±0.0121 | 21.86 |
| 41 | pKHA(MeOH) | qM(H4) | A | 8o | 0.950 | 0.25 | 56 | -447.59±59.81 | 97.31 |
| 42 | | | B | 5p | 0.883 | 0.45 | 11 | 1017.23±312.46 | -192.75 |
| 43 | pKHA(CH3CN) | qM(H4) | A | 8o | 0.948 | 0.36 | 53 | -624.68±85.87 | 141.83 |
| 44 | | | B | 5p | 0.880 | 0.65 | 10 | 1443.32±449.37 | -267.68 |
| 45 | pKHA(DMF) | qM(H4) | A | 8o | 0.945 | 0.36 | 50 | -601.61±85.18 | 128.03 |
| 46 | | | B | 5p | 0.898 | 0.55 | 13 | 1333.49±376.78 | -255.22 |
| 47 | pKHA(DMSO) | qM (H4) | A | 8o | 0.927 | 0.58 | 36 | -827.36±136.77 | 171.06 |
| 48 | | | B | 5p | 0.850 | 0.87 | 8 | 1676.08±599.21 | -324.82 |
| 49 | pKHA(Py) | qM(H4) | A | 8o | 0.910 | 0.47 | 29 | -595.98±110.61 | 123.50 |
| 50 | | | B | 5p | 0.912 | 0.50 | 15 | 1314.15±342.19 | -254.81 |
For pK
HA vs. ΔE correlations the energy ΔE, proportional to the dissociation equilibrium, was defined as the difference between the heats of formation of the dissociated anion (
II) and the undissociated molecule (
I) (see
Scheme 2): ΔE = ΔH
f (
II) - ΔH
f (
I) (1)
In the series of correlations with pK
HA values determined in five different solvents the effect of the solvent on the ρ values can be evaluated using a variety of solvent parameters [
14]. In this study we tried to use the following solvent parameters: E
T(30), π
*, basicity (B
*) and the parameter β. From all possible attempts only the correlations using solvent basicity parameters (B
*) [
14] were satisfactory for the IR properties of the C=O and N-H groups. The results are given in
Table 5.
Table 5.
Correlation between the slopes of dependencies of IR spectral wavenumbers vs. pKHA values in different solvents (ρ) and basicity of solvents (B*) for the series 1 – 16 of substituted N-phenyl-sulfonylbenzamides. ρ = aB* + b
Table 5.
Correlation between the slopes of dependencies of IR spectral wavenumbers vs. pKHA values in different solvents (ρ) and basicity of solvents (B*) for the series 1 – 16 of substituted N-phenyl-sulfonylbenzamides. ρ = aB* + b
| Dependence | | Series | na | Rb | sc | Fd | a | b |
| ν(C=O) vs. pKHAe | | A | 5 | 0.940 | 0.20 | 23 | 2.14±.0.45 | -3.92 |
| ν(C=O) vs. pKHAf | | B | 5 | 0.928 | 0.77 | 19 | 7.57±1.75 | -16.27 |
| ν(N-H) vs. pKHAg | | A + B | 5 | 0.940 | 0.54 | 23 | -5.82±1.22 | 12.15 |
The results show that mainly the C=O and N-H groups in
N-phenylsulfonylbenzamides contribute to the change of the dissociation equilibria upon the solvent basicity variation. It is also evident from the
Table 5, that the series of compounds
B are more sensitive to the solvent effects as the compounds of series
A. The negative slope of the correlation for the N-H group indicates that this structural fragment exhibits an opposite solvent effect than the C=O group.
Table 6 contains six dual parameter (DP) correlation for IR spectral data and Mulliken charges of atoms representing the three characteristic groups (C=O, N-H and SO
2) of the investigated compounds
1 -
16. A similar approach has been reported for ν( SO
2) values by Castan and Dagnac [
15] and recently for the ν( SO
2) and ν( NH
2) values by us [
11]. However, as it follows from the statistical parameters in the
Table 6, such a DP correlation does not bring further significant improvement in the quantitative study of the substituent effects of
N-phenylsulfonylbenzamides.
Table 6.
Dual parameter correlations of IR spectral dataa, and theoretical parameters for the substituted N-phenylsulfonylbenzamides 1 – 16; y = ρ1x1 + ρ2x2 + q
Table 6.
Dual parameter correlations of IR spectral dataa, and theoretical parameters for the substituted N-phenylsulfonylbenzamides 1 – 16; y = ρ1x1 + ρ2x2 + q
| No.b | | y | | x1 | | x2 | | Series | nc | Rd | se | Ff | ρ1 | ρ2 | q |
| 51 | | ν (C=O) | | qM(C1) | | qM(O2) | | A | 10 | 0.836 | 1.4 | 8 | 819.8 | 417.5 | 1515.9 |
| 52 | | | | | | | | B | 7 | 0.883 | 4.4 | 7 | -664.3 | 760.6 | 2275.9 |
| 53 | | ν (N-H) | | qM(N3) | | qM(H4) | | A | poor correlation | | | | |
| 54 | | | | | | | | B | 7 | 0.931 | 3.0 | 13 | -4174.0 | -3082.4 | 1222.6 |
| 55 | | ν(SO2) | | qM(S5) | | qM(O6,O7) | | A | 10 | 0.925 2.1 | 24 | -576.5 | 2008.0 | 4303.5 |
| 56 | | | | | | | | B | 7 | 0.830 | 1.8 | 4 | 727.3 | 179.5 | -425.1 |
Finally, the previously discussed MP correlation suggest a conclusion that the factors controlling dissociation equilibria as well as the IR spectral and structural properties in p-substituted N-phenyl-sulfonylbenzamides must be the same.


