1. Introduction
Cysteine’s (
CYS) ability to dimerize makes it unique among the twenty natural amino acids. A disulfide bond is formed between two oxidized
CYS thiol groups. Disulfide bonds induce conformational restrictions on proteins strongly influencing their folding, stability and function [
1–
5].
Disulfide topology has been successfully used for protein clustering, where the disulfide structure was found to be well-conserved even for apparently non-related proteins [
6–
11]. The disulfide topology has been subsequently used to establish evolutionary relationships not detected by sequence similarity based methods. Disulfide three-dimensional structure and connectivity are highly conserved patterns in nature, and have become the basis of several protein classification analyses [
12–
19].
The stabilization of disulfide bonds has also been the focus of various studies. These include: (i) The analysis of the protein environment in the neighborhood of both bonded and free cysteines [
20,
21]; (ii) the geometrical requirements of a disulfide bond [
21–
23]; (iii) the influence of pH [
14]; (iv) the role of redox mediators [
23–
25]; (v) the role of allosteric factors [
26,
27].
We have performed a systematic investigation on the amino acid composition around disulfide bonds of a set of disulfide-rich proteins selected according to their
SCOP (Structural Classification of Proteins) classification [
28–
30]. Our goal was to assess whether or not the observed patterns can be used to group the proteins according to their biological characteristics, and therefore be used as a classification criteria for very divergent proteins. In our previous work [
6], we demonstrated that the conformational patterns of disulfide bonds are sufficient to group proteins that share both functional and structural characteristics.
The protein set included twelve disulfide-rich protein superfamilies (according to the
SCOP classification) that obeyed the following criteria: (i) contain a minimum of thirty disulfide bonds; (ii) have a minimum of five
PDB structures available; (iii) have X-ray structures with a resolution higher than 2.5 Å and (iv) have only uncomplexed structures. The proteins belonged to the thioredoxin-like superfamily and eleven superfamilies containing small disulfide-rich proteins (
SDP). The thioredoxin-like superfamily is very different from the other proteins in the set, namely because it: (i) presents a lower number of disulfide bonds per
PDB structure; (ii) has an extensive hydrophobic core, completely absent in the small disulfide-rich proteins; (iii) is constituted by disulfide oxidoreductase enzymes; (iv) has a very structured secondary structure, compared to the few secondary structure elements characteristic of the small disulfide-rich proteins; (v) displays absence of disulfide cooperative effects (in small disulfide-rich proteins the disulfide and the buried side-chain influence the dynamics of the folded protein through stabilization effects resulting from the spatial proximity of two or more disulfide bonds) [
12].
Other authors have analyzed the importance of the amino acid environment around disulfide bonds for the stabilization of 3D-structures in proteins [
20,
21] but to date no studies have attempted to use this type of chemical information to aggregate a set of proteins into their respective superfamilies. This is the main purpose of the present work. Our approach involved the use of stratified statistics, which groups the members of a population (the various proteins) into relatively homogeneous and orthogonal subgroups (the described superfamilies) before sampling.
2. Materials and Methods
2.1. General
We used three different criteria to describe the amino acid composition in the proximity of disulfide bonds: (i) all twenty natural amino acids were considered as independent units; (ii) the same amino acids were grouped into classes according to their chemical properties, and these classes clustered into two classification groups (
Table 1). Each entity (amino acid or class) was characterized both by a relative frequency and a diversity index. As a reference set we used a number of proteins selected from the
PDB database by Xia and Xie [
31]. The protein set under study is characterized in
Table 2. A list of all the
PDB structures analyzed is available in
Table 1 of Supplementary Material. A most frequent motif, combining
SCOP clustering and structural elements, was also identified.
The analysis of the amino acid composition around disulfide bonds and the classification of the amino acid were carried using our program
Disulph (see
Table 2 in Supplementary Material for details on
Disulph functionalities). This program, written in FORTRAN, also calculates the relative frequency and the density of each entity in the neighboring region of a disulfide bond in twenty pre-determined spherical shells with thickness 0.5 Å. The neighboring region of a disulfide bond was defined as a sphere, with radius 10 Å, centered at the middle point of this bond, and excluding the cysteines involved in the bond (
Table 3 in Supplementary Material). All the residues containing at least an atom in that region were considered for the statistical analysis. We calculated the conservation of the different entities over different superfamilies using the relative frequency of each entity in the neighboring region of all disulfide bonds. We performed: (i) a one-way
ANOVA hypothesis test with a significance of 5% for each entity (residue or class); (ii) a Scheffé test, with the same significance, for each entity and pair of superfamilies.
2.2. Calculation of the Relative Frequencies for Each Entity
The relative frequency of entity
A, in the neighborhood of disulfide
j, present in superfamily
m, is given by:
where
freqreferece(
A) is the frequency of the same entity in the reference set.
The relative frequency of entity
A, for the superfamily
m, that presents
nSSm disulfide bonds, is given by:
Considering a set with
nSF superfamilies, the relative frequency of the entity in the sample (
rel freq(
A)) can be calculated by:
2.3. ANOVA Test
Considering
nSStotal as the total number of disulfide bonds in the protein set under study, we can now calculate two auxiliary quantities, (i) the mean-square error between the superfamilies (
MSbetweenSF(
A)) and (ii) the mean-square error within the superfamilies (
MSwithinSF(
A)):
and
The statistical parameter
F, associated with the one-way
ANOVA test carried out for entity
A, is calculated as a quotient between the two mean-square error values:
This parameter should be interpreted as:
If F < Fcritical, the relative frequency of the considered entity should be equal for all the superfamilies (null hypothesis).
If F > Fcritical, the mentioned frequency should be different for at least two superfamilies (alternative hypothesis).
In the present case, Fcritical = 1.8 and the null hypothesis never occurs.
Alternatively, the statistical parameter F can also be interpreted as a diversity index. The diversity of the associated entity over the sample increases when F increases. On the other hand, this diversity decreases over the sample when F decreases. The statistical parameter F is invariant with respect to any linear transformation. This means that, using this statistical index, diversity is a property intrinsically associated with the data sample and completely independent of the reference set considered.
2.4. Scheffé Test
Complementary to the one-way
ANOVA statistics carried out for entity
A, we performed the Scheffé test to compare the variability associated with two superfamilies
m and
l. The correspondent statistical parameter
is defined as:
This parameter has the same invariance properties of the statistics parameter
F, defined for a one-way
ANOVA test, and should be interpreted in a similar way:
(iii) If
< Fcritical, the relative frequency of the considered entity should be equal for the superfamilies m and l (null hypothesis).
(iv) If
> Fcritical, the same frequency should differ for these two superfamilies (alternative hypothesis).
In the present case,
Fcritical = 1.8 and the null hypothesis frequently occur. However, the presentation of these results would be difficult, because 27 entities were analyzed. Therefore, we would have to present 31 tables. So, in order to present the differences in the chemical environment around disulfide bonds, we developed new descriptors designated by Scheffé distances. A Scheffé distance
compares the chemical environment around disulfide bonds between two superfamilies
m and
l for any classification group with
nE entities:
2.5. Representing the Distances between Superfamilies
In order to represent distances (
), inferred from the original 12-dimensional hyper-space, we adopted the intuitive form introduced by Xie
et al. [
32]. The coordinates of the original objects (the 12 superfamiles) are projected in the 3D Cartesian space by minimizing the square deviation cost function
SD:
where
dl,m is the distance between the projections the superfamilies
m and
l in the 3D Cartesian space. We used the Newton method to carry out the iterative minimization process.
2.6. Density of an Entity
The density of entity
A within a spherical shell
i of volume
Vi where
A occurs
n(
A)
i times for the all the disulfide bonds included in the sample can be calculated as
2.7. Disulfide Bonds Propensity
The disulfide bonds propensity
Prm, for a superfamily
m with
nPDBm PDB structures, is calculated as,
where
nSSk and
nresk are respectively the number of disulfide bonds and the number of natural amino acids in the PDB structure
k.
3. Results and Discussion
3.1. Frequency and Density
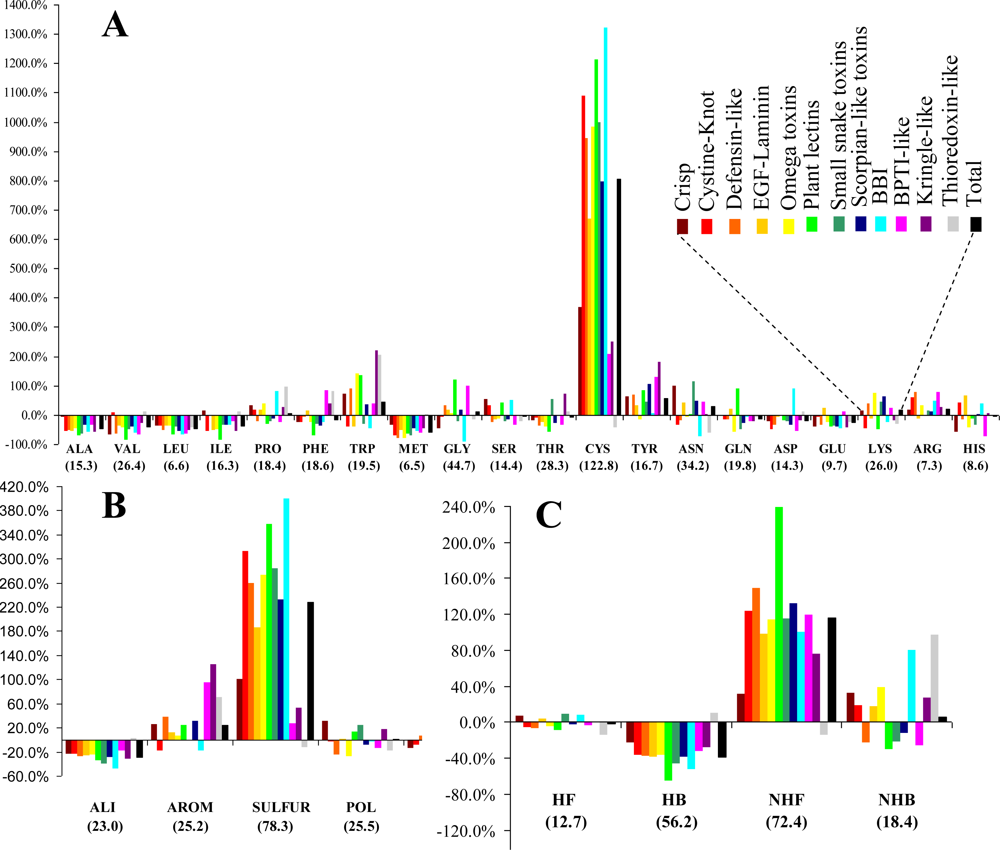
The relative frequencies of the various entities and the corresponding values of the statistical parameter
F are presented in
Figure 1. Cysteines are by far the most abundant amino acid around disulfide bonds, placing the class
SULFUR on top of the most abundant classes (even though methionine has the lowest relative frequency of all amino acids). Almost all these cysteines are disulfide bonded, preventing mis-pairing effects. This predominant abundance results from the
SDP patterns, associated with the above mentioned disulfide cooperative effects. In the thioredoxin-like proteins, which present the lowest disulfide propensities, the cysteine is less abundant than in the reference set. Weakly hydrophilic and aromatic amino acids are abundant when close to disulfide bonds, particularly tyrosine and tryptophan. Aliphatic and hydrophobic amino acids exhibited the lowest relative abundance, particularly alanine, valine leucine and isoleucine. Positively charged amino acids (arginine and lysine) are very abundant in the neighborhood of disulfides, but since negatively charged groups disrupt these bonds glutamate and aspartate have a very low relative frequency. Accordingly, disulfides involving cysteines located at the
C-terminal of a protein are rarely spotted.
The abundance, evaluated by a relative frequency, provided valuable information on the general trends observed in the sample. Although different protein sets and methodologies were used, our results are reasonably consistent to those obtained by Petersen
et al. [
21]. In fact, both studies are in agreement relatively to four of the five residues with highest abundance (cysteine, tryptophan, tyrosine and arginine). Aliphatic and hydrophobic amino acids exhibited the lowest relative abundance in both studies.
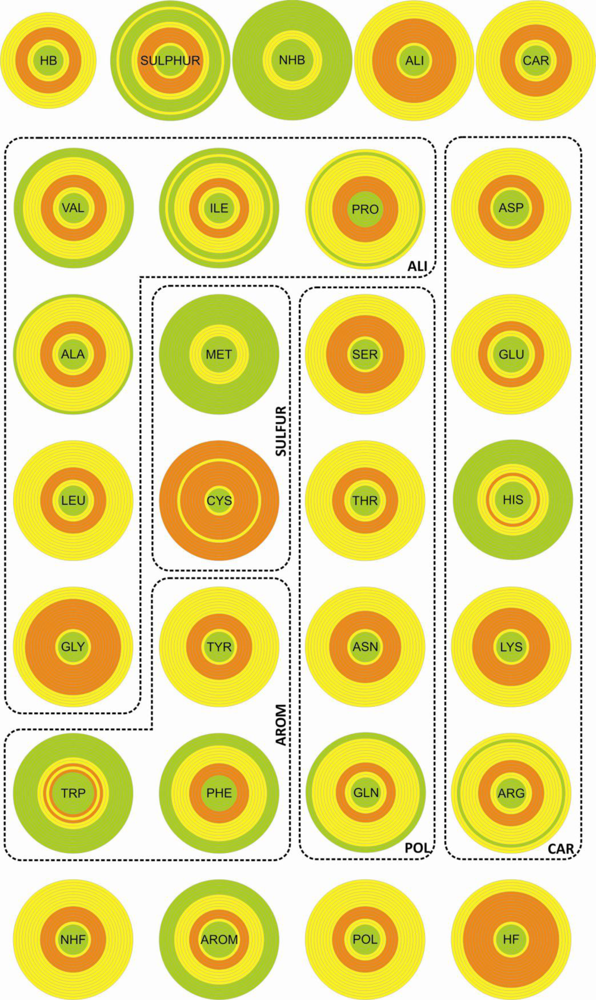
The densities for the twenty natural amino acids and the different entities in the various spherical shells (
Table 3 in Supplementary Material) are shown in
Figure 2. The density distributions of the different entities as a function of the distance to the center of the disulfide bond display a common pattern: The densities are null at short distances, have maxima at intermediate distances and decrease for long distances.
Interestingly, we can see very different patterns for residues with similar relative frequencies. Among those that are on top of the frequency values (
Table 4 in Supplementary Material), cysteine is the one showing an almost uniform distribution with high concentration practically everywhere from 2 to 10 Å distance from the disulfide bond. Tyrosine and tryptophan which have relative frequency values of around 50% show radically different distributions: Tyrosine is abundant in all shells and tryptophan is only significantly present at a distance of 3.5–6 Å from the disulfide bond.
3.2. Diversity
The entities (CYS, SULFUR and NHF) with highest relative abundance are associated with the largest diversity. However, the two quantities do not present any significant correlation.
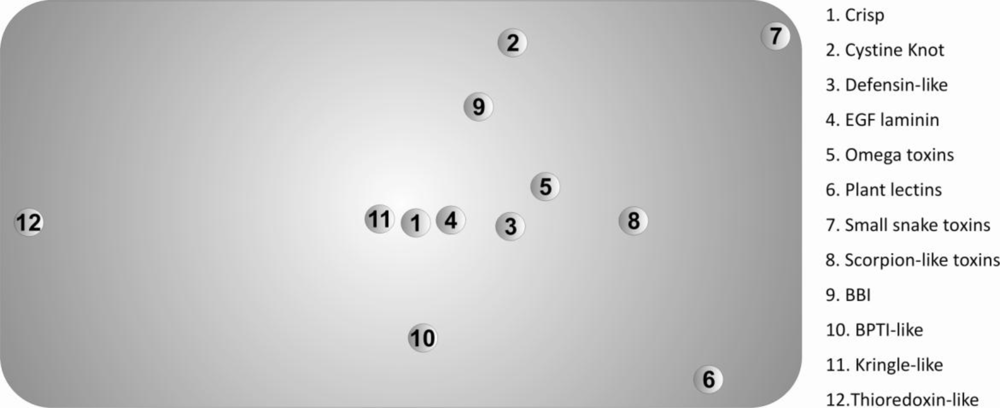
The Scheffé distance matrices, obtained with the three classification criteria used in this work, were in reasonable agreement. In this context, we opted to represent only the projected 3D-Cartesian coordinates inferred from the 20-dimensional of natural amino acids in
Figure 3.
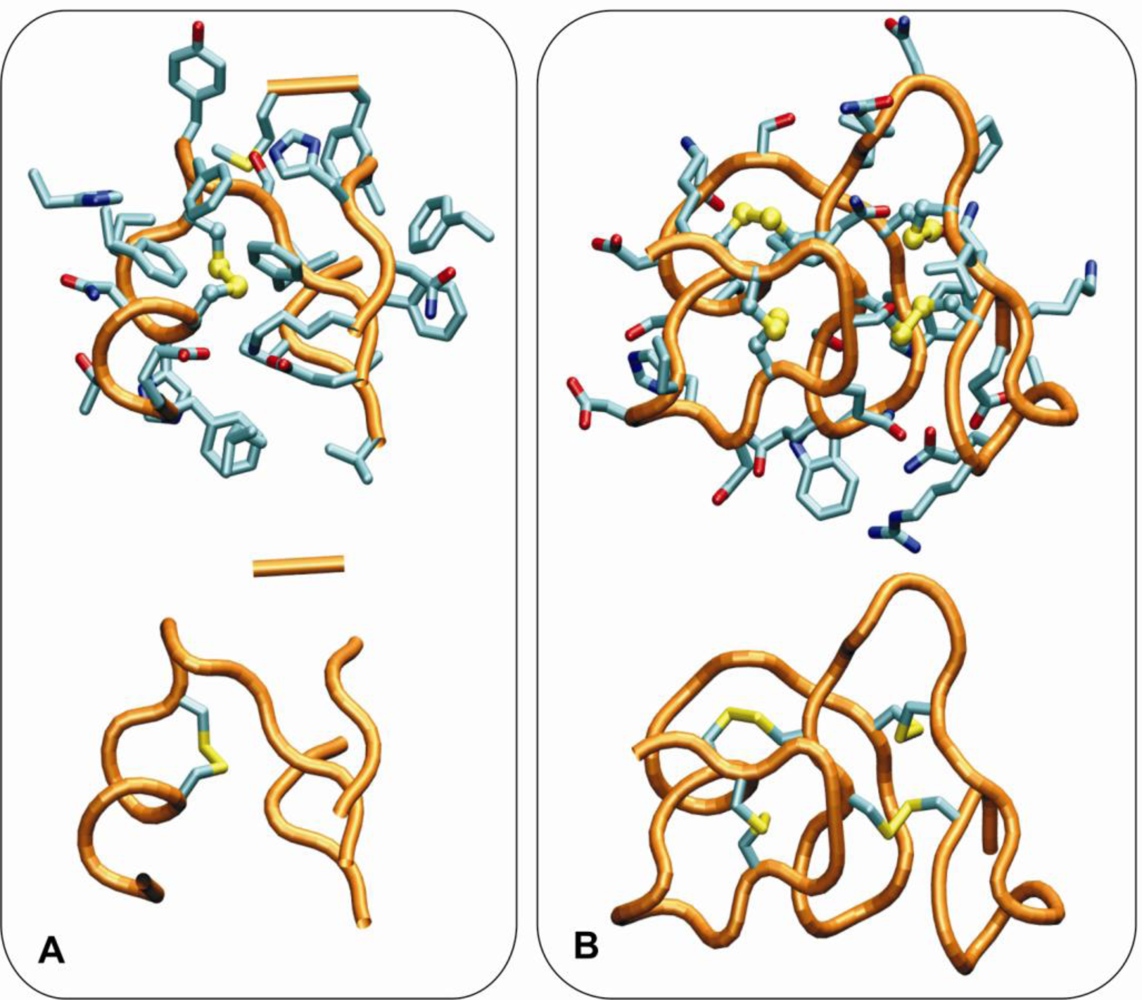
These descriptors allowed us to find the superfamilies that present similar/dissimilar chemical environments around their disulfide bonds, providing useful information regarding evolutionary processes and further insight into the classification of disulfide-rich proteins. The main divergences, observed in
Figure 3, can be explained by significant deviations from the most frequent motif identified in
Table 2.
The known differences between the thioredoxin-like superfamily and the 11 superfamilies with a disulfide-rich fold domain from small proteins class, are confirmed by the values the Scheffé descriptors. These differences include:
(v) Unlike for the thioredoxin-like superfamily, the folding of small disulfide-rich proteins is dependent on disulfide bond cooperative effects—this is evident from the significantly larger relative frequency of cysteine residues observed in the small disulfide-rich proteins (
Figure 1A and
Figure 4);
(vi) thioredoxin-like proteins have a large hydrophobic core, absent in the small disulfide-rich proteins—this leads to significantly lower frequencies of amino acids from classes
ALI and
HB in the small disulfide-rich proteins relatively to the thioredoxin-like proteins (
Figure 1B and
1C).
Our results suggest that the amino acid patterns around disulfide bonds might be used as a tool to cluster proteins in a biologically relevant way. This is an interesting feature of disulfide bonds, that to date has never been considered (previous studies [
20,
21] have only analyzed global statistical tendencies).
4. Conclusions
We did a thorough analysis of the amino acid neighborhood of the disulfide bonds using stratified statistics, which implies grouping the various proteins into superfamilies before sampling. We examined both the abundance and the diversity of individual amino acids and amino acid groups.
We found that the regions around disulfide bonds are particularly rich in weakly hydrophilic and aromatic amino acids. Aliphatic and hydrophobic amino acids exhibited the lowest relative abundance.
The diversity, associated with the distribution of the different entities over the sample, was determined by using the F descriptor within the ANOVA statistics. The results obtained show that the entities with large diversity are those presenting the largest discriminate behavior between the thioredoxin-like and the SDP superfamilies (the cysteine residue and classes SULFUR, NHF and HB).
We also evaluated the diversity within each superfamily using the Scheffé distances, which were introduced in this work. A most frequent motif was identified in the protein set. The 3D-cartesian projections of the Scheffé distances reflect essentially the deviations of the diverse superfamilies from this motif. In particular, the high divergence between the thioredoxin-like and the SDP superfamilies are clearly evident in this representation. These results suggest the possibility of using the composition of the chemical environment around disulfide bonds as a tool in protein classification of very divergent disulfide-rich proteins.
Acknowledgments
We thank the Fundação para a Ciência e a Tecnologia (FCT) for a doctoral scholarship granted to José Rui Ferreira Marques.
Rute R. da Fonseca was funded by FCT (SFRH/BPD/26769/2006).
We thank the Universidade do Porto for an electric wheelchair and a TrackerPro (a computer input device that takes the place of a mouse for people with no hand movement) granted to José Rui Ferreira Marques.
References
- Bhattacharyya, R; Pal, D; Chakrabarti, P. Disulfide bonds, their stereospecific environment and conservation in protein structures. Prot. Eng. Des. Sel 2004, 17, 795–808. [Google Scholar]
- Hogg, PJ. Disulfide bonds as switches for protein function. Trends Biochem. Sci 2003, 28, 210–214. [Google Scholar]
- Klink, TA; Woycechowsky, KJ; Taylor, KM; Raines, RT. Contribution of disulfide bonds to the conformational stability and catalytic activity of ribonuclease A. Eur. J. Biochem 2000, 267, 566–572. [Google Scholar]
- Sardiu, ME; Cheung, MS; Yi-Kuo, Y. Cysteine-cysteine contact preference leads to target-focusing in protein folding. Biophys. J 2007, 93, 938–951. [Google Scholar]
- Wedemeyer, WJ; Welker, E; Narayan, M; Scheraga, HA. Disulfide bonds and protein folding. Biochemistry 2000, 39, 4208–4216. [Google Scholar]
- Marques, JR; da Fonseca, RR; Drury, B; Melo, A. Conformational characterization of disulfide bonds: A tool for protein classification. J. Theor. Biol 2010, 267, 388–395. [Google Scholar]
- Benham, CJ; Jafri, MS. Disulfide bonding patterns and protein topologies. Protein Sci 1993, 2, 41–54. [Google Scholar]
- Gupta, A; van Vlijmen, HWT; Singh, JA. Classification of disulfide patterns and its relationship to protein structure and function. Protein Sci 2004, 13, 2045–2058. [Google Scholar]
- Mas, JM; Aloy, P; Marti-Renom, MA; Oliva, B; Blanco-Aparicio, C; Molina, MA; Llorens, R; Querol, E; Aviles, FX. Protein similarities beyond disulphide bridge topology. J. Mol. Biol 1998, 284, 541–548. [Google Scholar]
- Mas, JM; Aloy, P; Marti-Renom, MA; Oliva, B; Llorens, R; Aviles, FX; Querol, E. Classification of protein disulphide-bridge topologies. J. Comput.-Aided Mol. Des 2001, 15, 477–487. [Google Scholar]
- van Vlijmen, HWT; Gupta, A; Singh, J. A Novel base of disulfide patterns and its application to the discovery of distantly related homologs. J. Mol. Biol 2004, 335, 1083–1092. [Google Scholar]
- Cheek, S; Krishna, SS; Grishin, NV. Structural classification of small, disulfide-rich protein domains. J. Mol. Biol 2006, 359, 215–237. [Google Scholar]
- Chuang, CC; Chen, CY; Yang, JM; Lyu, PC; Hwang, JK. Relationship between protein structures and disulfide bonding patterns. Proteins 2003, 53, 1–5. [Google Scholar]
- Creighton, TE. Disulphide bonds and protein stability. BioEssays 2005, 8, 57–63. [Google Scholar]
- Harrison, PM; Sternberg, JE. The disulphide-cross: From cystine geometry and clustering to classification of small disulphide-rich protein folds. J. Mol. Biol 1996, 264, 603–623. [Google Scholar]
- Kartik, VJ; Lavanya, T; Guruprasad, K. Analysis of disulphide bond connectivity patterns in protein tertiary structure. Int. J. Biol. Macromol 2006, 38, 174–179. [Google Scholar]
- Lenffer, J; Lai, P; El Mejaber, W; Khan, AM; Koh, JLY; Tan, PTJ; Seah, SH; Brusic, V. CysView: Protein classification based on cysteine pairing patterns. Nucleic Acids Res 2004, 32, W350–W355. [Google Scholar]
- Thangudu, RR; Sharma, P; Srinivasan, N; Offmann, B. Analycys: A database for conservation and conformation of disulphide bonds in homologous protein domains. Proteins 2007, 67, 255–261. [Google Scholar]
- Thornton, JM. Disulphide bridges in globular proteins. J. Mol. Biol 1981, 151, 261–287. [Google Scholar]
- Jahandideh, S; Hoseini, S; Jahandideh, M; Hoseini, A; Yazdi, AS. Analysis of factors that induce cysteine bonding state. Comput. Biol. Med 2009, 39, 332–339. [Google Scholar]
- Petersen, MTN; Jonson, PH; Petersen, SB. Amino acid neighbours and detailed conformational analysis of cysteines in proteins. Protein Eng. Des. Sel 1999, 12, 535–548. [Google Scholar]
- Dani, VS; Ramakrishnan, C; Varadarajan, R. MODIP revisited: Re-evaluation and refinement of an automated procedure for modeling of disulfide bonds in proteins. Protein Eng. Des. Sel 2003, 16, 187–193. [Google Scholar]
- Inaba, K; Murakami, S; Suzuki, M; Nakagawa, A; Yamashita, E; Okada, K; Ito, K. Crystal structure of the DsbB-DsbA complex reveals a mechanism of disulfide bond generation. Cell 2006, 127, 789–201. [Google Scholar]
- Ito, K. Editing disulphide bonds: error correction using redox currencies. Mol. Microbiol 2010, 75, 1–5. [Google Scholar]
- Sevier, CS; Kaiser, CA. Ero1 and redox homeostasis in the endoplasmic reticulum. BBA 2008, 1783, 549–556. [Google Scholar]
- Schmidt, B; Ho, L; Hogg, PJ. Allosteric disulphide bonds. Biochemistry 2006, 45, 7429–7433. [Google Scholar]
- Schmidt, B; Hogg, PJ. Search for allosteric disulfide bonds in NMR structures. BMC Struct. Biol 2007, 7, 49. [Google Scholar]
- Murzin, AG; Brenner, SE; Hubbard, T; Chothia, C. SCOP: A structural classification of proteins database for investigation of sequences and structures. J. Mol. Biol 1995, 247, 536–540. [Google Scholar]
- Andreeva, A; Howorth, D; Brenner, SE; Hubbard, TJP; Chothia, C; Murzin, AG. SCOP database in 2004: Refinements integrate structure and sequence family data. Nucleic Acids Res 2004, 32, D222–D229. [Google Scholar]
- Andreeva, A; Howorth, D; Chandonia, J-M; Brenner, SE; Hubbard, TJP; Chothia, C; Murzin, AG. Data growth and its impact on the SCOP database: new developments. Nucleic Acids Res 2008, 36, D419–D425. [Google Scholar]
- Xia, X; Xie, Z. Protein structure, neighbor effect, and a new index of amino acid dissimilarities. Mol. Biol. Evol 2002, 19, 58–67. [Google Scholar]
- Xie, D; Tropsha, A; Schlick, T. An efficient projection protocol for chemical databases: Singular value decomposition combined with truncated-Newton minimization. J. Chem. Inf. Comput. Sci 2000, 40, 167–177. [Google Scholar]
© 2010 by the authors; licensee Molecular Diversity Preservation International, Basel, Switzerland. This article is an open-access article distributed under the terms and conditions of the Creative Commons Attribution license (http://creativecommons.org/licenses/by/3.0/).


