Structural Requirements of N-Substituted Spiropiperidine Analogues as Agonists of Nociceptin/Orphanin FQ Receptor

Abstract
:1. Introduction
2. Results and Discussion
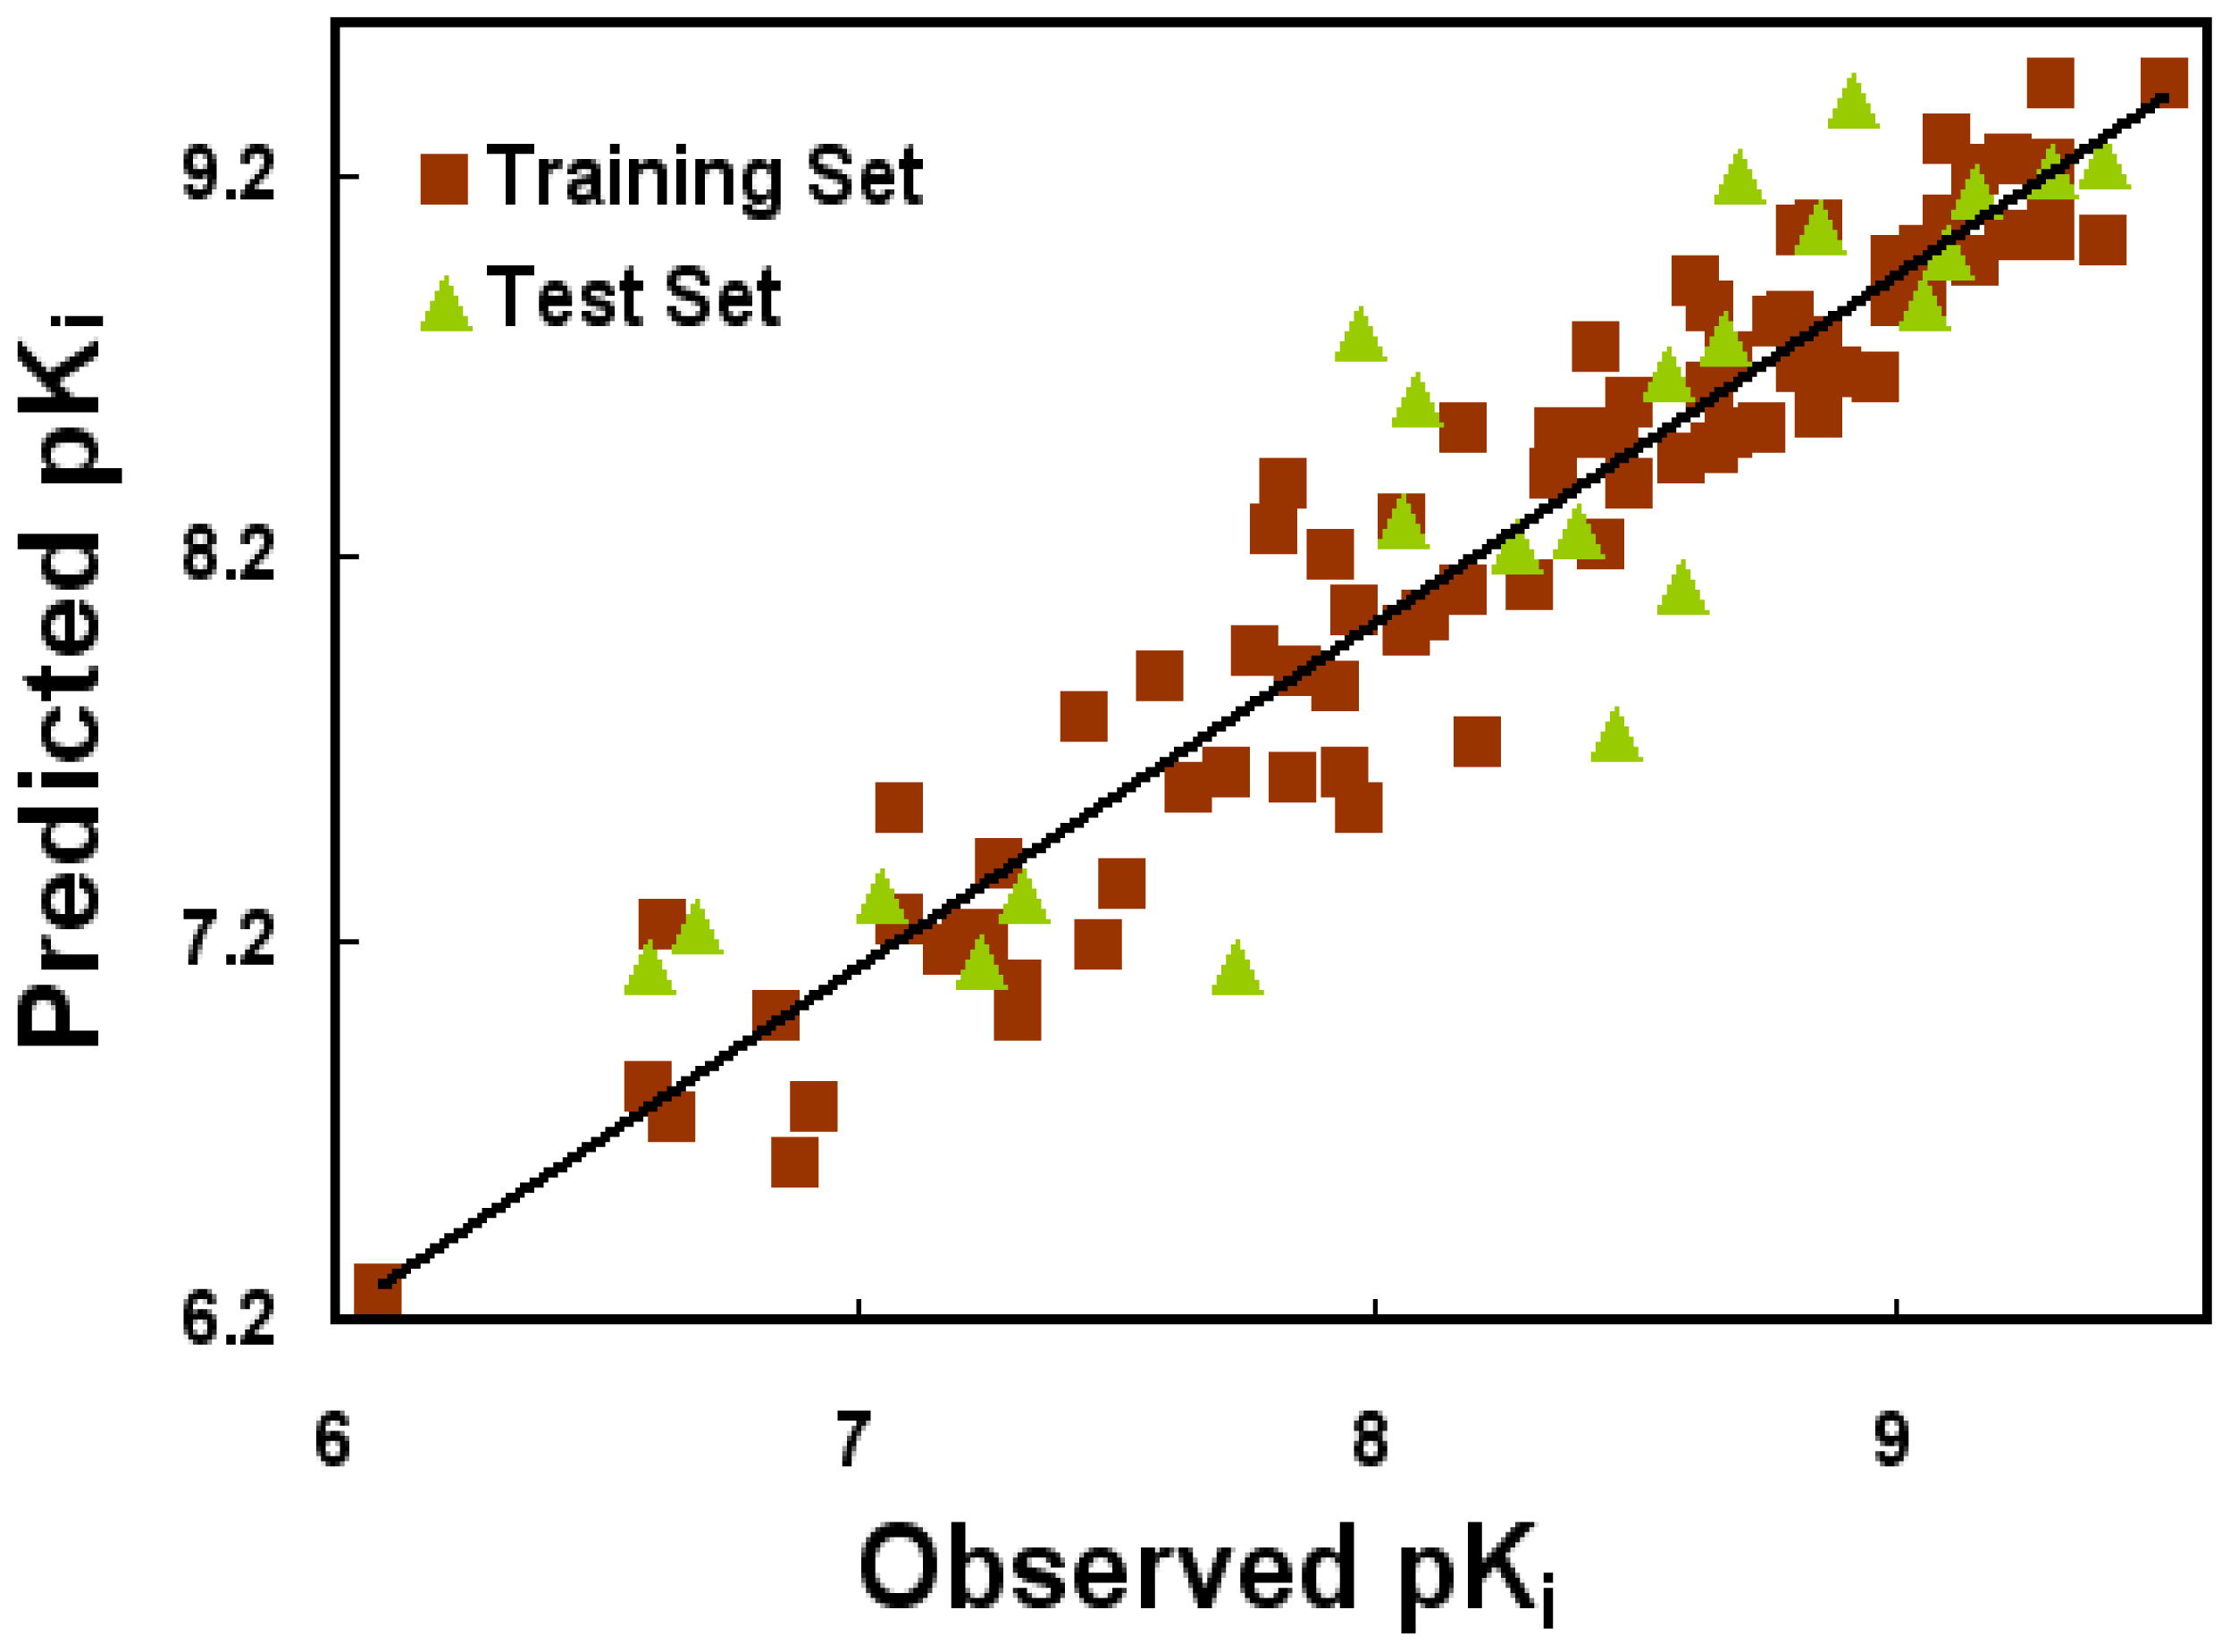
2.1. CoMFA and CoMSIA Statistical Results
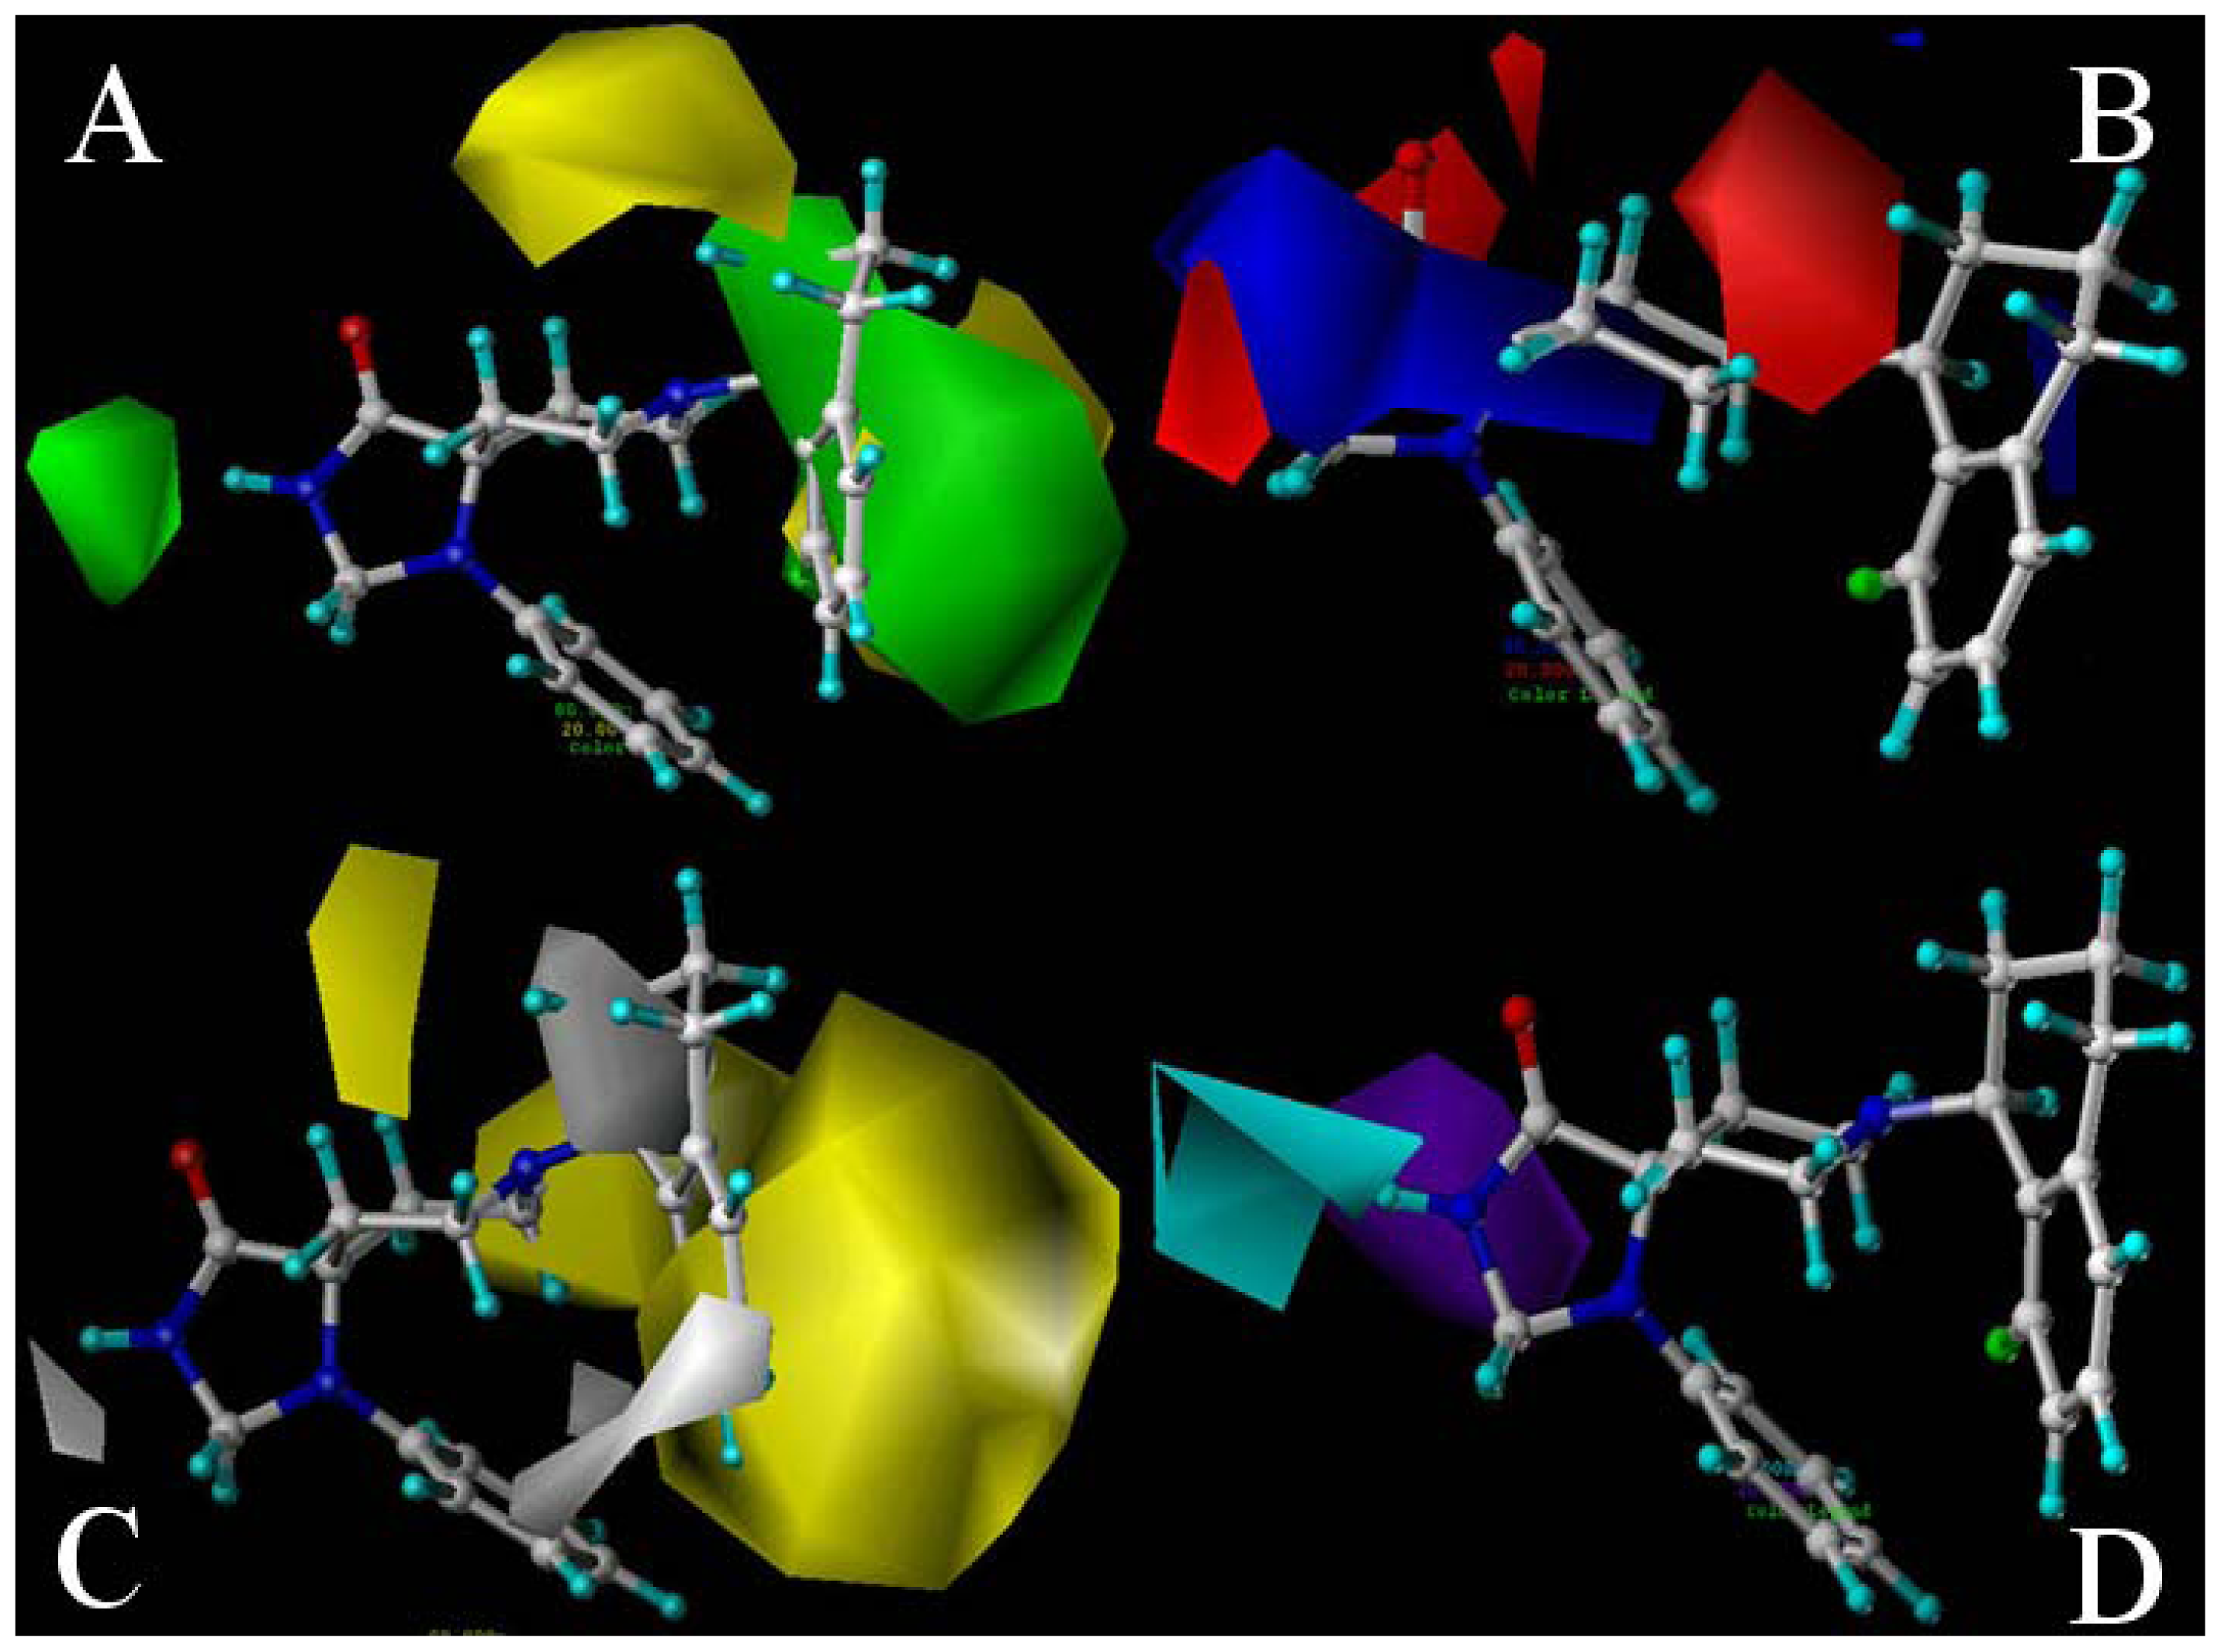
2.2. 3D-QSAR Contour Maps

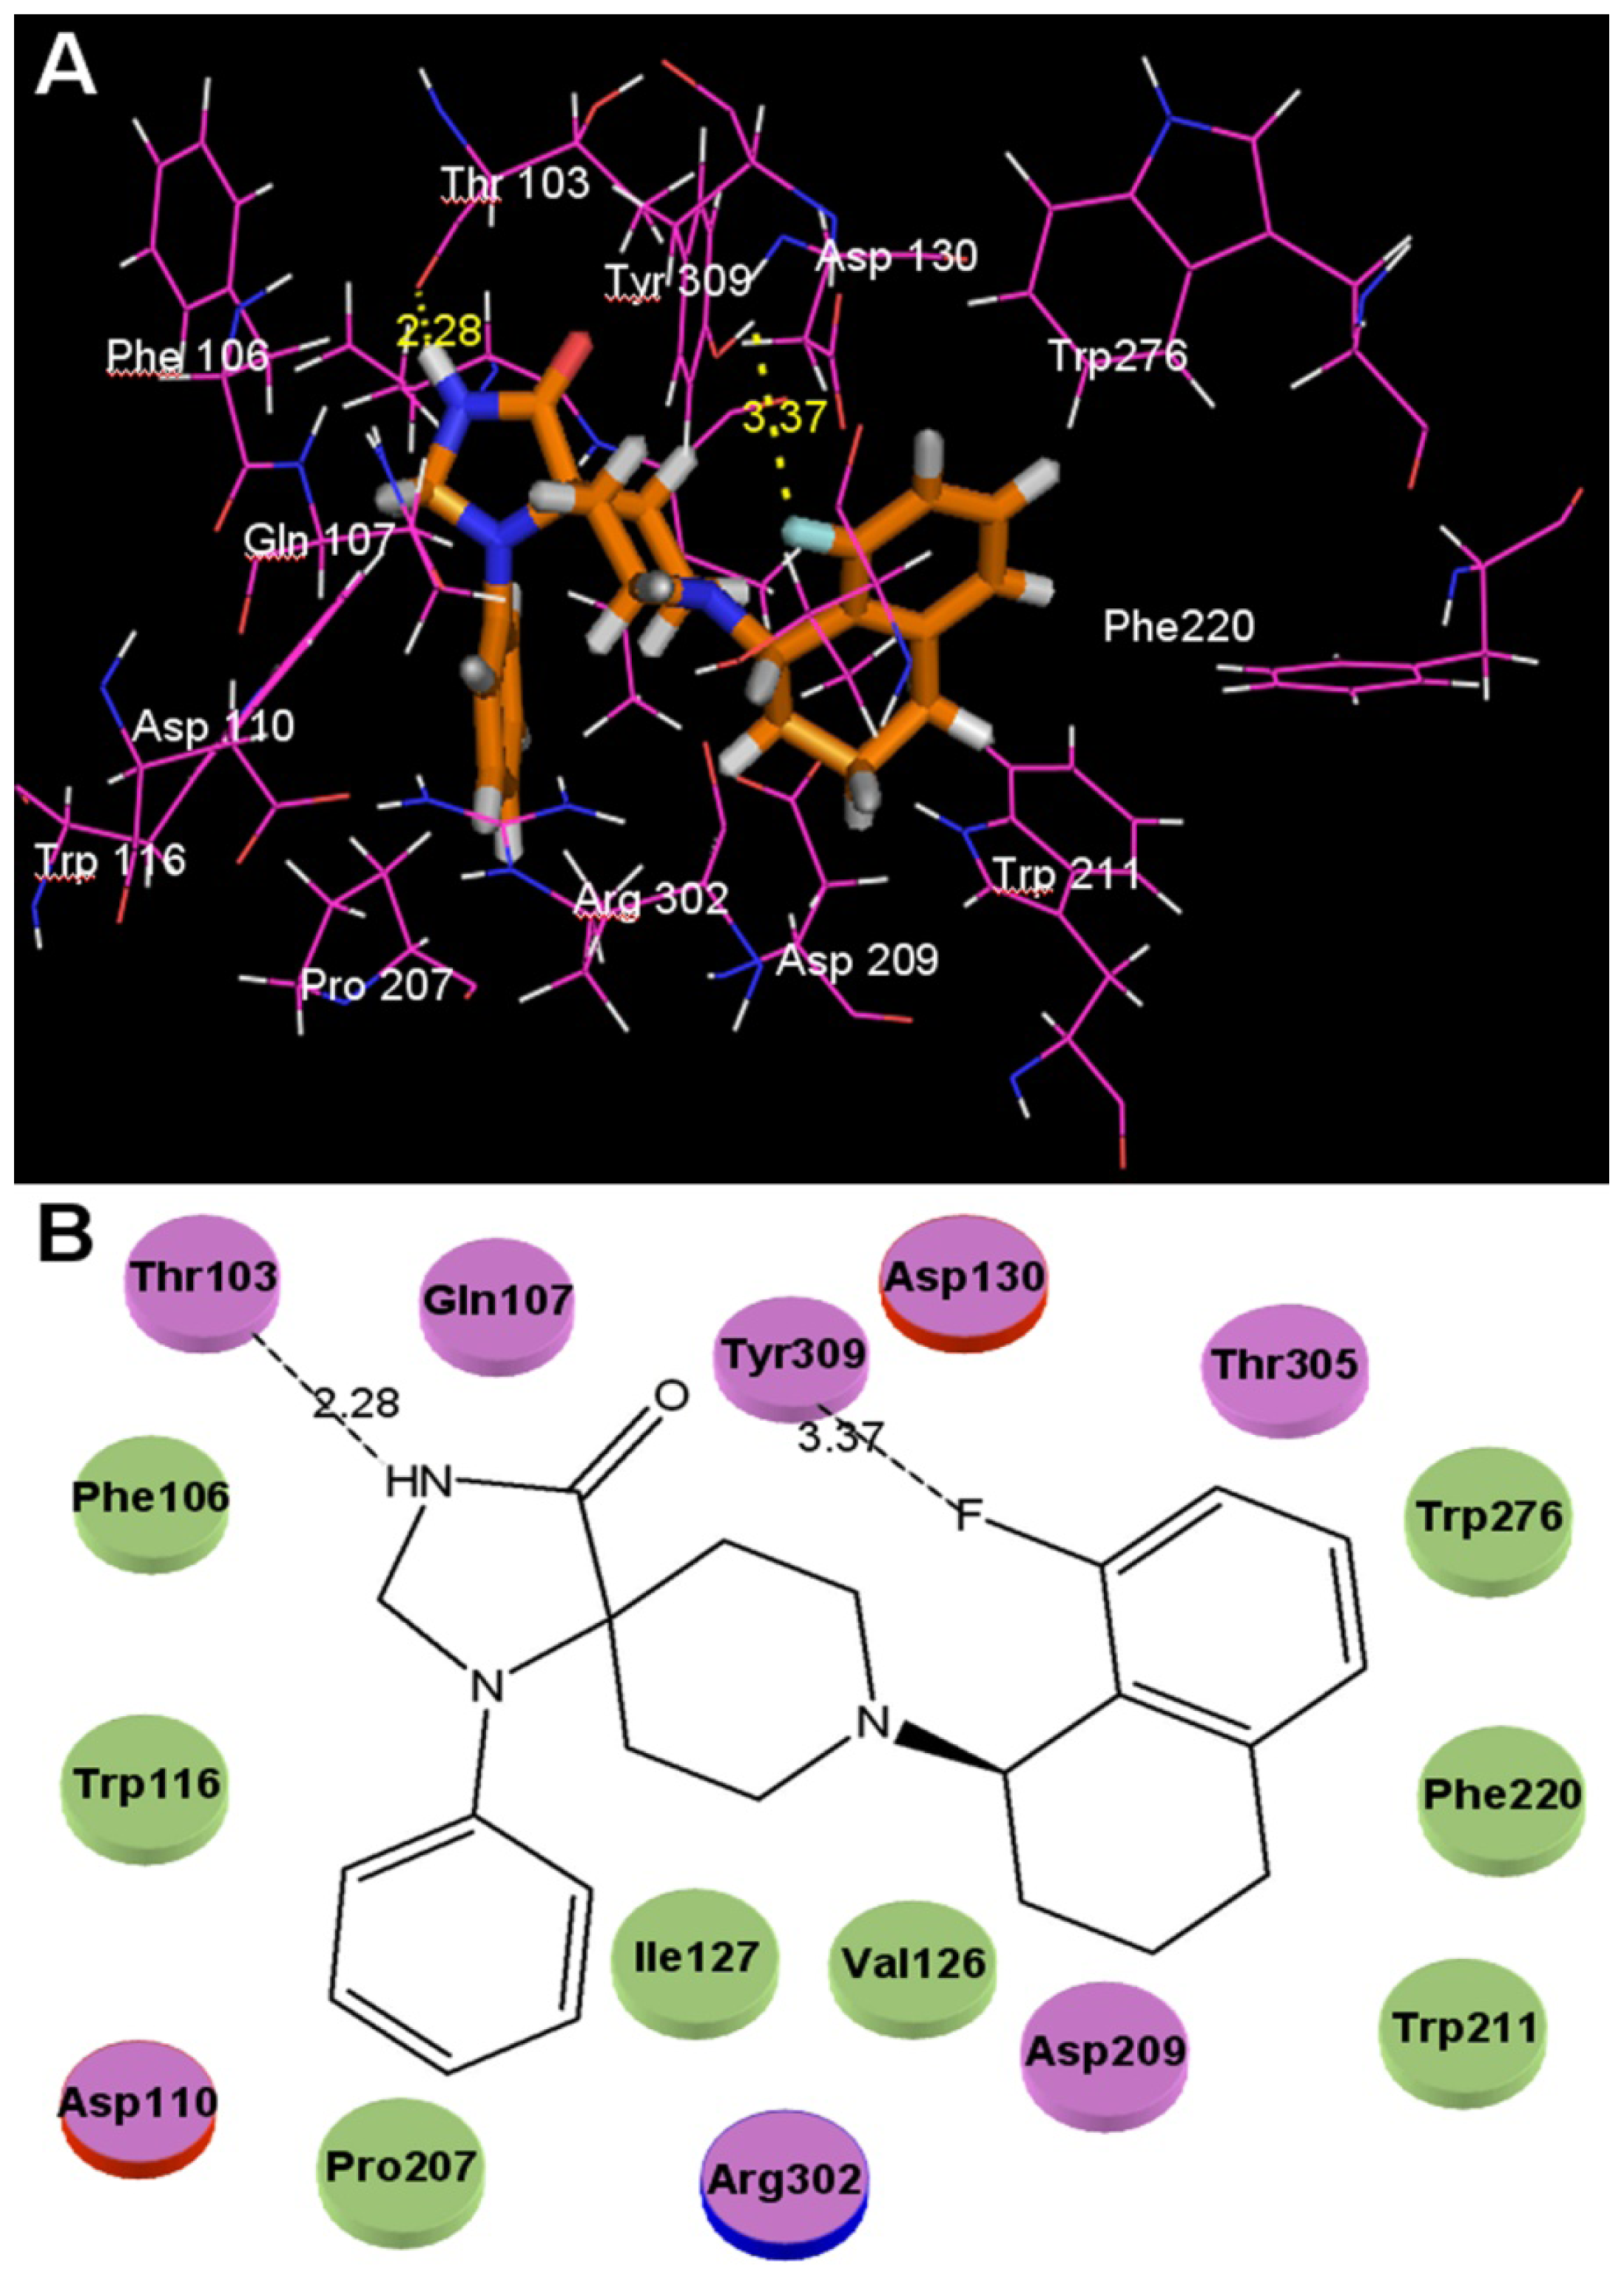
2.3. Docking Studies
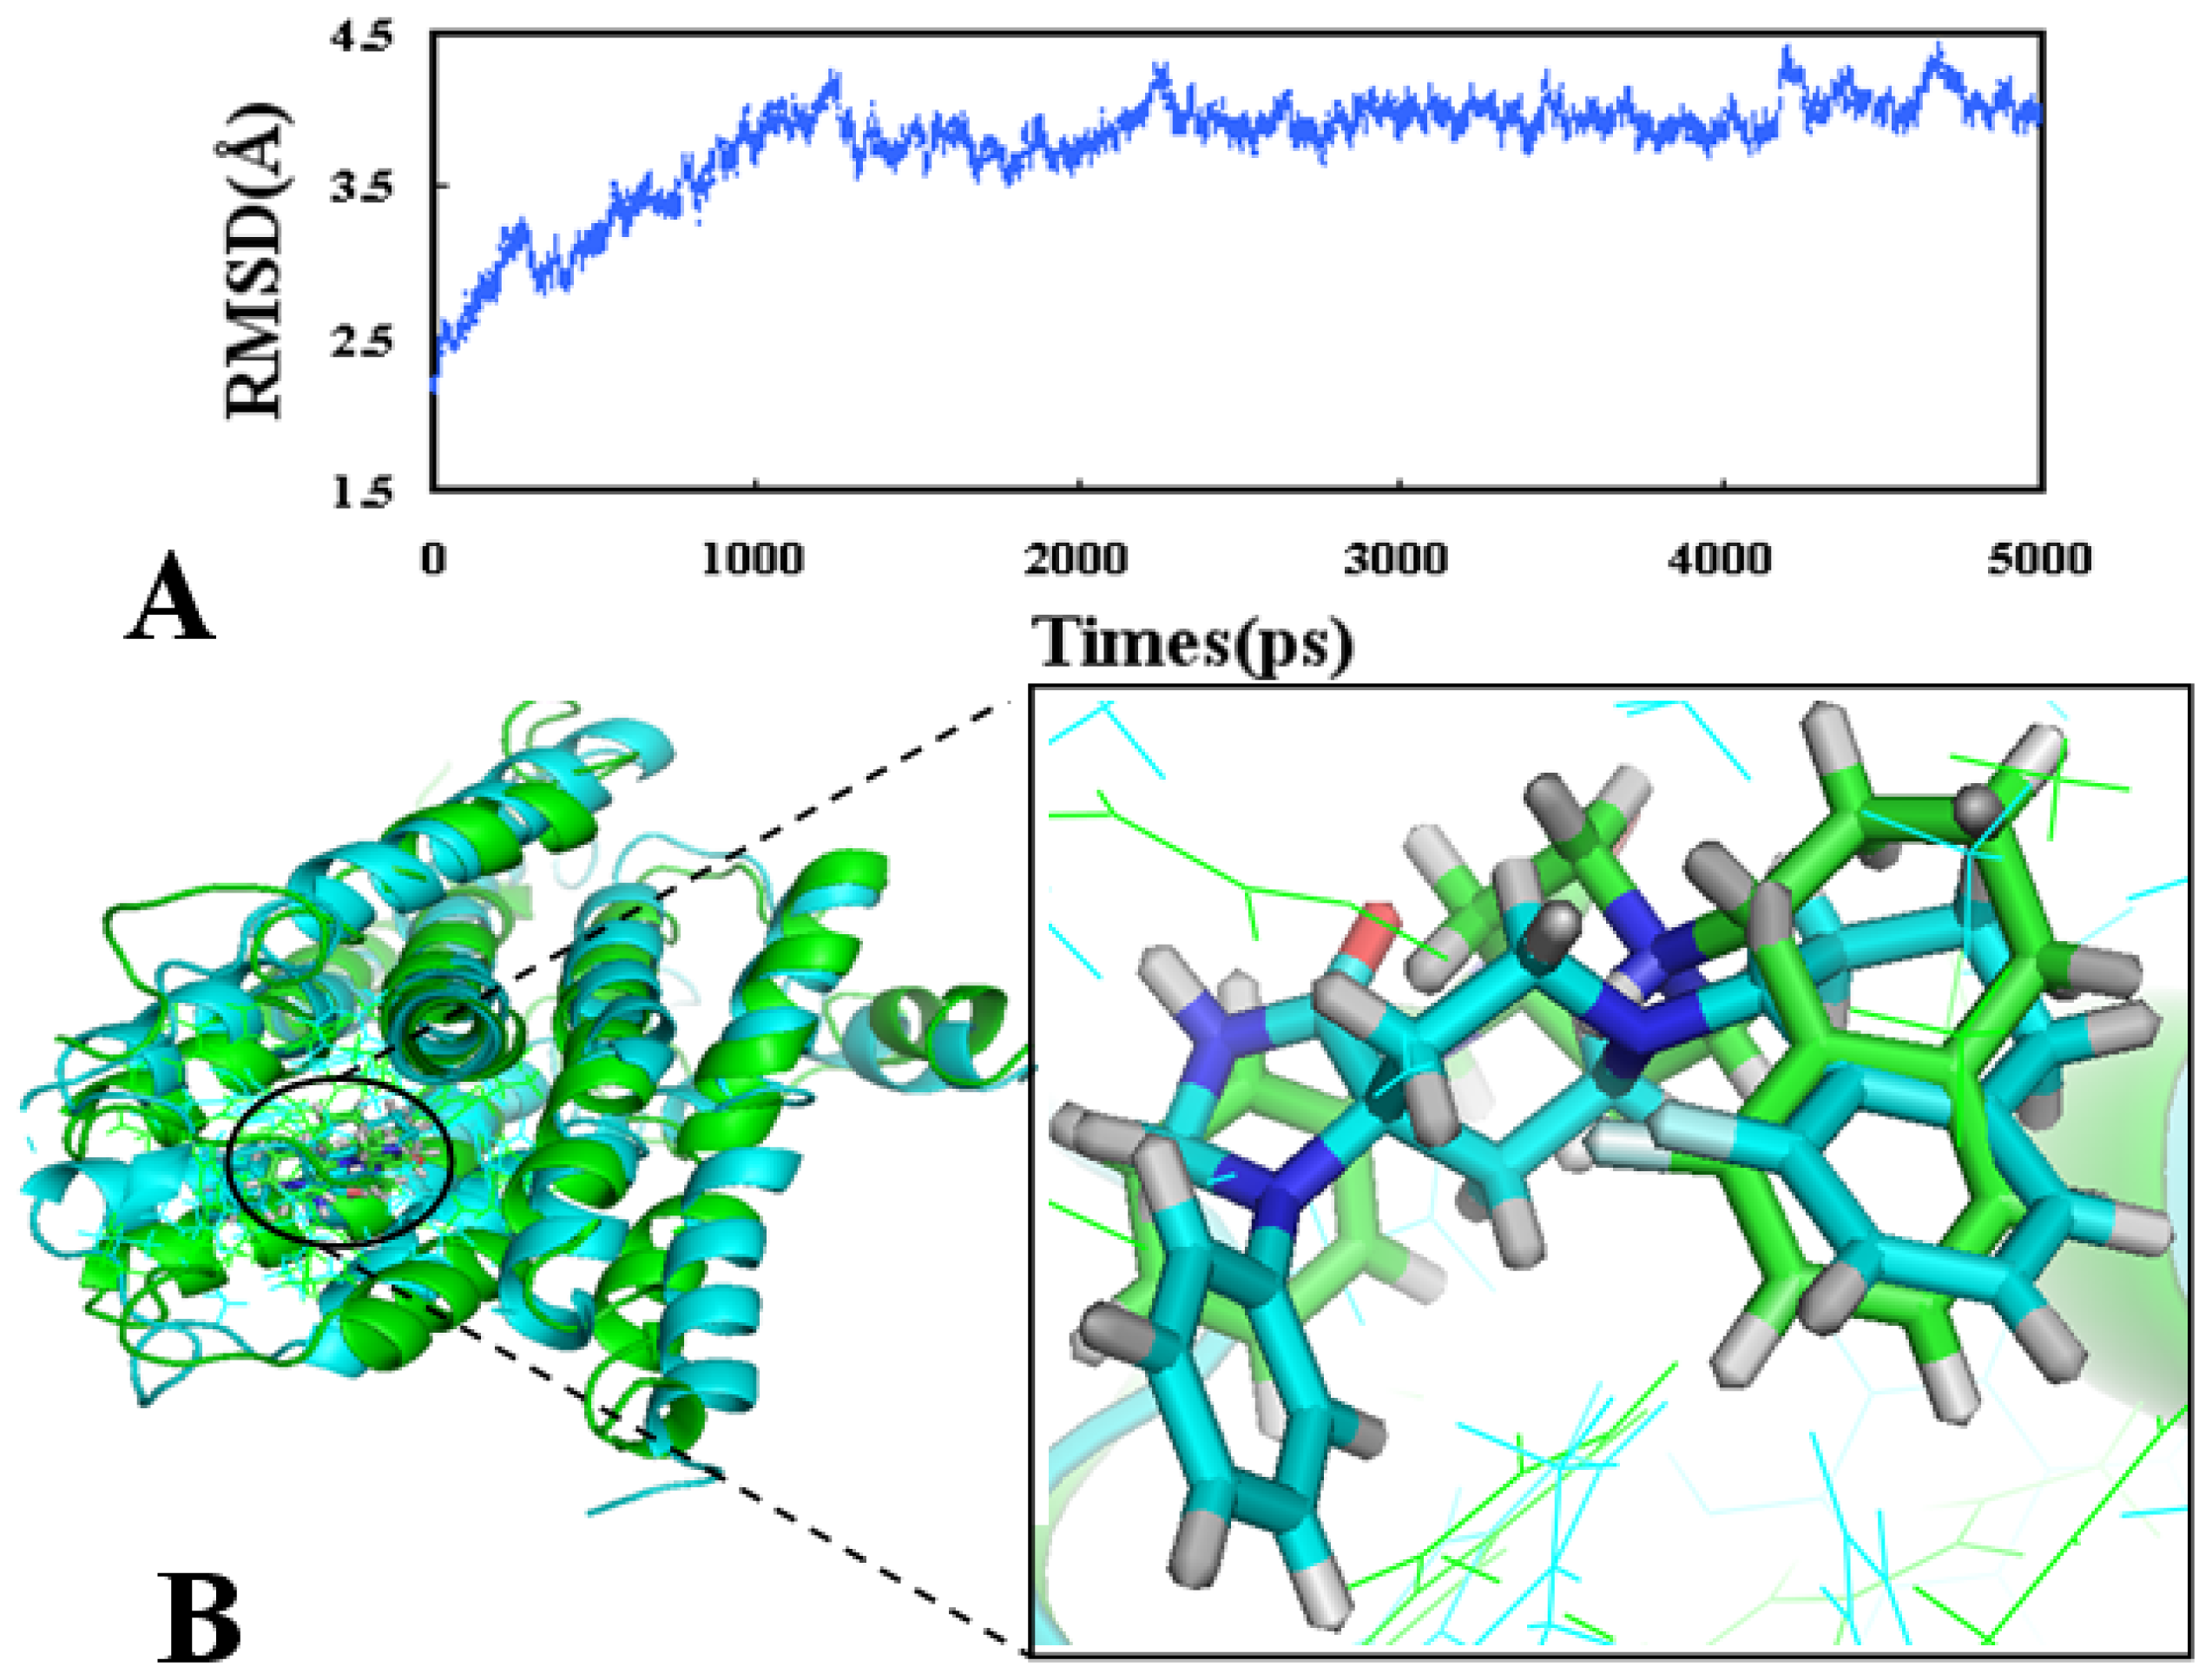
2.4. Molecular Dynamics Simulations
3. Discussion
4. Materials and Methods
4.1. Database and Biological Activity
4.2. Conformational Sampling and Alignment
4.3. CoMFA and CoMSIA Field Calculation
4.4. 3D-QSAR Model Generation
4.5. Molecular Docking
4.6. Molecular Dynamics Simulations
5. Conclusion
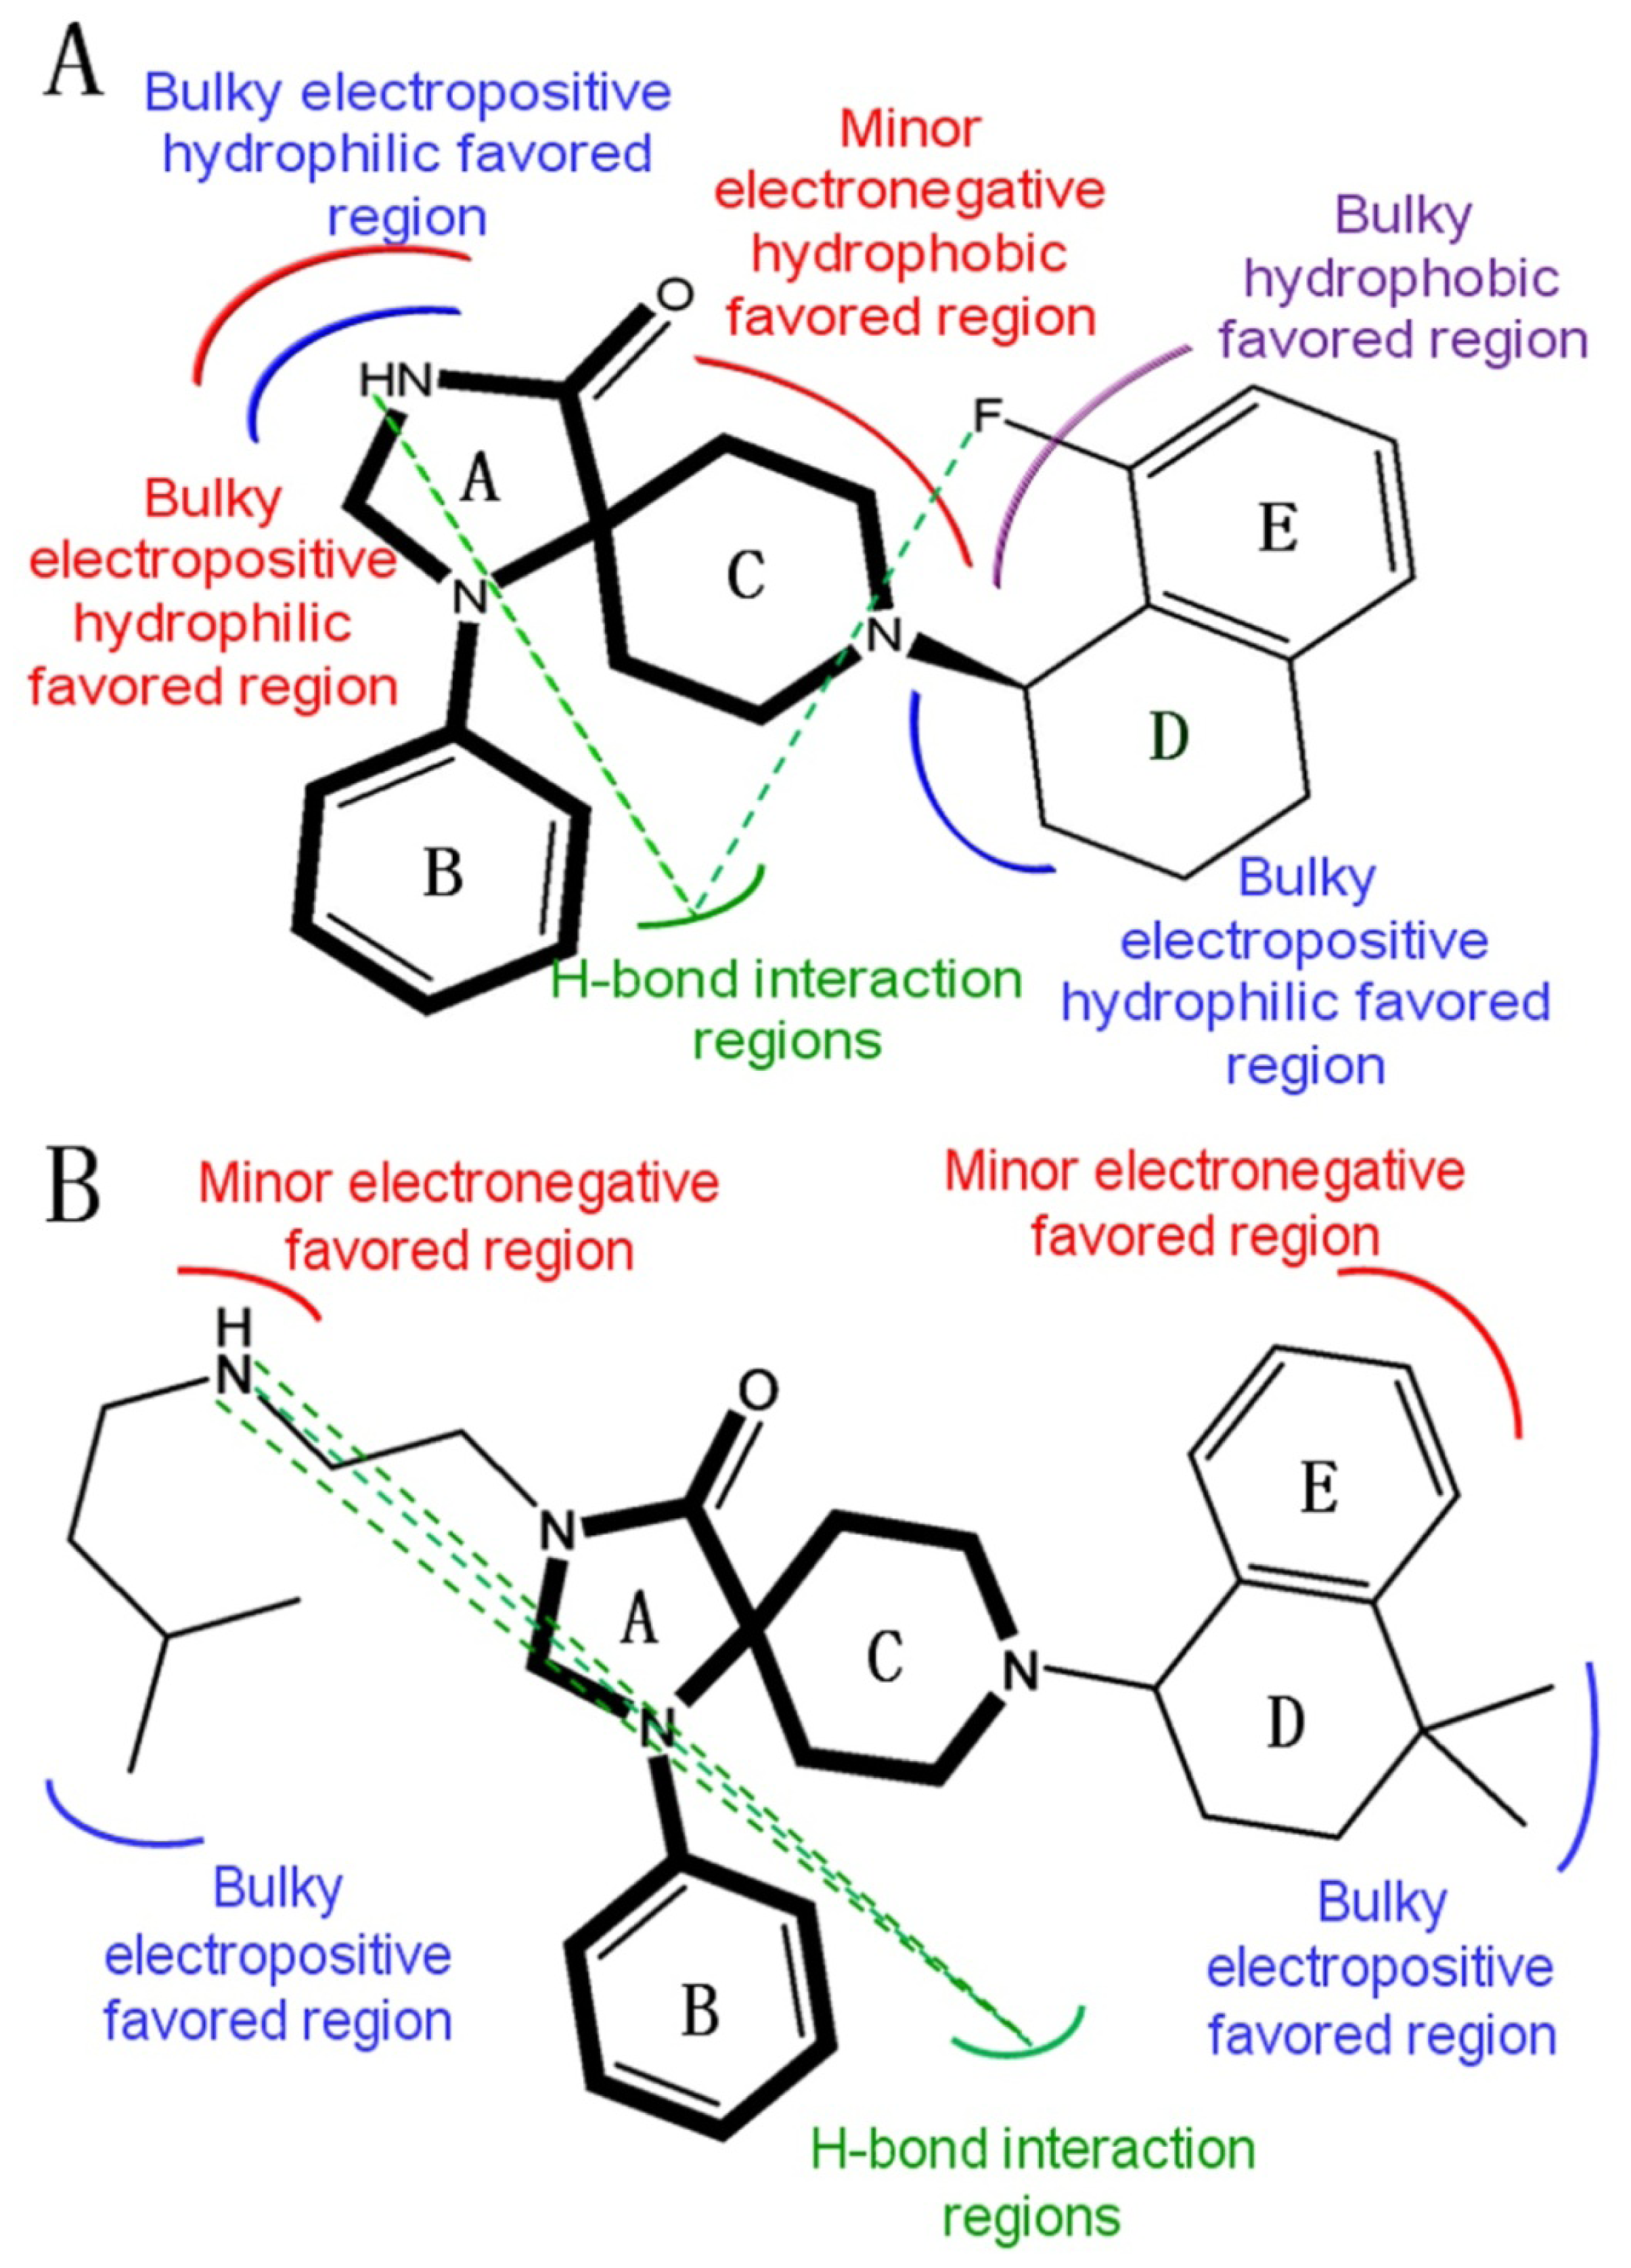
- Substituents with bulky, electro-sensitive, hydrophilic, H-bond donor at position-1, bulky hydrophilic substituents at positions-11 and -12 and minor hydrophobic substituents at positions-6, -7 and -9 of ring C may be helpful to enhance potency. Electronegative H-bond acceptor at position-5, bulky hydrophobic substituents at position-19, bulky substituents at position-20, electropositive substituents at positions-4 and -11, electronegative substituents at position-8 and hydrophilic substituents at position-17 and ring B can all enhance the activity.
- The binding site of N-substituted spiropiperidine-based NOP agonists is mostly a large hydrophobic pocket formed by Trp116, Trp211, Trp276, Val126, Phe220, Phe106, Ile127 and Pro207 residues. The H-bonds formed by polar residues Thr103 and Tyr309 can be identified as potential factors greatly impacting the binding affinity of compound 32.
Supplementary Material
ijms-12-08961-s001.pdfAcknowledgements
- Supporting Information AvailableSupplementary material is available on the publisher’s website along with the published article.
References
- Meunier, J.C.; Mollereau, C.; Toll, L.; Suaudeau, C.; Moisand, C.; Alvinerie, P.; Butour, J.L.; Guillemot, J.C.; Ferrara, P.; Monsarrat, B.; et al. Isolation and structure of the endogenous agonist of opioid receptor-like ORL1 receptor. Nature 1995, 377, 532–535. [Google Scholar]
- Reinscheid, R.K.; Nothacker, H.P.; Bourson, A.; Ardati, A.; Henningsen, R.A.; Bunzow, J.R.; Grandy, D.K.; Langen, H.; Monsma, F.R.; Civelli, O., Jr. Orphanin FQ: A neuropeptide that activates an opioid-like G-protein coupled receptor. Science 1995, 270, 792–794. [Google Scholar]
- Nothacker, H.P.; Reinscheid, R.K.; Mansour, A.; Henninqsen, R.A.; Ardati, A.; Monsma, F.J., Jr; Watson, S.J.; Civelli, O. Primary structure and tissue distribution of the orphanin FQ precursor. Proc. Natl. Acad. Sci. USA 1996, 93, 8677–8682. [Google Scholar]
- Reinscheid, R.K.; Hiqelin, J.; Henniqsen, R.A.; Monsma, F.J., Jr; Civelli, O. Structures that delineate orphanin FQ and dynorphin a pharmacological selectivities. J. Biol. Chem 1998, 273, 1490–1495. [Google Scholar]
- Mollereau, C.; Parmentier, M.; Mailleux, P.; Butour, J.L.; Moisand, C.; Chalon, P.; Caput, D.; Vassart, G.; Meunier, J.C. ORL1, a novel member of the opioid receptor family: Cloning, functional expression and localization. FEBS Lett 1994, 341, 33–38. [Google Scholar]
- Mollereau, C.; Mouledous, L. Tissue distribution of the opioid receptor-like (ORL1) Receptor. Peptides 2000, 21, 907–917. [Google Scholar]
- Andoh, T.; Yaqeta, Y.; Takeshima, H.; Kuraishi, Y. Intradermal nociceptin elicits itch-associated responses through leukotriene B(4) in mice. J. Invest. Dermatol 2004, 123, 196–201. [Google Scholar]
- Granata, F.; Potenza, R.L.; Fiori, A.; Strom, R.; Caronti, B.; Molinari, P.; Donsante, S.; Citro, G.; Iacovelli, L.; de Blasi, A.; et al. Expression of OP4 (ORL1, NOP1) receptors in vascular endothelium. Eur. J. Pharmacol 2003, 482, 17–23. [Google Scholar]
- Lambert, D.G. The Nociceptin/Orphanin FQ Receptor: A target with broad therapeutic potential. Nat. Rev. Drug Discov 2008, 7, 694–710. [Google Scholar]
- Mustazza, C.; Bastanzio, G. Development of nociceptin receptor (NOP) agonists and antagonists. Med. Res. Rev 2011, 31, 605–648. [Google Scholar]
- Okada, K.; Sujaku, T.; Chuman, Y.; Nakashima, R.; Nose, T.; Costa, T.; Yamada, Y.; Yokoyama, M.; Nagahisa, A.; Shimohigashi, Y. Highly potent nociceptin analog containing the Arg-Lys triple repeat. Biochem. Biophys. Res. Commun 2000, 278, 493–498. [Google Scholar]
- Guerrini, R.; Calo, G.; Bigoni, R.; Rizzi, D.; Rizzi, A.; Zucchini, M.; Varani, K.; Hashiba, E.; Lambert, D.G.; Toth, G.; et al. Structure-activity studies of the Phe(4) residue of nociceptin (1-13)-NH(2): Identification of highly potent agonists of the nociceptin/orphanin FQ receptor. J. Med. Chem 2001, 44, 3956–3964. [Google Scholar]
- Ambo, A.; Hamazaki, N.; Yamada, Y.; Nakata, E.; Sasaki, Y. Structure-activity studies on nociceptin analogues: ORL1 receptor binding and biological activity of cyclic disulfide-containing analogues of nociceptin peptides. J. Med. Chem 2001, 44, 4015–4018. [Google Scholar]
- Zhang, C.; Miller, W.; Valenzano, K.J.; Kyle, D.J. Nove1, potent ORL1 receptor agonist peptides containing alpha-helix-promoting conformational constraints. J. Med. Chem 2002, 45, 5280–5286. [Google Scholar]
- Calo, G.; Guerrini, R.; Bigoni, R. Structure, activity study of the nociceptin (1-13)-NH2 N-terminal tetrapeptide and discovery of a nociceptin receptor antagonist. J. Med. Chem 1998, 41, 3360–3366. [Google Scholar]
- Guerrini, R.; Rizzi, D.; Zucchini, M.; Tomatis, R.; Regoli, D.; Calo, G.; Salvadori, S. Nociceptin/orphanin FQ (1~13)NH, analogues identified in the Phe1-Gly2 peptide bond. Bioorg. Med. Chem. Lett 2003, 13, 365–368. [Google Scholar]
- Dooley, C.T.; Spaeth, C.G.; Berzetei-Gurske, I.P.; Craymer, K.; Adapa, I.D.; Brandt, S.R.; Houghten, R.A.; Toll, L. Binding in vitro activities of peptides with hiish afinity for the nociceptin/orphanin FQ receptor, ORL1. J. Pharmacol. Exp. Ther. 1997, 283, 735–741. [Google Scholar]
- Larsen, B.D.; Novel, Peptide. Conjugates. International Patent Publication Number WO 01/98324 13 June 2001. [Google Scholar]
- Wichmann, J.; Adam, G.; Röver, S.; Henniq, M.; Scalone, M.; Cesura, A.M.; Daulzenberq, F.M.; Jenck, F. Synthesis of (1S,3aS)-8-(2,3,3a,4,5,6-hexahydro-1H-phenalen-1-yl)-1-phenyl-1,3,8- triaza-spiro[4.5]decan-4-one, a potent and selective orphanin FQ (OFQ) receptor agonist with anxiolytic-like properties. Eur. J. Med. Chem 2000, 35, 839–851. [Google Scholar]
- Röver, S.; Adam, G.; Cesura, A.M.; Galley, G.; Jenck, F.; Monsma, F.J., Jr; Wichmann, J.; Dautzenberg, F.M. High-affinity, non-peptide agonists for the ORL1 (orphanin FQ/nociceptin) receptor. J. Med. Chem. 2000, 43, 1329–1338. [Google Scholar]
- Jenck, F.; Moreau, J.L.; Martin, J.R.; Kilpatrick, G.; Reinscheid, R.; Monsma, F.J.; Nothacker, H.P.; Civelli, O. Orphanin FQ acts as anxiolytic to attenuate behavioral responses to stress. Proc. Natl. Acad. Sci. USA 1997, 94, 14854–14858. [Google Scholar]
- Manabe, T.; Noda, Y.; Mamiya, T.; Katagiri, H.; Houtani, T.; Nishi, M.; Noda, T.; Takahashi, T.; Sugimoto, T.; Nabeshima, T.; et al. Facilitation of long-term potentiation and memory in mice lacking nociceptin receptors. Nature 1998, 394, 577–581. [Google Scholar]
- Griebel, G.; Perrault, G.; Sanger, D.J. Orphanin FQ, a novel neuropeptide with anti-stress-like activity. Brain Res 1999, 836, 221–224. [Google Scholar]
- Jenck, F.; Wichmann, J.; Dautzenberg, F.M.; Moreau, J.L.; Ouagazzal, A.; Martin, J.; Lundstrom, K.; Cesura, A.; Poli, S.; Roever, S.; et al. A novel synthetic agonist at the orphanin FQ/nociceptin receptor ORL1: Anxiolytic profile in the rat. Proc. Natl. Acad. Sci. USA 2000, 97, 4938–4943. [Google Scholar]
- Ciccocioppo, R.; Biondini, M; Antonelli, L.; Wichmann, J.; Jenck, F.; Massi, M. Reversal of stress-and CRF-induced anorexia in rats by the synthetic nociceptin/orphanin FQ receptor agonist, Ro 64-6198. Psychopharmacology 2002, 161, 113–119. [Google Scholar]
- Gavioli, E.C.; Rae, G.A.; Calo, G.; Guerrini, R.; de Lima, T.C. Central injections of nocistatin or its c-terminal hexapeptide exert anxiogenic-like effect on behaviour of mice in the plus-maze test. Br. J. Pharmacol 2002, 136, 764–772. [Google Scholar]
- Higgins, G.A.; Kew, J.N.; Richards, J.G.; Takeshima, H.; Jenck, F.; Adam, G.; Wichmann, J.; Kemp, J.A.; Grottick, A.J. A combined harmacological and genetic approach to investigate the role of orphanin FQ in learning and memory. Eur. J. Neurosci 2002, 15, 911–922. [Google Scholar]
- Kamei, J.; Matsunawa, Y.; Miyata, S.; Tanaka, S.; Saitoh, A. Effects of nociceptin on the exploratory behavior of mice in the hole-board test. Eur. J. Pharmacol 2004, 489, 77–87. [Google Scholar]
- Caldwell, J.P.; Matasi, J.J.; Zhang, H.; Fawzi, A.; Tulshian, D.B. Synthesis and structure-activity relationships of N-substituted spiropiperidines as nociceptin receptor ligands. Bioorg. Med. Chem. Lett 2007, 17, 2281–2284. [Google Scholar]
- Caldwell, J.P.; Matasi, J.J.; Fernandez, X.; McLeod, R.L.; Zhang, H.; Fawzi, A.; Tulshian, D.B. Synthesis and structure-activity relationships of N-substituted spiropiperidines as nociceptin receptor ligands: Part 2. Bioorg. Med. Chem. Lett 2009, 19, 1164–1167. [Google Scholar]
- Cramer, R.D.; Patterson, D.E.; Bunce, J.D. Comparative molecular field analysis (CoMFA). 1. Effect of shape on binding of steroids to carrier proteins. J. Am. Chem. Soc 1988, 110, 5959–5967. [Google Scholar]
- Wang, Y.; Li, Y.; Yang, S.; Yang, L. Classification of substrates and inhibitors of P-glycoprotein using unsupervised machine learning approach. J. Chem. Inf. Model 2005, 45, 750–757. [Google Scholar]
- Wang, G.; Li, Y.; Liu, X.; Wang, Y. Understanding the aquatic toxicity of pesticide: Structure-activity relationship and molecular descriptors to distinguish the ratings of toxicity. QSAR Comb. Sci 2009, 28, 1418–1431. [Google Scholar]
- Xu, X.; Yang, W.; Wang, X.; Li, Y.; Wang, Y.; Ai, C. Dynamic communication between androgen and coactivator: Mutually induced conformational perturbations in androgen receptor ligand-binding domain. Proteins Struct. Funct. Bioinf 2011, 79, 1154–1171. [Google Scholar]
- Wang, Y.; Li, Y.; Ma, Z.; Yang, W.; Ai, C. Mechanism of microRNA-target interaction: Molecular dynamics simulations and thermodynamics analysis. PLoS Comput. Biol 2010, 6. [Google Scholar] [CrossRef]
- Wang, X.; Yang, W.; Xu, X.; Zhang, H.; Li, Y.; Wang, Y. Studies of benzothiadiazine derivatives as hepatitis C virus NS5B polymerase inhibitors using 3D-QSAR, molecular docking and molecular dynamics. Curr. Med. Chem 2010, 17, 2788–2803. [Google Scholar]
- Wang, Y.H.; Li, Y.; Yang, S.L.; Yang, L. An in silico approach for screening flavonoids as P-glycoprotein inhibitors based on a bayesian-regularized neural network. J. Comput. Aided Mol. Des 2005, 19, 137–147. [Google Scholar]
- Klebe, G.; Abraham, U.; Mietzner, T. Molecular similarity indices in a comparative analysis (CoMSIA) of drug molecules to correlate and predict their biological activity. J. Med. Chem 1994, 37, 4130–4146. [Google Scholar]
- AbdulHameed, M.D.; Hamza, A.; Liu, J.; Zhan, C.G. Combined 3D-QSAR modeling and molecular docking study on indolinone derivatives as inhibitors of 3-phosphoinositide-dependent protein kinase-1. J. Chem. Inf. Model 2008, 48, 1760–1772. [Google Scholar]
- Böhm, M.; Stürzebecher, J.; Klebe, G. Three-dimensional quantitative structure-activity relationship analyses using comparative molecular field analysis and comparative molecular similarity indices analysis to elucidate selectivity differences of inhibitors binding to trypsin, thrombin, and factor Xa. J. Med. Chem 1999, 42, 458–477. [Google Scholar]
- Bringmann, G.; Rummey, C. 3D QSAR Investigations on antimalarial naphthylisoquinoline alkaloids by comparative molecular similarity indices analysis (CoMSIA), based on different alignment approaches. J. Chem. Inf. Comput. Sci 2003, 43, 304–316. [Google Scholar]
- da Silva, G.M.S.; Sant’Anna, C.M.; Barreiro, E.J. A Novel 3D-QSAR comparative molecular field analysis (CoMFA) model of imidazole and quinazolinone functionalized p38 MAP kinase inhibitors. Bioorg. Med. Chem 2004, 12, 3159–3166. [Google Scholar]
- AbdulHameed, M.D.; Hamza, A; Liu, J.; Zhan, C.G. Combined 3D-QSAR modeling and molecular docking study on indolinone derivatives as inhibitors of 3-phosphoinositide-dependent protein kinase-1. J. Chem. Inf. Model. 2008, 48, 1760–1772. [Google Scholar]
- Wang, Q.; Mach, R.H.; Reichert, D.E. Docking and 3D-QSAR studies on isatin sulfonamide analogues as caspase-3 inhibitors. J. Chem. Inf. Model 2009, 49, 1963–1973. [Google Scholar]
- Golbraikh, A.; Tropsha, A. Beware of q2! J. Mol. Graph. Model 2002, 20, 269–276. [Google Scholar]
- Kitchen, D.B.; Decornez, H.; Furr, J.R.; Bajorath, J. Docking and scoring in virtual screening for drug discovery: Methods and applications. Nat. Rev. Drug Discov 2004, 3, 935–949. [Google Scholar]
- Luo, H.B.; Liu, M.; He, L.; Hu, X.; Liu, P. 3D-QSAR, homology modeling, and molecular docking studies on spiropiperidines analogues as agonists of nociceptin/orphanin FQ receptor. Bioorg. Med. Chem. Lett 2010, 20, 7004–7010. [Google Scholar]
- Hu, R.J.; Barbault, F.; Maurel, F.; Delamar, M.; Zhang, R.S. Receptor- and ligand-based 3D-QSAR studies for a series of non-nucleoside HIV-1 rverse transcriptase inhibitors. Bioorg. Med. Chem 2009, 17, 2400–2409. [Google Scholar]
- Hu, R.J.; Barbault, F.; Maurel, F.; Delamar, M.; Zhang, R.S. Molecular dynamics simulations of 2-amino-6-arylsulphonylbenzonitriles analogues as HIV inhibitors: Interaction modes and binding free energies. Chem. Biol. Drug. Des 2010, 76, 518–526. [Google Scholar]
- SYBYL, version 6.9; Tripos Inc: St. Louis, MO, USA; p. 1699.
- Gasteiger, J.; Marsili, M. Iterative partial equalization of orbital electronegativity—A rapid access to atomic charges. Tetrahedron 1980, 36, 3219–3228. [Google Scholar]
- Clark, M.; Cramer, R.D.; van Opdenbosch, N. Validation of the general purpose tripos 5.2 force field. J. Comput. Chem 1989, 10, 982–1012. [Google Scholar]
- Jain, A.N. Surflex: Fully automatic flexible molecular docking using a molecular similarity-based search engine. J. Med. Chem 2003, 46, 499–511. [Google Scholar]
- SYBYL-X, version 1.1; Tripos Inc: St. Louis, MO, USA, 2009.
- Welch, W.; Ruppert, J.; Jain, A.N. Hammerhead: Fast, fully automated docking of flexible ligands to protein binding sites. Chem. Biol 1996, 3, 449–462. [Google Scholar]
- Case, D.A.; Darden, T.A.; Cheatham, I.T.E.; Simmerling, C.L.; Wang, J.; Duke, R.E.; Luo, R.; Merz, K.M.; Pearlman, D.A.; Crowley, M.; et al. AMBER 10; University of California: San Francisco, CA, USA, 2008. [Google Scholar]
- Wang, J.; Wolf, R.M.; Caldwell, J.W.; Kollman, P.A.; Case, D.A. Development and testing of a general amber force field. J. Comput. Chem 2004, 25, 1157–1174. [Google Scholar]
- Duan, Y.; Wu, C.; Chowdhury, S.; Lee, M.C.; Xiong, G.; Zhang, W.; Yang, R.; Cieplak, P.; Luo, R.; Lee, T.; et al. A point-charge force field for molecular mechanics simulations of proteins based on condensed-phase quantum mechanical calculations. J. Comput. Chem 2003, 24, 1999–2012. [Google Scholar]
- Jorgensen, W.L.; Chandrasekhar, J.; Madura, J.D.; Klein, M.L. Comparison of simple potential functions for simulating liquid water. J. Chem. Phys 1983, 79, 926–935. [Google Scholar]
- Ryckaert, J.P.; Ciccotti, G.; Berendsen, H.J.C. Numerical integration of the cartesian equations of motion of a system with constraints: Molecular dynamics of N-alkanes. J. Comput. Phys 1977, 23, 327–341. [Google Scholar]
- Essmann, U.; Perera, L.; Berkowitz, M.L.; Darden, T. A smooth particle mesh Ewald method. J. Chem. Phys 1995, 103, 8577–9593. [Google Scholar]


| PLS Statistics | Ligand-Based Model | Receptor-Based Model | ||
|---|---|---|---|---|
| CoMFA | CoMSIA | CoMFA | CoMSIA | |
| Q2 | 0.229 | 0.503 | 0.047 | 0.111 |
| R2ncv | 0.621 | 0.921 | 0.196 | 0.527 |
| SEE | 0.507 | 0.237 | 0.728 | 0.559 |
| F | 41.472 | 120.623 | 19.064 | 86.880 |
| R2pred | 0.712 | 0.788 | 0.227 | 0.385 |
| SEP | 0.723 | 0.596 | 0.793 | 0.766 |
| PLS components | 3 | 7 | 1 | 1 |
| Contribution | ||||
| Steric | 0.528 | 0.122 | 0.435 | 0.172 |
| Electrostatic | 0.472 | 0.355 | 0.565 | 0.242 |
| Hydrophobic | 0.258 | 0.249 | ||
| H-bond donor | 0.266 | 0.337 | ||
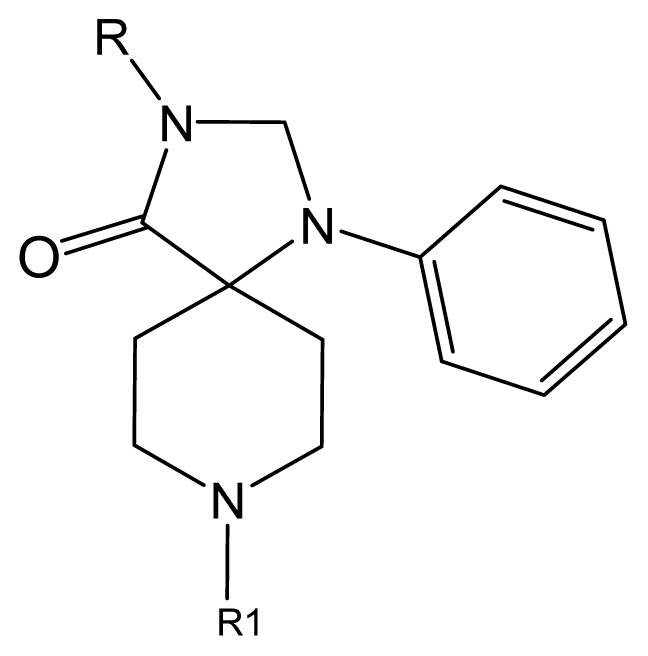
 | |||||||
|---|---|---|---|---|---|---|---|
| No. | R | R1 | Ki | No. | R | R1 | Ki |
| 5 | H |  | 824.0 | 44 # | Bu |  | 57 |
| 6 | H | 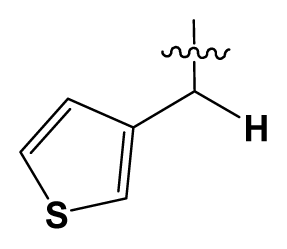 | 14.0 | 47 | c-BuCH2- |  | 53 |
| 11 | H |  | 2.4 | 54 # | HO(CH2)2- |  | 18.5 |
| 16 | H |  | 225.0 | 69 | 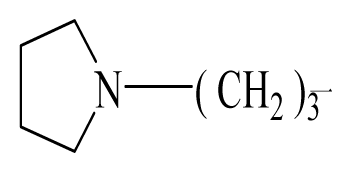 |  | 3.2 |
| 19 | H |  | 9.0 | 75 | c-BuNH(CH2)2- |  | 0.5 |
| 26 | H |  | 250.0 | 79 | Et2N(CH2)2- |  | 1.0 |
| 30 | H |  | 14.5 | 87 | c-Pentyl NH(CH2)2- |  | 0.9 |
| 32 | H |  | 0.3 | 90 # | CH2=CHCH2NH(CH2)2- |  | 0.9 |
| 36 # | H |  | 10.8 | 97 | i-AmylNH(CH2)2- |  | 0.4 |
| 39 # | H | 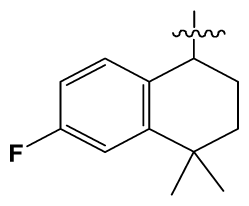 | 8.4 | 103 | BuNH(CH2)2- |  | 12.2 |
© 2011 by the authors; licensee MDPI, Basel, Switzerland. This article is an open-access article distributed under the terms and conditions of the Creative Commons Attribution license (http://creativecommons.org/licenses/by/3.0/).
Share and Cite
Bao, P.; Zhang, X.; Ren, H.; Li, Y.; Mu, Z.; Zhang, S.; Li, G.; Yang, L. Structural Requirements of N-Substituted Spiropiperidine Analogues as Agonists of Nociceptin/Orphanin FQ Receptor . Int. J. Mol. Sci. 2011, 12, 8961-8981. https://doi.org/10.3390/ijms12128961
Bao P, Zhang X, Ren H, Li Y, Mu Z, Zhang S, Li G, Yang L. Structural Requirements of N-Substituted Spiropiperidine Analogues as Agonists of Nociceptin/Orphanin FQ Receptor . International Journal of Molecular Sciences. 2011; 12(12):8961-8981. https://doi.org/10.3390/ijms12128961
Chicago/Turabian StyleBao, Pingping, Xiaole Zhang, Hong Ren, Yan Li, Zulin Mu, Shuwei Zhang, Guohui Li, and Ling Yang. 2011. " Structural Requirements of N-Substituted Spiropiperidine Analogues as Agonists of Nociceptin/Orphanin FQ Receptor " International Journal of Molecular Sciences 12, no. 12: 8961-8981. https://doi.org/10.3390/ijms12128961